Embed Size (px)
Citation preview

DI
SC
US
SI
ON
P
AP
ER
S
ER
IE
S
Forschungsinstitut zur Zukunft der ArbeitInstitute for the Study of Labor
Money for Nothing?Universal Child Care and Maternal Employment
IZA DP No. 4504
October 2009
Tarjei HavnesMagne Mogstad
Money for Nothing? Universal Child
Care and Maternal Employment
Tarjei Havnes University of Oslo
Magne Mogstad
Statistics Norway and IZA
Discussion Paper No. 4504 October 2009
IZA
P.O. Box 7240 53072 Bonn
Germany
Phone: +49-228-3894-0 Fax: +49-228-3894-180
E-mail: [email protected]
Any opinions expressed here are those of the author(s) and not those of IZA. Research published in this series may include views on policy, but the institute itself takes no institutional policy positions. The Institute for the Study of Labor (IZA) in Bonn is a local and virtual international research center and a place of communication between science, politics and business. IZA is an independent nonprofit organization supported by Deutsche Post Foundation. The center is associated with the University of Bonn and offers a stimulating research environment through its international network, workshops and conferences, data service, project support, research visits and doctoral program. IZA engages in (i) original and internationally competitive research in all fields of labor economics, (ii) development of policy concepts, and (iii) dissemination of research results and concepts to the interested public. IZA Discussion Papers often represent preliminary work and are circulated to encourage discussion. Citation of such a paper should account for its provisional character. A revised version may be available directly from the author.

IZA Discussion Paper No. 4504 October 2009
ABSTRACT
Money for Nothing? Universal Child Care and Maternal Employment
The strong correlation between child care and maternal employment rates has led previous research to conclude that affordable and readily available child care is a driving force both of cross-country differences in maternal employment and of its rapid growth over the last decades. We analyze the introduction of subsidized, universally accessible child care in Norway. Our precise and robust difference-in-differences estimates reveal that there is little, if any, causal effect of child care on maternal employment, despite a strong correlation. Instead of increasing mothers’ labor supply, the new subsidized child care mostly crowds out informal child care arrangements, suggesting a significant net cost of the child care subsidies. JEL Classification: J13, H40, J21 Keywords: universal child care, female labor force participation Corresponding author: Magne Mogstad Research Dept. of Statistics Norway Pb 8131 Dep 0033 Oslo Norway E-mail: [email protected]
1. Introduction
There is a heated debate in the US, Canada and many European countries about a move towardssubsidized, universally accessible child care and pre-school, as offered in the Scandinavian countries. Forexample, the European Union’s Presidency formulated in 2002 as a policy goal “to provide childcare by 2010to at least 90% of children between 3 years old and the mandatory school age and at least 33% of childrenunder 3 years of age” (EU, 2002, p. 13). Further, Quebec recently introduced highly subsidized child care,and other Canadian provinces are considering similar policies. In the US, the so-called ’Zero to Five Plan’of US President Obama aims at making states move towards voluntary universal preschool.
Advocates of such policies have argued that good access to affordable child care is critical to facilitatefemale labor force participation and lower welfare dependency. Indeed, generous child care policies areregularly proposed as a key determinant both of cross country differences in maternal employment (see e.g.Jaumotte, 2003; Del Boca, 2002; Aaberge et al., 2005), and of its dramatic growth over the last decades(see e.g. Attanasio et al., 2008). However, it is possible that publicly provided and/or subsidized child caremostly crowds out other forms of care, yielding little or no increase in total child care use or labor supply. Ifso, public funding of child care may require a considerable increase in taxes, at a cost to economic efficiency.For example, Rosen (1996) argues that the efficiency distortion of generous Swedish child care policies maybe as large as half of total expenditure on child care. It should, therefore, be of significant importanceto provide empirical evidence on how universal child care systems have affected maternal employment incountries where they have already been implemented.
In this paper, we analyze the introduction of subsidized, universally accessible child care in Norway inthe late 1970s, addressing the impact on the labor force participation of married mothers.1 Interestingly,the rates of maternal employment and child care coverage were then quite similar to the situation today inmany other developed countries. As Norway has since practiced one of the most expansive child care policies,and achieved one of the highest maternal employment rates, it is therefore not surprising that researchersand policymakers alike have their eyes on the Norwegian child care system and its apparent success.2 Ourfindings suggest, however, that the introduction of universal child care had little, if any, impact on maternalemployment. Instead of increasing mothers’ labor supply, the new subsidized child care mostly crowds outinformal care arrangements, implying a significant net cost of the child care subsidies.
To elicit a causal relationship between child care and maternal employment, we use a difference-in-differences (DD) approach, exploiting a child care reform from late 1975. The reform assigned responsibilityfor child care to local governments and increased federal subsidies, which generated large variation in childcare coverage for children 3–6 years old, both across time and between municipalities.3As described in detailbelow, formal child care in both the pre-reform period and during the expansion was severely rationed,with informal care arrangements (e.g. relatives, friends, neighbors, and unlicensed care givers) servicing theexcess demand. The reform constituted a shock to the supply of formal child care. The supply shocks were,in general, strongest in municipalities where child care was most rationed before the reform. This is likelyto be partly because of higher federal subsidy rates for municipalities with low child care coverage prior tothe reform, but also due to stronger local political pressure for expansion of formal care in areas where childcare was severely rationed.
Our empirical strategy compares the growth in maternal employment rates in municipalities where childcare expanded a lot (i.e. the treatment group) and municipalities with little or no increase in child carecoverage (i.e. the comparison group). The effect of the child care expansion following the reform is givenby the difference in the employment rate of mothers with 3 to 6 year olds before and after the reform, in
1As in Baker et al. (2008), universal child care is taken to mean child care arrangements that are open for everyone; notthat all children were in fact using child care.
2In the early 70s, Norwegian mothers were about as likely to work as their sisters in other developed countries, like the US,the UK, and Germany, but pulled ahead during the late 70s and 80s. Today, Norwegian mothers are at the top of internationalrankings with an about ten percentage points higher employment rate than in these other countries. See for example Doladoet al. (2001).
3Throughout this paper, child care coverage rates refer to formal care, including publicly and privately provided child careinstitutions as well as licensed care givers, all eligible for subsidies from the government.
2
treatment municipalities relative to comparison municipalities. Our baseline result suggests that the childcare expansion caused an average of about 0.06 percentage points increase in maternal employment perpercentage point increase in the child care coverage rate. Interpreted in this way, our estimate suggests thatthe new subsidized formal child care was associated with a 94 percent crowding out of informal care.
Our finding of hardly any causal effect of the large child care expansion on maternal employment mayseem at odds with standard labor supply models, where mothers are assumed to replace hours of marketwork with hours of child care almost one-for-one (see e.g. Heckman, 1974). In these models, the price ofchild care is effectively a tax on the mother’s wage, and any policies driving down this price is expected tohave a strong and direct impact on mothers’ labor supply decision. To interpret our findings, we outline aparsimonious theoretical framework where mothers relying on informal care on the one hand create politicalpressure for expanding subsidized formal care, but on the other hand weaken the labor supply response tothe expansion. With child care subsidies contingent on a maximum price, the formal child care is rationedand the informal market services the demand surplus. In this case, new subsidized formal child care largelycrowds out informal care arrangements, with little effect on total care use and maternal labor supply.
Importantly, our empirical strategy pays close attention to the possibility that mothers with better accessto affordable child care are inherently different, and could be more inclined to work in any case. High-qualitypanel data from administrative registers covering the entire resident population and all licensed care giversin Norway, allow us to take a number of steps to address this concern for omitted variable bias. First of all,the DD approach removes fixed differences in maternal employment between the treatment and comparisonareas (for example due to differences in rationing of formal care prior to the reform), in addition to commontime-specific changes in employment coinciding with the reform (like a secular nationwide trend in maternalemployment). Our estimates are also robust to the inclusion and exclusion of a large set of controls capturingimportant characteristics of the mother and her spouse. In addition, the low level of aggregation in our data,spanning more than 400 municipalities covering about 4 million persons, allows us to account for geographicalheterogeneity by including municipality-specific fixed effects as well as controls for changes in the local labormarket conditions.4 The results are very similar when including these covariates.
To further increase our confidence in the empirical strategy, we run a battery of specification checks.In particular, we address the two identification assumptions underlying DD estimation from policy changescreating state–time variation, as emphasized by Besley and Case (2000). These assumptions are that thetime-effects must be identical between the treatment and comparison group, and that the composition ofthe groups must remain the same, implying a common time trend between the treatment and comparisongroup in the absence of the reform. The common trend assumption is supported by the fact that we findno effect of a placebo reform, pretending that the child care expansion took place in the pre-reform period.Nevertheless, our estimates could be biased if treatment municipalities initiated other policies (that we areunaware of) or experienced different economic fluctuations (that are not fully accounted for by the localemployment rates) at the same time as the child care reform. To pick up such time-varying effects specificto the treatment area, we add mothers with the youngest child just above the child care age (7 to 10 yearsold) as a second comparison group. It is heartening to find that this triple-difference approach barely movesthe estimated child care effects. Further, we take advantage of having access to panel data, restrictingthe sample to the same mothers before and after the reform. This removes biases due to unobservedcompositional changes over time within the treatment group. By including individual-specific fixed effects,we also eliminate biases owing to permanent unobserved differences between mothers residing in treatmentand comparison areas. These specification checks also confirm the picture of almost no effect of child careon maternal employment. We also take several steps to make sure that selective migration of mothers intotreatment and comparison areas is not driving our results. Finally, it should be noted that identificationfrom a common trend assumption depends only on what would have happened in the absence of the reform:If, for instance, child care expanded most in municipalities where it was most effective in promoting maternalemployment, then this would not pose a threat to identification of the treatment effect on the treated.
4Heckman et al. (1998) demonstrate the importance in policy evaluations of controlling for variation in the local labormarket conditions of those treated by the policy change and the comparison group.
3
Because of the often slow and uniform expansion of child care over time and space, many previous studieshave been confined to rely on limited variation in the data or a long time span to identify the effect of childcare on maternal employment. By contrast, our study compares municipalities that differ distinctly in termsof changes in child care coverage within a relatively narrow time frame. The shear strength of the variationin our data implies that any actual effect should be present in our estimates. That we find a very small butprecisely estimated effect of the child care expansion, therefore serves as strong evidence of a weak causallink from child care to maternal employment. Importantly, this conclusion holds true also when we estimatethe model separately by age, educational attainment, and number of children of the mother.
The paper proceeds by first discussing our study in relation to previous research on child care andmaternal labor force participation. Next, Section 3 describes the Norwegian child care system before andafter the child care reform, and sketch a parsimonious theoretical framework to interpret the policy changes.Section 4 outlines our empirical strategy, before Section 5 presents the data. Section 6 discusses our mainresults, and Section 7 reports results from the specification tests. Finally, Section 8 concludes with adiscussion of policy implications.
2. Child care and maternal employment
There exists a considerable literature on child care and maternal employment. Much attention has beenpaid to estimating structural parameters of utility functions, used to simulate both labor supply elasticitiesand the effects of various policy changes. Examples include Blau and Robins (1988), Connelly (1992),Michalopoulos et al. (1992), Kimmel (1998), and Kornstad and Thoresen (2007). In a survey of this strandof the literature, Blau and Currie (2006) report estimated elasticities of employment with respect to priceof child care ranging from 0 to values below −1.
Differences in data sources and sample composition do not appear to account for much of the variationin the estimates. Instead, Blau and Currie (2006) point out two fundamental problems for these studies:Child care access and prices are endogenous to the work decision of mothers, and the availability and costof informal care is unobserved. A large part of the discrepancy between the estimates is therefore likely tobe explained by differences in biases owing to ignoring the substitution between formal and informal childcare, misspecifications of functional forms for the employment and child care equations, and, in particular,violations of the exclusion restrictions (e.g. identification through variation in child care access and pricesthat are not exogenous to the employment decisions).
Some recent studies, to which our paper relates, sidestep these issues by applying quasi-experimentalapproaches, exploiting policy changes that create time and regional variation in the access to or price ofchild care. Baker et al. (2008) and Lefebvre and Merrigan (2008) study the implementation of a child caresubsidy in Quebec, whereas Lundin et al. (2008) study the introduction of a maximum price in Sweden.Schlosser (2005), Berlinski and Galiani (2007), and Cascio (2009) evaluate the impact of a free public childcare/pre school program in Israel, Argentina, and the United States, respectively. All these studies apply aDD approach, but their findings differ substantially.5
The results in our paper are consistent with those of Lundin et al. (2008) and Cascio (2009), in findinghardly any effect on the labor supply among married mothers of increased access to (or lower prices on)child care. In comparison, Schlosser (2005), Berlinski and Galiani (2007), Baker et al. (2008), and Lefebvreand Merrigan (2008) report significant positive effects, albeit at the lower range of estimates reported byBlau and Currie (2006). For instance, Baker et al. (2008) find that the introduction of generous child caresubsidies in Quebec led to a 14 percentage point increase in child care use, which was associated with a 7.7percentage point increase in employment; the difference between the rise in employment and the rise in child
5In a similar vein, Gelbach (2002) uses quarter of birth as an instrument for public kindergarten enrollment of five year oldsin the US. He finds that mothers with children in public kindergarten are more likely to be working. However, recent evidencesuggests that quarter of birth may not be a valid instrument, see Cascio (2006) for a discussion. Similarly, Simonsen (2009)exploits variation in child care prices across Danish municipalities to estimate the price sensitivity of maternal employmentfollowing maternity leave. She finds that the price effect is significantly negative, but smaller than what is found in much ofthe previous literature.
4
care utilization reflects a considerable crowding out of informal care arrangements by the new subsidizedchild care slots.
It is likely that at least part of the discrepancy in the estimates can be explained by differences inthe populations studied, the local labor market conditions, and the availability and cost of informal carearrangements. For example, it may be hard to generalize the results from Lundin et al. (2008) to othercountries, as the maternal employment rate was as high as 70 percent and child care utilization more than80 percent before the reform. In comparison, the Norwegian experience from the late 1970s can be of moreinterest from an international perspective, since many developed countries today have comparable child carecoverage and female labor force participation.6
Another reason for the differences in the estimates is that the empirical strategies differ in a number ofways. As pointed out by Cascio (2009), one potential problem with some of the studies reporting significantlabor supply effects is that the pre-reform trends of the treatment and comparison areas differ significantly.For example, as is evident from Lefebvre and Merrigan (2008), the trend in maternal employment is signifi-cantly different in Quebec compared to the rest of Canada prior to the reform. We may, therefore, suspectthat the estimated positive effect of this child care reform reflects differential time trends, rather than a truepolicy impact.
A further concern with the empirical strategies in previous studies is that shocks specific to the treatmentareas that coincide with the policy changes may bias the estimates. For instance, the treatment area couldhave initiated other policies or experienced different economic fluctuation at the same time as the childcare reform. As pointed out by Baker et al. (2008), there were several other changes in family and childbenefits in Quebec and the rest of Canada around the time of the child care reform, which may confoundtheir estimates.
Previous studies of child care and maternal employment may also suffer from applying their DD approachto repeated cross-sectional data. This may bias the results if there are unobserved compositional changesover time within the treatment group, or permanent unobserved differences between mothers residing intreatment and comparison areas. For example, Cascio (2009) identifies the child care effects from state-time variation based on decennial census data over a 40-year span, which makes unobserved compositionalchanges likely, especially since she lacks controls for important characteristics, like educational attainment,of the mother and her spouse.
As discussed below, our exceptionally rich data and the battery of specification checks we perform makeit possible to arrive at estimates that are potentially less biased than those previously presented using DDapproaches.
3. Background
In this section, we describe the Norwegian child care system before and after the 1975 reform, and sketcha parsimonious theoretical framework to interpret the policy changes.7
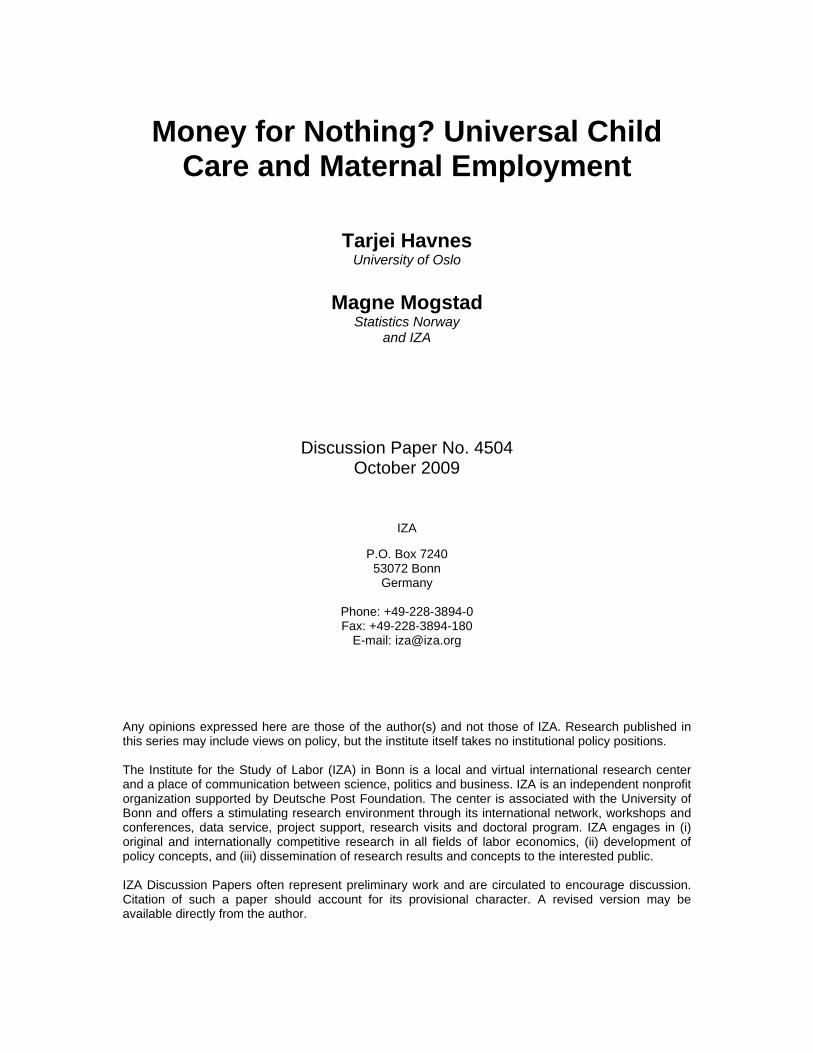
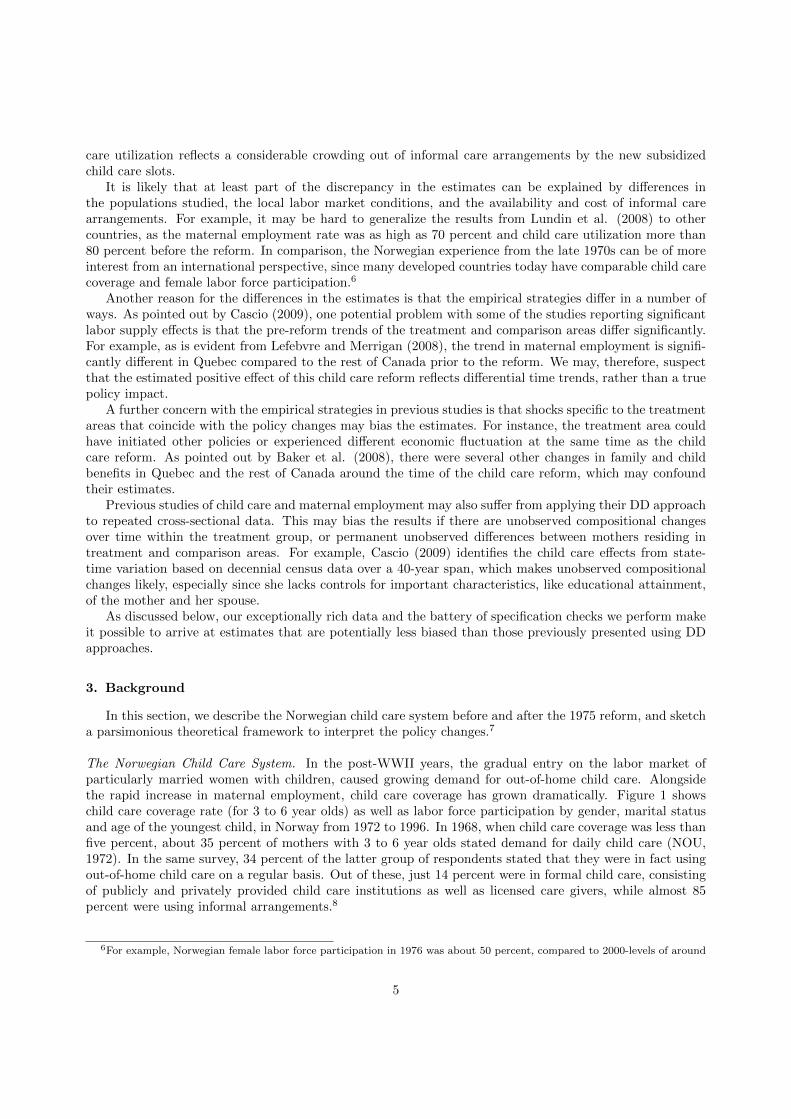
The Norwegian Child Care System. In the post-WWII years, the gradual entry on the labor market ofparticularly married women with children, caused growing demand for out-of-home child care. Alongsidethe rapid increase in maternal employment, child care coverage has grown dramatically. Figure 1 showschild care coverage rate (for 3 to 6 year olds) as well as labor force participation by gender, marital statusand age of the youngest child, in Norway from 1972 to 1996. In 1968, when child care coverage was less thanfive percent, about 35 percent of mothers with 3 to 6 year olds stated demand for daily child care (NOU,1972). In the same survey, 34 percent of the latter group of respondents stated that they were in fact usingout-of-home child care on a regular basis. Out of these, just 14 percent were in formal child care, consistingof publicly and privately provided child care institutions as well as licensed care givers, while almost 85percent were using informal arrangements.8
6For example, Norwegian female labor force participation in 1976 was about 50 percent, compared to 2000-levels of around
5
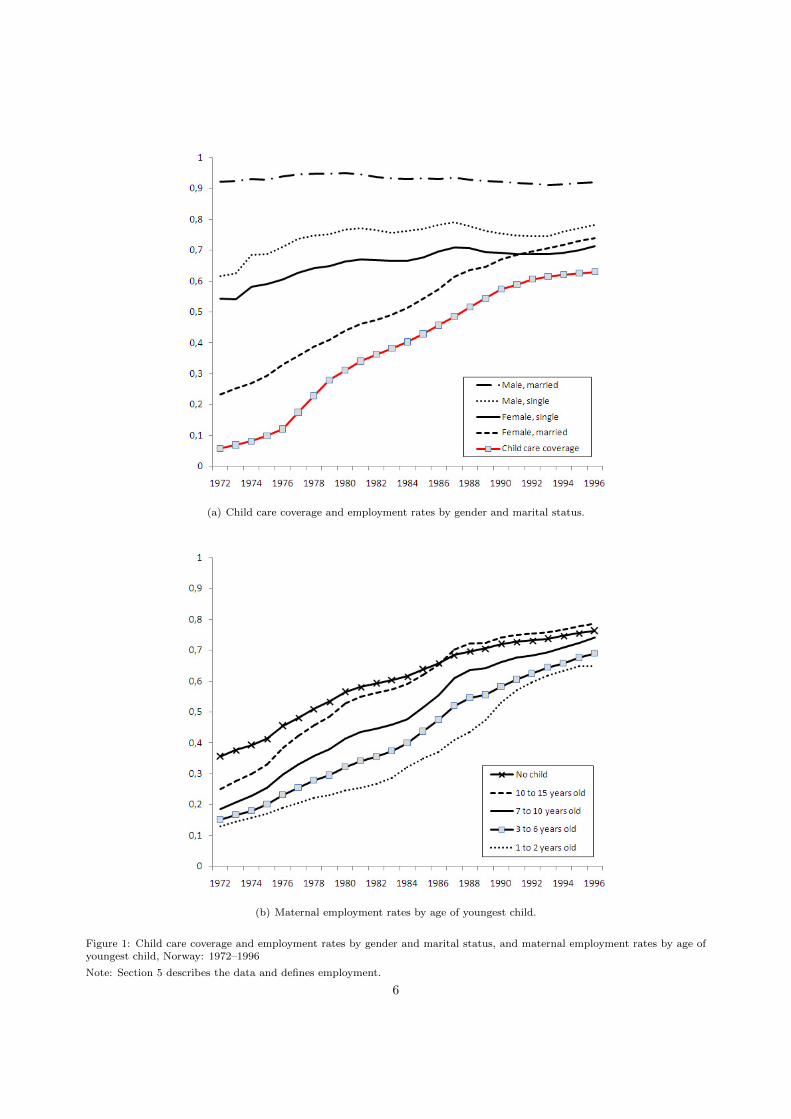
(a) Child care coverage and employment rates by gender and marital status.
(b) Maternal employment rates by age of youngest child.
Figure 1: Child care coverage and employment rates by gender and marital status, and maternal employment rates by age ofyoungest child, Norway: 1972–1996
Note: Section 5 describes the data and defines employment.
6
The severe rationing of formal child care acted as a background for political progress towards publicfunding of formal care. In the early 1950s, grants and subsidized loans were temporarily made available forconstruction and refurbishment of child care institutions, and their operation was regulated by law in 1954.Federal subsidies to formal child care were assigned a permanent post on the national budget in 1962, andincreased over the subsequent ten years from a modest USD 50 per child care place to more than USD 1,200annually.9 The child care subsidies were contingent on a maximum price to be paid by the parents, whichin 1972 was about USD 215 per month for full time care (NOU, 1972).
In 1972, the Norwegian government presented the Kindergarten White Paper (NOU, 1972), proposingradical changes in public child care policies. To create positive arenas for child development, and free labormarket reserves among mothers, it was argued that formal child care should be made universally available.This marked a strong shift in child care policies, from focusing on children with special needs (in particulardisabled children and children from disadvantaged families) to a move towards a universal child care system,offered to the entire population.
In June 1975, The Kindergarten Act was passed by the Norwegian parliament with broad bipartisanpolitical support. It assigned the responsibility for child care to local municipalities, but included federalprovisions on educational content, group size, staff skill composition, and physical environment. By increas-ing the level of federal subsidies for both running costs in general and investment costs for newly establishedinstitutions, the government aimed at quadrupling the number of child care places to reach a total of 100,000places by 1981.10
In the years following the reform, the child care expansion was progressively rolled out at a strong pace,with federal funding more than doubling from USD 34.9 million in 1975 to 85.8 million in 1976, beforereaching 107.3 million in 1977.11 This implied an increase in the federal coverage of running costs fromabout 10% in 1973 to 17,6% in 1976, and further to 30% in 1977. From 1976, newly established child careplaces received additional federal funds for a period of five years: Municipalities with a child care coveragerate below 10% were awarded 60% more subsidies, whereas other municipalities were awarded 40% extra.
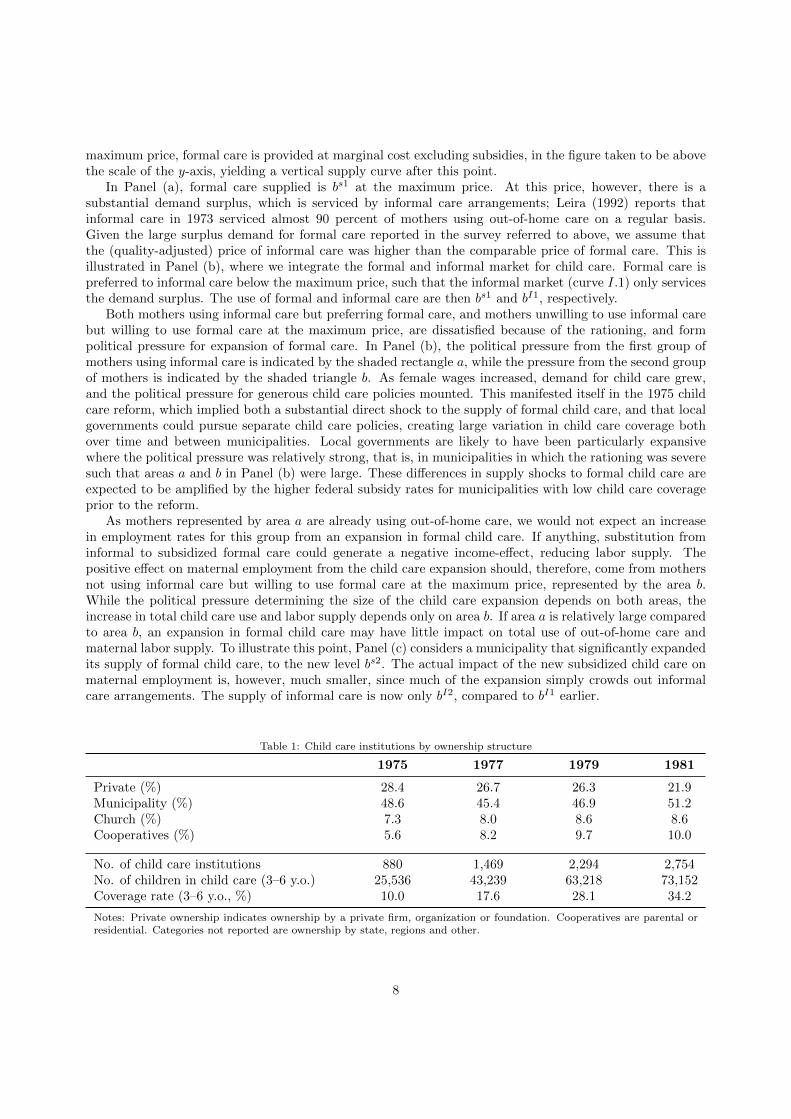
Altogether, the reform constituted a substantial positive shock to the supply of formal child care. Insucceeding years, the previously slow expansion in subsidized child care accelerated rapidly, as shown inFigure 1. From a total coverage rate of less than 10 percent for 3 to 6 year olds in 1975, coverage had shotup above 28 percent by 1979. Over the period, a total of more than 38,000 child care places were established,more than a doubling in child care places compared to 1975. By contrast, there was almost no child carecoverage for 1 and 2 year olds during this period. Table 1 reports child care institutions by owner biannuallyfrom 1975 through 1981, and shows the strong growth in municipal and cooperative child care centers. Theshare of private centers decreased from 28 percent in 1975 to just over 20 percent in 1981, driven almostentirely by a decline in the share of centers run by private organizations.
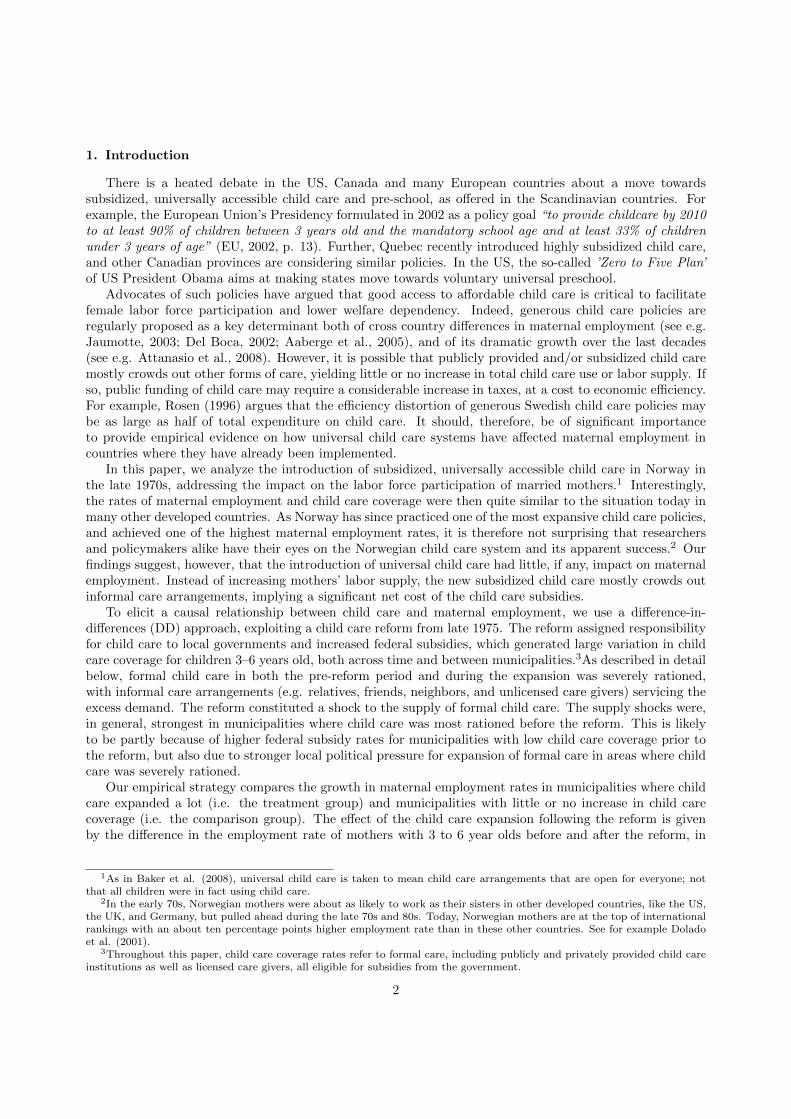
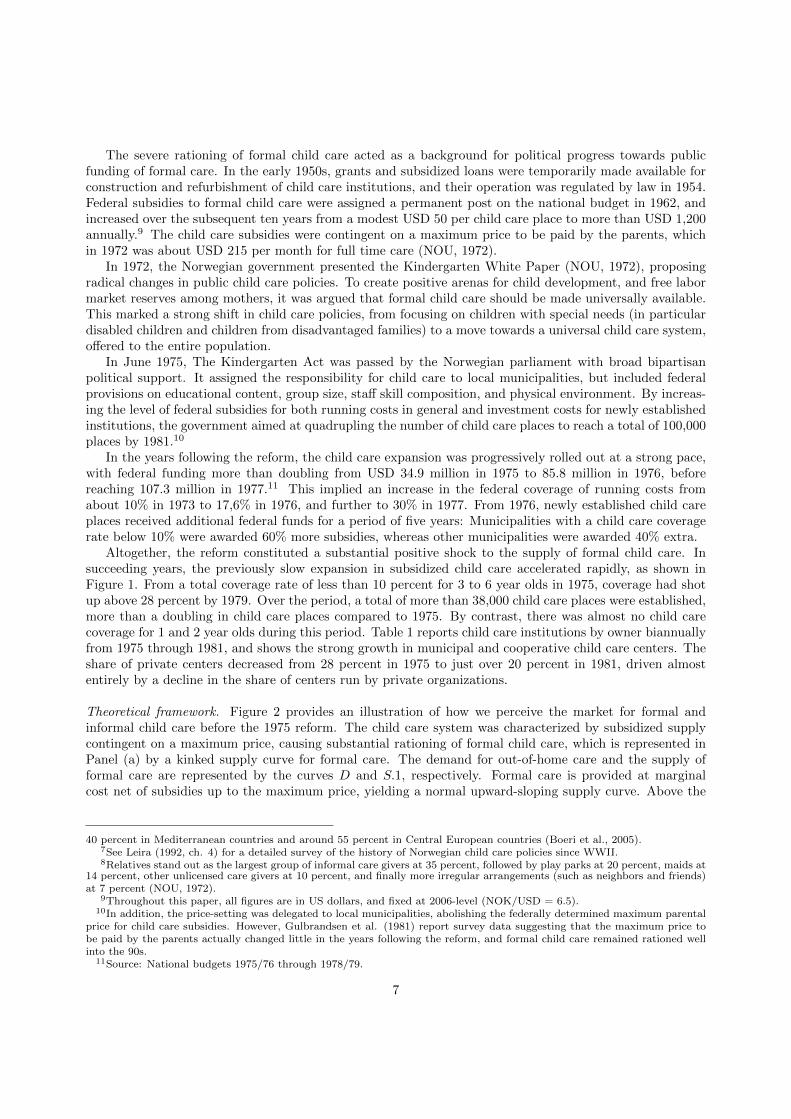
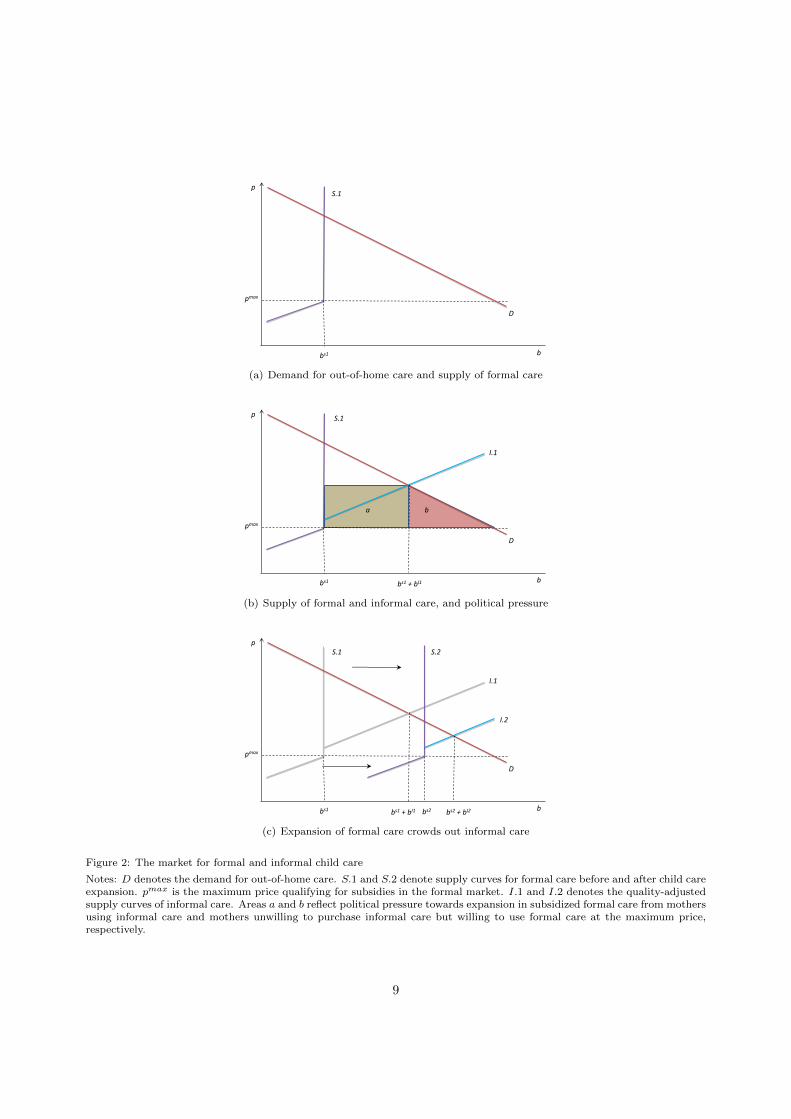
Theoretical framework. Figure 2 provides an illustration of how we perceive the market for formal andinformal child care before the 1975 reform. The child care system was characterized by subsidized supplycontingent on a maximum price, causing substantial rationing of formal child care, which is represented inPanel (a) by a kinked supply curve for formal care. The demand for out-of-home care and the supply offormal care are represented by the curves D and S.1, respectively. Formal care is provided at marginalcost net of subsidies up to the maximum price, yielding a normal upward-sloping supply curve. Above the
40 percent in Mediterranean countries and around 55 percent in Central European countries (Boeri et al., 2005).7See Leira (1992, ch. 4) for a detailed survey of the history of Norwegian child care policies since WWII.8Relatives stand out as the largest group of informal care givers at 35 percent, followed by play parks at 20 percent, maids at
14 percent, other unlicensed care givers at 10 percent, and finally more irregular arrangements (such as neighbors and friends)at 7 percent (NOU, 1972).
9Throughout this paper, all figures are in US dollars, and fixed at 2006-level (NOK/USD = 6.5).10In addition, the price-setting was delegated to local municipalities, abolishing the federally determined maximum parental
price for child care subsidies. However, Gulbrandsen et al. (1981) report survey data suggesting that the maximum price tobe paid by the parents actually changed little in the years following the reform, and formal child care remained rationed wellinto the 90s.
11Source: National budgets 1975/76 through 1978/79.
7
maximum price, formal care is provided at marginal cost excluding subsidies, in the figure taken to be abovethe scale of the y-axis, yielding a vertical supply curve after this point.
In Panel (a), formal care supplied is bs1 at the maximum price. At this price, however, there is asubstantial demand surplus, which is serviced by informal care arrangements; Leira (1992) reports thatinformal care in 1973 serviced almost 90 percent of mothers using out-of-home care on a regular basis.Given the large surplus demand for formal care reported in the survey referred to above, we assume thatthe (quality-adjusted) price of informal care was higher than the comparable price of formal care. This isillustrated in Panel (b), where we integrate the formal and informal market for child care. Formal care ispreferred to informal care below the maximum price, such that the informal market (curve I.1) only servicesthe demand surplus. The use of formal and informal care are then bs1 and bI1, respectively.
Both mothers using informal care but preferring formal care, and mothers unwilling to use informal carebut willing to use formal care at the maximum price, are dissatisfied because of the rationing, and formpolitical pressure for expansion of formal care. In Panel (b), the political pressure from the first group ofmothers using informal care is indicated by the shaded rectangle a, while the pressure from the second groupof mothers is indicated by the shaded triangle b. As female wages increased, demand for child care grew,and the political pressure for generous child care policies mounted. This manifested itself in the 1975 childcare reform, which implied both a substantial direct shock to the supply of formal child care, and that localgovernments could pursue separate child care policies, creating large variation in child care coverage bothover time and between municipalities. Local governments are likely to have been particularly expansivewhere the political pressure was relatively strong, that is, in municipalities in which the rationing was severesuch that areas a and b in Panel (b) were large. These differences in supply shocks to formal child care areexpected to be amplified by the higher federal subsidy rates for municipalities with low child care coverageprior to the reform.
As mothers represented by area a are already using out-of-home care, we would not expect an increasein employment rates for this group from an expansion in formal child care. If anything, substitution frominformal to subsidized formal care could generate a negative income-effect, reducing labor supply. Thepositive effect on maternal employment from the child care expansion should, therefore, come from mothersnot using informal care but willing to use formal care at the maximum price, represented by the area b.While the political pressure determining the size of the child care expansion depends on both areas, theincrease in total child care use and labor supply depends only on area b. If area a is relatively large comparedto area b, an expansion in formal child care may have little impact on total use of out-of-home care andmaternal labor supply. To illustrate this point, Panel (c) considers a municipality that significantly expandedits supply of formal child care, to the new level bs2. The actual impact of the new subsidized child care onmaternal employment is, however, much smaller, since much of the expansion simply crowds out informalcare arrangements. The supply of informal care is now only bI2, compared to bI1 earlier.
Table 1: Child care institutions by ownership structure
1975 1977 1979 1981
Private (%) 28.4 26.7 26.3 21.9Municipality (%) 48.6 45.4 46.9 51.2Church (%) 7.3 8.0 8.6 8.6Cooperatives (%) 5.6 8.2 9.7 10.0
No. of child care institutions 880 1,469 2,294 2,754No. of children in child care (3–6 y.o.) 25,536 43,239 63,218 73,152Coverage rate (3–6 y.o., %) 10.0 17.6 28.1 34.2
Notes: Private ownership indicates ownership by a private firm, organization or foundation. Cooperatives are parental orresidential. Categories not reported are ownership by state, regions and other.
8
p
b
pmax
S.1
D
bs1
(a) Demand for out-of-home care and supply of formal care
p
b
pmax
S.1
D
bs1
I.1
bs1 + bI1
a b
(b) Supply of formal and informal care, and political pressure
p
b
pmax
S.1
D
bs1
I.1
bs1 + bI1
I.2
bs2 + bI2bs2
S.2
(c) Expansion of formal care crowds out informal care
Figure 2: The market for formal and informal child care
Notes: D denotes the demand for out-of-home care. S.1 and S.2 denote supply curves for formal care before and after child careexpansion. pmax is the maximum price qualifying for subsidies in the formal market. I.1 and I.2 denotes the quality-adjustedsupply curves of informal care. Areas a and b reflect political pressure towards expansion in subsidized formal care from mothersusing informal care and mothers unwilling to purchase informal care but willing to use formal care at the maximum price,respectively.
9
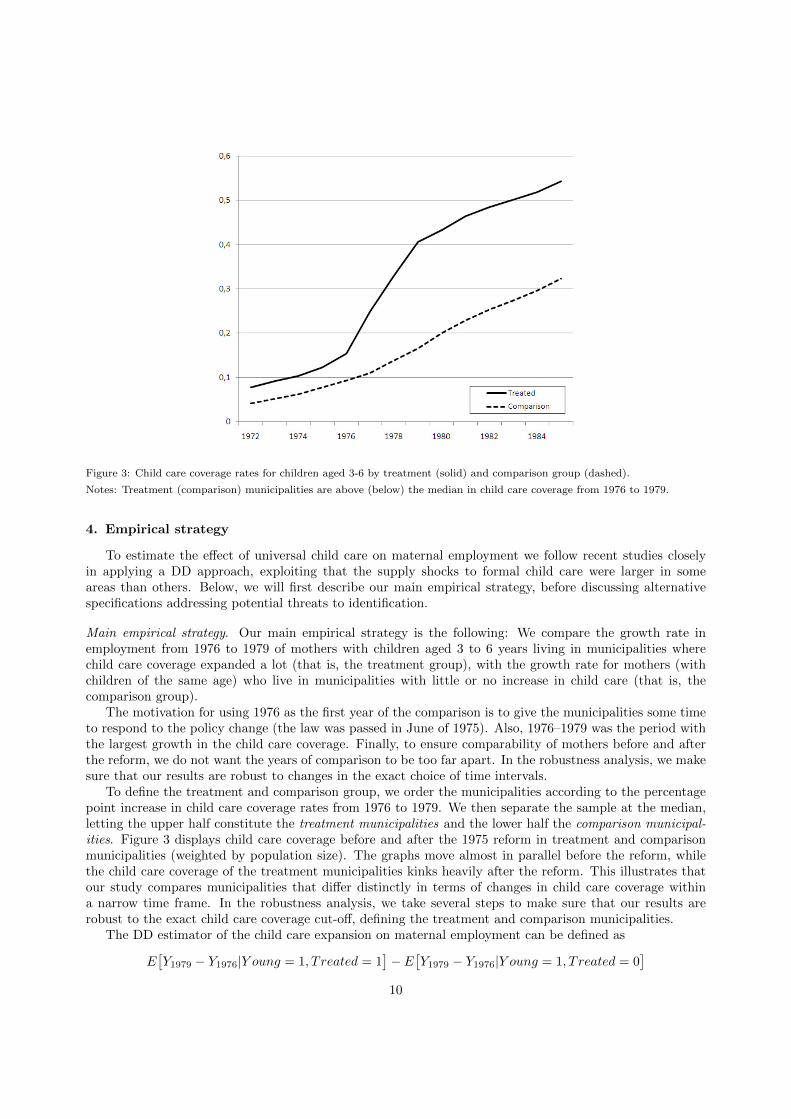
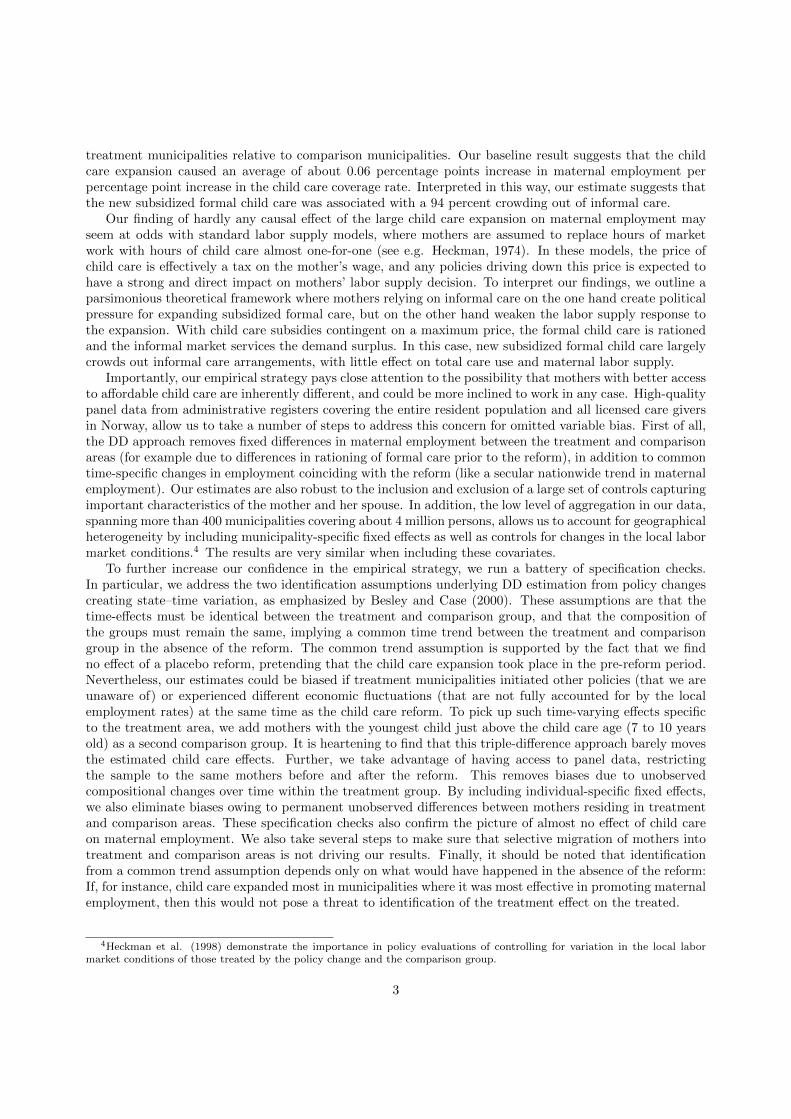
Figure 3: Child care coverage rates for children aged 3-6 by treatment (solid) and comparison group (dashed).
Notes: Treatment (comparison) municipalities are above (below) the median in child care coverage from 1976 to 1979.
4. Empirical strategy
To estimate the effect of universal child care on maternal employment we follow recent studies closelyin applying a DD approach, exploiting that the supply shocks to formal child care were larger in someareas than others. Below, we will first describe our main empirical strategy, before discussing alternativespecifications addressing potential threats to identification.
Main empirical strategy. Our main empirical strategy is the following: We compare the growth rate inemployment from 1976 to 1979 of mothers with children aged 3 to 6 years living in municipalities wherechild care coverage expanded a lot (that is, the treatment group), with the growth rate for mothers (withchildren of the same age) who live in municipalities with little or no increase in child care (that is, thecomparison group).
The motivation for using 1976 as the first year of the comparison is to give the municipalities some timeto respond to the policy change (the law was passed in June of 1975). Also, 1976–1979 was the period withthe largest growth in the child care coverage. Finally, to ensure comparability of mothers before and afterthe reform, we do not want the years of comparison to be too far apart. In the robustness analysis, we makesure that our results are robust to changes in the exact choice of time intervals.
To define the treatment and comparison group, we order the municipalities according to the percentagepoint increase in child care coverage rates from 1976 to 1979. We then separate the sample at the median,letting the upper half constitute the treatment municipalities and the lower half the comparison municipal-ities. Figure 3 displays child care coverage before and after the 1975 reform in treatment and comparisonmunicipalities (weighted by population size). The graphs move almost in parallel before the reform, whilethe child care coverage of the treatment municipalities kinks heavily after the reform. This illustrates thatour study compares municipalities that differ distinctly in terms of changes in child care coverage withina narrow time frame. In the robustness analysis, we take several steps to make sure that our results arerobust to the exact child care coverage cut-off, defining the treatment and comparison municipalities.
The DD estimator of the child care expansion on maternal employment can be defined as
E[Y1979 − Y1976|Y oung = 1, T reated = 1
]− E
[Y1979 − Y1976|Y oung = 1, T reated = 0
]10
where E is the expectations operator, Y is a dichotomous dependent variable equal to 1 if the mother works(and 0 otherwise), Y oung is a dummy variable equal to 1 if the youngest child of the mother is between3 and 6 years old (and 0 otherwise), and Treated is a dummy variable equal to 1 if the mother lives in atreatment area (and 0 is she lives in a comparison area).
The corresponding DD regression, estimated by OLS over the sample of mothers with the youngest childbetween 3 and 6 years old, can be defined as
Yit = β0 + β1Treatedi + β2Postt + β3Treatedi · Postt +X ′itζ + εit (1)
where i indexes mother, t indexes year (1976 or 1979), Post is a dummy variable equal to 1 when t =1979 and 0 when t = 1976, and X is a vector of controls for child and parental characteristics. In ourbaseline specification, we include in X dummy variables for the child’s sex, the mother’s and her spouse’sage, years of education and immigrant status, number of older siblings by age, and for moving betweenmunicipalities within treatment/comparison areas. We also include municipality-specific fixed-effects andthe local employment rate of prime age males to capture potentially differing labor market environment.As parental education may be endogenous to the policy changes, we measure educational attainment beforethe reform. The error term εit is clustered on the mother, allowing for dependence in the error terms.12
The parameter of interest β3 gives the average impact on mothers who reside in the treatment area inthe post-reform period, of the additional child care slots following the reform in the treatment municipalitiescompared to the comparison municipalities. There are two types of averaging underlying this average causaleffect. First, there is averaging over the impacts on children from different municipalities in the treatmentarea. And second, there is averaging across the marginal effects of the additional child care slots. Forease of interpretation, we will also report the percentage points increase in maternal employment rate perpercentage point increase in child care coverage, defined as β3 divided by the increase in child care coveragerate in the treatment area relative to the comparison area.
The DD approach controls for unobserved differences between mothers in different years as well as be-tween mothers from treatment and comparison municipalities in the same year. The identifying assumptionis that the growth rate in maternal employment before and after the reform would have been the samein the treatment municipalities as in the comparison municipalities, in the absence of the reform. If, forinstance, child care expanded most in municipalities where it maternal employment was most responsive,then this would not pose a threat to identification of β3. However, a concern could be that the growth inmaternal employment differs by, say, education level, while there are systematic differences in educationalattainment between mothers from treatment and comparison municipalities. To address such concerns forselection bias, we estimate equation (1) with and without the set of controls X.
Because we also control for municipality-specific fixed effects, it is not necessary that the child care ex-pansion is unrelated to municipality characteristics. It is useful, however, to understand the determinants ofthe expansion across municipalities. In Section 5, we investigate this closely, finding that the characteristicsof treatment and comparison municipalities are fairly similar in terms of political and demographic compo-sition as well as local government expenditure and income. A notable exception is that the expansion wasstrongest in municipalities with the lowest ratio of formal child care coverage to employment rate of motherswith children in child care age. This conforms well to intuition, since federal subsidy rates were higher formunicipalities with low child care coverage prior to the reform, but also because the local political pressurefor expansion of formal care is likely to be stronger in areas where child care was severely rationed.
Although municipality-specific fixed effects picks up the direct effects of pre-determined and time-invariant factors of the municipalities, like differences in rationing of formal child care prior to the reform,we may worry about the determinants of the child care expansion being systematically related to underlyingtrends in maternal employment. And even though the DD approach controls for unobserved differences both
12As maternal employment is a limited dependent variable, our linear probability model will be the best least-squaresapproximation of the true conditional expectation function. As noted by Angrist (2001), if there are no covariates or they arediscrete, as in our case, linear models are no less appropriate for limited dependent variables than for other types of dependentvariables. In any case, we have checked that our results are robust to alternative approximations of the conditional expectationfunction, estimating Logit and Probit models.
11
between mothers in different years as well as between mothers from treatment and comparison municipalitiesin the same year, there could be changes over time in the differences in the unobservable characteristicsof mothers from the two groups. As always in policy evaluation using non-experimental data we cannotcompletely guard against omitted variables bias. Yet to increase the confidence in our identification strategy,we run a battery of specification checks.
Specification checks. The assumption of a common time trend between the treatment and comparisongroup in the absence of the reform, is supported by the fact that we find no effects of a placebo reform,pretending that the child care expansion took place in the pre-reform period. Further, we take advantage ofhaving access to panel data, restricting the sample to the same mothers before and after the reform. Thisremoves biases due to unobserved compositional changes over time within the treatment group. By includingindividual-specific fixed effects, we also eliminate biases owing to permanent unobserved differences betweenmothers residing in treatment and comparison areas. In addition, we take several steps to make sure thatselective migration of mothers into treatment and comparison areas is not driving our results.
Nevertheless, a concern with equation (1) is that changes specific to the treatment areas coinciding withthe policy changes will bias our estimate of β3. If, for instance, there are economic fluctuations specific tothe treatment group that are not fully accounted for by local employment rates, the DD estimator may bebiased. A similar problem would arise if the treatment municipalities also initiated other policies affectingmaternal labor supply (although we found no evidence of such policies). We address this concern by addingmothers with the youngest child just above child care age (7 to 10 years old) as a second comparison group.This gives us a tripe-difference (DDD) estimator, exploiting that the child care reform creates variationalong three dimensions: (a) between mothers with 3 to 6 year olds and 7 to 10 year olds; (b) between timeperiods before and after the reform; (c) between treatment areas and comparison areas. The additionalcomparison group should pick up time-varying effects specific to the treatment area, and correct for sourcesof bias mentioned above, since mothers of 7 to 10 year olds are unaffected by the reform.
The DDD estimator of the effect of the child care expansion on maternal employment can be defined as{E[Y1979 − Y1976|Y oung = 1, T reated = 1
]− E
[Y1979 − Y1976|Y oung = 1, T reated = 0
]}−{E[Y1979 − Y1976|Y oung = 0, T reated = 1
]− E
[Y1979 − Y1976|Y oung = 0, T reated = 0
]}where Y oung, as before, is equal to 1 if the youngest child of the mother is between 3 and 6 years old,and 0 if the youngest child of the mother is between 7 and 10 years old. The first curly brackets comparesthe expected growth rate in employment of mothers with the youngest child aged 3 to 6 years who livein treatment areas, with the expected growth rate for mothers with children of the same age living in thecomparison areas. The second curly brackets makes the same comparison for mothers with slightly olderchildren. The identifying assumption is that, on average, the difference between the employment rate ofmothers with 3 to 6 year olds and mothers with 7 to 10 year olds would have changed similarly in treatmentand comparison areas, in the absence of the reform.
The corresponding DDD regression, estimated by OLS over the sample of mothers with the youngestchild 3 to 10 years old, can be expressed as
Yit = γ0 + γ1Treatedi + γ2Y oungit + γ3Treatedi · Y oungit (2)
+[γ4 + γ5Treatedi + γ6Y oungit + γ7Treatedi · Y oungit
]Postt +X ′itη + νit
It should be noted that the DDD regression, like the DD regression, allows for different intercepts byresidency (γ1), as well as by child age (γ2) and their interaction (γ3). In addition, equation (2) controls forchanges coinciding with the reform, both in general (γ4), by residency (γ5) and by child age (γ6).
Above, we defined the treatment and comparison areas by ordering the municipalities according to theincrease in child care coverage, and then separating them at the median. A concern is that our results aresensitive to this choice of treatment definition. Figure A1 reported in Appendix A draws histograms of the
12
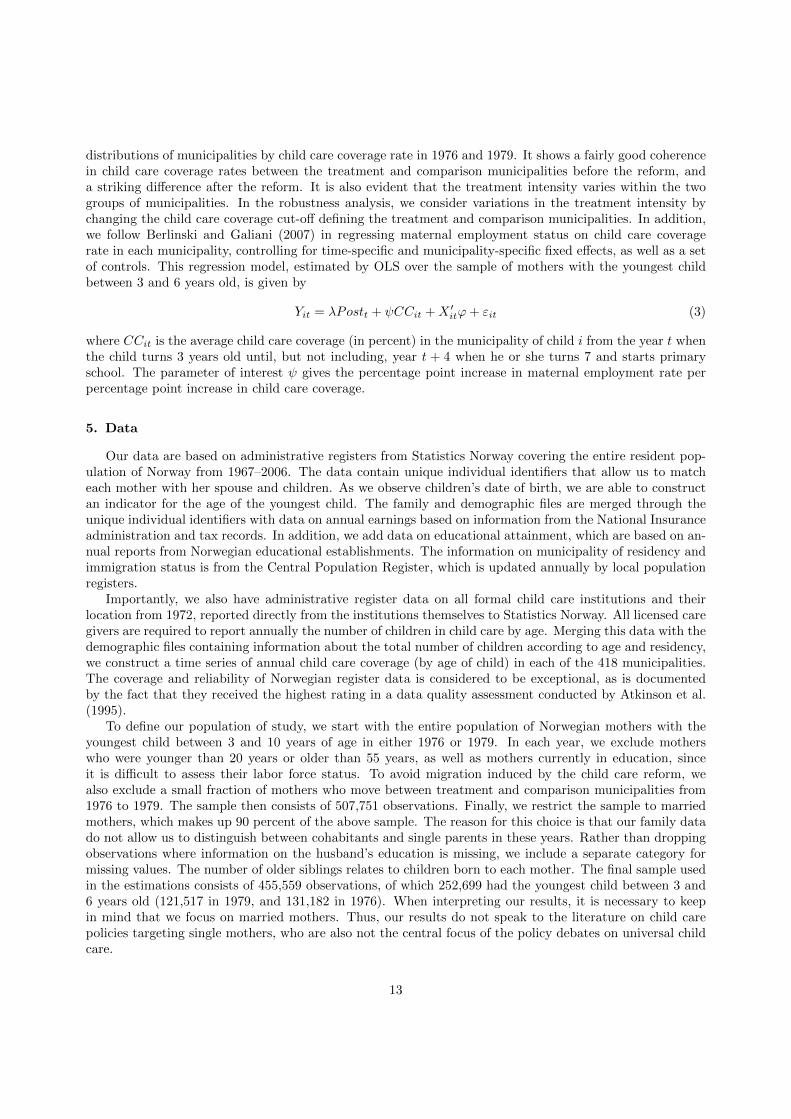
distributions of municipalities by child care coverage rate in 1976 and 1979. It shows a fairly good coherencein child care coverage rates between the treatment and comparison municipalities before the reform, anda striking difference after the reform. It is also evident that the treatment intensity varies within the twogroups of municipalities. In the robustness analysis, we consider variations in the treatment intensity bychanging the child care coverage cut-off defining the treatment and comparison municipalities. In addition,we follow Berlinski and Galiani (2007) in regressing maternal employment status on child care coveragerate in each municipality, controlling for time-specific and municipality-specific fixed effects, as well as a setof controls. This regression model, estimated by OLS over the sample of mothers with the youngest childbetween 3 and 6 years old, is given by
Yit = λPostt + ψCCit +X ′itϕ+ εit (3)
where CCit is the average child care coverage (in percent) in the municipality of child i from the year t whenthe child turns 3 years old until, but not including, year t + 4 when he or she turns 7 and starts primaryschool. The parameter of interest ψ gives the percentage point increase in maternal employment rate perpercentage point increase in child care coverage.
5. Data
Our data are based on administrative registers from Statistics Norway covering the entire resident pop-ulation of Norway from 1967–2006. The data contain unique individual identifiers that allow us to matcheach mother with her spouse and children. As we observe children’s date of birth, we are able to constructan indicator for the age of the youngest child. The family and demographic files are merged through theunique individual identifiers with data on annual earnings based on information from the National Insuranceadministration and tax records. In addition, we add data on educational attainment, which are based on an-nual reports from Norwegian educational establishments. The information on municipality of residency andimmigration status is from the Central Population Register, which is updated annually by local populationregisters.
Importantly, we also have administrative register data on all formal child care institutions and theirlocation from 1972, reported directly from the institutions themselves to Statistics Norway. All licensed caregivers are required to report annually the number of children in child care by age. Merging this data with thedemographic files containing information about the total number of children according to age and residency,we construct a time series of annual child care coverage (by age of child) in each of the 418 municipalities.The coverage and reliability of Norwegian register data is considered to be exceptional, as is documentedby the fact that they received the highest rating in a data quality assessment conducted by Atkinson et al.(1995).
To define our population of study, we start with the entire population of Norwegian mothers with theyoungest child between 3 and 10 years of age in either 1976 or 1979. In each year, we exclude motherswho were younger than 20 years or older than 55 years, as well as mothers currently in education, sinceit is difficult to assess their labor force status. To avoid migration induced by the child care reform, wealso exclude a small fraction of mothers who move between treatment and comparison municipalities from1976 to 1979. The sample then consists of 507,751 observations. Finally, we restrict the sample to marriedmothers, which makes up 90 percent of the above sample. The reason for this choice is that our family datado not allow us to distinguish between cohabitants and single parents in these years. Rather than droppingobservations where information on the husband’s education is missing, we include a separate category formissing values. The number of older siblings relates to children born to each mother. The final sample usedin the estimations consists of 455,559 observations, of which 252,699 had the youngest child between 3 and6 years old (121,517 in 1979, and 131,182 in 1976). When interpreting our results, it is necessary to keepin mind that we focus on married mothers. Thus, our results do not speak to the literature on child carepolicies targeting single mothers, who are also not the central focus of the policy debates on universal childcare.
13
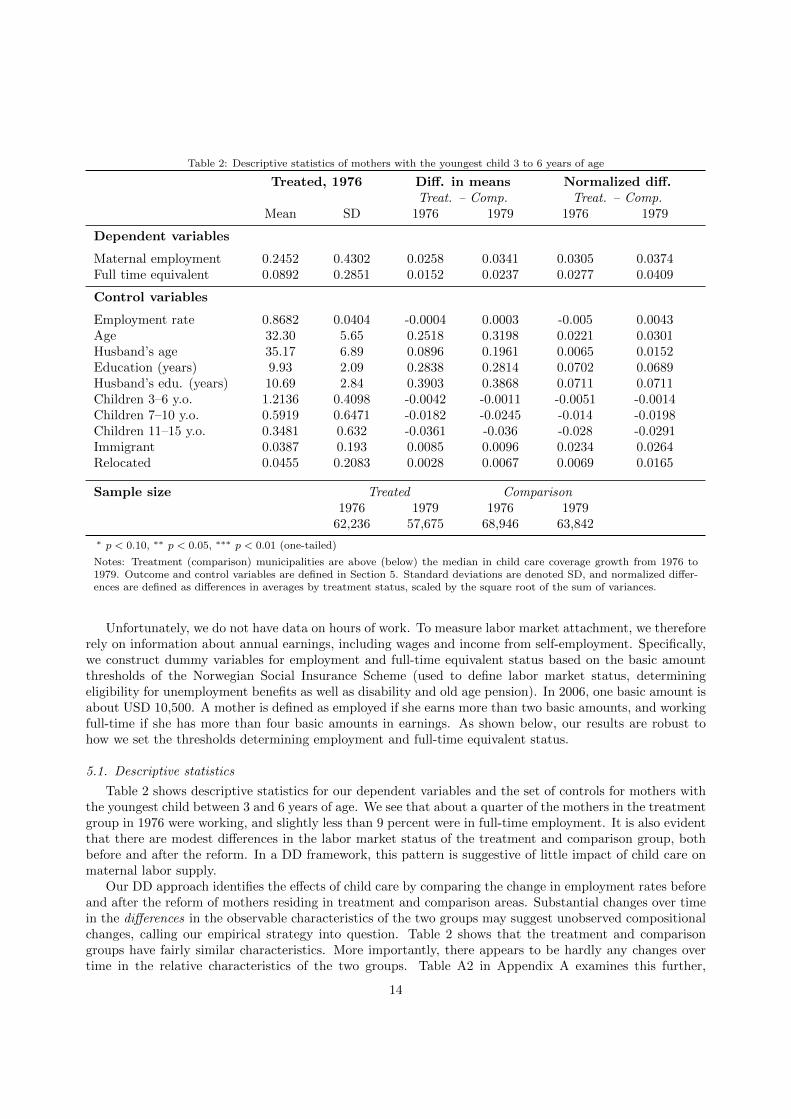
Table 2: Descriptive statistics of mothers with the youngest child 3 to 6 years of age
Treated, 1976 Diff. in means Normalized diff.Treat. – Comp. Treat. – Comp.
Mean SD 1976 1979 1976 1979
Dependent variables
Maternal employment 0.2452 0.4302 0.0258 0.0341 0.0305 0.0374Full time equivalent 0.0892 0.2851 0.0152 0.0237 0.0277 0.0409
Control variables
Employment rate 0.8682 0.0404 -0.0004 0.0003 -0.005 0.0043Age 32.30 5.65 0.2518 0.3198 0.0221 0.0301Husband’s age 35.17 6.89 0.0896 0.1961 0.0065 0.0152Education (years) 9.93 2.09 0.2838 0.2814 0.0702 0.0689Husband’s edu. (years) 10.69 2.84 0.3903 0.3868 0.0711 0.0711Children 3–6 y.o. 1.2136 0.4098 -0.0042 -0.0011 -0.0051 -0.0014Children 7–10 y.o. 0.5919 0.6471 -0.0182 -0.0245 -0.014 -0.0198Children 11–15 y.o. 0.3481 0.632 -0.0361 -0.036 -0.028 -0.0291Immigrant 0.0387 0.193 0.0085 0.0096 0.0234 0.0264Relocated 0.0455 0.2083 0.0028 0.0067 0.0069 0.0165
Sample size Treated Comparison1976 1979 1976 1979
62,236 57,675 68,946 63,842
∗ p < 0.10, ∗∗ p < 0.05, ∗∗∗ p < 0.01 (one-tailed)
Notes: Treatment (comparison) municipalities are above (below) the median in child care coverage growth from 1976 to1979. Outcome and control variables are defined in Section 5. Standard deviations are denoted SD, and normalized differ-ences are defined as differences in averages by treatment status, scaled by the square root of the sum of variances.
Unfortunately, we do not have data on hours of work. To measure labor market attachment, we thereforerely on information about annual earnings, including wages and income from self-employment. Specifically,we construct dummy variables for employment and full-time equivalent status based on the basic amountthresholds of the Norwegian Social Insurance Scheme (used to define labor market status, determiningeligibility for unemployment benefits as well as disability and old age pension). In 2006, one basic amount isabout USD 10,500. A mother is defined as employed if she earns more than two basic amounts, and workingfull-time if she has more than four basic amounts in earnings. As shown below, our results are robust tohow we set the thresholds determining employment and full-time equivalent status.
5.1. Descriptive statistics
Table 2 shows descriptive statistics for our dependent variables and the set of controls for mothers withthe youngest child between 3 and 6 years of age. We see that about a quarter of the mothers in the treatmentgroup in 1976 were working, and slightly less than 9 percent were in full-time employment. It is also evidentthat there are modest differences in the labor market status of the treatment and comparison group, bothbefore and after the reform. In a DD framework, this pattern is suggestive of little impact of child care onmaternal labor supply.
Our DD approach identifies the effects of child care by comparing the change in employment rates beforeand after the reform of mothers residing in treatment and comparison areas. Substantial changes over timein the differences in the observable characteristics of the two groups may suggest unobserved compositionalchanges, calling our empirical strategy into question. Table 2 shows that the treatment and comparisongroups have fairly similar characteristics. More importantly, there appears to be hardly any changes overtime in the relative characteristics of the two groups. Table A2 in Appendix A examines this further,
14
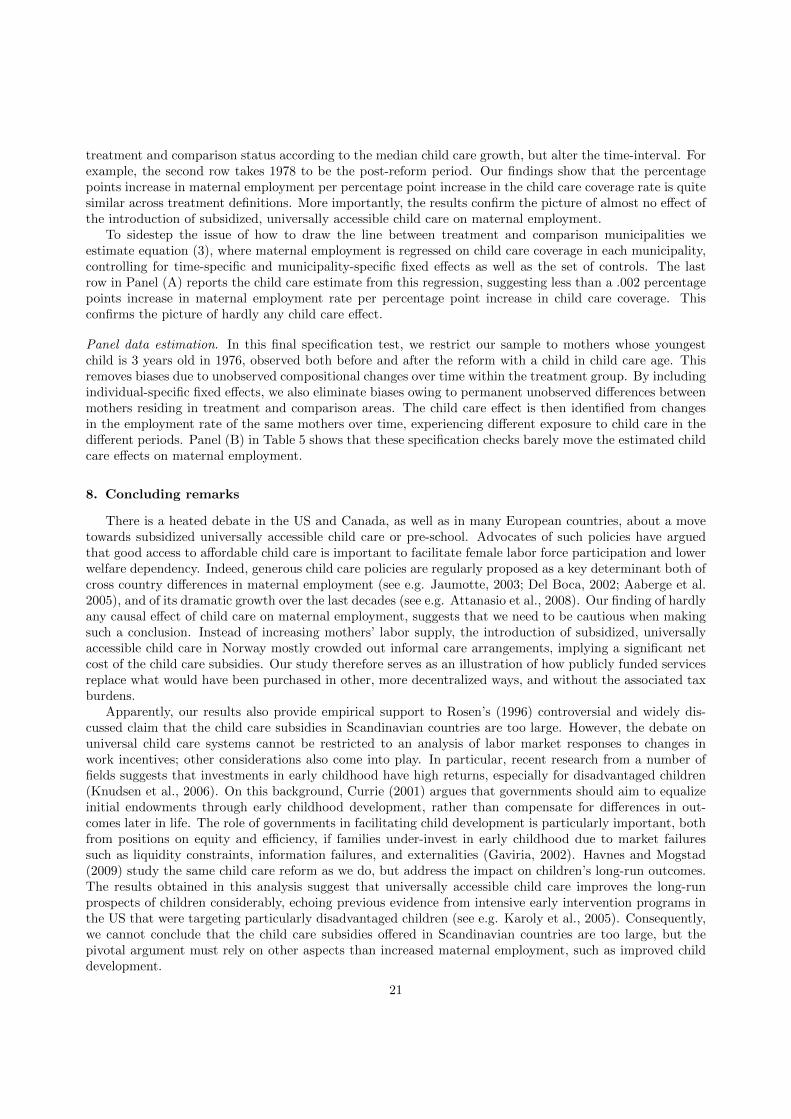
reporting DD estimates of equation (1), where we have replaced the dependent variable with each controlvariable. The results show negligible – and often insignificant – differences over time in the characteristicsof mothers residing in the treatment and comparison areas. The same picture holds true for mothers withthe youngest child between 7 and 10 years old, which we use as a second comparison group in the DDDregressions. Table A1 provided in Appendix A reports descriptive statistics for our dependent variables andthe set of controls for mothers with the youngest child between 7 and 10 years of age.
A concern in applying linear regressions is lack of overlap in the covariate distribution. As emphasized byImbens and Wooldridge (2009), this can be assessed by the (scale-invariant) normalized difference measure.For each covariate, the normalized difference is defined as the difference in averages by treatment status,scaled by the square root of the sum of variances. Imbens and Wooldridge suggest as a rule of thumb thatlinear regression methods tend to be sensitive to the functional form assumption if the normalized differenceexceeds one quarter. Table 2 also displays normalized differences for our controls in the final two columns,indicating that lack of overlap should be of little concern for the estimated effects. This also holds true forthe set of controls for mothers with the youngest child between 7 and 10 years of age, as shown in Table A1presented in Appendix A.
Because we control for municipality-specific fixed effects, it is not necessary that the child care expansionis unrelated to municipality characteristics. However, if determinants of the expansion are systematicallyrelated to underlying trends in maternal employment, we may be worried about differences in the charac-teristics of treatment and comparison municipalities. It is useful, therefore, to understand the determinantsof the expansion across municipalities.
In Appendix A, we include a map of Norway, marking the treatment and comparison municipalities inFigure A2. The map shows that the municipalities are reasonably well spread out, covering urban and ruralmunicipalities. In our baseline specification, five of the ten largest cities – by the number of children inour sample – are defined as treatment municipalities (Oslo, Bergen, Stavanger, Bærum and Fredrikstad),while the others are defined as comparison municipalities (Trondheim, Kristiansand, Tromsø, Skien andDrammen). Further, Table A3 in Appendix A displays characteristics of the municipalities in the treatmentand comparison area. There appears to be no substantial differences in terms of local government expenditureper capita, in total or on primary school in particular. This is most likely because of strict federal provisionsfor minimum standards of different local public services, and considerable ear-marked grants-in-aid from thecentral government. The same holds for local government income, consisting largely of grants-in-aid fromthe central government, in addition to local income taxes and user fees. This comes as no surprise, as thefederal government determines the tax rate and the tax base of the income tax. Also, the federal governmentused equalization transfers to redistribute income from rich to poor municipalities, such that local differencesin revenues are largely offset (Løken, 2009). Interestingly, there are no noticeable differences in the shareof female voters between the municipalities of the treatment and comparison area, nor is there significantdisparity in the socialist shares of voters. This conforms well to the fact that there was broad bipartisansupport for child care expansion in Norway in the 1970s. Further, there are no substantial differences inpopulation size or the population shares of neither 0 to 6 year olds, nor females of fecund age, 19–35 or36–55 years old.
There are, however, a couple of notable differences between treatment and comparison municipalities.Most importantly, the ratio of child care coverage to employment rate of mothers of 3-6 year olds priorto the reform, is substantially lower in treatment municipalities than in comparison municipalities. Intreatment municipalities, there is on average more than four employed mothers for each child care place,while the same ratio is less than three-to-one in comparison municipalities. This conforms well to intuition,since federal subsidy rates were higher for municipalities with low child care coverage prior to the reform,but also because the local political pressure for expansion of formal care is likely to be stronger in areaswhere child care was severely rationed. We also see that two of the variables indicating rurality indicatea small positive relationship with the child care expansion (average distance to zone center and ear marksper capita). This might be due to the discreteness of child care expansion; Establishing a typical child careinstitution increases the child care coverage rate more in smaller than in larger municipalities. In Norway,there was a very slow process of urbanization until the mid 1980s (Berg, 2005), which implies that ruralitystatus is likely to be more or less constant during the period we consider, and should, therefore, be picked
15
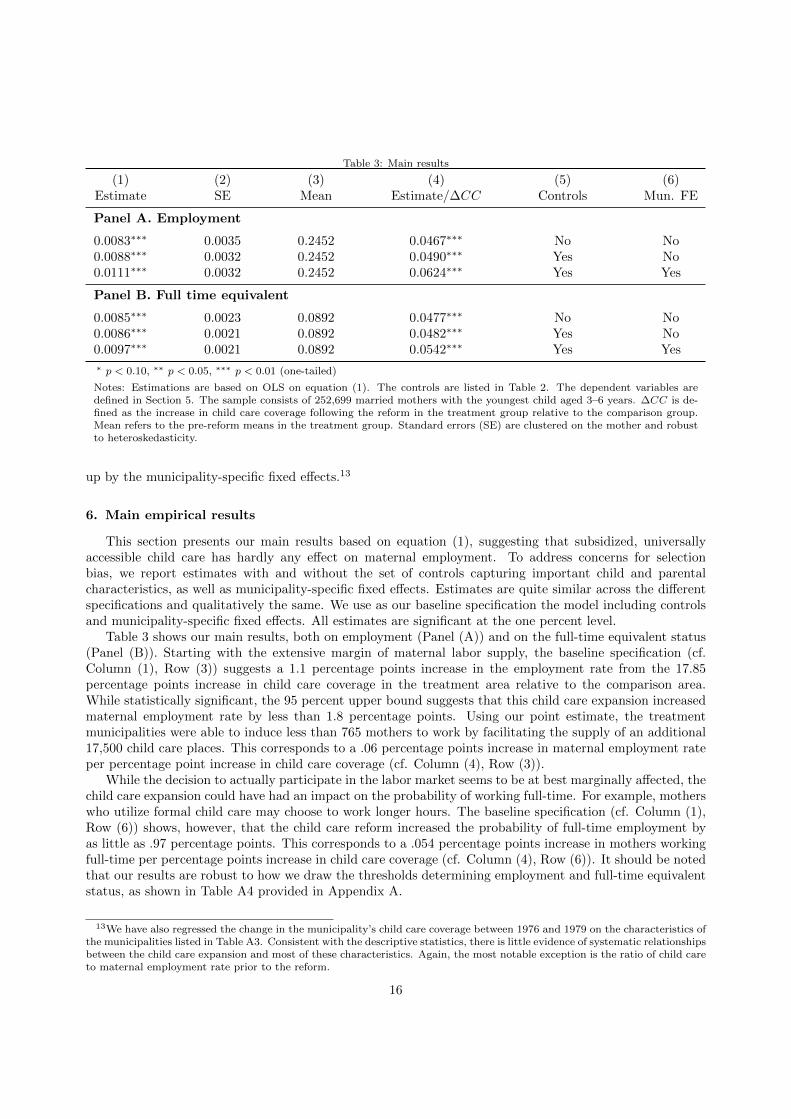
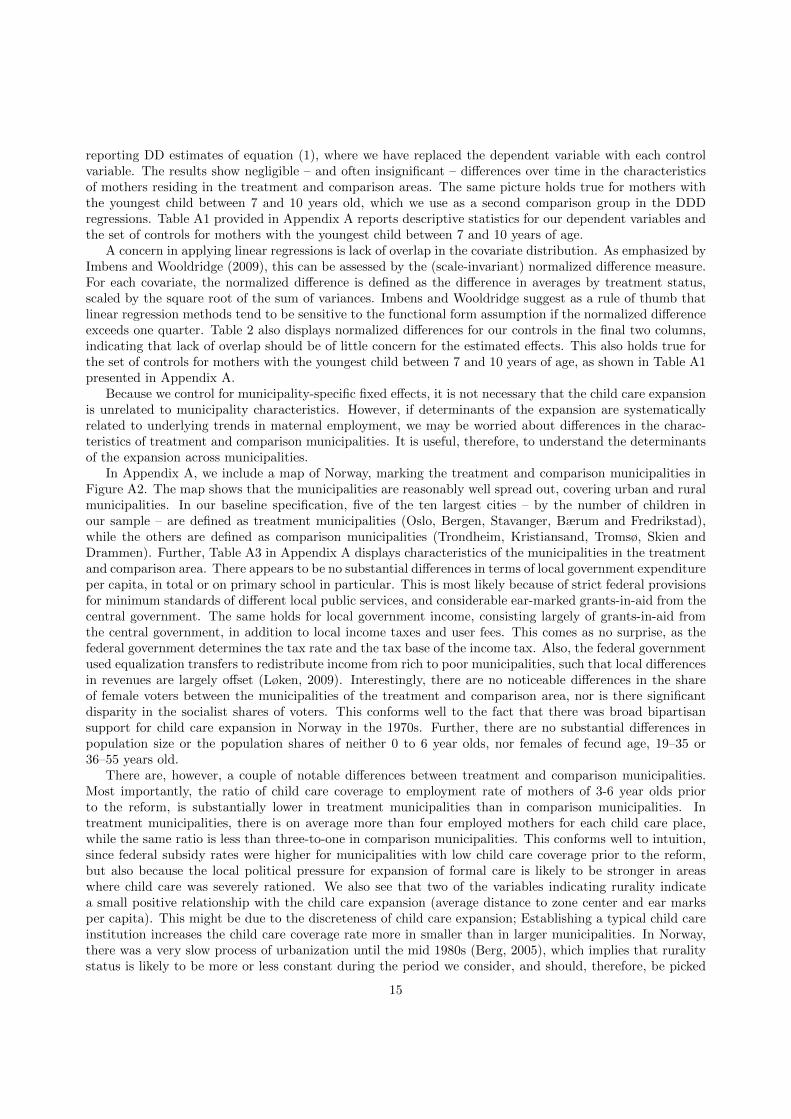
Table 3: Main results
(1) (2) (3) (4) (5) (6)Estimate SE Mean Estimate/∆CC Controls Mun. FE
Panel A. Employment
0.0083∗∗∗ 0.0035 0.2452 0.0467∗∗∗ No No0.0088∗∗∗ 0.0032 0.2452 0.0490∗∗∗ Yes No0.0111∗∗∗ 0.0032 0.2452 0.0624∗∗∗ Yes Yes
Panel B. Full time equivalent
0.0085∗∗∗ 0.0023 0.0892 0.0477∗∗∗ No No0.0086∗∗∗ 0.0021 0.0892 0.0482∗∗∗ Yes No0.0097∗∗∗ 0.0021 0.0892 0.0542∗∗∗ Yes Yes
∗ p < 0.10, ∗∗ p < 0.05, ∗∗∗ p < 0.01 (one-tailed)
Notes: Estimations are based on OLS on equation (1). The controls are listed in Table 2. The dependent variables aredefined in Section 5. The sample consists of 252,699 married mothers with the youngest child aged 3–6 years. ∆CC is de-fined as the increase in child care coverage following the reform in the treatment group relative to the comparison group.Mean refers to the pre-reform means in the treatment group. Standard errors (SE) are clustered on the mother and robustto heteroskedasticity.
up by the municipality-specific fixed effects.13
6. Main empirical results
This section presents our main results based on equation (1), suggesting that subsidized, universallyaccessible child care has hardly any effect on maternal employment. To address concerns for selectionbias, we report estimates with and without the set of controls capturing important child and parentalcharacteristics, as well as municipality-specific fixed effects. Estimates are quite similar across the differentspecifications and qualitatively the same. We use as our baseline specification the model including controlsand municipality-specific fixed effects. All estimates are significant at the one percent level.
Table 3 shows our main results, both on employment (Panel (A)) and on the full-time equivalent status(Panel (B)). Starting with the extensive margin of maternal labor supply, the baseline specification (cf.Column (1), Row (3)) suggests a 1.1 percentage points increase in the employment rate from the 17.85percentage points increase in child care coverage in the treatment area relative to the comparison area.While statistically significant, the 95 percent upper bound suggests that this child care expansion increasedmaternal employment rate by less than 1.8 percentage points. Using our point estimate, the treatmentmunicipalities were able to induce less than 765 mothers to work by facilitating the supply of an additional17,500 child care places. This corresponds to a .06 percentage points increase in maternal employment rateper percentage point increase in child care coverage (cf. Column (4), Row (3)).
While the decision to actually participate in the labor market seems to be at best marginally affected, thechild care expansion could have had an impact on the probability of working full-time. For example, motherswho utilize formal child care may choose to work longer hours. The baseline specification (cf. Column (1),Row (6)) shows, however, that the child care reform increased the probability of full-time employment byas little as .97 percentage points. This corresponds to a .054 percentage points increase in mothers workingfull-time per percentage points increase in child care coverage (cf. Column (4), Row (6)). It should be notedthat our results are robust to how we draw the thresholds determining employment and full-time equivalentstatus, as shown in Table A4 provided in Appendix A.
13We have also regressed the change in the municipality’s child care coverage between 1976 and 1979 on the characteristics ofthe municipalities listed in Table A3. Consistent with the descriptive statistics, there is little evidence of systematic relationshipsbetween the child care expansion and most of these characteristics. Again, the most notable exception is the ratio of child careto maternal employment rate prior to the reform.
16
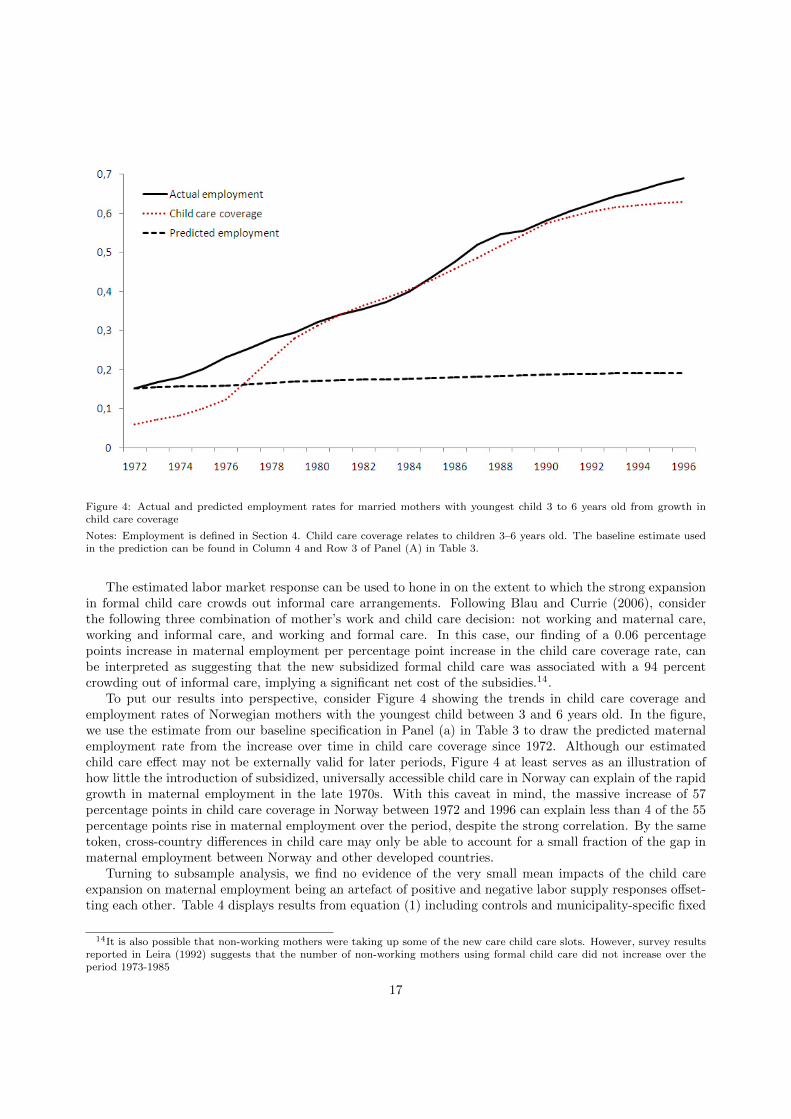
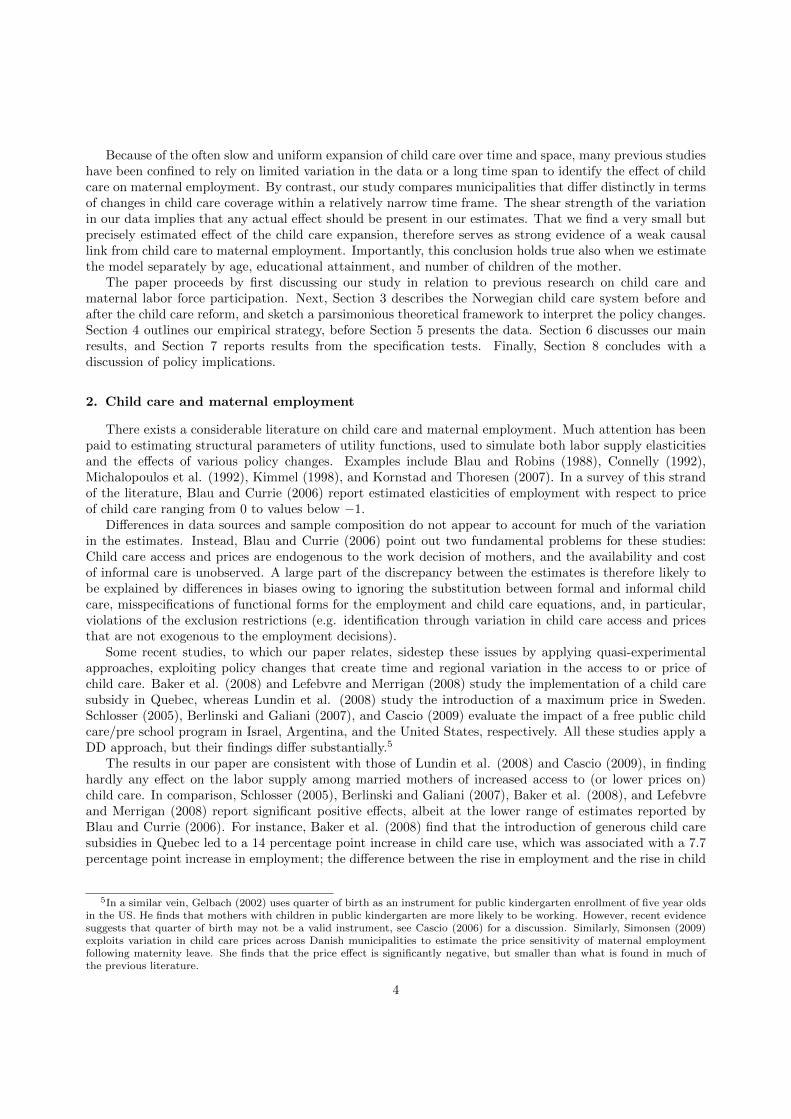
Figure 4: Actual and predicted employment rates for married mothers with youngest child 3 to 6 years old from growth inchild care coverage
Notes: Employment is defined in Section 4. Child care coverage relates to children 3–6 years old. The baseline estimate usedin the prediction can be found in Column 4 and Row 3 of Panel (A) in Table 3.
The estimated labor market response can be used to hone in on the extent to which the strong expansionin formal child care crowds out informal care arrangements. Following Blau and Currie (2006), considerthe following three combination of mother’s work and child care decision: not working and maternal care,working and informal care, and working and formal care. In this case, our finding of a 0.06 percentagepoints increase in maternal employment per percentage point increase in the child care coverage rate, canbe interpreted as suggesting that the new subsidized formal child care was associated with a 94 percentcrowding out of informal care, implying a significant net cost of the subsidies.14.
To put our results into perspective, consider Figure 4 showing the trends in child care coverage andemployment rates of Norwegian mothers with the youngest child between 3 and 6 years old. In the figure,we use the estimate from our baseline specification in Panel (a) in Table 3 to draw the predicted maternalemployment rate from the increase over time in child care coverage since 1972. Although our estimatedchild care effect may not be externally valid for later periods, Figure 4 at least serves as an illustration ofhow little the introduction of subsidized, universally accessible child care in Norway can explain of the rapidgrowth in maternal employment in the late 1970s. With this caveat in mind, the massive increase of 57percentage points in child care coverage in Norway between 1972 and 1996 can explain less than 4 of the 55percentage points rise in maternal employment over the period, despite the strong correlation. By the sametoken, cross-country differences in child care may only be able to account for a small fraction of the gap inmaternal employment between Norway and other developed countries.
Turning to subsample analysis, we find no evidence of the very small mean impacts of the child careexpansion on maternal employment being an artefact of positive and negative labor supply responses offset-ting each other. Table 4 displays results from equation (1) including controls and municipality-specific fixed
14It is also possible that non-working mothers were taking up some of the new care child care slots. However, survey resultsreported in Leira (1992) suggests that the number of non-working mothers using formal child care did not increase over theperiod 1973-1985
17
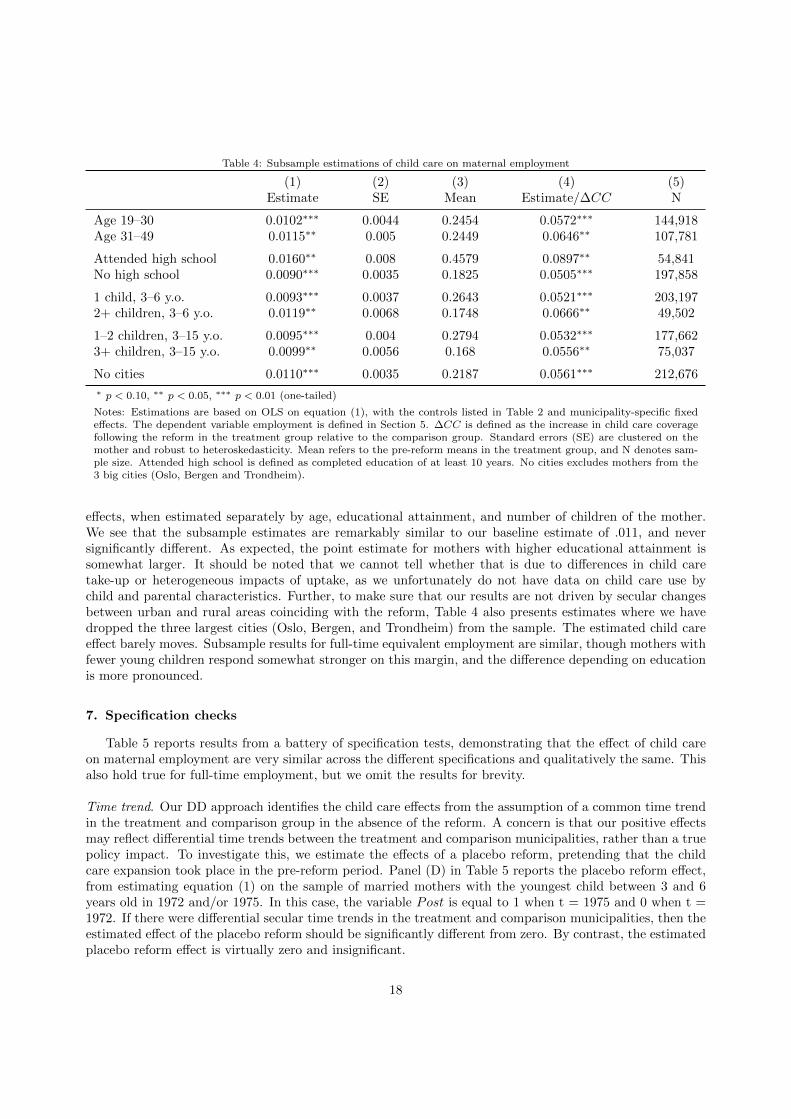
Table 4: Subsample estimations of child care on maternal employment
(1) (2) (3) (4) (5)Estimate SE Mean Estimate/∆CC N
Age 19–30 0.0102∗∗∗ 0.0044 0.2454 0.0572∗∗∗ 144,918Age 31–49 0.0115∗∗ 0.005 0.2449 0.0646∗∗ 107,781
Attended high school 0.0160∗∗ 0.008 0.4579 0.0897∗∗ 54,841No high school 0.0090∗∗∗ 0.0035 0.1825 0.0505∗∗∗ 197,858
1 child, 3–6 y.o. 0.0093∗∗∗ 0.0037 0.2643 0.0521∗∗∗ 203,1972+ children, 3–6 y.o. 0.0119∗∗ 0.0068 0.1748 0.0666∗∗ 49,502
1–2 children, 3–15 y.o. 0.0095∗∗∗ 0.004 0.2794 0.0532∗∗∗ 177,6623+ children, 3–15 y.o. 0.0099∗∗ 0.0056 0.168 0.0556∗∗ 75,037
No cities 0.0110∗∗∗ 0.0035 0.2187 0.0561∗∗∗ 212,676
∗ p < 0.10, ∗∗ p < 0.05, ∗∗∗ p < 0.01 (one-tailed)
Notes: Estimations are based on OLS on equation (1), with the controls listed in Table 2 and municipality-specific fixedeffects. The dependent variable employment is defined in Section 5. ∆CC is defined as the increase in child care coveragefollowing the reform in the treatment group relative to the comparison group. Standard errors (SE) are clustered on themother and robust to heteroskedasticity. Mean refers to the pre-reform means in the treatment group, and N denotes sam-ple size. Attended high school is defined as completed education of at least 10 years. No cities excludes mothers from the3 big cities (Oslo, Bergen and Trondheim).
effects, when estimated separately by age, educational attainment, and number of children of the mother.We see that the subsample estimates are remarkably similar to our baseline estimate of .011, and neversignificantly different. As expected, the point estimate for mothers with higher educational attainment issomewhat larger. It should be noted that we cannot tell whether that is due to differences in child caretake-up or heterogeneous impacts of uptake, as we unfortunately do not have data on child care use bychild and parental characteristics. Further, to make sure that our results are not driven by secular changesbetween urban and rural areas coinciding with the reform, Table 4 also presents estimates where we havedropped the three largest cities (Oslo, Bergen, and Trondheim) from the sample. The estimated child careeffect barely moves. Subsample results for full-time equivalent employment are similar, though mothers withfewer young children respond somewhat stronger on this margin, and the difference depending on educationis more pronounced.
7. Specification checks
Table 5 reports results from a battery of specification tests, demonstrating that the effect of child careon maternal employment are very similar across the different specifications and qualitatively the same. Thisalso hold true for full-time employment, but we omit the results for brevity.
Time trend. Our DD approach identifies the child care effects from the assumption of a common time trendin the treatment and comparison group in the absence of the reform. A concern is that our positive effectsmay reflect differential time trends between the treatment and comparison municipalities, rather than a truepolicy impact. To investigate this, we estimate the effects of a placebo reform, pretending that the childcare expansion took place in the pre-reform period. Panel (D) in Table 5 reports the placebo reform effect,from estimating equation (1) on the sample of married mothers with the youngest child between 3 and 6years old in 1972 and/or 1975. In this case, the variable Post is equal to 1 when t = 1975 and 0 when t =1972. If there were differential secular time trends in the treatment and comparison municipalities, then theestimated effect of the placebo reform should be significantly different from zero. By contrast, the estimatedplacebo reform effect is virtually zero and insignificant.
18
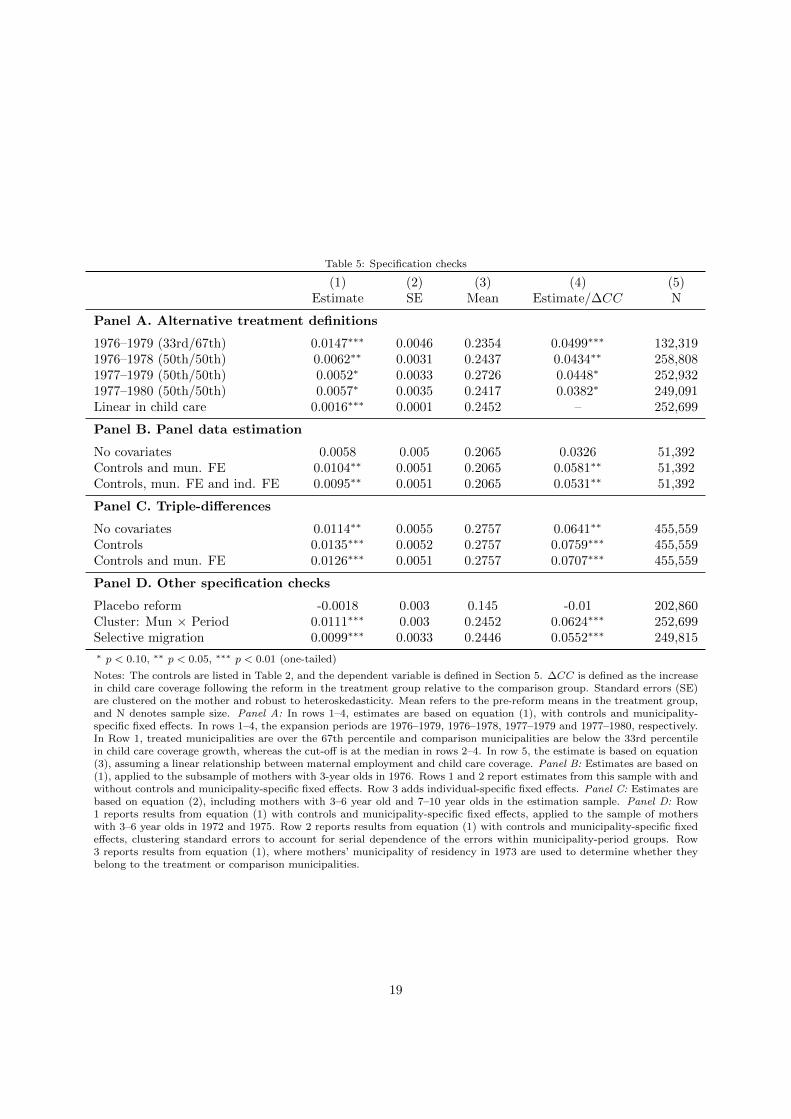
Table 5: Specification checks
(1) (2) (3) (4) (5)Estimate SE Mean Estimate/∆CC N
Panel A. Alternative treatment definitions
1976–1979 (33rd/67th) 0.0147∗∗∗ 0.0046 0.2354 0.0499∗∗∗ 132,3191976–1978 (50th/50th) 0.0062∗∗ 0.0031 0.2437 0.0434∗∗ 258,8081977–1979 (50th/50th) 0.0052∗ 0.0033 0.2726 0.0448∗ 252,9321977–1980 (50th/50th) 0.0057∗ 0.0035 0.2417 0.0382∗ 249,091Linear in child care 0.0016∗∗∗ 0.0001 0.2452 – 252,699
Panel B. Panel data estimation
No covariates 0.0058 0.005 0.2065 0.0326 51,392Controls and mun. FE 0.0104∗∗ 0.0051 0.2065 0.0581∗∗ 51,392Controls, mun. FE and ind. FE 0.0095∗∗ 0.0051 0.2065 0.0531∗∗ 51,392
Panel C. Triple-differences
No covariates 0.0114∗∗ 0.0055 0.2757 0.0641∗∗ 455,559Controls 0.0135∗∗∗ 0.0052 0.2757 0.0759∗∗∗ 455,559Controls and mun. FE 0.0126∗∗∗ 0.0051 0.2757 0.0707∗∗∗ 455,559
Panel D. Other specification checks
Placebo reform -0.0018 0.003 0.145 -0.01 202,860Cluster: Mun × Period 0.0111∗∗∗ 0.003 0.2452 0.0624∗∗∗ 252,699Selective migration 0.0099∗∗∗ 0.0033 0.2446 0.0552∗∗∗ 249,815
∗ p < 0.10, ∗∗ p < 0.05, ∗∗∗ p < 0.01 (one-tailed)
Notes: The controls are listed in Table 2, and the dependent variable is defined in Section 5. ∆CC is defined as the increasein child care coverage following the reform in the treatment group relative to the comparison group. Standard errors (SE)are clustered on the mother and robust to heteroskedasticity. Mean refers to the pre-reform means in the treatment group,and N denotes sample size. Panel A: In rows 1–4, estimates are based on equation (1), with controls and municipality-specific fixed effects. In rows 1–4, the expansion periods are 1976–1979, 1976–1978, 1977–1979 and 1977–1980, respectively.In Row 1, treated municipalities are over the 67th percentile and comparison municipalities are below the 33rd percentilein child care coverage growth, whereas the cut-off is at the median in rows 2–4. In row 5, the estimate is based on equation(3), assuming a linear relationship between maternal employment and child care coverage. Panel B: Estimates are based on(1), applied to the subsample of mothers with 3-year olds in 1976. Rows 1 and 2 report estimates from this sample with andwithout controls and municipality-specific fixed effects. Row 3 adds individual-specific fixed effects. Panel C: Estimates arebased on equation (2), including mothers with 3–6 year old and 7–10 year olds in the estimation sample. Panel D: Row1 reports results from equation (1) with controls and municipality-specific fixed effects, applied to the sample of motherswith 3–6 year olds in 1972 and 1975. Row 2 reports results from equation (1) with controls and municipality-specific fixedeffects, clustering standard errors to account for serial dependence of the errors within municipality-period groups. Row3 reports results from equation (1), where mothers’ municipality of residency in 1973 are used to determine whether theybelong to the treatment or comparison municipalities.
19
Nevertheless, our estimates could be biased if treatment municipalities initiated other policies (that weare unaware of) or experienced different economic fluctuation (that are not fully accounted for by the localemployment rates) at the same time as the child care reform. To pick up such time-varying effects specificto the treatment area, equation (2) adds mothers with the youngest child just above the child care age (7 to10 years old) as a second comparison group. It is heartening to find in Panel (C) in Table 5 that this triple-difference approach produces very similar estimates of the child care effects on maternal employment. Thisholds true when we estimate the DDD regression without any covariates, with controls, and with controlsand municipality-specific fixed effects.
Clustering. To account for the fact that the variation in the data we use to estimate the child care effects is atthe municipality-period level, Row (2) in Table 5 reports results from our baseline specification, clusteringthe standard errors at this level. By doing so, we allow for period-specific shocks that are common tomothers who live in the same municipality. We find that accounting for dependence within municipality–period groups does not increase our estimated standard errors much, and the significance levels of the resultsare very similar.15
Selective migration. Although location decisions based on unobservable characteristics may affect our esti-mates, the direction of the bias is not obvious.16 On the one hand, mothers inclined to work may be morelikely to move to municipalities with high child care coverage rates. On the other hand, mothers unwillingto work because they have children who need special attention or supervision, may be more inclined to moveto municipalities with good access to child care. Though recent empirical work finds little support for suchTiebout sorting across states or municipalities according to public good provision like school quality,17 wetake several steps to avoid that selective migration of mothers into treatment and comparison municipalitiesconfounds our results.
To address the concern for in-migration induced by the reform, we excluded in our main analysis mothersthat move between treatment and comparison municipalities from 1976 to 1979. In addition, we control forrelocation between municipalities within the treatment and comparison areas, respectively; We have alsoperformed all estimations excluding mothers that relocate, and the results are unchanged. However, onecould argue that even the sample of stayers is selective, as out-migration could be endogenous to the childcare expansion. To address this issue, we use the mothers’ municipality of residency in 1973 to determinewhether they belong to treatment or comparison municipalities. Panel (D) shows that the effects of the childcare expansion on maternal employment is robust to using municipality of residency several years beforethe reform to determine treatment status. This finding conforms well with the results from Hægeland et al.(2008), which suggest that school quality matters little, if anything, for location decisions in Norway.
Alternative treatment definitions. In our baseline specification, we define the treatment and comparisonareas by ordering municipalities according to the increase in child care coverage rate in the period 1976–1979, and then separating them at the median. In Panel (A) in Table 5, we make sure that our results arenot artifacts of this choice of treatment definition. As the expansion in child care varies across treatmentdefinition we need to focus on Column (4), showing the percentage points increase in maternal employmentper percentage point increase in the child care coverage rate.
In the first row of Panel (A), we use the same time-interval, but divide the sample at the 33rd and 67thpercentiles of child care growth. Municipalities below the lower threshold are in the comparison group, whilethose above the upper threshold are in the treatment group. Mothers residing in municipalities betweenthe two thresholds are excluded from the sample used for estimation. In the three next rows, we define the
15Bertrand et al. (2004) show that the standard errors in DD regressions may be misstated if there is serial correlation inthe municipality-period shocks. As their analysis demonstrates, we reduce the problem of serial correlation considerably bycollapsing the time-series dimension into two periods: before and after the reform.
16Note that families living on the municipal borders could not take advantage of the child care expansion in neighboringmunicipalities without relocating, since eligibility was based on municipality of residency.
17See e.g. Rhode and Strumpf (2003) who find little support for Tiebout sorting across municipalities and counties usingabout 150 years of data.
20
treatment and comparison status according to the median child care growth, but alter the time-interval. Forexample, the second row takes 1978 to be the post-reform period. Our findings show that the percentagepoints increase in maternal employment per percentage point increase in the child care coverage rate is quitesimilar across treatment definitions. More importantly, the results confirm the picture of almost no effect ofthe introduction of subsidized, universally accessible child care on maternal employment.
To sidestep the issue of how to draw the line between treatment and comparison municipalities weestimate equation (3), where maternal employment is regressed on child care coverage in each municipality,controlling for time-specific and municipality-specific fixed effects as well as the set of controls. The lastrow in Panel (A) reports the child care estimate from this regression, suggesting less than a .002 percentagepoints increase in maternal employment rate per percentage point increase in child care coverage. Thisconfirms the picture of hardly any child care effect.
Panel data estimation. In this final specification test, we restrict our sample to mothers whose youngestchild is 3 years old in 1976, observed both before and after the reform with a child in child care age. Thisremoves biases due to unobserved compositional changes over time within the treatment group. By includingindividual-specific fixed effects, we also eliminate biases owing to permanent unobserved differences betweenmothers residing in treatment and comparison areas. The child care effect is then identified from changesin the employment rate of the same mothers over time, experiencing different exposure to child care in thedifferent periods. Panel (B) in Table 5 shows that these specification checks barely move the estimated childcare effects on maternal employment.
8. Concluding remarks
There is a heated debate in the US and Canada, as well as in many European countries, about a movetowards subsidized universally accessible child care or pre-school. Advocates of such policies have arguedthat good access to affordable child care is important to facilitate female labor force participation and lowerwelfare dependency. Indeed, generous child care policies are regularly proposed as a key determinant both ofcross country differences in maternal employment (see e.g. Jaumotte, 2003; Del Boca, 2002; Aaberge et al.2005), and of its dramatic growth over the last decades (see e.g. Attanasio et al., 2008). Our finding of hardlyany causal effect of child care on maternal employment, suggests that we need to be cautious when makingsuch a conclusion. Instead of increasing mothers’ labor supply, the introduction of subsidized, universallyaccessible child care in Norway mostly crowded out informal care arrangements, implying a significant netcost of the child care subsidies. Our study therefore serves as an illustration of how publicly funded servicesreplace what would have been purchased in other, more decentralized ways, and without the associated taxburdens.
Apparently, our results also provide empirical support to Rosen’s (1996) controversial and widely dis-cussed claim that the child care subsidies in Scandinavian countries are too large. However, the debate onuniversal child care systems cannot be restricted to an analysis of labor market responses to changes inwork incentives; other considerations also come into play. In particular, recent research from a number offields suggests that investments in early childhood have high returns, especially for disadvantaged children(Knudsen et al., 2006). On this background, Currie (2001) argues that governments should aim to equalizeinitial endowments through early childhood development, rather than compensate for differences in out-comes later in life. The role of governments in facilitating child development is particularly important, bothfrom positions on equity and efficiency, if families under-invest in early childhood due to market failuressuch as liquidity constraints, information failures, and externalities (Gaviria, 2002). Havnes and Mogstad(2009) study the same child care reform as we do, but address the impact on children’s long-run outcomes.The results obtained in this analysis suggest that universally accessible child care improves the long-runprospects of children considerably, echoing previous evidence from intensive early intervention programs inthe US that were targeting particularly disadvantaged children (see e.g. Karoly et al., 2005). Consequently,we cannot conclude that the child care subsidies offered in Scandinavian countries are too large, but thepivotal argument must rely on other aspects than increased maternal employment, such as improved childdevelopment.
21

Acknowledgements
Thanks to Rolf Aaberge, Erling Barth, Nabanita Datta Gupta, Hilary Hoynes, Halvor Mehlum, KalleMoene, Mari Rege, Terje Skjerpen, Mark Votruba, and a number of seminar and conference participantsfor useful comments and suggestions. Financial support from the Norwegian Research Council (194339)is gratefully acknowledged. The project is also part of the research activities at the ESOP center at theDepartment of Economics, University of Oslo. ESOP is supported by The Research Council of Norway.
22

[1] Aaberge, R., U. Colombino, D. D. Boca, J. Ermisch, M. Francesconi, S. Pasqua, and S. Strøm (2005): “Part II:Women’s Participation in the Labor Market and Fertility: The Effects of Social Policies,” in Labor Market Participationand Fertility of Women: the Effect of Social Policies, ed. by T. Boeri, D. Del Boca, and C. Pissarides, pp. 121–264. OxfordUniversity Press, UK.
[2] Angrist, J. D. (2001): “Estimations of Limited Dependent Variable Models with Dummy Endogenous Regressors: SimpleStrategies for Empirical Practice: Reply,” Journal of Business & Economic Statistics, 19(1), 27–28.
[3] Atkinson, A. B., L. Rainwater, and T. M. Smeeding (1995): Income distribution in OECD countries : evidence fromthe Luxembourg Income Study. OECD Publications and Information Center, Paris.
[4] Attanasio, O., H. Low, and V. Sanchez-Marcos (2008): “Explaining Changes in Female Labor Supply in a Life-CycleModel,” American Economic Review, 98(4), 1517–1552.
[5] Baker, M., J. Gruber, and K. Milligan (2008): “Universal Child Care, Maternal Labor Supply, and Family Well-Being,”Journal of Political Economy, 116(4), 709–745.
[6] Berg, P. (2005): “Ulik respons pa fraflytting og sentralisering,” Statistiske Analyser 69, Statistics Norway.[7] Berlinski, S., and S. Galiani (2007): “The effect of a large expansion of pre-primary school facilities on preschool
attendance and maternal employment,” Labour Economics, 14(3), 665–680.[8] Bertrand, M., E. Duflo, and S. Mullainathan (2004): “How Much Should We Trust Differences-in-Differences Esti-
mates?,” The Quarterly Journal of Economics, 119(1), 249–275.[9] Besley, T., and A. Case (2000): “Unnatural Experiments? Estimating the Incidence of Endogenous Policies,” Economic
Journal, 110(467), F672–F694.[10] Blau, D. M., and J. Currie (2006): “Pre-School, Day Care, and After-School Care: Who’s Minding the Kids?,” in
Handbook of the Economics of Education, ed. by E. A. Hanushek, and F. Welch, vol. 2, pp. 1163–1278. Elsevier.[11] Blau, D. M., and P. K. Robins (1988): “Child-Care Costs and Family Labor Supply,” The Review of Economics and
Statistics, 70(3), 374–381.[12] Boeri, T., D. Del Boca, and C. Pissarides (eds.) (2005): Labor Market Participation and Fertility of Women: the
Effect of Social Policies. Oxford University Press, UK.[13] Cascio, E. (2006): “Public Preschool and Maternal Labor Supply: Evidence from the Introduction of Kindergartens into
American Public Schools,” Discussion Paper 05, University of Kentucky Center for Poverty Research.[14] (2009): “Maternal Labor Supply and the Introduction of Kindergartens into American Public Schools,” Journal
of Human Resources, 44, 140–170.[15] Connelly, R. (1992): “The Effect of Child Care Costs on Married Women’s Labor Force Participation,” The Review of
Economics and Statistics, 74(1), 83–90.[16] Currie, J. (2001): “Early Childhood Education Programs,” Journal of Economic Perspectives, 15(2), 213–238.[17] Del Boca, D. (2002): “The Effect of Child Care and Part Time Opportunities on Participation and Fertility Decisions
in Italy,” Journal of Population Economics, 15, 549–573.[18] Dolado, J. J., F. Felgueroso, and J. F. Jimeno (2001): “Female employment and occupational changes in the 1990s:
How is the EU performing relative to the US?,” European Economic Review, 45, 875–889.[19] EU (2002): “Presidency Conclusions,” Barcelona European Council 15 and 16 March 2002, Barcelona.[20] Gaviria, A. (2002): “Intergenerational mobility, sibling inequality and borrowing constraints,” Economics of Education
Review, 21(4), 331–340.[21] Gelbach, J. B. (2002): “Public Schooling for Young Children and Maternal Labor Supply,” American Economic Review,
92(1), 307–322.[22] Gulbrandsen, L., J. A. Lea, and S. Stokke (1982): “Barnetilsyn hos smabarnsfamilier: presentasjon av data fra en
survey-undersøkelse blant smabarnsforeldre i Oslo høsten 1981,” INAS notat 82:13, Institutt for anvendt sosialvitenskapeligforskning, Oslo.
[23] Havnes, T., and M. Mogstad (2009): “No Child Left Behind. Universal Child Care and Children’s Long-Run Outcomes,”Discussion Papers 582, Statistics Norway.
[24] Heckman, J., H. Ichimura, J. Smith, and P. Todd (1998): “Characterizing Selection Bias Using Experimental Data,”Econometrica, 66(5), 1017–1098.
[25] Heckman, J. J. (1974): “Effects of Child-Care Programs on Women’s Work Effort,” Journal of Political Economy, 82(2),S136–S163.
[26] Hægeland, T., O. Raaum, and K. G. Salvanes (2008): “Pennies from Heaven? Using Exogeneous Tax Variation toIdentify Effects of School Resources on Pupil Achievements,” IZA Discussion Papers 3561, Institute for the Study of Labor(IZA).
[27] Imbens, G. W., and J. M. Wooldridge (2009): “Recent Developments in the Econometrics of Program Evaluation,”Journal of Economic Literature, 47(1), 5–86.
[28] Jaumotte, F. (2003): “Female Labour Force Participation: Past Trends and Main Determinants in OECD Countries,”OECD Economics Department Working Papers 376, OECD Economics Department.
[29] Karoly, L. A., M. R. Kilburn, and J. S. Cannon (2005): Early Childhood Interventions: Proven Results, FuturePromise. RAND Corporation, Santa Monica, CA.
[30] Kimmel, J. (1998): “Child Care Costs as a Barrier to Employment for Single and Married Mothers,” The Review ofEconomics and Statistics, 80(2), 287–299.
[31] Knudsen, E. I., J. J. Heckman, J. L. Cameron, and J. P. Shonkoff (2006): “Economic, neurobiological, and behavioralperspectives on building America’s future workforce,” Proceedings of the National Academy of Sciences, 103(27), 10155–10162.
[32] Kornstad, T., and T. O. Thoresen (2007): “A discrete choice model for labor supply and childcare,” Journal of
23

Population Economics, 20(4), 781–803.[33] Lefebvre, P., and P. Merrigan (2008): “Child-Care Policy and the Labor Supply of Mothers with Young Children: A
Natural Experiment from Canada,” Journal of Labor Economics, 26(3), 519–548.[34] Leira, A. (1992): Welfare States and Working Mothers. Cambridge University Press.[35] Lundin, D., E. Mork, and B. Ockert (2008): “How far can reduced childcare prices push female labour supply?,”
Labour Economics, 15(4), 647–659.[36] Michalopoulos, C., P. K. Robins, and I. Garfinkel (1992): “A Structural Model of Labor Supply and Child Care
Demand,” Journal of Human Resources, 27(1), 166–203.[37] NOU (1972:39): “Preschools,” White paper, Ministry of children’s and family affairs.[38] Rhode, P. W., and K. S. Strumpf (2003): “Assessing the Importance of Tiebout Sorting: Local Heterogeneity from
1850 to 1990,” American Economic Review, 93(5), 1648–1677.[39] Rosen, S. (1996): “Public Employment and the Welfare State in Sweden,” Journal of Economic Literature, XXXIV,
729–740.[40] Schlosser, A. (2005): “Public Preschool and the Labor Supply of Arab Mothers: Evidence from a Natural Experiment,”
Discussion paper, Dept. of Economics, The Hebrew University of Jerusalem.
24
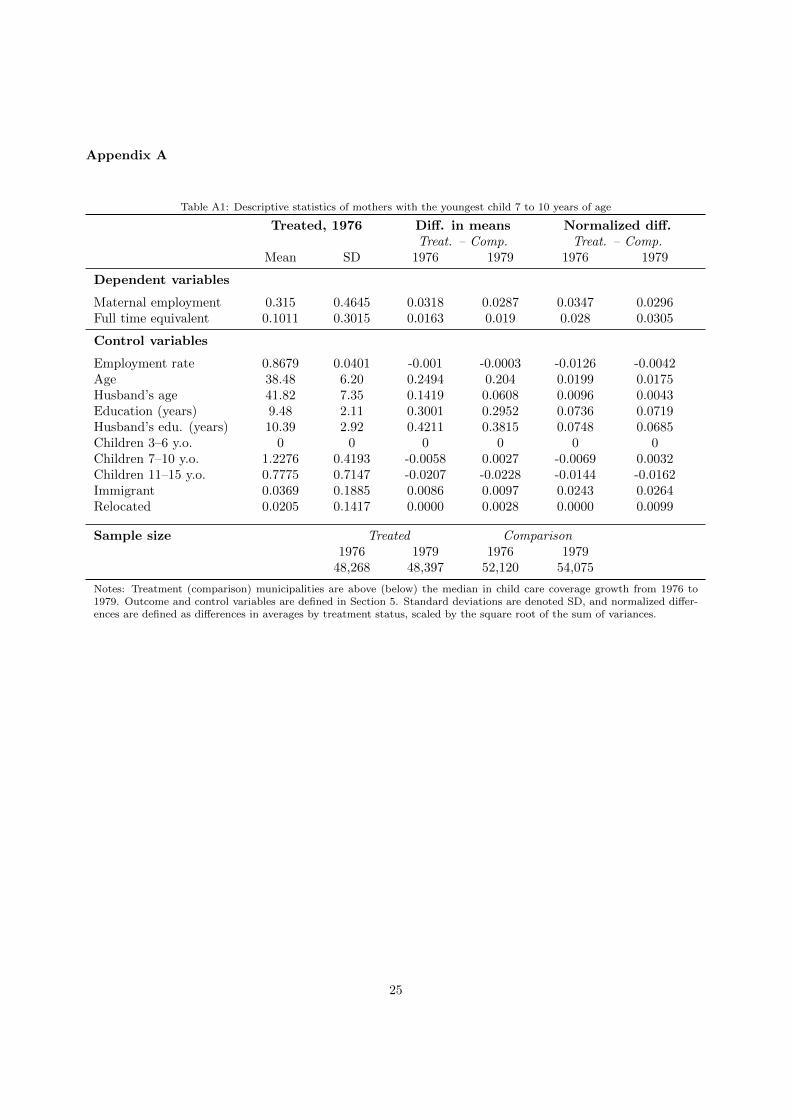
Appendix A
Table A1: Descriptive statistics of mothers with the youngest child 7 to 10 years of age
Treated, 1976 Diff. in means Normalized diff.Treat. – Comp. Treat. – Comp.
Mean SD 1976 1979 1976 1979
Dependent variables
Maternal employment 0.315 0.4645 0.0318 0.0287 0.0347 0.0296Full time equivalent 0.1011 0.3015 0.0163 0.019 0.028 0.0305
Control variables
Employment rate 0.8679 0.0401 -0.001 -0.0003 -0.0126 -0.0042Age 38.48 6.20 0.2494 0.204 0.0199 0.0175Husband’s age 41.82 7.35 0.1419 0.0608 0.0096 0.0043Education (years) 9.48 2.11 0.3001 0.2952 0.0736 0.0719Husband’s edu. (years) 10.39 2.92 0.4211 0.3815 0.0748 0.0685Children 3–6 y.o. 0 0 0 0 0 0Children 7–10 y.o. 1.2276 0.4193 -0.0058 0.0027 -0.0069 0.0032Children 11–15 y.o. 0.7775 0.7147 -0.0207 -0.0228 -0.0144 -0.0162Immigrant 0.0369 0.1885 0.0086 0.0097 0.0243 0.0264Relocated 0.0205 0.1417 0.0000 0.0028 0.0000 0.0099
Sample size Treated Comparison1976 1979 1976 1979
48,268 48,397 52,120 54,075
Notes: Treatment (comparison) municipalities are above (below) the median in child care coverage growth from 1976 to1979. Outcome and control variables are defined in Section 5. Standard deviations are denoted SD, and normalized differ-ences are defined as differences in averages by treatment status, scaled by the square root of the sum of variances.
25
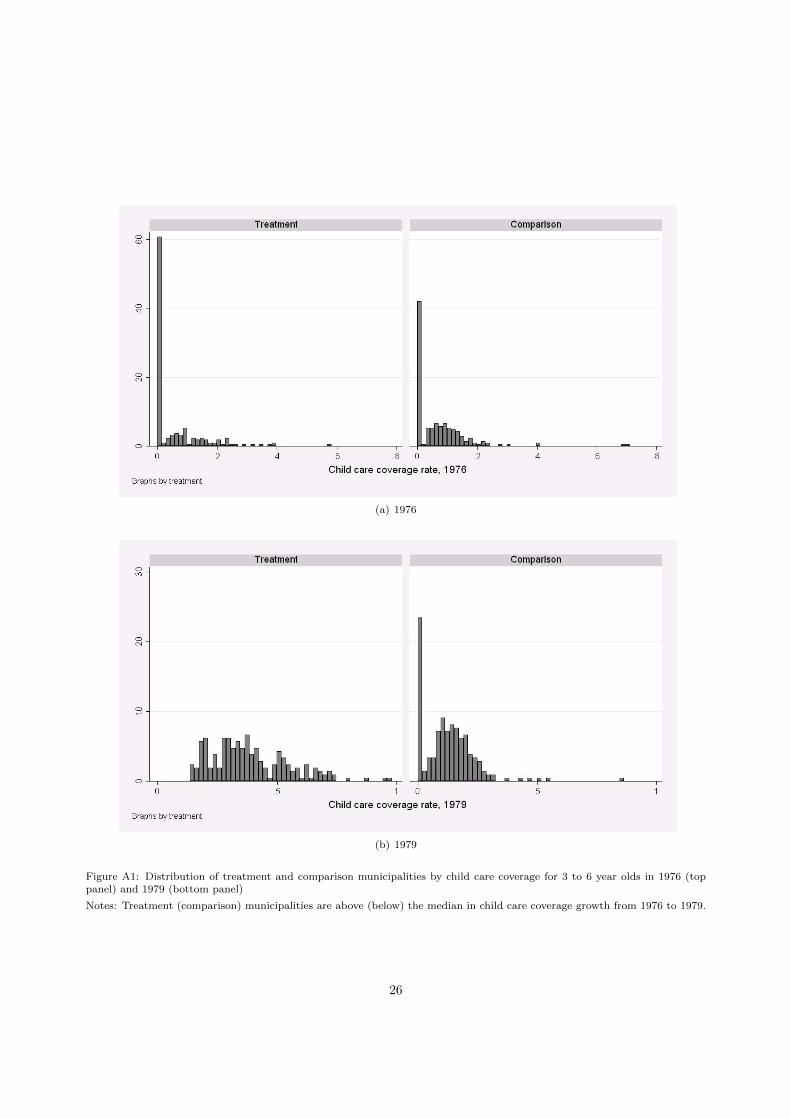
(a) 1976
(b) 1979
Figure A1: Distribution of treatment and comparison municipalities by child care coverage for 3 to 6 year olds in 1976 (toppanel) and 1979 (bottom panel)
Notes: Treatment (comparison) municipalities are above (below) the median in child care coverage growth from 1976 to 1979.
26
Table A2: DD-estimations with control variables as dependent variables
(1) (2) (3) (4) (5)Estimate SE Mean Estimate/∆CC N
Employment rate 0.0008∗∗∗ 0.0001 0.8682 0.0045∗∗∗ 252,699Age -0.0043 0.0239 32.3014 -0.0239 252,699Husband’s age 0.0314 0.0305 35.1704 0.1759 252,625Education (years) -0.0114 0.0135 9.8928 -0.0637 250,163Husband’s edu. (years) -0.0019 0.0178 10.5964 -0.0108 250,088Children 7–10 y.o. -0.0110∗∗∗ 0.0045 0.5919 -0.0617∗∗∗ 252,699Children 11–15 y.o. -0.0079∗∗ 0.0041 0.3481 -0.0443∗∗ 252,699Immigrant 0.0017 0.0015 0.0387 0.0097 252,699Relocated 0.0041∗∗∗ 0.0016 0.0455 0.0231∗∗∗ 252,699
∗ p < 0.10, ∗∗ p < 0.05, ∗∗∗ p < 0.01 (one-tailed)
Notes: Estimations are based on OLS on equation (1), with controls listed in Table 2 and municipality-specific fixed effects,excluding the dependent variable from the set of controls. The full sample consists of 252,699 married mothers with theyoungest child aged 3–6 years. Missing observations of the dependent variable are excluded from each estimation. ∆CC isdefined as the increase in child care coverage following the reform in the treatment group relative to the comparison group.Mean refers to the pre-reform means in the treatment group. Standard errors (SE) are clustered on the mother and robustto heteroskedasticity.
27
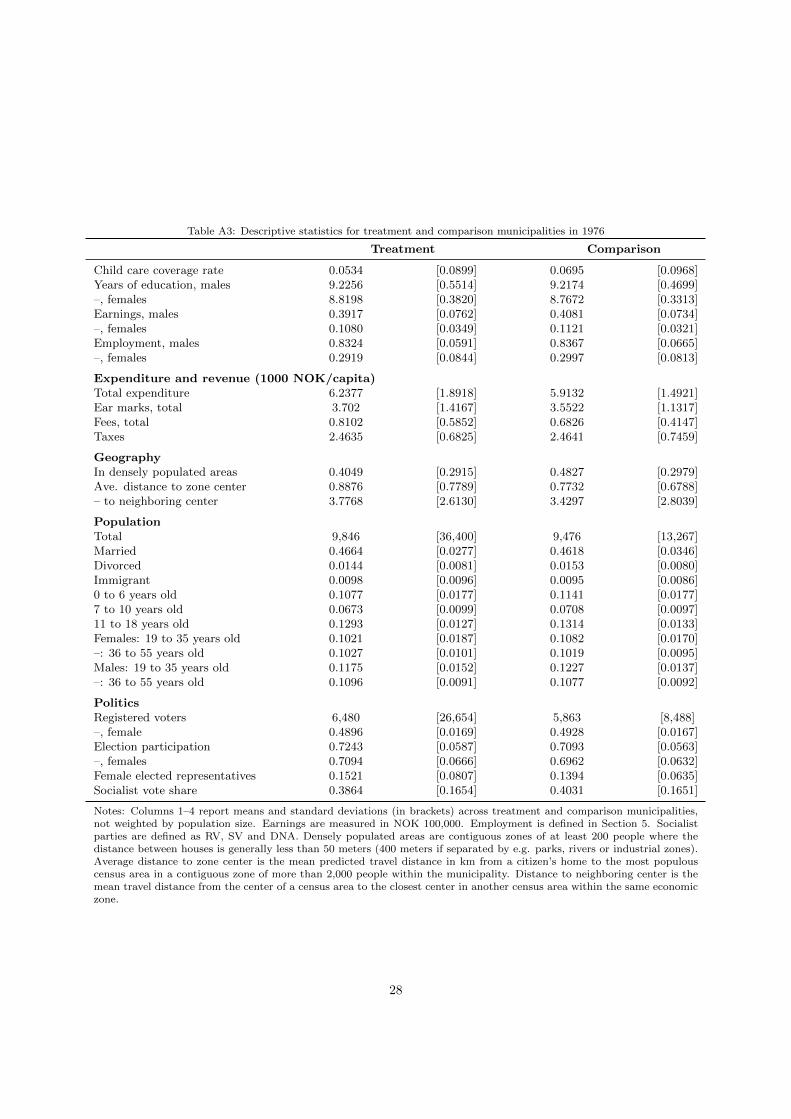
Table A3: Descriptive statistics for treatment and comparison municipalities in 1976
Treatment Comparison
Child care coverage rate 0.0534 [0.0899] 0.0695 [0.0968]Years of education, males 9.2256 [0.5514] 9.2174 [0.4699]–, females 8.8198 [0.3820] 8.7672 [0.3313]Earnings, males 0.3917 [0.0762] 0.4081 [0.0734]–, females 0.1080 [0.0349] 0.1121 [0.0321]Employment, males 0.8324 [0.0591] 0.8367 [0.0665]–, females 0.2919 [0.0844] 0.2997 [0.0813]
Expenditure and revenue (1000 NOK/capita)Total expenditure 6.2377 [1.8918] 5.9132 [1.4921]Ear marks, total 3.702 [1.4167] 3.5522 [1.1317]Fees, total 0.8102 [0.5852] 0.6826 [0.4147]Taxes 2.4635 [0.6825] 2.4641 [0.7459]
GeographyIn densely populated areas 0.4049 [0.2915] 0.4827 [0.2979]Ave. distance to zone center 0.8876 [0.7789] 0.7732 [0.6788]– to neighboring center 3.7768 [2.6130] 3.4297 [2.8039]
PopulationTotal 9,846 [36,400] 9,476 [13,267]Married 0.4664 [0.0277] 0.4618 [0.0346]Divorced 0.0144 [0.0081] 0.0153 [0.0080]Immigrant 0.0098 [0.0096] 0.0095 [0.0086]0 to 6 years old 0.1077 [0.0177] 0.1141 [0.0177]7 to 10 years old 0.0673 [0.0099] 0.0708 [0.0097]11 to 18 years old 0.1293 [0.0127] 0.1314 [0.0133]Females: 19 to 35 years old 0.1021 [0.0187] 0.1082 [0.0170]–: 36 to 55 years old 0.1027 [0.0101] 0.1019 [0.0095]Males: 19 to 35 years old 0.1175 [0.0152] 0.1227 [0.0137]–: 36 to 55 years old 0.1096 [0.0091] 0.1077 [0.0092]
PoliticsRegistered voters 6,480 [26,654] 5,863 [8,488]–, female 0.4896 [0.0169] 0.4928 [0.0167]Election participation 0.7243 [0.0587] 0.7093 [0.0563]–, females 0.7094 [0.0666] 0.6962 [0.0632]Female elected representatives 0.1521 [0.0807] 0.1394 [0.0635]Socialist vote share 0.3864 [0.1654] 0.4031 [0.1651]
Notes: Columns 1–4 report means and standard deviations (in brackets) across treatment and comparison municipalities,not weighted by population size. Earnings are measured in NOK 100,000. Employment is defined in Section 5. Socialistparties are defined as RV, SV and DNA. Densely populated areas are contiguous zones of at least 200 people where thedistance between houses is generally less than 50 meters (400 meters if separated by e.g. parks, rivers or industrial zones).Average distance to zone center is the mean predicted travel distance in km from a citizen’s home to the most populouscensus area in a contiguous zone of more than 2,000 people within the municipality. Distance to neighboring center is themean travel distance from the center of a census area to the closest center in another census area within the same economiczone.
28

Table A4: Estimates of the effect of child care on various income thresholds
(1) (2) (3) (4) (5)Estimate SE Mean Estimate/∆CC N
Earnings > 1BA 0.0063** 0.0035 0.3619 0.0351** 252,699Earnings > 2BA 0.0111*** 0.0031 0.2452 0.0624*** 252,699Earnings > 3BA 0.0148*** 0.0025 0.153 0.0829*** 252,699Earnings > 4BA 0.0092*** 0.002 0.0888 0.0518*** 252,699Earnings > 6BA 0.0019*** 0.0008 0.016 0.0109*** 252,699Earnings > 8BA 0.0003 0.0004 0.0032 0.0019 252,699
∗ p < 0.10, ∗∗ p < 0.05, ∗∗∗ p < 0.01 (one-tailed)
Notes: Estimations are based on OLS on equation (1), with controls listed in Table 2 and municipality-specific fixed effects.The full sample consists of 252,699 married mothers with the youngest child aged 3–6 years. ∆ is defined as the increase inchild care coverage following the reform in the treatment group relative to the comparison group. Mean refers to the pre-reform means in the treatment group. Standard errors (SE) are clustered on the mother and robust to heteroskedasticity.BA refers to basic amounts, defined in Section 5. In 2006, one basic amount is about USD 10,500 in annual earnings.
29

Figure A2: Geographical location of treatment (white) and comparison (dark) municipalities
30