Embed Size (px)
Citation preview

RCI INFORMATION PACK 5
JUNE 2013 • ISSUE NO. 2
MONETARY, FINANCIAL, AND TRADE INDICATORS
CONTENTS
At a Glance:
GDP growth in advanced economies improved in the first quarter…
…with G3 equity markets outperforming emerging markets
GDP growth in Asia was mixed…
…even as Asian equities joined the G3 market rally
Growth in remittance inflows to developing Asia mostly slowed in the quarter
Asian central banks began to cut rates to boost growth…
…as Asia's exports and import growth slowed…
…and inflation risks in the region remained subdued
Asian currency movements were also mixed…
…while bank lending in most developing Asian economies remained above 10%
Vulnerability indicators for most countries climbed above their long-term average
GLOBAL MARKETS .Equity Indexes—eurozone, Japan, and the United States .Equity Indexes—Emerging Markets—G3 and MECI .Commodity Price Indexes .Exchange Rate Indexes—euro and yen
FINANCIAL INDICATORS Equity Indexes .ASEAN-4 plus Viet Nam .Kazakhstan
.NIEs and People’s Republic of China .South Asia
Remittances .Inward Remittances—Southeast Asia .Inward Remittances—South Asia .Inward Remittances from the Middle East—Bangladesh,
Pakistan, and the Philippines .Outward Remittances—Kazakhstan
MONETARY INDICATORS Exchange Rate Indexes .ASEAN-4 plus Viet Nam .Kazakhstan .NIEs and People’s Republic of China .South Asia
Headline Inflation .ASEAN-4 plus Viet Nam
.Central Asia .NIEs and People’s Republic of China .South Asia
Policy Rates .ASEAN-4 plus Viet Nam .Central Asia .NIEs and People’s Republic of China .South Asia
6
7
8 9
10
11
Bank Lending.ASEAN-4 plus Viet Nam .Kazakhstan .NIEs and People’s Republic of China .South Asia
OUTPUT INDICATORS Industrial Production .ASEAN-4 plus Viet Nam .Central Asia .NIEs and People’s Republic of China .South Asia
GDP Growth G3 .G3 .US .euro .Japan
GDP Growth Asia .ASEAN-4 .India .NIEs .People’s Republic of China
TRADE LINKAGES Export Growth by Destination .ASEAN-4 .India .NIEs .People’s Republic of China
Import Growth by Origin .ASEAN-4 .India .NIEs .People’s Republic of China
VULNERABILITY INDICATORS .Assessment of Financial Vulnerabilities
.Assessment of External Vulnerabilities
KEY INDICATORS
12
13 14 15 16
17
18 19
20
MONETARY, FINANCIAL, AND TRADE INDICATORS
6 RCI INFORMATION PACK
JUNE 2013 • ISSUE NO. 2
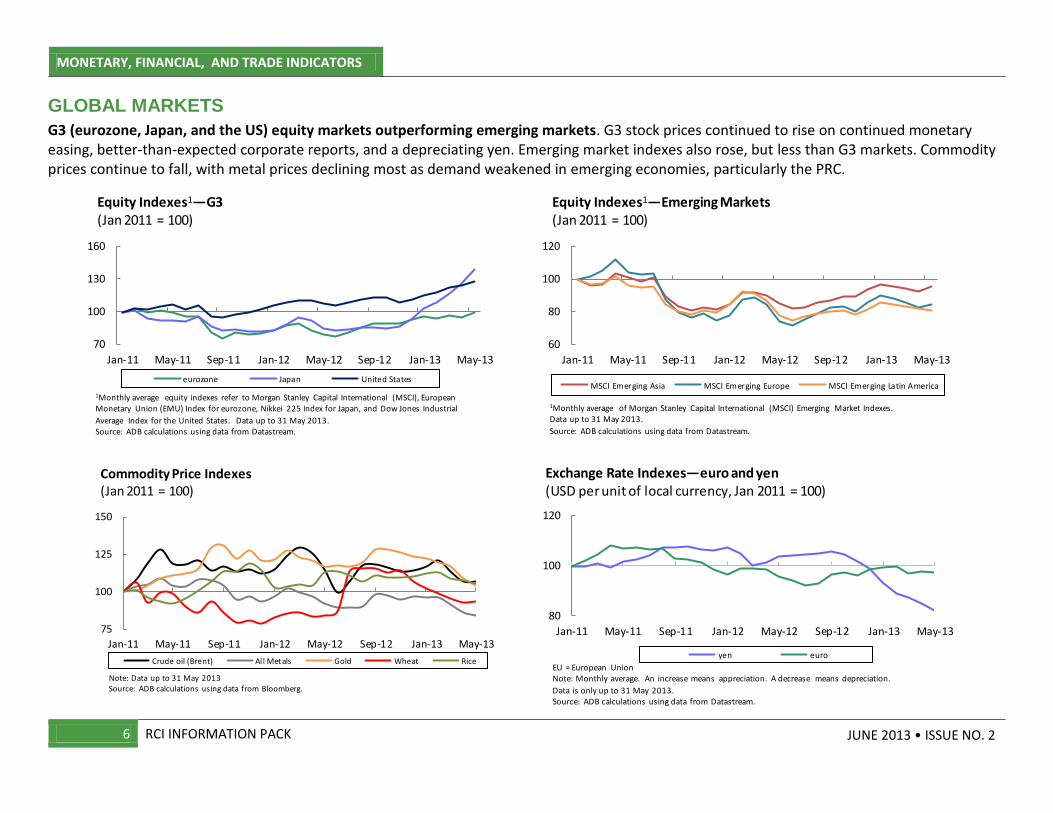
GLOBAL MARKETS
G3 (eurozone, Japan, and the US) equity markets outperforming emerging markets. G3 stock prices continued to rise on continued monetary easing, better-than-expected corporate reports, and a depreciating yen. Emerging market indexes also rose, but less than G3 markets. Commodity prices continue to fall, with metal prices declining most as demand weakened in emerging economies, particularly the PRC.
70
100
130
160
Jan-11 May-11 Sep-11 Jan-12 May-12 Sep-12 Jan-13 May-13
eurozone Japan United States
Equity Indexes1—G3 (Jan 2011 = 100)
1Monthly average equity indexes refer to Morgan Stanley Capital International (MSCI), European Monetary Union (EMU) Index for eurozone, Nikkei 225 Index for Japan, and Dow Jones Industrial
Average Index for the United States. Data up to 31 May 2013.Source: ADB calculations using data from Datastream.
60
80
100
120
Jan-11 May-11 Sep-11 Jan-12 May-12 Sep-12 Jan-13 May-13
MSCI Emerging Asia MSCI Emerging Europe MSCI Emerging Latin America
Equity Indexes1—Emerging Markets(Jan 2011 = 100)
1Monthly average of Morgan Stanley Capital International (MSCI) Emerging Market Indexes. Data up to 31 May 2013.
Source: ADB calculations using data from Datastream.
75
100
125
150
Jan-11 May-11 Sep-11 Jan-12 May-12 Sep-12 Jan-13 May-13
Crude oil (Brent) Al l Metals Gold Wheat Rice
Note: Data up to 31 May 2013Source: ADB calculations using data from Bloomberg.
Commodity Price Indexes (Jan 2011 = 100)
80
100
120
Jan-11 May-11 Sep-11 Jan-12 May-12 Sep-12 Jan-13 May-13
yen euro
EU = European UnionNote: Monthly average. An increase means appreciation. A decrease means depreciation.
Data is only up to 31 May 2013.Source: ADB calculations using data from Datastream.
Exchange Rate Indexes—euro and yen(USD per unit of local currency, Jan 2011 = 100)
REGIONAL ECONOMIC INTEGRATION MONETARY, FINANCIAL, AND TRADE INDICATORS
RCI INFORMATION PACK 7
JUNE 2013 • ISSUE NO. 2
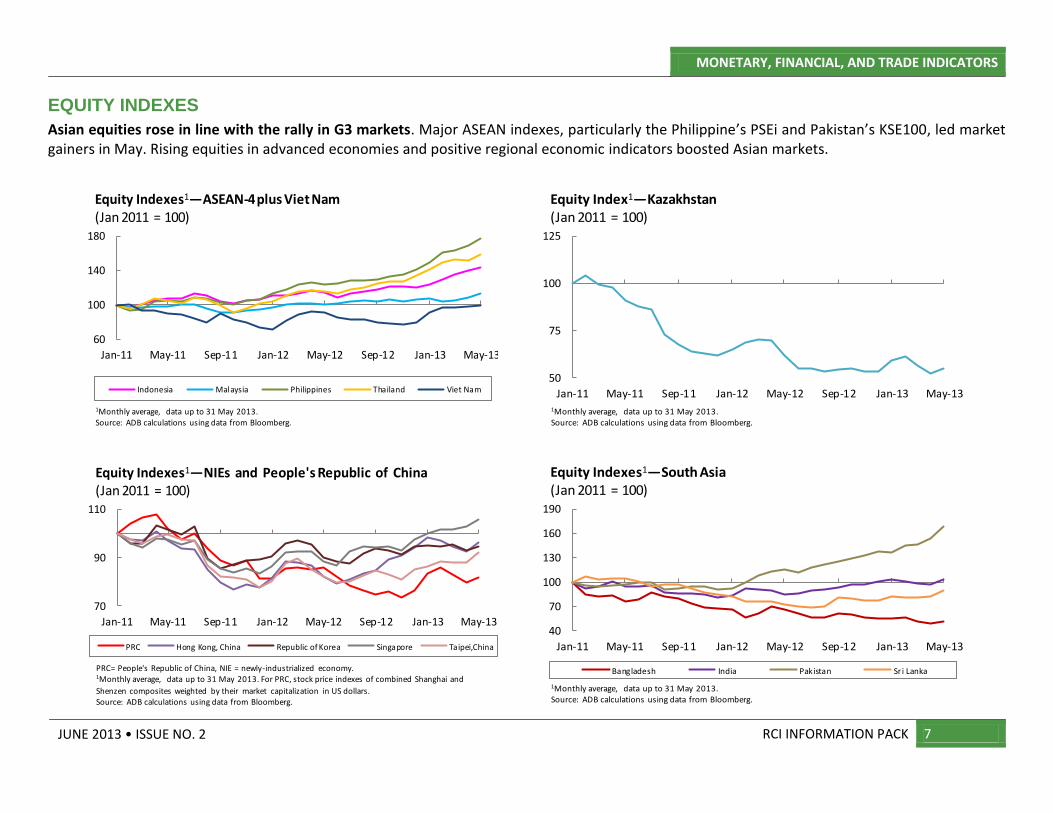
EQUITY INDEXES
Asian equities rose in line with the rally in G3 markets. Major ASEAN indexes, particularly the Philippine’s PSEi and Pakistan’s KSE100, led market gainers in May. Rising equities in advanced economies and positive regional economic indicators boosted Asian markets.
60
100
140
180
Jan-11 May-11 Sep-11 Jan-12 May-12 Sep-12 Jan-13 May-13
Indonesia Malaysia Philippines Thailand Viet Nam
Equity Indexes1—ASEAN-4 plus Viet Nam (Jan 2011 = 100)
1Monthly average, data up to 31 May 2013. Source: ADB calculations using data from Bloomberg.
50
75
100
125
Jan-11 May-11 Sep-11 Jan-12 May-12 Sep-12 Jan-13 May-13
Equity Index1—Kazakhstan (Jan 2011 = 100)
1Monthly average, data up to 31 May 2013. Source: ADB calculations using data from Bloomberg.
70
90
110
Jan-11 May-11 Sep-11 Jan-12 May-12 Sep-12 Jan-13 May-13
PRC Hong Kong, China Republic of Korea Singapore Taipei,China
Equity Indexes1—NIEs and People's Republic of China (Jan 2011 = 100)
PRC= People's Republic of China, NIE = newly-industrialized economy.1Monthly average, data up to 31 May 2013. For PRC, stock price indexes of combined Shanghai and
Shenzen composites weighted by their market capitalization in US dollars. Source: ADB calculations using data from Bloomberg.
40
70
100
130
160
190
Jan-11 May-11 Sep-11 Jan-12 May-12 Sep-12 Jan-13 May-13
Bangladesh India Pakistan Sr i Lanka
Equity Indexes1—South Asia (Jan 2011 = 100)
1Monthly average, data up to 31 May 2013. Source: ADB calculations using data from Bloomberg.

MONETARY, FINANCIAL, AND TRADE INDICATORS REGIONAL ECONOMIC INTEGRATION
8 RCI INFORMATION PACK
JUNE 2013 • ISSUE NO. 2
REMITTANCES
Remittance inflows slowed in South and Southeast Asia during the first quarter. The growth of remittances from the Middle East continued to decline in South Asia, but continues to increase in the Philippines.
-10
0
10
20
30
40
-10
-5
0
5
10
Jan-11 May-11 Sep-11 Jan-12 May-12 Sep-12 Jan-13
Indonesia Philippines Thailand
Inward Remittances—Southeast Asia(y-o-y, %)
RHS = right-hand scale.Notes: Quarterly data for Indonesia. Monthly data for the Philippines and Thailand, based on 3 -month
moving average. Data until February 2013 for Thailand. Source: ADB calculations using data from CEIC and Haver Analytics.
Mar-13
Thailand
-10
10
30
50
Jan-11 Apr-11 Jul-11 Oct-11 Jan-12 Apr-12 Jul-12 Oct-12 Jan-13
Bangladesh India Pakistan Sri Lanka
Apr-13
Inward Remittances—South Asia(y-o-y, %)
Notes: Based on 3-month moving average except for India. Quarterly data for Bangladesh, India, and Pakistan. Monthly data for Sri Lanka. Data until June 2012 for Bangladesh and Pakistan; and
December 2012 for India.Source: ADB calculations using data from CEIC and Haver Analytics.
-20
0
20
40
Jan-11 May-11 Sep-11 Jan-12 May-12 Sep-12 Jan-13
Bangladesh Pakistan Philippines
Feb-13
Inward Remittances from Middle East—Bangladesh, Pakistan, and the Philippines (y-o-y, %)
Notes: Based on 3-month moving averages. Middle East includes Bahrain, Kuwait, Qatar, Saudi Arabia, and United Arab Emirates. Data for the Philippines until January 2013.
Source: ADB calculations using data from CEIC.
-20
0
20
40
60
Mar-11 Jun-11 Sep-11 Dec-11 Mar-12 Jun-12 Sep-12 Dec-12
Outward Remittances—Kazakhstan(y-o-y, %)
Note: Based on quarterly data.Source: ADB calculations using data from CEIC.
REGIONAL ECONOMIC INTEGRATION MONETARY, FINANCIAL, AND TRADE INDICATORS
RCI INFORMATION PACK 9
JUNE 2013 • ISSUE NO. 2
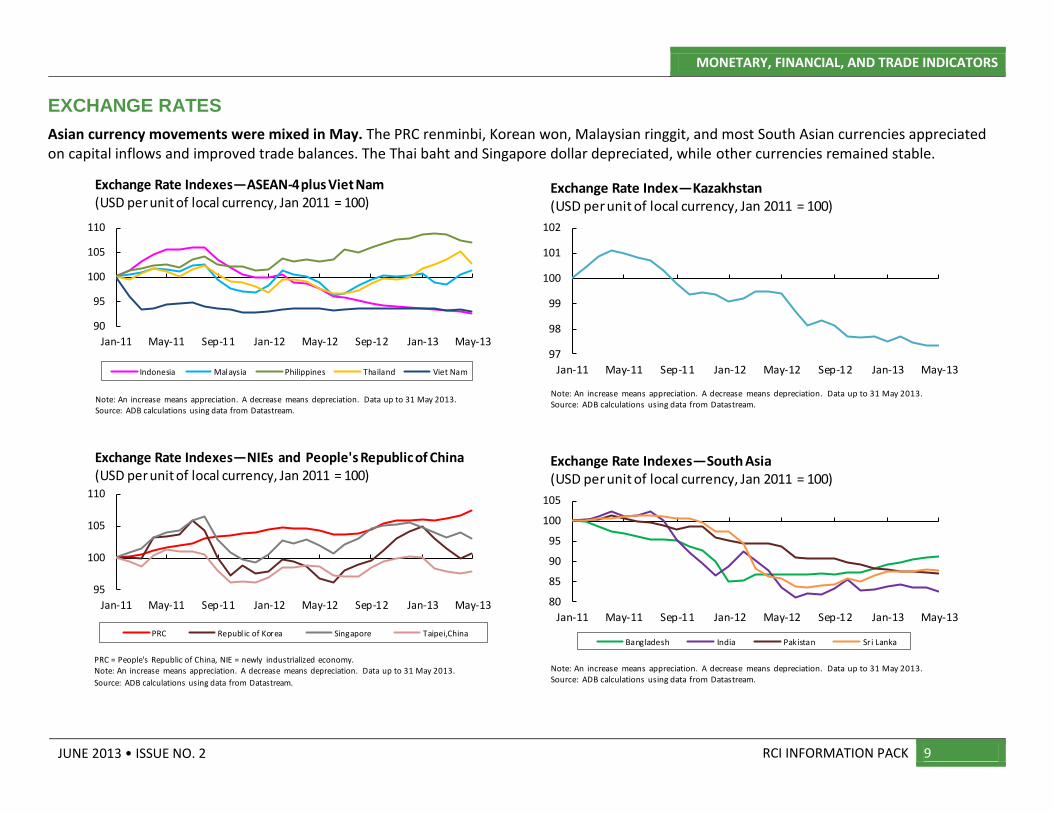
EXCHANGE RATES
Asian currency movements were mixed in May. The PRC renminbi, Korean won, Malaysian ringgit, and most South Asian currencies appreciated on capital inflows and improved trade balances. The Thai baht and Singapore dollar depreciated, while other currencies remained stable.
90
95
100
105
110
Jan-11 May-11 Sep-11 Jan-12 May-12 Sep-12 Jan-13 May-13
Indonesia Malaysia Philippines Thailand Viet Nam
Exchange Rate Indexes—ASEAN-4 plus Viet Nam (USD per unit of local currency, Jan 2011 = 100)
Note: An increase means appreciation. A decrease means depreciation. Data up to 31 May 2013.Source: ADB calculations using data from Datastream.
97
98
99
100
101
102
Jan-11 May-11 Sep-11 Jan-12 May-12 Sep-12 Jan-13 May-13
Exchange Rate Index—Kazakhstan(USD per unit of local currency, Jan 2011 = 100)
Note: An increase means appreciation. A decrease means depreciation. Data up to 31 May 2013.Source: ADB calculations using data from Datastream.
95
100
105
110
Jan-11 May-11 Sep-11 Jan-12 May-12 Sep-12 Jan-13 May-13
PRC Republ ic of Korea Singapore Taipei,China
Exchange Rate Indexes—NIEs and People's Republic of China (USD per unit of local currency, Jan 2011 = 100)
PRC = People's Republic of China, NIE = newly industrialized economy.Note: An increase means appreciation. A decrease means depreciation. Data up to 31 May 2013.
Source: ADB calculations using data from Datastream.
80
85
90
95
100
105
Jan-11 May-11 Sep-11 Jan-12 May-12 Sep-12 Jan-13 May-13
Bangladesh India Pakistan Sr i Lanka
Exchange Rate Indexes—South Asia (USD per unit of local currency, Jan 2011 = 100)
Note: An increase means appreciation. A decrease means depreciation. Data up to 31 May 2013.Source: ADB calculations using data from Datastream.
MONETARY, FINANCIAL, AND TRADE INDICATORS REGIONAL ECONOMIC INTEGRATION
10 RCI INFORMATION PACK
JUNE 2013 • ISSUE NO. 2
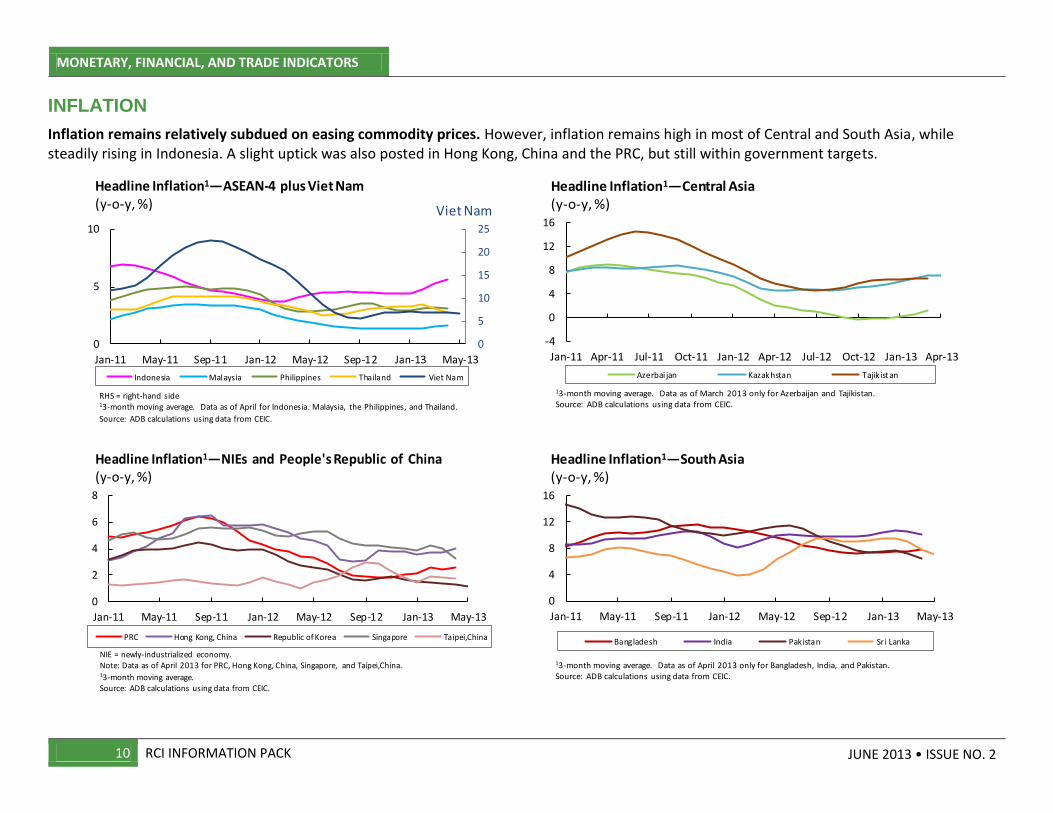
INFLATION
Inflation remains relatively subdued on easing commodity prices. However, inflation remains high in most of Central and South Asia, while steadily rising in Indonesia. A slight uptick was also posted in Hong Kong, China and the PRC, but still within government targets.
0
5
10
15
20
25
0
5
10
Jan-11 May-11 Sep-11 Jan-12 May-12 Sep-12 Jan-13 May-13
Indonesia Malaysia Philippines Thailand Viet Nam
Headline Inflation1—ASEAN-4 plus Viet Nam (y-o-y, %)
RHS = right-hand side13-month moving average. Data as of April for Indonesia. Malaysia, the Philippines, and Thailand.
Source: ADB calculations using data from CEIC.
Viet Nam
-4
0
4
8
12
16
Jan-11 Apr-11 Jul-11 Oct-11 Jan-12 Apr-12 Jul-12 Oct-12 Jan-13 Apr-13
Azerbai jan Kazakhstan Tajik istan
Headline Inflation1—Central Asia (y-o-y, %)
13-month moving average. Data as of March 2013 only for Azerbaijan and Tajikistan.Source: ADB calculations using data from CEIC.
0
2
4
6
8
Jan-11 May-11 Sep-11 Jan-12 May-12 Sep-12 Jan-13 May-13
PRC Hong Kong, China Republic of Korea Singapore Taipei,China
Headline Inflation1—NIEs and People's Republic of China (y-o-y, %)
NIE = newly-industrialized economy. Note: Data as of April 2013 for PRC, Hong Kong, China, Singapore, and Taipei,China.13-month moving average.Source: ADB calculations using data from CEIC.
0
4
8
12
16
Jan-11 May-11 Sep-11 Jan-12 May-12 Sep-12 Jan-13 May-13
Bangladesh India Pakistan Sri Lanka
Headline Inflation1—South Asia (y-o-y, %)
13-month moving average. Data as of April 2013 only for Bangladesh, India, and Pakistan.Source: ADB calculations using data from CEIC.
REGIONAL ECONOMIC INTEGRATION MONETARY, FINANCIAL, AND TRADE INDICATORS
RCI INFORMATION PACK 11
JUNE 2013 • ISSUE NO. 2
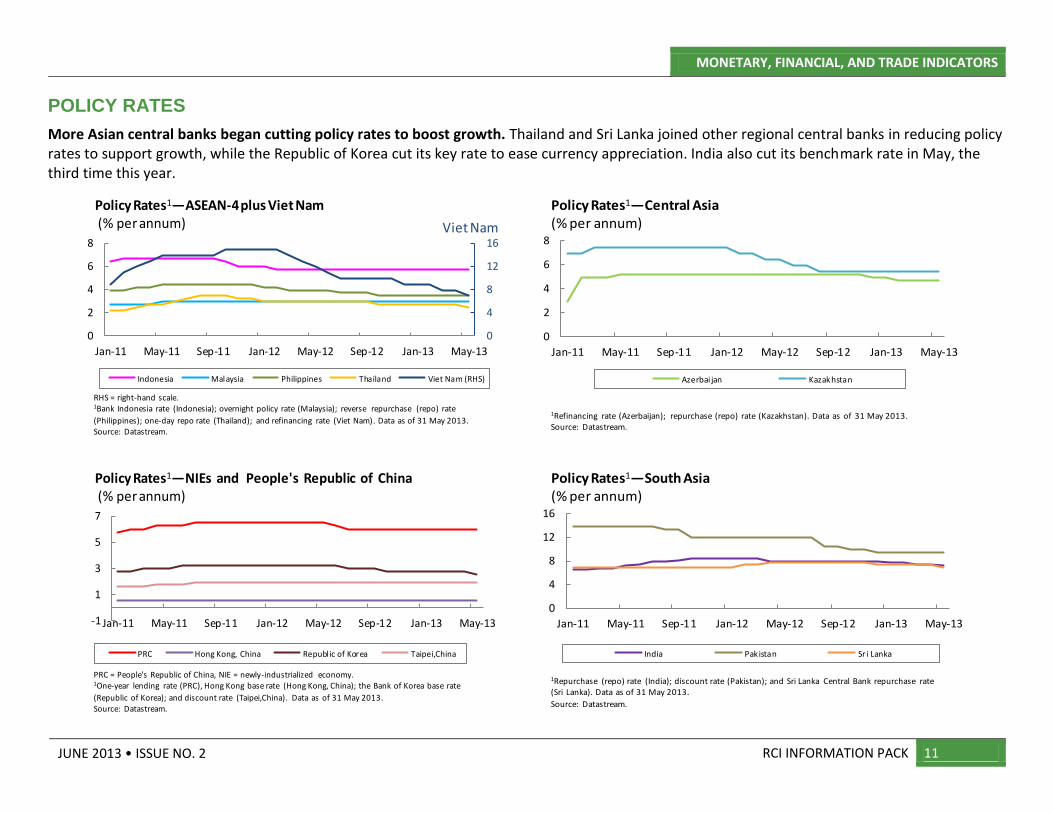
POLICY RATES
More Asian central banks began cutting policy rates to boost growth. Thailand and Sri Lanka joined other regional central banks in reducing policy rates to support growth, while the Republic of Korea cut its key rate to ease currency appreciation. India also cut its benchmark rate in May, the third time this year.
0
4
8
12
16
0
2
4
6
8
Jan-11 May-11 Sep-11 Jan-12 May-12 Sep-12 Jan-13 May-13
Indonesia Malaysia Philippines Thailand Viet Nam (RHS)
Policy Rates1—ASEAN-4 plus Viet Nam (% per annum)
RHS = right-hand scale.1Bank Indonesia rate (Indonesia); overnight policy rate (Malaysia); reverse repurchase (repo) rate
(Philippines); one-day repo rate (Thailand); and refinancing rate (Viet Nam). Data as of 31 May 2013. Source: Datastream.
Viet Nam
0
2
4
6
8
Jan-11 May-11 Sep-11 Jan-12 May-12 Sep-12 Jan-13 May-13
Azerbai jan Kazakhstan
1Refinancing rate (Azerbaijan); repurchase (repo) rate (Kazakhstan). Data as of 31 May 2013.Source: Datastream.
Policy Rates1—Central Asia (% per annum)
-1
1
3
5
7
Jan-11 May-11 Sep-11 Jan-12 May-12 Sep-12 Jan-13 May-13
PRC Hong Kong, China Republ ic of Korea Taipei,China
Policy Rates1—NIEs and People's Republic of China (% per annum)
PRC = People's Republic of China, NIE = newly-industrialized economy.1One-year lending rate (PRC), Hong Kong base rate (Hong Kong, China); the Bank of Korea base rate
(Republic of Korea); and discount rate (Taipei,China). Data as of 31 May 2013. Source: Datastream.
0
4
8
12
16
Jan-11 May-11 Sep-11 Jan-12 May-12 Sep-12 Jan-13 May-13
India Pakistan Sri Lanka
1Repurchase (repo) rate (India); discount rate (Pakistan); and Sri Lanka Central Bank repurchase rate (Sri Lanka). Data as of 31 May 2013.
Source: Datastream.
Policy Rates1—South Asia (% per annum)

MONETARY, FINANCIAL, AND TRADE INDICATORS REGIONAL ECONOMIC INTEGRATION
12 RCI INFORMATION PACK
JUNE 2013 • ISSUE NO. 2
BANK LENDING
Double-digit growth in bank lending has continued in most developing Asian economies. With the exception of the Republic of Korea and Taipei,China, bank lending has grown above 10% in recent months.
0
10
20
30
40
Jan-11 Apr-11 Jul-11 Oct-11 Jan-12 Apr-12 Jul-12 Oct-12 Jan-13 Apr-13
Indonesia Malaysia Philippines Thailand Viet Nam
1Data refer to commercial bank loans (Indonesia and Thailand); commercial bank loans and advances (Malaysia); commercial and universal bank loans net of RRAs (Philippines); and claims on private sector of banking
institutions (Viet Nam). Data for Indonesia until February 2013; Viet Nam until November 2012.Source: ADB calculations using data from CEIC.
Bank Lending Growth1—ASEAN-4 plus Viet Nam (y-o-y, %)
-100
-50
0
50
100
Jan-11 Apr-11 Jul-11 Oct-11 Jan-12 Apr-12 Jul-12 Oct-12 Jan-13 Apr-13
1Data refer to loans of other depository corporations. Data up to March 2013.Source: ADB calculations using data from CEIC.
Bank Lending Growth1—Kazakhstan (y-o-y, %)
Mar-13
0
5
10
15
20
0
10
20
30
40
Jan-11 Apr-11 Jul-11 Oct-11 Jan-12 Apr-12 Jul-12 Oct-12 Jan-13 Apr-13
Hong Kong, China (HKG) Singapore (SIN) PRC Republ ic of Korea Taipei,China
PRC = People's Republic of China, NIE = newly industrialized economy. 1Data refer to authorized institutions' loans and advances (Hong Kong, China); commercial and specialized bank
loans (Republic of Korea); domestic banking unit loans and advances (Singapore) until February 2013; and domestic bank loans and advances (Taipei,China) until March 2013. Data for Republic until February 2013. Datafor People's Republic of China up to March 2013.
Source: ADB calculations using data from CEIC and Bank of Korea.
Bank Lending Growth1—NIEs and People's Republic of China (y-o-y, %)
HKG and SIN
0
10
20
30
40
Jan-11 Apr-11 Jul-11 Oct-11 Jan-12 Apr-12 Jul-12 Oct-12 Jan-13 Apr-13
Bangladesh Sri Lanka India Pakistan
1Data refer to credit of deposit money banks (Bangladesh) , commercial bank loans (Sri Lanka), and domestic credit (India and Pakistan). Data for Sri Lanka until December 2012; data for India until February 2013; data for Bangladesh
until March 2013.Source: ADB calculations using data from CEIC for Bangladesh and Sri Lanka; ADB calculations using data from Haver for India and Pakistan.
Bank Lending Growth1—South Asia (y-o-y, %)
Jan-13

REGIONAL ECONOMIC INTEGRATION MONETARY, FINANCIAL, AND TRADE INDICATORS
RCI INFORMATION PACK 13
JUNE 2013 • ISSUE NO. 2
INDUSTRIAL PRODUCTION
Industrial production growth rose, except in the PRC and middle-income Southeast Asia. The Republic of Korea, Singapore, and Viet Nam rebounded after months of contraction. South Asian economies posted mild increases. However, sharp declines in Thailand continued mainly due to base effects following the recovery after the late 2011 floods.
-40
-20
0
20
40
60
80
-10
0
10
20
Jan-11 May-11 Sep-11 Jan-12 May-12 Sep-12 Jan-13 May-13
Indonesia Malaysia Philippines Viet Nam Thailand (R HS)
Industrial Production Growth1—ASEAN-4 plus Viet Nam (y-o-y, %)
RHS = right-hand scale.13-month moving average. Data for Indonesia, Malaysia, and the Philippines until March 2013;
data for Thailand untili April 2013.Source: ADB calculations using data from CEIC.
Thailand
-5
0
5
10
Jan-11 Apr-11 Jul-11 Oct-11 Jan-12 Apr-12 Jul-12 Oct-12 Jan-13 Apr-13
Azerbai jan Kazakhstan
13-month moving average. Source: ADB calculations using data from CEIC.
Industrial Production Growth1—Central Asia(y-o-y, %)
-10
0
10
20
Jan-11 Apr-11 Jul-11 Oct-11 Jan-12 Apr-12 Jul-12 Oct-12 Jan-13 Apr-13
PRC Republ ic of Korea Singapore Taipei,China
Industrial Production Growth1—NIEs and People's Republic of China (y-o-y, %)
NIE = newly industrialized economy. Data for Taipei,China up to March 2013 only.13-month moving average.
Source: ADB calculations using data from CEIC.
-10
0
10
20
30
Jan-11 Apr-11 Jul-11 Oct-11 Jan-12 Apr-12 Jul-12 Oct-12 Jan-13 Apr-13
Bangladesh India Pakistan Sr i Lanka
13-month moving average.Note: Data for Sri Lanka until February 2013; and Bangladesh until January 2013.
Source: ADB calculations using data from CEIC.
Industrial Production Growth1—South Asia(y-o-y, %)
Mar-13
MONETARY, FINANCIAL, AND TRADE INDICATORS REGIONAL ECONOMIC INTEGRATION
14 RCI INFORMATION PACK
JUNE 2013 • ISSUE NO. 2
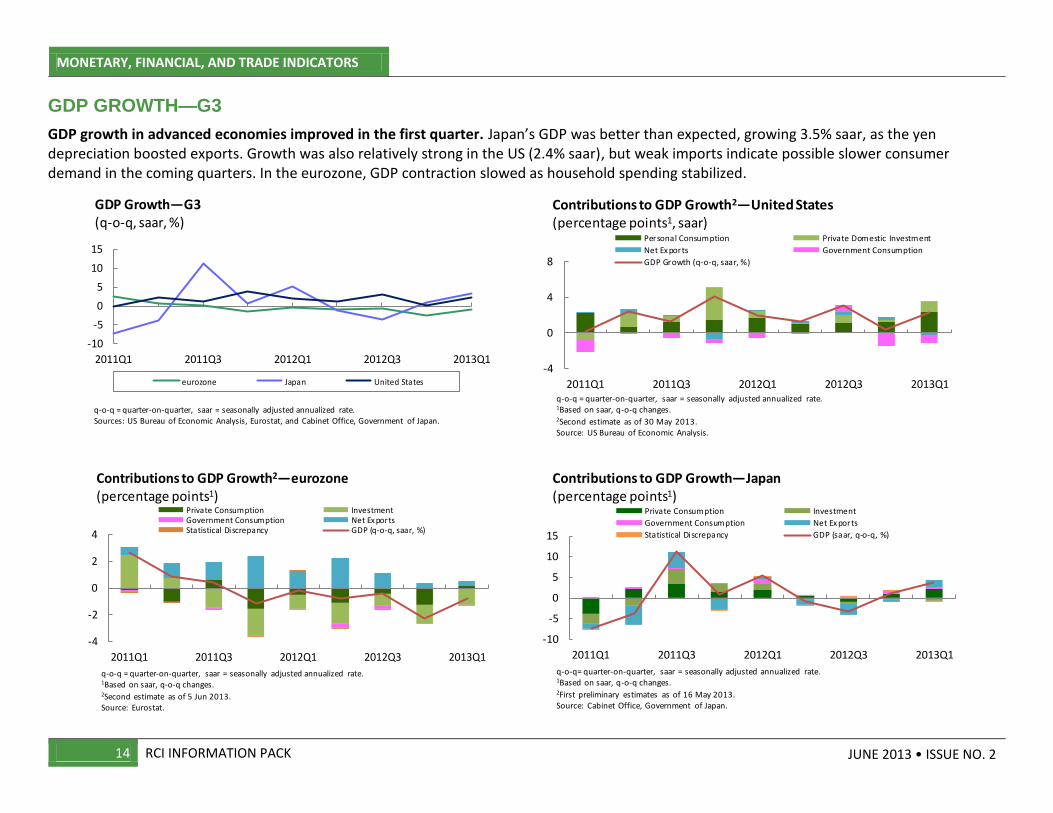
GDP GROWTH—G3
GDP growth in advanced economies improved in the first quarter. Japan’s GDP was better than expected, growing 3.5% saar, as the yen depreciation boosted exports. Growth was also relatively strong in the US (2.4% saar), but weak imports indicate possible slower consumer demand in the coming quarters. In the eurozone, GDP contraction slowed as household spending stabilized.
-10
-5
0
5
10
15
2011Q1 2011Q3 2012Q1 2012Q3 2013Q1
eurozone Japan United States
GDP Growth—G3(q-o-q, saar, %)
q-o-q = quarter-on-quarter, saar = seasonally adjusted annualized rate.Sources: US Bureau of Economic Analysis, Eurostat, and Cabinet Office, Government of Japan.
-4
0
4
8
2011Q1 2011Q3 2012Q1 2012Q3 2013Q1
Contributions to GDP Growth2—United States (percentage points1, saar)
Personal Consumption Private Domestic Investment
Net Ex ports Government Consumption
GDP Growth (q-o-q, saar, %)
q-o-q = quarter-on-quarter, saar = seasonally adjusted annualized rate.1Based on saar, q-o-q changes.2Second estimate as of 30 May 2013.Source: US Bureau of Economic Analysis.
-4
-2
0
2
4
2011Q1 2011Q3 2012Q1 2012Q3 2013Q1
Contributions to GDP Growth2—eurozone (percentage points1)
Private Consumption InvestmentGovernment Consumption Net Ex portsStatistical Discrepancy GDP (q-o-q, saar, %)
q-o-q = quarter-on-quarter, saar = seasonally adjusted annualized rate.1Based on saar, q-o-q changes.2Second estimate as of 5 Jun 2013.Source: Eurostat.
-10
-5
0
5
10
15
2011Q1 2011Q3 2012Q1 2012Q3 2013Q1
Contributions to GDP Growth—Japan (percentage points1)
Private Consumption Investment
Government Consumption Net Ex ports
Statistical Discrepancy GDP (saar, q-o-q, %)
q-o-q= quarter-on-quarter, saar = seasonally adjusted annualized rate.1Based on saar, q-o-q changes.2First preliminary estimates as of 16 May 2013.Source: Cabinet Office, Government of Japan.

REGIONAL ECONOMIC INTEGRATION MONETARY, FINANCIAL, AND TRADE INDICATORS
RCI INFORMATION PACK 15
JUNE 2013 • ISSUE NO. 2
GDP GROWTH—ASIA
First quarter GDP growth was mixed. Tepid domestic demand dampened growth in Thailand; while lower-than-expected external demand pushed growth down in Singapore and Taipei,China. Growth was also somewhat lower than expected in the PRC and India. The Philippines, however, posted the highest first quarter growth in the region due to increased government spending and investment.
-10-50510152025
-4-202468
10
2011Q1 2011Q3 2012Q1 2012Q3 2013Q1
Indonesia Malaysia Philippines Viet Nam Thailand
GDP Growth1—ASEAN-4 plus Viet Nam (y-o-y, %)
1Based on quarterly data. Source: ADB calculations using data from CEIC.
Thailand
-10
-5
0
5
10
2011Q1 2011Q2 2011Q3 2011Q4 2012Q1 2012Q2 2012Q3 2012Q4
Azerbai jan Georgia Kazakhstan
GDP Growth1—Central Asia(y-o-y, %)
1Based on quarterly data.Notes: Data as of Decenber 2011 only for Armenia.
Source: ADB calculations using data from CEIC.
-2
0
2
4
6
8
10
2011Q1 2011Q3 2012Q1 2012Q3 2013Q1
PRC Hong Kong, China Republ ic of Korea Singapore Taipei,China
GDP Growth1—NIEs and People's Republic of China (y-o-y, %)
NIE = newly-industrialized economy. 1Based on quarterly data.
Source: ADB calculations using data from CEIC.
0
4
8
12
2011Q1 2011Q3 2012Q1 2012Q3 2013Q1
India Sr i Lanka
GDP Growth1—South Asia(y-o-y, %)
1Based on quarterly data.Notes: Data as of Decenber 2012 only for Sri Lanka.
Source: ADB calculations using data from CEIC.

MONETARY, FINANCIAL, AND TRADE INDICATORS REGIONAL ECONOMIC INTEGRATION
16 RCI INFORMATION PACK
JUNE 2013 • ISSUE NO. 2
EXPORT GROWTH BY DESTINATION
Asian export growth slowed overall, but for the most part grew faster to emerging markets. Exports to ASEAN-4 and India generally rose faster than other regions. For the PRC, however, Hong Kong, China; the Republic of Korea; Singapore; and Taipei,China remained the dominant export markets.
-40
0
40
80
Jan-11 Apr-11 Jul-11 Oct-11 Jan-12 Apr-12 Jul-12 Oct-12 Jan-13 Apr-13
ASEAN-4 NIEs G3 PRC IND
Export Growth1 by Destination—ASEAN-4 (y-o-y, %)
ASEAN-4 = Indonesia, Malaysia, Thailand, and the Philippines. PRC = People's Republic of China. G3 = EU, Japan, and the US. IND = India. NIEs = Hong Kong, China; the Republic of Korea; Singapore; and
Taipei,China. 13-month moving average.
Mar-13
-75
-25
25
75
125
Jan-11 Apr-11 Jul-11 Oct-11 Jan-12 Apr-12 Jul-12 Oct-12 Jan-13 Apr-13
ASEAN-4 NIEs G3 PRC
Export Growth1 by Destination—India(y-o-y, %)
ASEAN-4 = Indonesia, Malaysia, the Philippines and Thailand. PRC = People's Republic of China. G3 = EU, Japan, and the US. NIEs = Hong Kong, China; the Republic of Korea; Singapore; and Taipei,China. 13-month moving average.Source: ADB calculations using data from CEIC.
Mar-13
-25
0
25
50
Jan-11 Apr-11 Jul-11 Oct-11 Jan-12 Apr-12 Jul-12 Oct-12 Jan-13 Apr-13
ASEAN-4 NIEs G3 PRC IND
Export Growth1 by Destination—NIEs(y-o-y, %)
ASEAN-4 = Indonesia, Malaysia, the Philippines and Thailand. PRC = People's Republic of China. G3 = EU, Japan, and the US; IND = India. NIEs = Hong Kong, China; the Republic of Korea; Singapore; and
Taipei,China. 13-month moving average.Source: ADB calculations using data from CEIC.
-15
10
35
60
Jan-11 Apr-11 Jul-11 Oct-11 Jan-12 Apr-12 Jul-12 Oct-12 Jan-13 Apr-13
ASEAN-4 NIEs G3 IND
Export Growth1 by Destination—People's Republic of China (y-o-y, %)
ASEAN-4 = Indonesia, Malaysia, the Philippines and Thailand. G3 = EU, Japan, and the US. IND = India. NIEs = Hong Kong, China; the Republic of Korea; Singapore; and Taipei,China. 13-month moving average.Source: ADB calculations using data from CEIC.
REGIONAL ECONOMIC INTEGRATION MONETARY, FINANCIAL, AND TRADE INDICATORS
RCI INFORMATION PACK 17
JUNE 2013 • ISSUE NO. 2
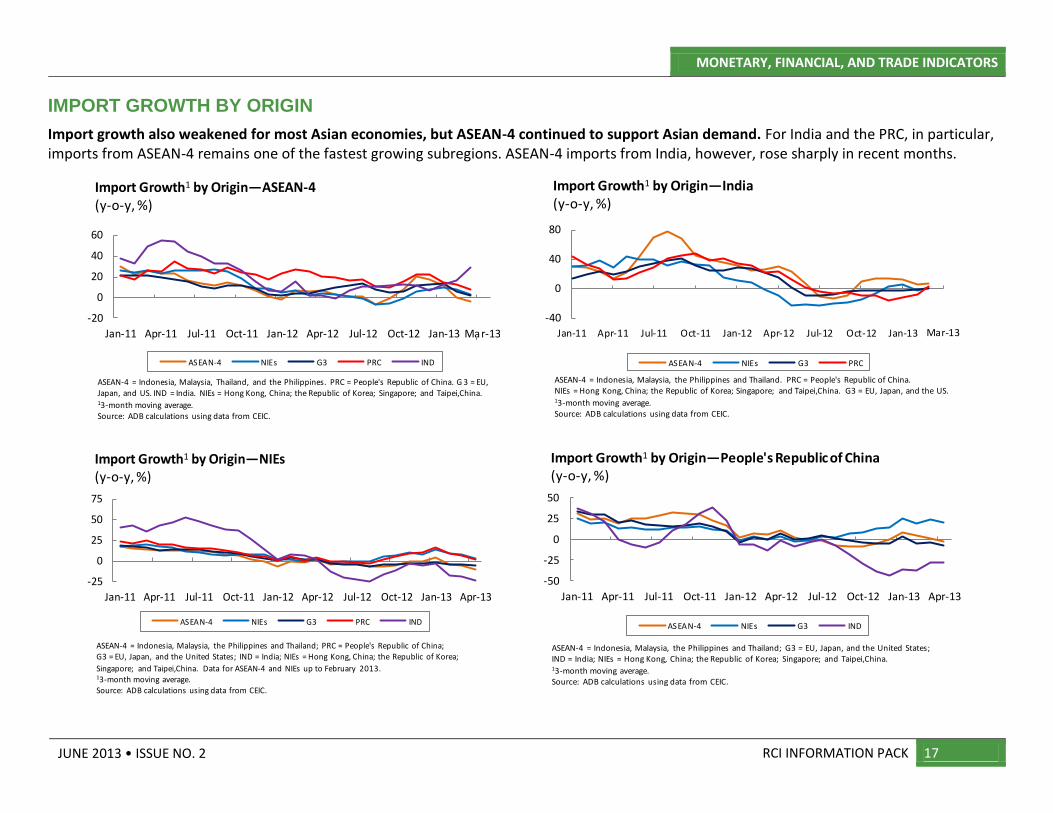
IMPORT GROWTH BY ORIGIN
Import growth also weakened for most Asian economies, but ASEAN-4 continued to support Asian demand. For India and the PRC, in particular, imports from ASEAN-4 remains one of the fastest growing subregions. ASEAN-4 imports from India, however, rose sharply in recent months.
-20
0
20
40
60
Jan-11 Apr-11 Jul-11 Oct-11 Jan-12 Apr-12 Jul-12 Oct-12 Jan-13 Apr-13
ASEAN-4 NIEs G3 PRC IND
Import Growth1 by Origin—ASEAN-4 (y-o-y, %)
ASEAN-4 = Indonesia, Malaysia, Thailand, and the Philippines. PRC = People's Republic of China. G 3 = EU, Japan, and US. IND = India. NIEs = Hong Kong, China; the Republic of Korea; Singapore; and Taipei,China. 13-month moving average.Source: ADB calculations using data from CEIC.
Mar-13
-40
0
40
80
Jan-11 Apr-11 Jul-11 Oct-11 Jan-12 Apr-12 Jul-12 Oct-12 Jan-13 Apr-13
ASEAN-4 NIEs G3 PRC
Import Growth1 by Origin—India(y-o-y, %)
ASEAN-4 = Indonesia, Malaysia, the Philippines and Thailand. PRC = People's Republic of China. NIEs = Hong Kong, China; the Republic of Korea; Singapore; and Taipei,China. G3 = EU, Japan, and the US.13-month moving average.Source: ADB calculations using data from CEIC.
Mar-13
-25
0
25
50
75
Jan-11 Apr-11 Jul-11 Oct-11 Jan-12 Apr-12 Jul-12 Oct-12 Jan-13 Apr-13
ASEAN-4 NIEs G3 PRC IND
Import Growth1 by Origin—NIEs(y-o-y, %)
ASEAN-4 = Indonesia, Malaysia, the Philippines and Thailand; PRC = People's Republic of China; G3 = EU, Japan, and the United States; IND = India; NIEs = Hong Kong, China; the Republic of Korea;
Singapore; and Taipei,China. Data for ASEAN-4 and NIEs up to February 2013.13-month moving average.Source: ADB calculations using data from CEIC.
-50
-25
0
25
50
Jan-11 Apr-11 Jul-11 Oct-11 Jan-12 Apr-12 Jul-12 Oct-12 Jan-13 Apr-13
ASEAN-4 NIEs G3 IND
Import Growth1 by Origin—People's Republic of China (y-o-y, %)
ASEAN-4 = Indonesia, Malaysia, the Philippines and Thailand; G3 = EU, Japan, and the United States; IND = India; NIEs = Hong Kong, China; the Republic of Korea; Singapore; and Taipei,China. 13-month moving average.Source: ADB calculations using data from CEIC.
MONETARY, FINANCIAL, AND TRADE INDICATORS REGIONAL ECONOMIC INTEGRATION
18 RCI INFORMATION PACK
JUNE 2013 • ISSUE NO. 2
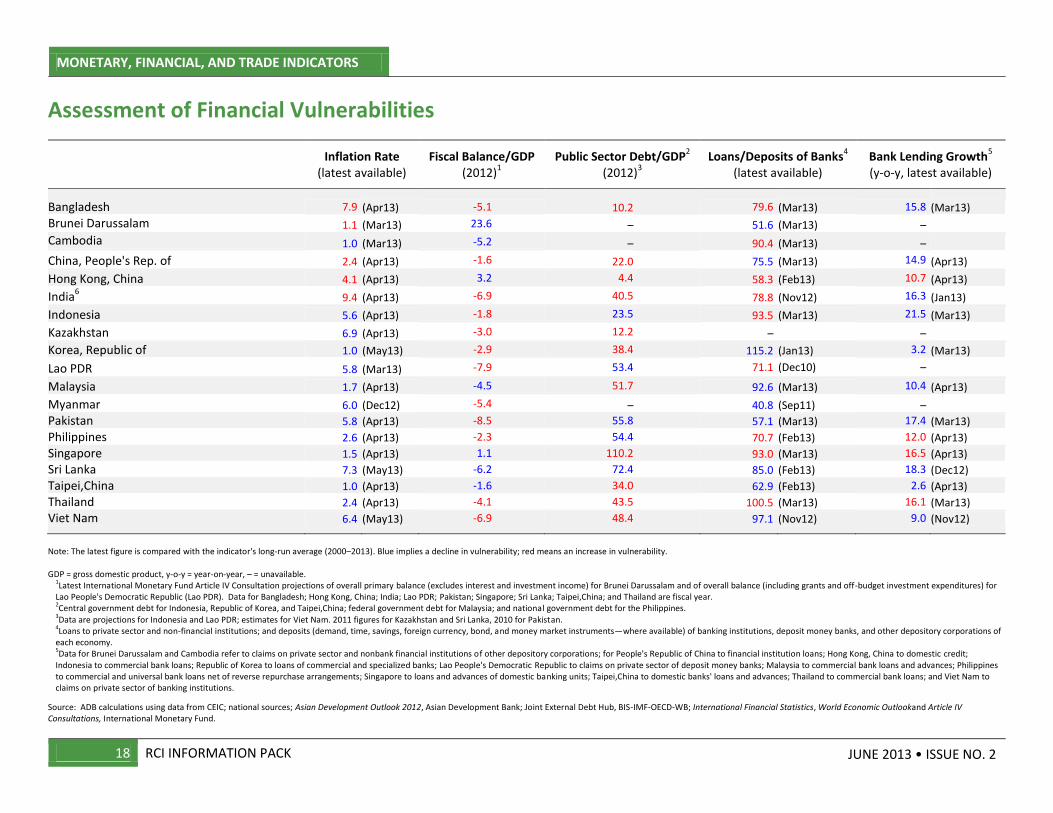
Assessment of Financial Vulnerabilities
Inflation Rate
(latest available) Fiscal Balance/GDP
(2012)1
Public Sector Debt/GDP2
(2012)3
Loans/Deposits of Banks4
(latest available)
Bank Lending Growth5
(y-o-y, latest available)
Bangladesh 7.9 (Apr13) -5.1 10.2 79.6 (Mar13) 15.8 (Mar13)
Brunei Darussalam 1.1 (Mar13) 23.6 – 51.6 (Mar13) –
Cambodia 1.0 (Mar13) -5.2 – 90.4 (Mar13) –
China, People's Rep. of 2.4 (Apr13) -1.6 22.0 75.5 (Mar13) 14.9 (Apr13)
Hong Kong, China 4.1 (Apr13) 3.2 4.4 58.3 (Feb13) 10.7 (Apr13)
India6 9.4 (Apr13) -6.9 40.5 78.8 (Nov12) 16.3 (Jan13)
Indonesia 5.6 (Apr13) -1.8 23.5 93.5 (Mar13) 21.5 (Mar13)
Kazakhstan 6.9 (Apr13) -3.0 12.2 – –
Korea, Republic of 1.0 (May13) -2.9 38.4 115.2 (Jan13) 3.2 (Mar13)
Lao PDR 5.8 (Mar13) -7.9 53.4 71.1 (Dec10) –
Malaysia 1.7 (Apr13) -4.5 51.7 92.6 (Mar13) 10.4 (Apr13)
Myanmar 6.0 (Dec12) -5.4 – 40.8 (Sep11) –
Pakistan 5.8 (Apr13) -8.5 55.8 57.1 (Mar13) 17.4 (Mar13)
Philippines 2.6 (Apr13) -2.3 54.4 70.7 (Feb13) 12.0 (Apr13)
Singapore 1.5 (Apr13) 1.1 110.2 93.0 (Mar13) 16.5 (Apr13)
Sri Lanka 7.3 (May13) -6.2 72.4 85.0 (Feb13) 18.3 (Dec12)
Taipei,China 1.0 (Apr13) -1.6 34.0 62.9 (Feb13) 2.6 (Apr13)
Thailand 2.4 (Apr13) -4.1 43.5 100.5 (Mar13) 16.1 (Mar13)
Viet Nam 6.4 (May13) -6.9 48.4 97.1 (Nov12) 9.0 (Nov12)
Note: The latest figure is compared with the indicator's long-run average (2000–2013). Blue implies a decline in vulnerability; red means an increase in vulnerability. GDP = gross domestic product, y-o-y = year-on-year, – = unavailable.
1Latest International Monetary Fund Article IV Consultation projections of overall primary balance (excludes interest and investment income) for Brunei Darussalam and of overall balance (including grants and off-budget investment expenditures) for Lao People's Democratic Republic (Lao PDR). Data for Bangladesh; Hong Kong, China; India; Lao PDR; Pakistan; Singapore; Sri Lanka; Taipei,China; and Thailand are fiscal year. 2Central government debt for Indonesia, Republic of Korea, and Taipei,China; federal government debt for Malaysia; and national government debt for the Philippines. 3Data are projections for Indonesia and Lao PDR; estimates for Viet Nam. 2011 figures for Kazakhstan and Sri Lanka, 2010 for Pakistan. 4Loans to private sector and non-financial institutions; and deposits (demand, time, savings, foreign currency, bond, and money market instruments—where available) of banking institutions, deposit money banks, and other depository corporations of each economy. 5Data for Brunei Darussalam and Cambodia refer to claims on private sector and nonbank financial institutions of other depository corporations; for People's Republic of China to financial institution loans; Hong Kong, China to domestic credit; Indonesia to commercial bank loans; Republic of Korea to loans of commercial and specialized banks; Lao People's Democratic Republic to claims on private sector of deposit money banks; Malaysia to commercial bank loans and advances; Philippines to commercial and universal bank loans net of reverse repurchase arrangements; Singapore to loans and advances of domestic banking units; Taipei,China to domestic banks' loans and advances; Thailand to commercial bank loans; and Viet Nam to claims on private sector of banking institutions.
Source: ADB calculations using data from CEIC; national sources; Asian Development Outlook 2012, Asian Development Bank; Joint External Debt Hub, BIS-IMF-OECD-WB; International Financial Statistics, World Economic Outlookand Article IV Consultations, International Monetary Fund.

REGIONAL ECONOMIC INTEGRATION MONETARY, FINANCIAL, AND TRADE INDICATORS
RCI INFORMATION PACK 19
JUNE 2013 • ISSUE NO. 2
Assessment of External Vulnerabilities
Current Account/ GDP
(latest available)
External Debt/GDP
1
(2012)
Short-Term External Debt/Reserves
(3Q2012)2
Broad Money3/
Foreign Reserves
(latest available)
Foreign Reserves (number of months
of imports)4
Foreign Liabilities/ Foreign Assets
5
(latest available)
Bangladesh 0.9 (2012) 20.9 42.6 5.6 (Mar13) 4.6 (Mar13) 73.6 (Mar13)
Brunei Darussalam 50.0 (2011) 10.6 56.9 3.4 (Dec12) 4.2 (Jan13) 1.4 (Mar13)
Cambodia -7.1 (2011) 22.0 21.5 1.7 (Mar13) 3.0 (Jan13) 74.1 (Mar13)
China, People's Rep. of 1.7 (4Q12) 7.5 12.5 4.8 (Mar13) 20.5 (Apr13) 41.8 (Mar13)
Hong Kong, China 2.1 (4Q12) 233.6 68.0 3.9 (Apr13) 7.1 (Apr13) 72.3 (Feb13)
India -6.7 (4Q12) 18.8 53.7 1.3 (Apr13) 6.4 (Apr13) —
Indonesia -3.5 (4Q12) 17.4 46.9 3.3 (Apr13) 6.2 (Apr13) 121.3 (Mar13)
Kazakhstan 9.0 (2Q12) 13.9 16.8 3.6 (Apr13) 6.2 (Mar13) —
Korea, Republic of 4.9 (4Q12) 3.8 48.4 5.2 (Apr13) 7.7 (May13) 182.7 (Jan13)
Lao PDR -15.9 (2011) 31.2 20.8 4.6 (Jun12) 1.6 (Jul12) 75.3 (Dec10)
Malaysia 9.4 (4Q12) 29.7 30.4 3.3 (Apr13) 7.8 (Mar13) 97.3 (Mar13)
Myanmar -2.7 (2011) 3.1 3.3 — 7.9 (Mar12) —
Pakistan -2.0 (2012) 19.2 54.9 9.8 (Mar13) 2.2 (Apr13) 46.6 (Mar13)
Philippines 3.1 (4Q12) 34.5 21.0 1.7 (Apr13) 15.0 (Mar13) 115.9 (Apr13)
Singapore 14.5 (4Q12) 230.2 73.9 1.5 (Apr13) 8.1 (Apr13) 102.9 (Mar13)
Sri Lanka -7.2 (4Q12) 32.4 46.4 3.3 (Jan13) 4.3 (Feb13) 328.5 (Feb13)
Taipei,China 12.6 (4Q12) 19.5 11.7 2.8 (Apr13) 17.6 (Apr13) 57.8 (Apr13)
Thailand 1.0 (4Q12) 17.7 15.8 3.0 (Apr13) 7.9 (Apr13) 149.4 (Mar13)
Viet Nam 5.1 (3Q12) 32.5 69.9 6.6 (Nov12) 2.4 (Dec12) 97.1 (Nov12)
Note: The latest figure is compared to the indicator's long-run average (2000-2012). Green font implies a decline in vulnerability; red means an increase in vulnerability. GDP = gross domestic product, y-o-y = year-on-year, – = unavailable. 1Data are estimates for Brunei Darussalam, Cambodia, Japan, Republic of Korea, Lao People's Democratic Republic, and Myanmar. 2Short-term external debt includes loans and credits due and debt securities due within a year as defined in the Joint External Debt Hub. Data start 2004 for all countries. 3Data for Brunei Darussalam, Philippines, Taipei,China; and Thailand refer to broad money; for Bangladesh, Cambodia, People's Republic of China; Hong Kong, China; Indonesia, Kazakhstan; Republic of Korea; Lao People's Democratic Republic; Malaysia; Pakistan; and Sri Lanka refer to M2; for Myanmar and Viet Nam to money plus quasi-money; for India M3. 4Refers to reserves minus gold over a 12-month moving average of imports (cost of insurance, freight). Latest month when reserves data is available. Import data may be earlier, the same, or later than period indicated. 5 Foreign liabilities and assets of banking institutions, deposit money banks, and other depository corporations
Source: ADB calculations using data from CEIC; national sources; Asian Development Outlook 2012, Asian Development Bank; Joint External Debt Hub, BIS-IMF-OECD-WB; International Financial Statistics, Direction of Trade Statistics, World Economic Outlookand Article IV Consultations, International Monetary Fund.
MONETARY, FINANCIAL, AND TRADE INDICATORS
20 RCI INFORMATION PACK
© 2013 Asian Development Bank Publication Stock No. ARM135688-3
JUNE 2013 • ISSUE NO. 2
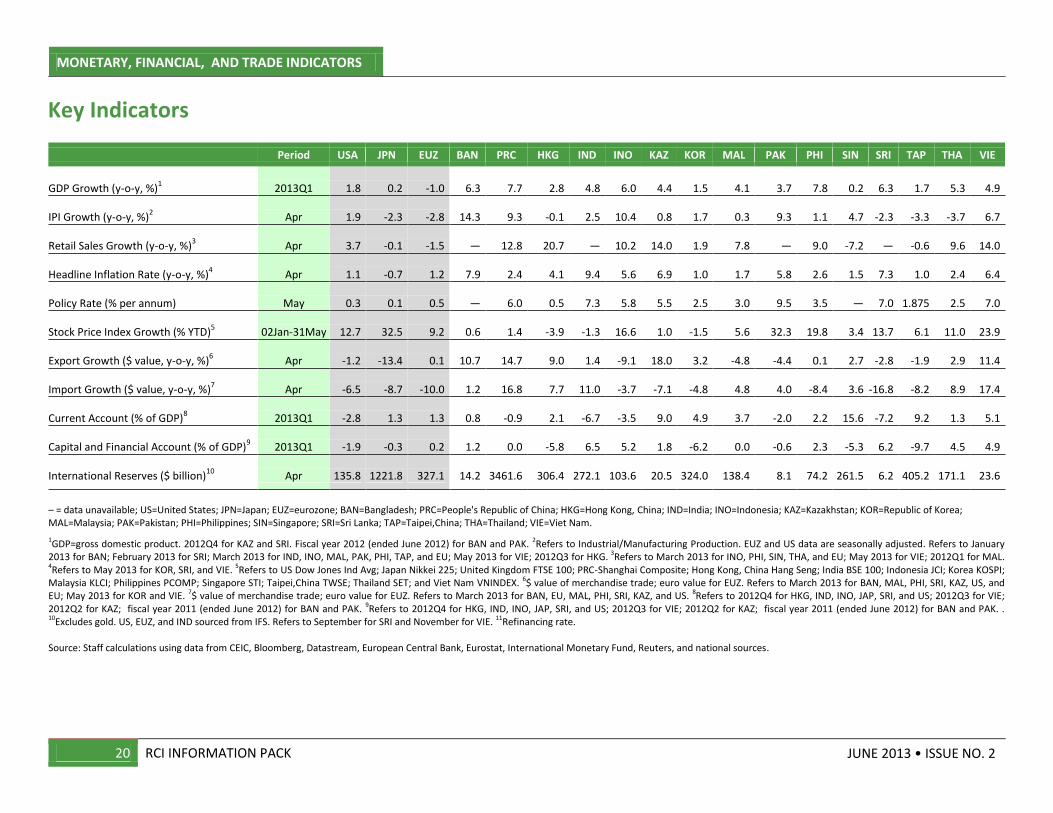
Key Indicators
Period USA JPN EUZ BAN PRC HKG IND INO KAZ KOR MAL PAK PHI SIN SRI TAP THA VIE
GDP Growth (y-o-y, %)1 2013Q1 1.8 0.2 -1.0 6.3 7.7 2.8 4.8 6.0 4.4 1.5 4.1 3.7 7.8 0.2 6.3 1.7 5.3 4.9
IPI Growth (y-o-y, %)2 Apr 1.9 -2.3 -2.8 14.3 9.3 -0.1 2.5 10.4 0.8 1.7 0.3 9.3 1.1 4.7 -2.3 -3.3 -3.7 6.7
Retail Sales Growth (y-o-y, %)3 Apr 3.7 -0.1 -1.5 — 12.8 20.7 — 10.2 14.0 1.9 7.8 — 9.0 -7.2 — -0.6 9.6 14.0
Headline Inflation Rate (y-o-y, %)4 Apr 1.1 -0.7 1.2 7.9 2.4 4.1 9.4 5.6 6.9 1.0 1.7 5.8 2.6 1.5 7.3 1.0 2.4 6.4
Policy Rate (% per annum) May 0.3 0.1 0.5 — 6.0 0.5 7.3 5.8 5.5 2.5 3.0 9.5 3.5 — 7.0 1.875 2.5 7.0
Stock Price Index Growth (% YTD)5 02Jan-31May 12.7 32.5 9.2 0.6 1.4 -3.9 -1.3 16.6 1.0 -1.5 5.6 32.3 19.8 3.4 13.7 6.1 11.0 23.9
Export Growth ($ value, y-o-y, %)6 Apr -1.2 -13.4 0.1 10.7 14.7 9.0 1.4 -9.1 18.0 3.2 -4.8 -4.4 0.1 2.7 -2.8 -1.9 2.9 11.4
Import Growth ($ value, y-o-y, %)7 Apr -6.5 -8.7 -10.0 1.2 16.8 7.7 11.0 -3.7 -7.1 -4.8 4.8 4.0 -8.4 3.6 -16.8 -8.2 8.9 17.4
Current Account (% of GDP)8 2013Q1 -2.8 1.3 1.3 0.8 -0.9 2.1 -6.7 -3.5 9.0 4.9 3.7 -2.0 2.2 15.6 -7.2 9.2 1.3 5.1
Capital and Financial Account (% of GDP)9 2013Q1 -1.9 -0.3 0.2 1.2 0.0 -5.8 6.5 5.2 1.8 -6.2 0.0 -0.6 2.3 -5.3 6.2 -9.7 4.5 4.9
International Reserves ($ billion)10
Apr 135.8 1221.8 327.1 14.2 3461.6 306.4 272.1 103.6 20.5 324.0 138.4 8.1 74.2 261.5 6.2 405.2 171.1 23.6
– = data unavailable; US=United States; JPN=Japan; EUZ=eurozone; BAN=Bangladesh; PRC=People's Republic of China; HKG=Hong Kong, China; IND=India; INO=Indonesia; KAZ=Kazakhstan; KOR=Republic of Korea; MAL=Malaysia; PAK=Pakistan; PHI=Philippines; SIN=Singapore; SRI=Sri Lanka; TAP=Taipei,China; THA=Thailand; VIE=Viet Nam.
1GDP=gross domestic product. 2012Q4 for KAZ and SRI. Fiscal year 2012 (ended June 2012) for BAN and PAK. 2Refers to Industrial/Manufacturing Production. EUZ and US data are seasonally adjusted. Refers to January 2013 for BAN; February 2013 for SRI; March 2013 for IND, INO, MAL, PAK, PHI, TAP, and EU; May 2013 for VIE; 2012Q3 for HKG. 3Refers to March 2013 for INO, PHI, SIN, THA, and EU; May 2013 for VIE; 2012Q1 for MAL. 4Refers to May 2013 for KOR, SRI, and VIE. 5Refers to US Dow Jones Ind Avg; Japan Nikkei 225; United Kingdom FTSE 100; PRC-Shanghai Composite; Hong Kong, China Hang Seng; India BSE 100; Indonesia JCI; Korea KOSPI; Malaysia KLCI; Philippines PCOMP; Singapore STI; Taipei,China TWSE; Thailand SET; and Viet Nam VNINDEX. 6$ value of merchandise trade; euro value for EUZ. Refers to March 2013 for BAN, MAL, PHI, SRI, KAZ, US, and EU; May 2013 for KOR and VIE. 7$ value of merchandise trade; euro value for EUZ. Refers to March 2013 for BAN, EU, MAL, PHI, SRI, KAZ, and US. 8Refers to 2012Q4 for HKG, IND, INO, JAP, SRI, and US; 2012Q3 for VIE; 2012Q2 for KAZ; fiscal year 2011 (ended June 2012) for BAN and PAK. 9Refers to 2012Q4 for HKG, IND, INO, JAP, SRI, and US; 2012Q3 for VIE; 2012Q2 for KAZ; fiscal year 2011 (ended June 2012) for BAN and PAK. . 10Excludes gold. US, EUZ, and IND sourced from IFS. Refers to September for SRI and November for VIE. 11Refinancing rate. Source: Staff calculations using data from CEIC, Bloomberg, Datastream, European Central Bank, Eurostat, International Monetary Fund, Reuters, and national sources.