Embed Size (px)
Citation preview

II. Special Featured Papers
MONDAY NIGHT LECTURE
DECISIONMAKING IN INDUSTRY AND ITSIMPLICATIONS FOR ENERGY AND OTHER RESOURCES
by H. J, PickProfessor of Materials Technology
Department of Mechanical EngineeringUniversity of Aston, Birmingham, England
Engineering materials are always a means to an end: themanufacture of a product, Any criterion for assessing theirutility, from the point of view of performance or of economics,must be derived from this basic fact.
Metals technology exists to make objects of metal or objectscontaining metal; plastics technology to make objects of plasticsor objects containing plastics; concrete technology to makeobjects of concrete or containing concrete. These technologiesinvolve a whole range of activities, including the winning of rawmaterials and all aspects of the transformation of these into finalproducts— with processes; with plant; with skills and know-how;with the design and manufacture, performance and profitablemarketing of products; and with relevant aspects of the infra-structure. The full optimisation of a technology will be possibleonly if all these factors are considered, and this applies equally atall levels of economic activity.
The objective of the present paper is to place materials in thecontext of some other aspects of manufacturing technology andof the resources required for manufacture. Its concern is pri-marily with materials and industries in which economic con-siderations play a major role.
Competition in the Metals Industry
The need to consider a whole variety of facets of manufactur-ing technology may be illustrated by examining the nature of thecompetition facing metals and the metals industries as a conse-quence of the introduction of new materials,
It is commonly believed that many metal markets are safe be-cause metals possess unique properties and combinations of
37

properties. This statement may be true for a limited number ofspecialised applications with tight constraints on weight, size,performance, or processing. However, in many cases, perhaps inthe majority of cases, it is possible to create designs based on anyof a wide range of materials. The decision whether to use metalsor other materials, or indeed one alloy rather than another, willbe determined primarily by economic considerations, in whichthe processes and cost of manufacture will be the major factor.
It is, for example, perfectly feasible to design automobilebodies of similar performance on the basis of steel, aluminium,foamed polyurethane, fibre-glass, or of several of these in com-bination. Automobile performance apart, the material or com-bination of materials selected will be the one giving the lowestfinal product cost, Steel will be selected if the summation of thecosts of all the processes necessary to convert iron ore into a carbody is less than the summation of analogous process costs forthe competing materials, The competitive position of materials isseen to depend on a whole range of factors influencing processcosts in both the materials-using and in the materials-producingindustries: such factors as scale of operation, percentage of proc-ess waste, cost of plant and tooling, productivity of capital andlabour, cost of energy, etc. —each of which will vary with timeand place, and with the degree of technical and managerial skilland sophistication.
Within the present general pattern of metals technology, pro-ductivity improvement in the metal-producing industries will,through its effect on costs and prices, clearly play a major role inthe competitive position of metals. But attention to this aspectalone may not suffice to protect metal markets. One of the bigadvantages claimed for plastics in the manufacture of motor-carbodies, for example, is a very much lower tool-up cost per model.The invention and development of a lower-cost tooling systemfor steel could therefore be as important a factor in defending thismarket as an improvement in the properties or a decrease in theprice of steel strip.
The factors controlling the substitution of one material foranother is often seen to be less a matter of one material compet-ing with another than of the processes associated with onematerial competing with the processes associated with theother— the sand casting of cast iron with the pressure die castingof aluminium; the pressure die casting of metals with the injec-tion moulding of plastics; sheet and plate metal work with thecasting, lay-up, rotational moulding, vacuum forming techniques,and so on for plastics and composites.
Consideration of the whole of final product engineering, ofdesign as well as of manufacturing aspects, and of the relation of
38

these to each other, will often be a prerequisite to the fullexploitation of a material, and thus to the maintenance of itscompetitiveness, This may be illustrated by again referring tomotor car bodies. One of the more promising methods of produc-ing these is by the casting of self-foaming, self-skinningpolyurethane, Awareness of the simple fact that the productionof a relatively thick foam section could compensate for the lowYoung’s modulus, and for the relatively high cost per unitvolume of the solid plastic, has here led to the development of acompletely new materials system. Is it possible that thealuminium industry might have captured some of the marketnow held by plastics by the successful development of analogousprocesses?
The importance of effective final-product engineering in estab-lishing the competitive position of a material will obviously beaffected by prices, but a 20 percent price reduction would be ofno greater benefit than any improvements in quality, design, andmanufacturing ingenuity or in design data or codes of practice,which would allow a decrease of 20 percent in the amount ofmetal required for the manufacture of the final product. Thecompetition between materials is seen not to be so much a com-petition between alternative lumps of stuff, as between thewhole of the technologies associated with the competingmaterials.
Many products, now, and probably to an increasing extent inthe future, consist of systems of two or more materials, ratherthan of a single material. The steel industry already has a largemarket in construction by providing the materials for frame-works and for the reinforcement and pre-stressing of structuresin which other materials are used to fulfill functions for whichthey are more appropriate, One so-called “all-plastic” car had abumper made from bent tubular steel with rubber mouldedaround it. Some designs for plastic cars described by British Ley -land are based on tubular steel frameworks and plastic bodypanels. The framework-reinforcement concept is again beingsensibly employed to produce a design and manufacturingsystem combining the advantages of steel, its high strength andstiffness, with the ease of shaping plastics.
As materials are always a means to an end, it follows that the“qualities” and “properties,” the attributes in terms of whichmaterials are commonly characterised, have no absolute virtue.An attractive surface finish is of no value in objects which arenot required to satisfy aesthetic requirements; a high-tensile-strength material has no advantage in a compressive member; acorrosion-resistant material has no advantage in a product whichcan readily be protected from corrosion. A material with a high
39

ultimate tensile strength offers no advantage in making a compo-nent which is likely to fail under notch fatigue conditions, norone with a high Young’s modulus for making a component whichcan readily be thickened or reinforced to allow a cheaper, lowYoung’s modulus material to be used.
The requirement for optimizing materials is relevance andutility, and in descriptions of what is relevant and useful, con-sideration must be given to the processes of manufacture, indeedto the whole of the technology associated with materials, as wellas to the commercial and economic environment in which theyare used.
Materials, Manufacturing Processes, and the Economy
How do materials relate to manufacturing processes, to theeconomy, and to other resources? Consider first the sequence ofprocesses for the progressive conversion of iron ore into finalproducts shown in table 1. The sequence confirms the earlierstatement that materials and processes are inseparable aspects ofmanufacturing. Indeed, it is not obvious what a “material” is. Theoperator of each of the process stages will tend to call his input a“material” and his output a “product.”
There are many stages in the sequence, and it follows thatyield—the ratio of input to output —pIays an important role in re-source consumption. This may be seen from table Z, which showsthe weight of material input required per ton of final output in ahypothetical lo-stage sequence with equal yields, in each ofwhich an input weight “a” is required per ton of final output, If“a” = 1.1, then producing 1 ton of final output requires an inputof (1.1)10 = 2,6 equivalent tons at the first stage. Improving theyield so as to reduce “a” to 1.05 reduces the input requirement atstage 1 to (1.05)10 = 1.6 equivalent tons.
Many of the processes used in manufacturing waste ma-terials. In the engineering industries, up to half, and some-times more, of the materials purchased are turned into scrap dur-ing processes such as machining, forging, and stamping, Thiswastefulness is of importance not only in the direct way, but alsoindirectly for a wide range of manufacturing resources such asmanpower and capital, and of natural resources such as energyand materials, In the United Kingdom (U.K.), for example, morethan 3 x 1 06 tons of the 16.3 tons of steel bought by the engineer-ing industries in 1968 were resold, not in the form of products,but as process scrap. This means that roughly one in five blastfurnaces, one in five steelmaking furnaces, one in five rollingmills, etc., are employed in making steel which will be degradedto scrap in later stages of manufacturing. Not only is a proportion
40

TABLE I, –Sequence of Processes and Intermediate Products Involvedin the Manufacture of Final Products From Steel
Mining andbeneficiation
IIron ore(plus coke, limestone, and sinter)
IBlast furnace
IPig iron(plus ferro alloys, scrap, and fluxes)
ISteel making processes
ITeeming
I
Primary cogging mill
IBloom
IRerolling
IBillet
IRerolling
IHot-rolled products
I(black bar, hot-rolled strip)
IPickling
ICold roll or cold draw
ICold-finished products
IMachining, pressing, etc.
IEngineering components(car. bodies, machine parts, etc.)
IAssembly and finishing
IFinal products
4 1

—
TABLE 2. – Weight of Material Input Required Per Ton of Final Outputin a 10-Stage Process Sequence With a Ratio of
input weigh t = a; for a = 1.05 and 1.1output weight
o 1.0 1.6 2.6 tons
❑ Waste
Source: Becker and Pick (1975).
of steelmaking capacity thus wasted, but so also is a correspond-ing proportion of the labour, electricity, coal and coke, etc., re-quired for steelmaking. In addition, a proportion of the electricitygenerating, coal mining, and coke oven equipment which pro-duced the wasted electricity, coal, and coke, is also wasted, as aresome of the trucks and trains which take the steel to theengineering industries,
But even this is not the whole story, for the waste is spread tothose industries which produced this capital equipment. Thewaste of steel by the engineering industries thus in turn implies awaste of some of the concrete, aluminium, rubber, plastics, andindeed of the steel required to make this capital equipment,Clearly, any reduction in material waste in the manufacture offinal products could contribute much to conserve a wide range ofresources.
This stresses the importance of design, as is illustrated by thesimple example of table 3, which shows the effect of differentdesign approaches on the input of material required for themanufacture of a given product. It also stresses the importance ofmaterial specifications: what is specified by an engineering firmwill often have a profound influence on upstream process yieldand process costs, a matter emphasized by M. Cohen and W. S.
42

TABLE 3.– The Effect of Design und Manufacturing Method on theInput Weight Required To Produce a Component Having a Volume of 8
Cubic Inches
Volume of shaft: 8 in 7
a Machined from solid
b Sleeved1 1
I Ic Upset or cold-formed
I I_ Mater la l wasted
Volume of material required:a 18 in3 b 9in3: c 8 in3
Owen (1975) in a review of the probable directions of steeldevelopment in the future.
An impression of the resources consumed in conversion maybe obtained, if it is assumed that prices are approximately equalto costs (price = costs + profits) and a steel sequence in whichUnited Kingdom (U. K.) 1975 prices are given is shown in table 4,This illustrates that the cost of materials as purchased by theengineering industries is really a summation of upstream processcosts. The original iron ore, a very high proportion of which isnow imported into the U. K., accounts for a relatively small pro-portion of the total cost of final products. An analogous pattern isseen in table 5, which shows 1963 world output of aluminum inboth quantity and value terms.
Material costs, then, are a summation of the costs of the factorsof production, The range of these is diagrammatically illustrated in
4 3

TABLE 4. — Steel Sequence, Showing Approximate 1975 U.K. Prices
Molten Steel
TABLE 5.– The Build-Up of Value in the Progressive ConversionBauxite to Wrought Semifinished AJuminum Products
World Aluminum Production--1963
VALUE ADDED VALUE OF OUTPUT AT VARIOUS PROCESSING STAGES
INCREASE VALUE INPROCESS PRODUCT TONS iN VALUE DOLLARS
(MILLIONS) (MILLIONS) (millions)
Mining BAUXITE[$8/ton) 30 240 240
ORE ALUM! 14AREFtNiNG ($75/ton} 12 680 900
A1.UMINUM primarySMELTiNG i n g o tANO 6 . 1800 2700
REFINING ($450/ton)
FABRICATING WroughtAND S e m i sCASTiNG CASTINGS 6 3300

table 6, which shows the inputs to a single stage of a processsequence, and also draws attention to the fact that resources arerequired for transport and storage between stages, The fact that awide range of inputs is required for material conversion alsomeans that total conversion costs are cushioned against a pricechange in any one, This is illustrated in table 7, which shows howthe effect of 1972 oil price increases was diluted in the productionof plastics products.
Prices, as has already been mentioned, reflect costs, and henceresource consumption, Relative price movements tend to reflectrelative changes in technology and the efficiency of resourceconversion. A chart showing the relative price movements ofvarious U.S.A. goods between 1947 and 1970 is reproduced intable 8, which depicts the poor relative performance of metalsand metal products during the period, This reflects the fact thatimprovements in process efficiency have been achieved only atthe expense of very high expenditures on capital, According toDrucker (1969), this reflects a stale technology.
TABLE 6, –Symbolic Representation of Physical inputs IntoManufacturing Processes
PROCESS
4 5

TABLE 7, –Conversion Sequence for the Manufacture of Some PlasticsProducts, Showing the Percentage Increase in Price of Downstream
Products Resulting From a 300 Percent Increasein the Price of Crude Oil
Crude Oil Naptha*(+300%)
\
TABLE 8. – U.S.A. Price Changes in Various Products Between theYears 1947-1970
Fuels
Materials & componentsfor construction
Motor vehicles & equipment
Materials for food manufacturing
Chemicals & allied products
Foodstuffs and feedstuffs
1947 1957 1970
Source: Data from the Economic: Report of the President, 1971.
46

Description of Materials Flow Patterns
The flow of resources in materials conversion needs to be con-sidered in the wider setting of the economy as a whole, and thismay be done by reference to table 9, prepared for a forthcomingreport on engineering materials for the U,K.'s National EconomicDevelopment office. The hollow arrows in this table show theflows which are normally considered to be the materials/engi-neering stream of manufacture. Leaving aside the question of
‘defense, it is presumably an objective of a national materialspolicy to take initiatives and precautionary measures which arelikely to have an impact significant in the context of pattern offlows, or to create new knowledge and understanding to supportsuch initiatives,
It is now proposed to indicate some features of this pattern offlow which may be of assistance in judging what is economicallysignificant. The question of materials supply is being covered inother conference papers, thus only aspects of conversion beyondthe raw materials stage will be considered.
First is the question of the destination of the output of thematerials industries. Table 10, based on work by Becker (1976),then a Research Fellow in the author’s University IAston], duringa period as visiting Fellow at Brandeis University, shows that
ENERGYENERGY AND INDUSTRIESENERGYMATERIALS CHEMICAL
INDUSTRIES
FORESTRY
LAND
AGRICULTURE
SEA FISHERY
PLANT ANDMACHINERY
FOOD,PHARMACEUTICAL,AND OTHERCONSUMERPRODUCTS
47

— ——
TABLE 10. –Destination of the Output of the U.S.A. MaterialsIndustries by Categories of Final Demand
consumer expenditure in the U.S.A. accounts for 42 percent ofthe demand for materials, capital formation being next in impor-tance, accounting for some 26 percent.
For a given level of conversion efficiency, the requirement formaterials depends on the level of final demand; one possible re-sponse to material shortages is to reduce the level of finaldemand. But the materials content of various levels of finaldemand is not the same, as maybe seen from the data in table II.The materials content of consumer expenditure is, for example,only 12 cents per dollar, compared with 32 cents per dollar forcapital formation. Any government measures leading to auniform change in expenditure, spread across all categories offinal expenditure, would have a much bigger effect on materialconsumption via the capital goods industries than on materialsdemand via consumer expenditure.
One of the most important features of the flows in table 8 isthat the “materials” flows indicated by hollow arrows are inter-
4 8
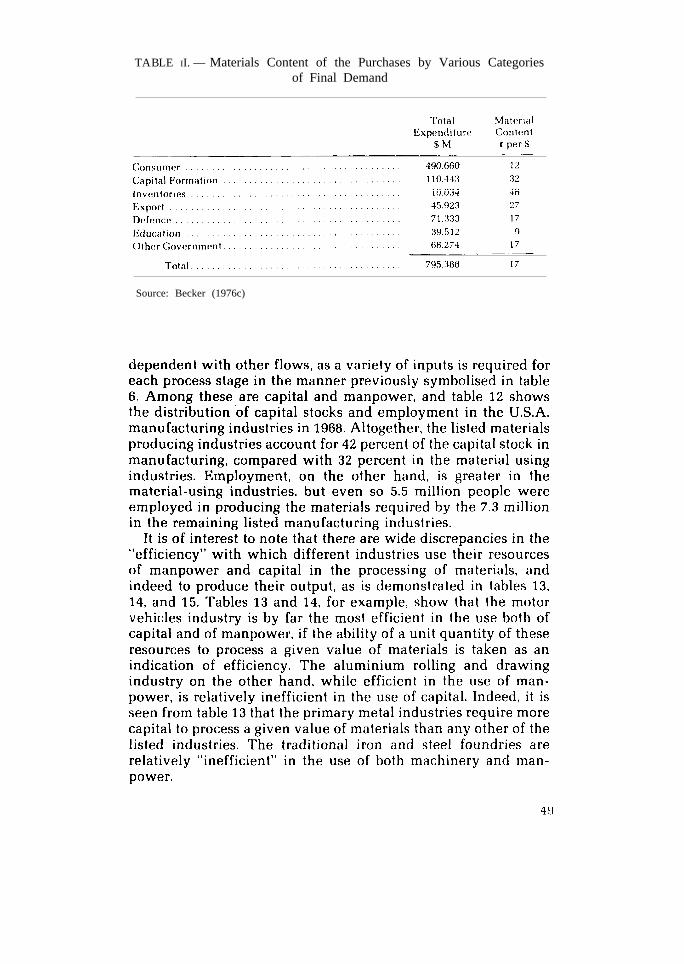
TABLE II. — Materials Content of the Purchases by Various Categoriesof Final Demand
Source: Becker (1976c)

I

Materials-producing industries (a)
Materials-using industries (b)

TABLE I3.– Relationship Between Direct Materials and CapitalRequired To Produce $1 Million of Output in 1967
TABLE 14,–Relationship Between Direct Materials and LaborRequired To Produce $1 Million of Gross Output in 1967
in Various U.S. Industries
52

Table 15 gives an overall impression of the value of machineryand the thousands of man-hours required to produce a milliondollar’s worth of output in 1967. Any industry near the origin willbe relatively efficient in the use of both these resources, It is seenthat motor vehicles are again the best performer, and iron andsteel foundries the worst. as assessed by this admittedly crudecriterion.
TABLE 15. — Relationship Between Capital and Labor Requircmentsfor the Production of $1 Million of Output in 1967
in Various U.S. Industries
Materials Interdependence
The interdependence of materials with other resources mayalso be illustrated by reference to the role of energy in materialsconversion. Table 16 shows that the primary conversion indus-tries are the dominant energy consumers in manufacturing, withthe primary metal industries in the lead, followed closely by thechemical industry, with two other materials groups (stone clayand glass products, and paper) also high on the list. Numericalvalues for the uses of fuels and purchased electricity in the U.S.material producing industries are given in table 17.

TABLE 16.– Purchased Energy Used in Manufacturing for MajorIndustry Groups: 1962, 1958 and 1954
Kilowatt Hours EquivalentBillions
o 100 200 300 400 500 600 700
Primary Metal Industries
Chemicals and AlliedProducts
Petroleum and Coal Products
Stone, Clay, and GlassProducts
Paper and Allied Products
Food and Kindred Products
Transportation Equipment
Textile Mill Products
Machinery, Except Electrical
Fabricated Metal Products
Electrical Machinery
Rubber and PlasticProducts, NEC
Lumber and Wood Products
Miscellaneous ManufacturingIncluding Ordnance
Printing and Publishing
Instruments and RelatedProducts
Furniture and Fixtures
Apparel and RelatedProducts
Leather and LeatherProducts
Tobacco Manufactures
0 100 200 300 400 500 600 700Billions
Source: US. Census of Manufactures for 1963.
Energy purchases by the engineering industries, even by thehuge transportation equipment industry (which includes land,sea, and air transport equipment), is relatively small. But thisrelatively low direct purchase of energy by the engineeringindustries is clearly only part of the story, For in order to assessthe total energy content of the products of an engineering firm, itis also necessary to take account of the indirect purchases of theenergy used by its suppliers of materials and components, of
54

TABLE 17. – U.S.A. Consumption of Fuel and Electrical Energy, 1963(Taken from U.S. Census of Manufactures)
All manufacturing industries. ... ., . . . . . . . . 6370 3410 2960
Materials and industries:Lumber and wood. . . . . . . . . . . . . . . . . . . . . 183 115 68Paper and paper products . . . . . . . . . . . . . . . . . . . . . 472 305 167 ‘Rubber and plastics, ., . . . . . . . . . . . . . . . . . . . . . . . 128 44 83Stone, clay, and glass . . . . . . . . . . . . . . . . . . . . 576 403 173Primary metal . . . . . . . . . . . . . . . . . 1389 858 530Fabricated metal products . . . . . . . . . . . . . . . . . . . . . 240 100 139T o t a l f o r m a t e r i a l s I n d u s t r i e s . . . 2988 1825 1160
Materials industrles as percentage
o f a l l m a n u f a c t u r i n g i n d u s t r i e s . 47% 53% 39%
capital and transport equipment, and of services. As these sup-pliers in turn have their suppliers, a complex summation is re-quired to assess total (= direct + indirect) requirements, Accountmust be taken of all the energy used by upstream firms insequences of the kind illustrated in table 1,
This total, direct plus indirect, flow of energy may readily becomputed by the use of industrial transaction matrices aspublished by most industrialised countries in the form of Input-Output tables. The results of such a calculation for the U.K. areshown in table 18, from which it is evident that for each of theindustry groups, energy purchases via materials are considerablyhigher than direct energy purchases. And the results given intable 18 are likely to be conservative, since, for reasons ofsimplicity in calculation, they do not include the energy requiredto produce imported materials and to transport them to the U.K.Nor do they take account of the energy used to produce thecapital stock of the materials producing and engineering indus-tries.
Analogous results for U.S. automobile production were re-ported by Hirst (1972) who estimated that a direct purchase of5,850 Btu/dollar of automobiles shipped was matched by anindirect purchase of 48,420 Btu/dollar shipped via materials and
55

TABLE 18. – U.K. Direct and Indirect Purchase of All Energy by theEngineering-Type industries in 1968
other supplies. Among these, iron and steel play a dominant rolebecause these account for the bulk of the weight of the automo-bile.
From the above description, it follows that there is an intimaterelation between the way materials are produced and used indesign and production, and the use of national resources. It willalso be evident that there is a gearing effect in the way in whichmaterials are used: in the earlier discussion of the consequencesof waste in engineering manufacture, it was shown that suchwaste produces ripples having effects on resource utilisation atpoints remote from the point of actual decisionmaking.
From the preceding description of the relation betweenmaterials and energy, it follows that any changes in specification,design, or manufacture of automobiles which would lead toreduction in weight would also have widespread consequencesfor energy requirements throughout the economy, partly throughthe obvious saving of fuel in running automobiles, but alsothrough savings in materials manufacture, capital stock, etc., ofthe kind just described. Technical changes of this kind provide alarge reserve-in-principle which could, given time for re-equip-ment, be used in the face of resource constraints, But, as suchchanges would also lead to a decrease in economic activity and toa change in social habits, their implementation, although widelydiscussed in the materials literature, in fact becomes an issue forindustrial and social strategy rather than for materials policy assuch,
56

Manufacturing Requirements of Materials
In this final section of the paper, it is proposed to consider therelation between specific materials and the resources of energy,capital, labour, and imports used in their manufacture. This mayconveniently be done by using the concept of resource “inten-sities, ” which may be defined as the value of a particular re-source required to produce a dollar’s worth of the output of a par-ticular material.
For reasons previously discussed, it is necessary to takeaccount of both direct and indirect requirements of a particularresource in order to assess the intensity of that resource in themanufacture of a material. For example, of the crude oil andnatural gas required for the manufacture of plastics, very littlereaches the plastics industry directly in the form of crude oil: 27percent of it reaches it in the form of refined oil, 55 percent aschemicals, 5 percent as electricity, 2 percent as transport, and theremaining 11 percent in other forms. Altogether, 3.2 cents ofcrude oil and natural gas need to be produced in order to produceone dollar’s worth of plastics, but this will reach the plasticsindustry only after being processed into other forms, as indicatedin the previous sentence. Three and two-tenths cents per dollar isthe crude oil plus natural gas intensity of plastics materials.
Extensive investigations of the total energy requirements formaterials manufacture have been carried out in recent years, themost thorough probably those on behalf of the recent NationalCommission on Materials Policy. But values for resource inten-sities may also be read off directly from the total requirementsmatrix of published input/output tables, They have been plottedby Becker in easily interpretable form in tables 19 to 21. The firstof these shows in the left-hand diagram of table 19, the intensitiesof crude oil and natural gas consumption by the various U.S.materials industries in 1967. As expected, the plastics industry isthe most intensive user of these fuels, followed closely by paint,while other materials such as steel have a relatively low inten-sity. (From this it is possible, for example, to infer that any in-crease in the price of crude oil and natural gas will place plasticsat a competitive disadvantage with products containing a smallerpercentage of these fuels.)
In order to assess the effect of these resource intensities on theeconomy as a whole, however, it is necessary also to take accountof the gross output of the various materials industries, and theseare illustrated in table 19. These tables show that the primarymetal industries, and in particular the primary steel industry,have an output considerably in excess of, for example, theplastics industry. The result is that, although steel has a relatively
57

0

low oil and gas intensity, the overall effect on the economy of aprice increase in these fuels would be greater via steel than viaplastics.
The middle diagram of table 19 shows the total (direct plusindirect) expenditure on oil and gas of the various industrieslisted, The right-hand diagram is analogous to the central one,but it only shows the oil and gas content of the output of thevarious materials industries, which has i ts dest inat ion inengineering and construction, From this it is seen that any priceincrease in oil and gas has its major effect via steel, nonferrousmetals, and building materials. Analogous data for some other re-sources are plotted in tables 20 and 21, It is not proposed toanalyze these in detail, but reference may be made to the case oflabor to indicate that the labor intensities of different materialsare not very widespread. But there are differentials. Wood, forexample, is more labor-intensive than plastics, with the conse-quence that any uniform increase in wage rates would lead togreater price rise in wood than in plastics.
The foregoing discussion will have demonstrated that eachtype of material has specific quantifiable implications for a widerange of resources, which will be different from those required inthe manufacture of other materials.
It is therefore of interest to assess here the effects of materialsubstitution on the requirement of other resources. For the econ-omy as a whole, these may again be calculated by the use ofinput/output analysis, Becker has developed a method of pre-senting the results of such a computation in the form of what heterms “Resource Isoquants,” A series of these, indicating theeffects of the substitution of plastics for steel on capital stock, onlabor, and on oil and gas, is shown in table 23. These isoquantsare plotted to enable the aggregated effect of substitution on re-sources to be assessed for a range of substitution ratios (i.e., thenumber of dollars’ worth of plastic required to substitute for onedollar’s worth of steel).
From table 23 it is thus seen that a substitution of $0.95 dollarsof plastic for steel would have no effect on capital stock, while asubstitution of 20 percent at a substitution ratio of 2 would lead toan increase in the requirements of capital stock by over $8 billion.Similarly, as plastics and steel have roughly the same labor inten-sity, substitution on a one-to-one basis in money terms wouldhave relatively little effect on employment. To substitute a dol-lar’s worth of plastic for a dollar’s worth of steel would require anincrease in the labor force. Plastics are very much more oil andgas intensive than steel, Any substitution which required morethan about 40 cents’ worth of plastic per dollar of steel wouldlead to an increased consumption of these fuels,

. “

TABLE 21. –Capital Content of Materials. Labour Content of MaterialsCapital Content of Materials
Ferrous Ore
Nonferrous Ore
Quarrying
Wood
Paper
Plastic
Paint
Rubber
Leather
Glass
Bulldlng Mats
Steel
Nonferrous Metal
Ferrous Ore
Nonferrous Ore
Quarrying
wood
Paper
Plastic
Paint
Rubber
Leather
Glass
Bulldlng Mats
Steel
Nonferrous Metal
Intensity
0 - $
It I 1 I 1 I 1
1
III
1
1’I
For Gross Output
‘ P
Labour Content of MaterialsFor Groes Output
0.5 1.0 1.5 M
“ r
man-years
For Engineering and Construction
o 05 1.0 1.5 MI
man-year.

TABLE 22.– Value Added and Value of Shipments of a Number ofU.S.A. Industries in 1967
Value of ValueSIC. Industry Shipments Added
$106 $106
2426
282
28513031
323334
25
35
36
37
38391920
All manufacturingLumber and wood productsPaper and allied productsPlastics, materials syntheticsPaints and allied productsRubber and plastics products, n.e.c.Leather and leather productsStone. clay, and glass productsPrimary metal industriesFabricated metal productsFurniture and fixturesMachinery, except electricalElectrical equipmentTransportation equipmentInstruments and related productsMiscellaneous manufacturing industriesOrdnance and accessoriesFoodTextiles, etc.
557 26511 521 9
7 43 1
13 75 3
14 847 2035 18
8 448 2843 2469 2811 6
9 511 684 27
Remainder
Value of ValueS.I.C, Industry Shipments Added
$106 $106
2821 Plastics materials and resins 3-5 1-62822 Synthetic rubber 0-9 0-43011 Tyres and inner tubes 3-7 1-83069 Fabricated rubber products. n.e.c. 3-1 1-73079 Miscellaneous plastics products 5-4 3-0
331 Blast furnace and basic steel products 23-1 10-2332 Iron and steel foundries 4-3 2-6333 Primary nonferrous metals 3-7 1-4
3341 Secondary nonferrous metals 1-6 0-3335 Nonferrous rolling and drawing 9-9 3-3336 Nonferrous foundries 1-9 1-1
3541 Machine tools. metal-cutting types 2-1 1-43542 Machine tools. metal-forming types 0-7 0-4
371 Motor vehicles and equipment 40-3 13-7372 Aircraft and parts 21-1 11’3373 Ship and boat building and repairing 3-1 1-7
Source: U.S. Department of Commerce, Census of Manufactures.
62

0
0
0
0
.Y00
63

Finally, it may be of interest to note that any substitution ofmaterials for one another would have effects not only on total re-source requirements, but also on regional requirements, becausethe production of various materials tends to be concentrated inspecific regions. This is shown in table 24, drawn by Becker(1976), the top map of which shows how 915,000 men employedin the U.S. steel industry are distributed throughout the country.In addition to the manpower directly employed in the steelindustry, an additional 808,100 men were required to produce theore, coal, coke, electricity, and all the other inputs required forsteelmaking. These were distributed as in the second map, Totalemployment in steel manufacture and in its supply industries isshown in the third map on table 24. From these maps it will beevident that any change in the pattern of steel usage will have aneffect on regional employment, and that the total effect of thiswill be greatest in the East North Central and Middle Atlanticregions,
To assess the effect of changes of this kind on regional employ-ment, one must allow for the fact that these regions are alsocharacterized by high total population by calculating the regionalintensity of employment for various materials industries (theproportion of the work force in a region employed in a materialsindustry), Maps indicating regional intensities have also beenplotted by Becker, and these are reproduced in table 25, inwhich the black bars represent direct employment intensity; thehollow bars, indirect employment intensity. From these maps itwill be evident that any changes in the use of one material rela-tive to another or to industrial output generally would also haveimplications for regional employment,
Concluding Remarks
The field of materials is inseparable from manufacturing proc-esses. The demand for materials is a derived demand dependingon the demand for goods and services and on the efficiency of theprocesses involved in converting materials into final products,For a given volume of goods, the demand will depend on productand material specification as well as on design and productionskills. The nature and quality of the materials specified in designwill determine the range of resources required for manufacture.Conversely, design can only take place within the framework ofwhat is available, feasible, and socially acceptable.
In this paper an attempt has been made to remind the con-ference of the vast capital stock involved in technology as it is.From this it follows that there is little short-term flexibility in themanufacturing system, other than a reduction in economic
64

65

66

—
activity, and that time is needed to effect change on a significantscale, particularly as any fundamental changes in materials tech-nology will also need to be supported by appropriate changes inthe infrastructure.
One of the themes developed in this paper is the inter-dependence of materials with other physical resources and withwider aspects of the industrial, economic, and social environ-ment. Recognition of this interdependence has widespread con-sequences, At the practical level, any decisions on specifications,design, or investment at any point in the system will lead to fulloptimisation only if account is taken of interactions with otherparts of the system. Recognition of this obvious fact may give riseto innovative action in industry and to new directions for re-search and development, At a more general level, the recognitionraises the question whether’ the development and optimisation oftechnology, which is largely determined at company level, islikely to take beneficial long-term directions unless a widerframework of knowledge and ideas regarding the system as awhole is also generated. This matter has hitherto tended to be theprovince of economists. Perhaps it is time for it to be explored inengineering terms.
Justifiable concern is often expressed, both in the - Uni tedKingdom and in the United States, that attention to materials inGovernment and industry tends to lack coherence. It is hoped thatthe description of interdependence contained in the presentpaper will strengthen the case for a coherent approach. At thesame time, in a vast field like materials, a high proportion of theinitiative and of the work will always need to take place at thelevel of the particular. It is suggested that obtaining the necessarycoherence at the general level may require not only administra-tive measures, but the development of a coherent intellectualframework as well.
References
1. This paper is based on previous publications by the authorand by P. Becker, These are listed below, and reference may bemade to them for details of sources and methods.
PICK, H. J.1968a “Materials and Processes in Component Pro-
duction– The Interrelation Between the Require-ments of Fabrication Service and Cost. ”In Avoidance and Failures in Fabrication and Serv-ice, Iliffe, London.
67

1968b
1970a
1970b
PICK, H, J.1973
PICK, H. J.,1975
1975
BECKER, P.1976a
1976b
1976c
“The Role of Materials in Engineering and in theEconomy,” Metals and Materials, 1968, Vol. 2, pp.263-279, 293.“The Challenge of the New Materials Technology,”Metals and Materials, Vol. 4, p. 145-151.“Some Economic Consequences of Technical Deci-sions,” Materials Science and Engineering, Vol. 10,pp. 301-323.
“The Relation Between Materials and Manufactur-ing Systems,” Development of Production Systemsand the Need for Further Research, 2nd Inter-national Conference on Production Research,Copenhagen, ed. G. H. Gudnason & E. N. Corlett;Taylor & Francis, London.
AND BECKER, P.“Direct and Indirect Uses of Energy and Materialsin Engineering and Construction, ” Applied Energy,Vol. 1, No. 1.“Resource Implications of Materials Waste inEngineering Manufacturing,” Resources Policy, Vol.1, No. 3.
Materials, Engineering and the Economy: An Input-Output Study of TechnicaJ Decisions in the U. K.,Ph.D. Thesis, The University of Aston in Birming-ham, Birmingham, England.“The Economic Role of Engineering Materials inthe U. K.” Resources Policy (forthcoming).James Watt Memorial Lecture, University of Aston.
2, Other References
COHEN, M. & OWEN, W. S.1955
DRUCKER1969
HIRST, E.1972
“A Forward Look at Steel Development,” Proc.Rosenhain Centenary Conference, p. 223.
P. F,“The Age of Discontinuity,” Heineman, 1969.
“How Much Overall Energy Does the AutomobileRequire?” Automotive Engineering, July 1972.
U.S. DEPARTMENT OF COMMERCE, BUREAU OF ECONOM-IC ANALYSIS, Survey of Current Business, Input-output tablegiven in Vol. 54, No. 2, 1974.
68

U.S. DEPARTMENT OF COMMERCE, BUREAU OF ECONOM-IC ANALYSIS, Input-Output Structure of the U.S. Economy:1967, U. S. G. P. O., 1974.
U.S. DEPARTMENT OF COMMERCE, BUREAU OF THE CEN-SUS, 1967 Census of Manufacturers, U. S. G. P. O., 1974.
U.S. DEPARTMENT OF LABOR, BUREAU OF LABORSTATISTICS, Employment and Earnings: States and Areas1939-1972, Bulletin 1370-10.
U.S. DEPARTMENT OF COMMERCE, BUREAU OF THE CEN-SUS, Census of Mineral Industries, 1963, Vol. 11, Area Statistics,P. C3.216/5.
69