Embed Size (px)
Citation preview

Monday 15, 2007
Kamal Shehadi
The Case for Liberalizing Telecommunications in Lebanon
“Paris III and the Post War Landscape: Lebanon’s Economic Policy Imperatives”

Lebanon remains far behind its neighbors in terms of telecommunications liberalization
Comparison of Telecom Market in Key Arab Markets (2000-2006)
Notes: M = Monopoly; D = Duopoly; C = Competition; PC=Partial Competition
Sources: ITU Trends in Telecommunication 2001, 2006
CountryCountry Incumbent OperatorIncumbent Operator
Lo
ca
lV
oic
eL
oc
al
Vo
ice
Intl
V
oic
eIn
tl
Vo
ice
Mo
bil
eM
ob
ile
Da
taD
ata
Lo
ca
lV
oic
eL
oc
al
Vo
ice
Intl
V
oic
eIn
tl
Vo
ice
Mo
bil
eM
ob
ile
Da
taD
ata
Date of Opening of Last Market
Segment
Date of Opening of Last Market
Segment
CommentsComments
AlgeriaAlgeria Algerie Telecom (2003)
Algerie Telecom (2003) MM MM MM MM DD DD CC DD 20052005 Market entry still highly
regulatedMarket entry still highly regulated
EgyptEgypt Telecom Egypt (1998)
Telecom Egypt (1998) MM MM DD MM MM CC
D C
D C CC
20062006Third mobile and 2 international gateway licenses
Third mobile and 2 international gateway licenses
JordanJordan Jordan Telecom Company (1997)Jordan Telecom Company (1997) MM MM PCPC CC CC CC CC CC 20052005 Open licensing regime since
January 2005Open licensing regime since January 2005
MoroccoMorocco Maroc Telecom (1996)
Maroc Telecom (1996) MM MM CC CC CC CC DD CC 20052005 Market entry still highly
regulatedMarket entry still highly regulated
BahrainBahrain Batelco (1981)Batelco (1981) MM MM MM MM CC CC PP CC 20042004 Open licensing regime since January 2005Open licensing regime since January 2005
Saudi ArabiaSaudi Arabia Saudi Telecom Company (1998) Saudi Telecom
Company (1998) MM MM MM MMM D
M D
CC CC CC 20072007 Fixed and mobile licenses to be issued in 2007Fixed and mobile licenses to be issued in 2007
OmanOman OmanTel (2001) OmanTel (2001) MM MM MM MM DD DDD C
D C CC
2006-20072006-2007Fixed and data network licenses to be issued in 2007
Fixed and data network licenses to be issued in 2007
LebanonLebanonMinistry/Ogero
Not corporatized
Ministry/Ogero
Not corporatizedMM MM DD CC MM MM DD PCPC TBDTBD
Liberalization expected with the implementation of Law 431/2002
Liberalization expected with the implementation of Law 431/2002
2000 2006

As a result, its telecom is underdeveloped when compared to international benchmarks and there is a high pent-up demand for services
Bahrain
Jordan
Morocco
Tunisia
United Arab Emirates
Egypt
Algeria
Venezuela
Romania
Chile
South Africa
Poland
Bulgaria
Slovakia
Hungary
Singapore
Ireland
Italy
Libya
LEBANON
y = 0.3441Ln(x) - 2.1968R2 = 0.6852
0%
20%
40%
60%
80%
100%
120%
140%
160%
180%
200%
0 10,000 20,000 30,000 40,000 50,000 60,000
Fixed Line Penetration vs. GDP per Capita (2005)
PS
TN
Pen
etra
tion
GDP per Capita (USD/ Year)
LEBANONLibya
Italy
Czech Republic
IrelandSingaporeHungary
SlovakiaBulgaria
PolandSouth AfricaChile
Romania
Venezuela
Saudi Arabia
Algeria
Egypt
United Arab Emirates
Tunisia
Morocco
Jordan
Bahrain
Russia
Qatar
Kuw ait
y = 0.2162Ln(x) - 1.1851R2 = 0.7209
0%
20%
40%
60%
80%
100%
120%
140%
0 10,000 20,000 30,000 40,000 50,000 60,000
Mobile Penetration vs. GDP per Capita (2005)
Mob
ile P
enet
ratio
n
Libya
US
Germany
Spain
UK
ItalyFrance
Egypt
UAE
Qatar
KSA
Bahrain
LEBANON
Jordan
Venezuela
Saudi Arabia
PeruEgypt
Algeriay = 0.1165Ln(x) - 0.689
R2 = 0.483
0%
10%
20%
30%
40%
50%
60%
70%
80%
90%
100%
0 10,000 20,000 30,000 40,000 50,000
Internet Penetration vs. GDP per Capita (2005)
Inte
rnet
Pen
etra
tion
GDP per Capita (USD/ Year)
Sources: Economist Intelligence Unit, interviews with industry
GDP per Capita (USD/ Year)
Lebanese Telecommunications Performance

The cost of a mobile postpaid minute in Lebanon is among the highest in the region due to the lack of competition and a high excise tax
Mobile Postpaid Peak On-net Minute Rates (2006) (US$ cents per peak minute)
Note: All Rates corresponds to the lowest first minute rate
8
8
8
7
6
4
6
13
13MTC touch
Alfa
Etisalat
STC
MobileCom
Fastlink
Batelco
Mobinil
Umniah
38
36
17
14
12
8
8
8
7
MTC Touch
Alfa
STC
Fastlink
Batelco
Umniah
MobileCom
Etisalat
Mobinil
Mobile Prepaid Peak On-net Minute Rates (2006) (US$ per peak minute)
More than double the lowest regional
rate
60% higher than the lowest regional
rate

Telecommunications has suffered from slow mobile penetration growth…
Sources: AAG, 2006 data from OSB (till November), CIA, ITU, Ministry of Telecommunications* Up to October 2006
Mobile Penetration Evolution in Lebanon
Mobile Penetration Evolution in Lebanon (2000 - 2006)
22.8 22.7 23.4 22.924.8 24.9
27.5
0
200
400
600
800
1000
1200
2000 2001 2002 2003 2004 2005 2006*
Year
Su
bs
cri
be
rs (
Th
ou
sa
nd
s)
0
5
10
15
20
25
30
Pe
ne
tra
tio
n R
ate
Subscribers Penetration
+8%
+10%
CAGR+0.4%
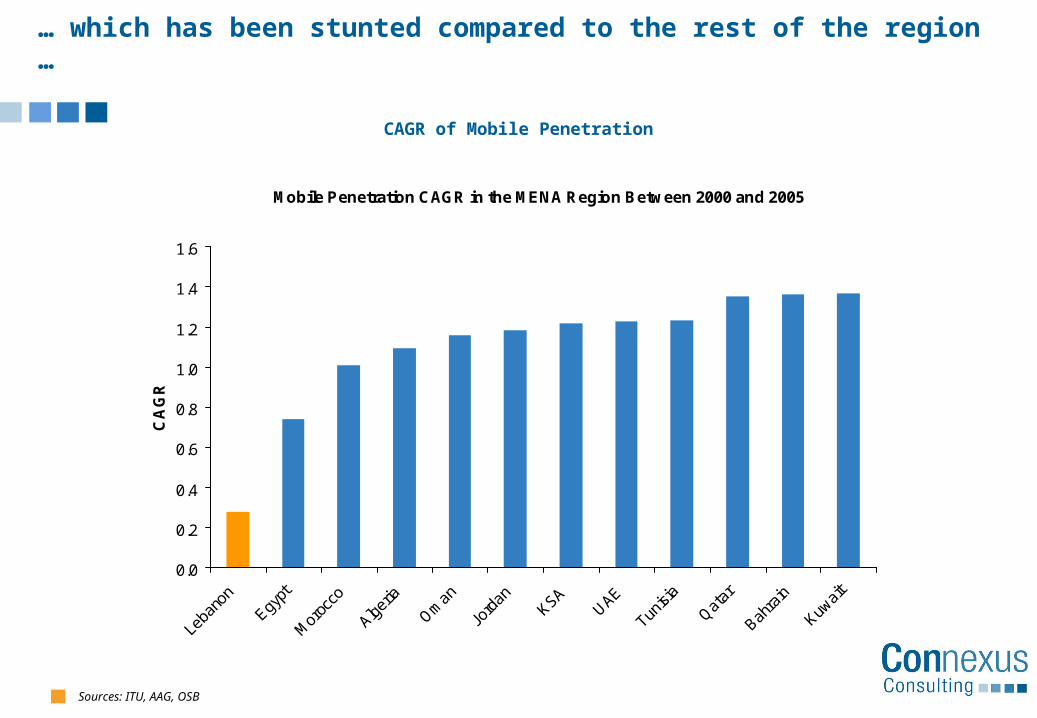
… which has been stunted compared to the rest of the region …
Sources: ITU, AAG, OSB
CAGR of Mobile Penetration
Mobile Penetration CAGR in the MENA Region Between 2000 and 2005
0.0
0.2
0.4
0.6
0.8
1.0
1.2
1.4
1.6
Leba
non
Egypt
Mor
occo
Algeria
Oman
Jord
anKSA
UAE
Tunisi
a
Qatar
Bahra
in
Kuwai
t
CA
GR

… particularly over the last few years
Sources: ITU, AAG, OSB
Mobile Penetration Evolution in the MENA Region
Mobile Penetration Evolution in the MENA Region
0
20
40
60
80
100
120
1994
1996
1998
2000
2002
2004
2006
Year
Pe
ne
tra
tio
n R
ate
Algeria Bahrain Egypt Jordan KSA Kuwait
Lebanon Morocco Oman Qatar Tunisia UAE
Lebanon
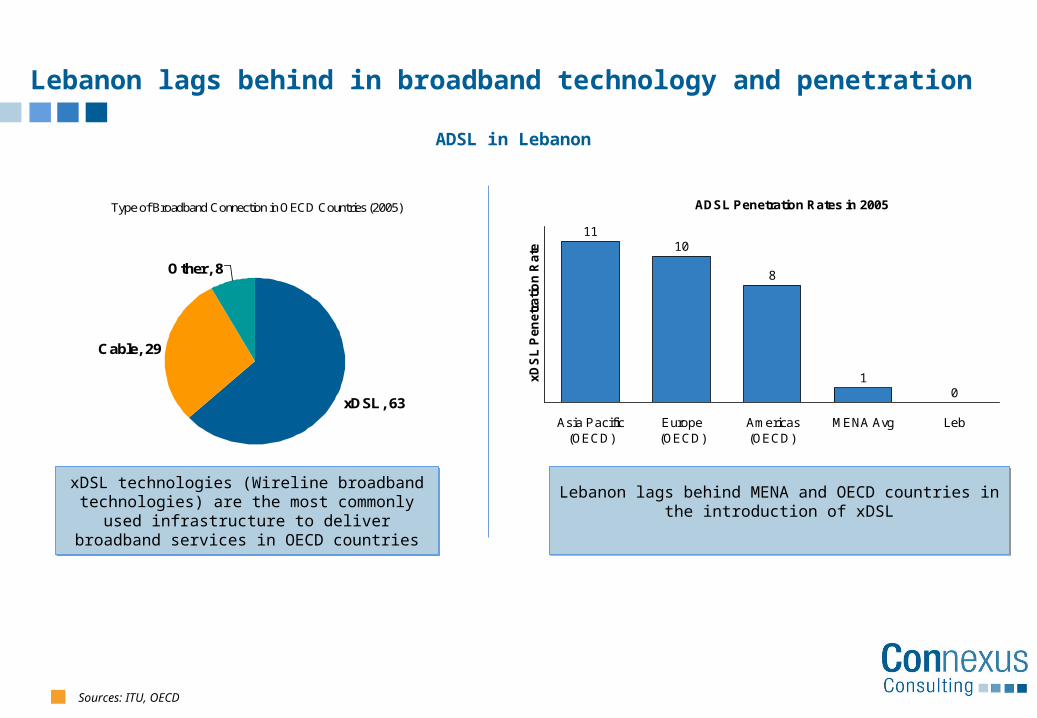
Lebanon lags behind in broadband technology and penetration
ADSL Penetration Rates in 2005
1110
8
10
Asia Pacific(OECD)
Europe(OECD)
Americas(OECD)
MENA Avg Leb
xD
SL
Pe
ne
tra
tio
n R
ate
Type of Broadband Connection in OECD Countries (2005)
Other, 8
Cable, 29
xDSL, 63
xDSL technologies (Wireline broadband technologies) are the most commonly used
infrastructure to deliver broadband services in OECD countries
xDSL technologies (Wireline broadband technologies) are the most commonly used
infrastructure to deliver broadband services in OECD countries
Lebanon lags behind MENA and OECD countries in the introduction of xDSL
Lebanon lags behind MENA and OECD countries in the introduction of xDSL
ADSL in Lebanon
Sources: ITU, OECD

Governments have pursued a number of objectives when embarking on telecommunications liberalization
Keep up with technological advances Introduce good governance and management Ensure more effective infrastructure Improve sector productivity Improve financial performance Increase overall telecom revenues Attract private and foreign capital Improve connectivity and penetration of ICT
Spur job creation throughout the economy Generate revenues from licenses Generate revenues from privatization Join international trade organizations (e.g. WTO) Join the global trading system (e.g. EU association) Catalyze growth of information economy Improve global competitiveness of the economy Improve general economic performance
Increase service penetration Increase customer choice Improve price to quality ratio Introduce new technologies and services Reach underserved areas
Attract InvestmentsAttract Investments
Networked ReadinessNetworked Readiness
Economic DiversificationEconomic Diversification
Trade IntegrationTrade Integration
Customer Oriented
Sector Oriented
Economy Wide
Liberalization Objectives
Increase Customer Choice
Increase Customer Choice
Increase Penetration Increase Penetration 11
Efficient IndustryEfficient Industry33
Job CreationJob Creation44
Ob
jec
tiv
es
of
Te
lec
om
L
ibe
rali
zati
on
Lower TariffsLower Tariffs22

Liberalization will improve penetration and decrease telecommunications tariffs
Sources: Tarifica, Operators, Booz Allen and Hamilton, Global Investment House, World Bank
In Jordan, a country with comparable population and size but much lower per capita income, liberalization and licensing of new mobile operators met with jumps in mobile penetration. Real benefits were realized after the introduction of the third and fourth mobile operators
Impact of Telecom Liberalization on Penetration and on Prices
Mobile Penetration in Jordan
0
10
20
30
40
50
60
70
1995
1996
1997
1998
1999
2000
2001
2002
2003
2004
2005
Year
Pe
ne
tra
tio
n R
ate
Fa
stlin
k
Mo
bile
com
Xp
ress Um
nia
h
0
20
40
60
80
100
120
y-3 y-2 y-1 y 0 y+1 y+2
Batelco STC Fastlink Qtel
Prices start decreasing prior to competition in a move to prepare for the entry of a new operatorAs a result of competition prices tend to continue decreasing after liberalization unless capped by the regulator
Year competition introduced in
concerned markets, 2004 for Qtel
Evolution of Lowest Mobile Peak Minute Rate 22
Evolution of Mobile Penetration In Jordan 11

Liberalization improves enterprise performance throughout the economy and drives higher employment in telecommunications
Sources: Petrazzini, World Bank
Impact of Telecom Liberalization on the Industry and on Employment
Enterprise employment growth
1.2%
Sales growth 3.4%
Profitability 5.1%
Investment rate 2.5%
Re-Investment rate 6.0%
Total factor productivity 1.0%
Worldwide, telecom liberalization has positively impacted sector performance and the penetration of key services. A 2006 World Bank study demonstrates how greater ICT use in enterprises results in and improvement of performance
Effect of Liberalization on Industry 33 Effect of Liberalization on Employment
44
1990 1992 1993 1994199190
120
110
100
Competitive Markets
Monopoly Markets
Employment (normalized)Index 1990 = 100
A comparative analysis of 26 countries in Asia and Latin America between 1990 and 1994 shows that employment in competitive markets increased by 20.73% while employment in other markets grew by only 3.13%

There are a number of issues that will shape Lebanon’s liberalization
Key Issues Shaping Lebanon’s Liberalization Strategy
Exclusivity and Additional Licenses
Exclusivity and Additional Licenses
Government Ownership
Government Ownership
Revenue Sharing
Revenue Sharing
How will granting an exclusive international license impact the fixed and data markets When should a 3rd mobile license be issued? How will the timing impact performance? The
economy? The financial performance of existing operators?
How will granting an exclusive international license impact the fixed and data markets When should a 3rd mobile license be issued? How will the timing impact performance? The
economy? The financial performance of existing operators?
How much of a stake will the government maintain in telecom operators? How will cross ownership management issues be resolved, particularly with the
government’s ownership of all operators today? What will the impact be on performance and investment?
How much of a stake will the government maintain in telecom operators? How will cross ownership management issues be resolved, particularly with the
government’s ownership of all operators today? What will the impact be on performance and investment?
Is the argument for high revenue sharing still valid considering today’s telecommunications landscape?
Is the argument for high revenue sharing still valid considering today’s telecommunications landscape?
Type of Competition
Type of Competition
What type of competition is the most apposite to the development of the mobile and fixed market in Lebanon? Service-Based or Facilities-Based Competition?
What is the impact of each type of competition on the telecommunication market? What lessons could be drawn from other countries?
What type of competition is the most apposite to the development of the mobile and fixed market in Lebanon? Service-Based or Facilities-Based Competition?
What is the impact of each type of competition on the telecommunication market? What lessons could be drawn from other countries?

Some governments have been lured by the false promise of exclusivities
Exclusivity PeriodsExclusivity Periods
In order to attract greater investment, liberalizers (particularly in the MENA region) offered telecom operators exclusivity periods
This was balanced with exclusivity terms that required high quality of service and rollout
Both Jordan and Egypt offered their fixed line operators exclusivity resulting in delayed competition and greater incumbent dominance in the market
Exclusivities have detrimental effects on network growth and performance (up to 40% less coverage), despite the increased valuation of such operators
It is for this reason that many Latin American countries such as Chile, Bolivia and Brazil, have chosen not to give privatized operators any exclusivity periods
Lebanon is embarking so late in the game that exclusivities will be difficult to justify on economic or even financial grounds
Potential of Exclusivity PeriodsPotential of Exclusivity Periods
Exclusivity Competition
Price of Privatized Telecom Operator
50%
Exclusivity Competition
40%
Impact of Exclusivity Periods
Source: Wallsten, 2000
Telecommunications Performance

The launch of a third mobile license has, traditionally, increased mobile penetration by an average of 32 % within two years
Source: GSM World, ITU, Connexus Analysis
Increment in Mobile Penetration Upon Introduction of the Third Mobile License in Europe (Y-1/Y+1)
0
10
20
30
40
50
Incr
em
ent
in P
enetr
atio
n
Average = 31.5 %
The average incremental growth in mobile penetration witnessed in Europe upon introduction of the third mobile license was 32%; In the Lebanese context, this is translated into a doubling of penetration to 60% in the span of two years
The average incremental growth in mobile penetration witnessed in Europe upon introduction of the third mobile license was 32%; In the Lebanese context, this is translated into a doubling of penetration to 60% in the span of two years
Estimation of Mobile Penetration in Lebanon after Introduction of a Third Mobile License
0
10
20
30
40
50
60
70
0 1 2 3 4 5
EU Y+1
EU Y-1Leb Y-1
Leb Y+1
Timing and Impact of a Third Mobile License
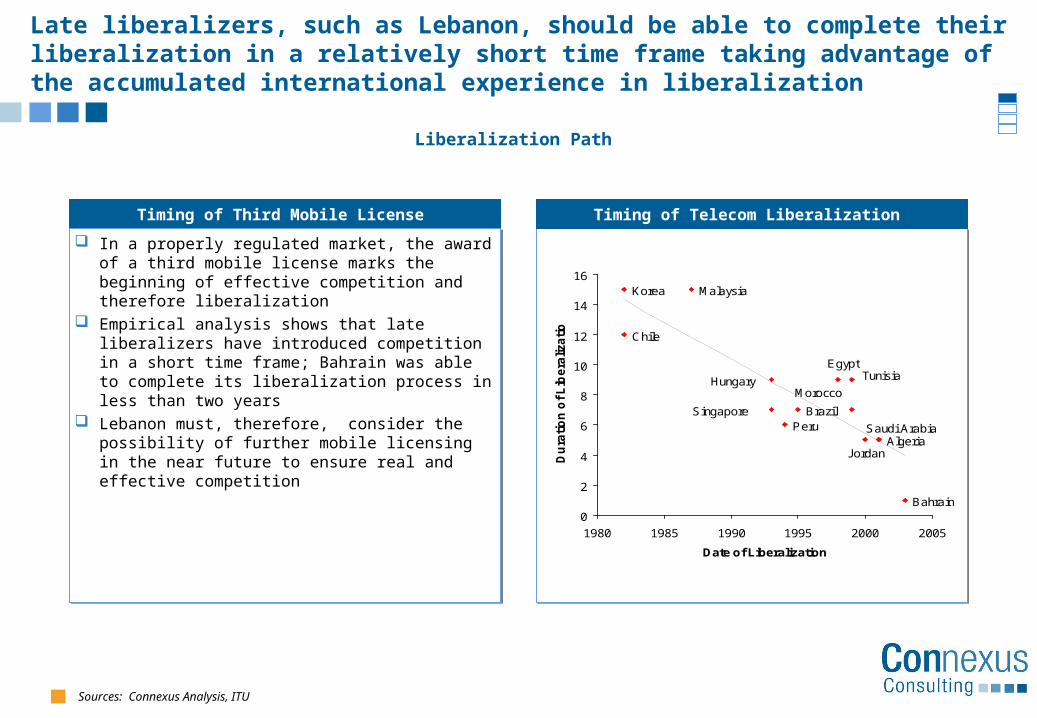
Late liberalizers, such as Lebanon, should be able to complete their liberalization in a relatively short time frame taking advantage of the accumulated international experience in liberalization
Liberalization Path
Timing of Third Mobile License
In a properly regulated market, the award of a third mobile license marks the beginning of effective competition and therefore liberalization
Empirical analysis shows that late liberalizers have introduced competition in a short time frame; Bahrain was able to complete its liberalization process in less than two years
Lebanon must, therefore, consider the possibility of further mobile licensing in the near future to ensure real and effective competition
Bahrain
AlgeriaJordan
Saudi ArabiaPeruBrazilSingapore
TunisiaEgypt
MoroccoHungary
Chile
MalaysiaKorea
0
2
4
6
8
10
12
14
16
1980 1985 1990 1995 2000 2005
Date of LiberalizationD
ura
tio
n o
f L
ibe
raliz
ati
on
Timing of Telecom Liberalization
Sources: Connexus Analysis, ITU
8181 …… 8888 8989 9090 9191 9292 9393 9494 9595 9696 9797 9898 9999 0000 0101 0202 0303 0404 0505 0606 LegendLegend
KoreaKorea
ArgentinaArgentina
MexicoMexico
HungaryHungary
PeruPeru
SingaporeSingapore
BrazilBrazil
EgyptEgypt
MoroccoMorocco
JordanJordan
AlgeriaAlgeria
Saudi ArabiaSaudi Arabia
BahrainBahrain
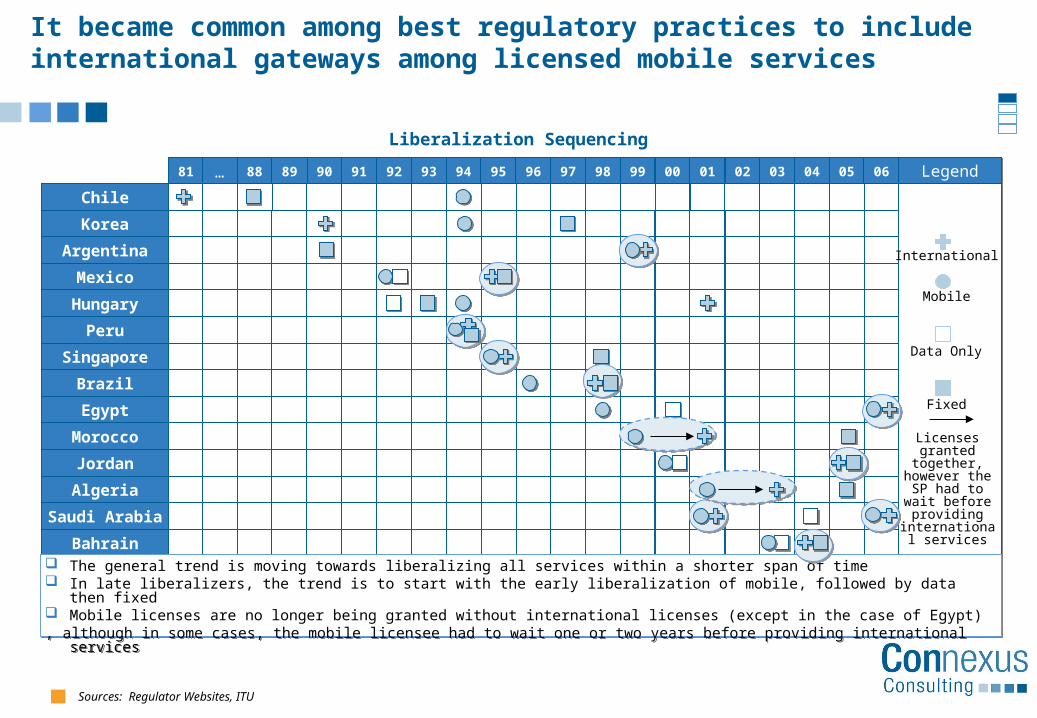
It became common among best regulatory practices to include international gateways among licensed mobile services
The general trend is moving towards liberalizing all services within a shorter span of time In late liberalizers, the trend is to start with the early liberalization of mobile, followed by data then fixed Mobile licenses are no longer being granted without international licenses (except in the case of Egypt), although in some cases, the mobile licensee had to wait one or two years before providing international services
The general trend is moving towards liberalizing all services within a shorter span of time In late liberalizers, the trend is to start with the early liberalization of mobile, followed by data then fixed Mobile licenses are no longer being granted without international licenses (except in the case of Egypt), although in some cases, the mobile licensee had to wait one or two years before providing international services
Sources: Regulator Websites, ITU
Mobile
International
Fixed
Data Only
Licenses granted together,
however the SP had to wait
before providing international
services
Liberalization Sequencing
Chile

Based on international benchmarks, the impact of swift liberalization on service penetration is indisputable
Impact of Competition and Liberalization on Penetration
Source: ITU, Global Investment House, World Bank
Mobile Penetration in Jordan
0
10
20
30
40
50
60
70
1995
1996
1997
1998
1999
2000
2001
2002
2003
2004
2005
Year
Pen
etra
tio
n R
ate
Sta
rt o
f Li
bera
lizat
ion
Ful
l Li
bera
lizat
ion
Mobile Penetration in France
01020304050607080
1990
1992
1994
1996
1998
2000
2002
2004
Year
Pen
etra
tio
n R
ate
Sta
rt o
f Li
bera
lizat
ion
Ful
l Li
bera
lizat
ion
ADSL Subscribers in Jordan
0
10000
20000
30000
40000
50000
60000
Q4
2003
Q1
2004
Q2
2004
Q3
2004
Q4
2004
Q1
2005
Q2
2005
Q3
2005
Q4
2005
Q1
2006
Su
bsc
rib
ers
Ful
l Fix
ed
Libe
raliz
atio
n
Mobile Penetration in Morocco
05
1015202530354045
1995
1996
1997
1998
1999
2000
2001
2002
2003
2004
2005
Year
Pen
etra
tio
n R
ate
Sta
rt o
f Li
bera
lizat
ion
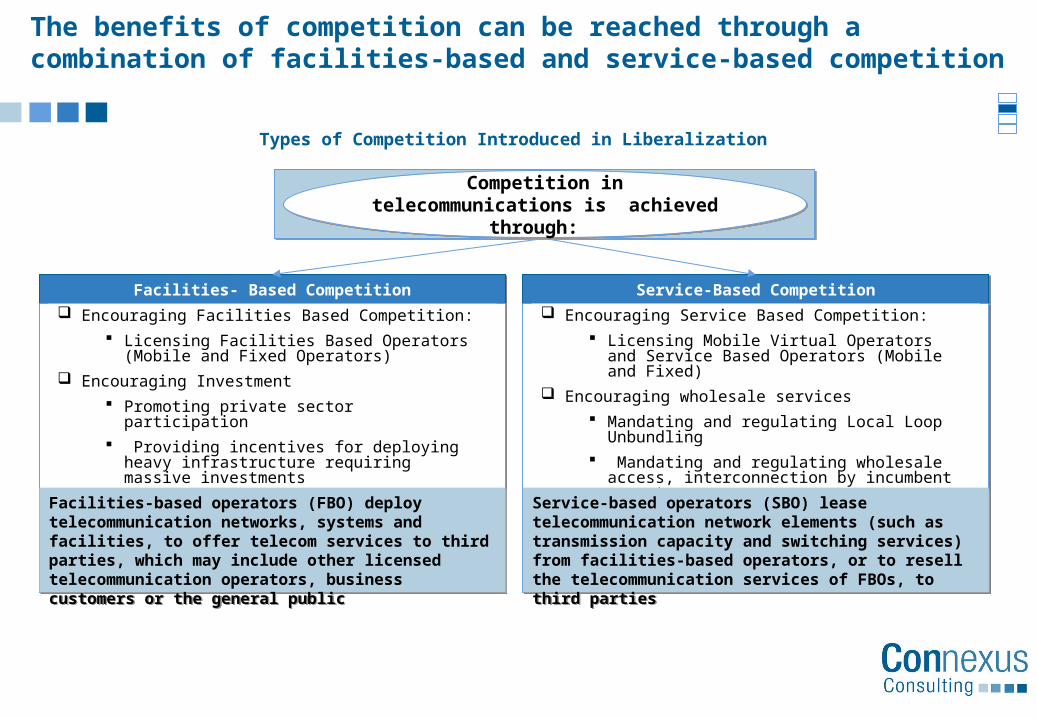
The benefits of competition can be reached through a combination of facilities-based and service-based competition
Types of Competition Introduced in Liberalization
Facilities- Based CompetitionFacilities- Based Competition Service-Based CompetitionService-Based Competition
Encouraging Facilities Based Competition:
Licensing Facilities Based Operators (Mobile and Fixed Operators)
Encouraging Investment
Promoting private sector participation
Providing incentives for deploying heavy infrastructure requiring massive investments
Adopting technology neutrality
Encouraging Service Based Competition:
Licensing Mobile Virtual Operators and Service Based Operators (Mobile and Fixed)
Encouraging wholesale services
Mandating and regulating Local Loop Unbundling
Mandating and regulating wholesale access, interconnection by incumbent operators
Competition in telecommunications is achieved through:
Competition in telecommunications is achieved through:
Facilities-based operators (FBO) deploy telecommunication networks, systems and facilities, to offer telecom services to third parties, which may include other licensed telecommunication operators, business customers or the general public
Facilities-based operators (FBO) deploy telecommunication networks, systems and facilities, to offer telecom services to third parties, which may include other licensed telecommunication operators, business customers or the general public
Service-based operators (SBO) lease telecommunication network elements (such as transmission capacity and switching services) from facilities-based operators, or to resell the telecommunication services of FBOs, to third parties
Service-based operators (SBO) lease telecommunication network elements (such as transmission capacity and switching services) from facilities-based operators, or to resell the telecommunication services of FBOs, to third parties

19
Service based operators have typically led to more competition (as measured by market concentration) and lower prices for end-users
Impact of Service Based Competition on Market Dynamics
*A wave of consolidation in the Finnish market in 2005 resulted in major MVNOs being acquired by MNOs+The Herfindahl-Hirschmann Index provides an indication of the development of competition in the mobile markets. Usually, 0.18 is considered the threshold for "effective competition"Source : Regulators’ market reports
0
5
10
15
20
25
30
1994 1999 2004Nu
mb
er
of M
ob
ile O
pe
rato
rs
Denmark Finland Norway Sweden
0
5
10
15
20
25
30
1998 2000 2002 2004 2006
Ma
rke
t Sh
are
of S
erv
ice
B
ase
d M
Os
(%)
Denmark Finland* Norway Sweden
00.10.20.30.40.50.60.7
1998 2000 2002 2004 2006Ma
rke
t Co
nce
ntr
atio
n (
HH
I)+
Denmark Finland Norway Sweden
0100200300400500600700
Jan-02 May-03 Sep-04 Feb-06
An
nu
al C
ost
of T
ypic
al M
ob
ile
Usa
ge
(E
uro
s)
Denmark Finland Norway Sweden EU
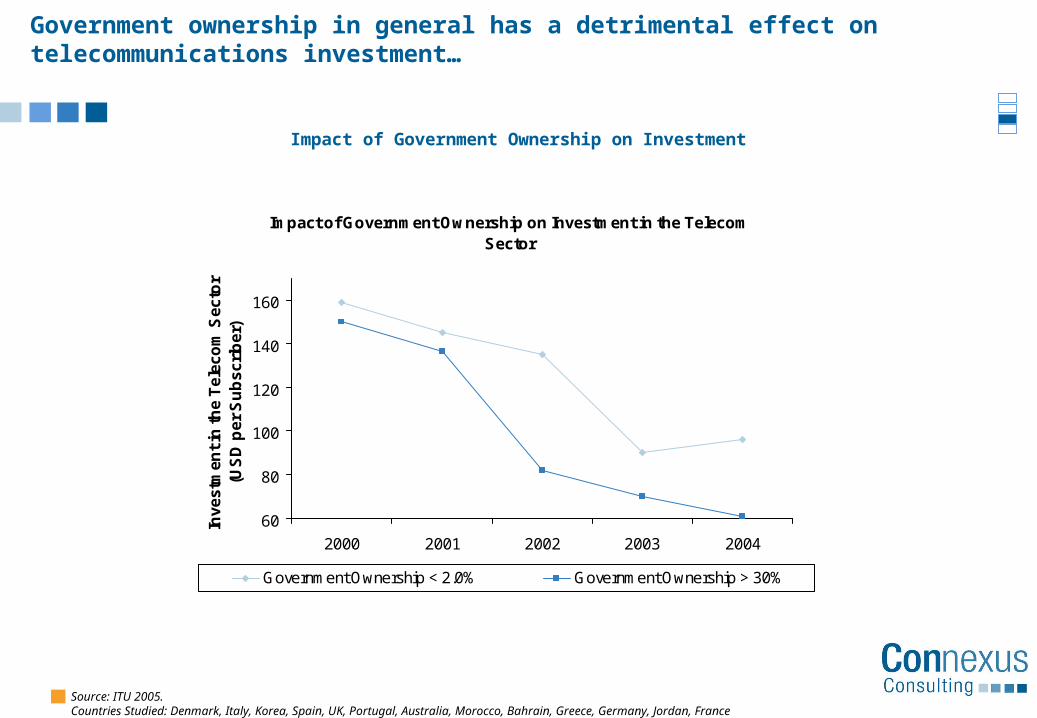
Government ownership in general has a detrimental effect on telecommunications investment…
Impact of Government Ownership on Investment in the Telecom Sector
60
80
100
120
140
160
2000 2001 2002 2003 2004
Inv
es
tme
nt
in t
he
Te
lec
om
Se
cto
r (U
SD
pe
r S
ub
sc
rib
er)
Government Ownership < 2.0% Government Ownership > 30%
Source: ITU 2005. Countries Studied: Denmark, Italy, Korea, Spain, UK, Portugal, Australia, Morocco, Bahrain, Greece, Germany, Jordan, France
Impact of Government Ownership on Investment

… It also tends to result in decreased efficiency
Source: Annual Reports 2003; Arab Advisors Reports, “Telecom Management & Policy Program, University of San Francisco report, Regulation and State Ownership”, Johannes Bauer, Michigan State University, February 2005
Impact of Government Ownership on Efficiency
128149
122
252278
324357
Q-Tel Etisalat Batelco JordanTelecom
FranceTelecom
TelecomItalia
Telefonica
“Normalized” Total Lines per Employees – Selected Operators (2003)
Average 230
High Gov Ownership
Average = 139
Moderate Gov Ownership
Average = 217
No Gov Ownership
Average = 340

There has been a trend, even in the region, to minimize government cross-ownership of telecom operators, except in countries that have not committed to liberalization (e.g., Kuwait and the UAE)
0% 10% 20% 30% 40% 50% 60% 70% 80% 90% 100%
Sabafon (Yemen)
Spacetel (Yemen)
UAE (du)
Tunisiana (Tunis)
Syriatel* (Syria)
Areeba* (Syria)
Mobily (Saudi Arabia)
Nawras (Oman)
Meditel (Morocco)
Alfa (Lebanon)
MTC Touch (Lebanon)
Wataniya (Kuwait)
MTC Vodafone (Kuwait)
Xpress (Jordan)
Fastlink (Jordan)
Vodafone (Egypt)
MTC Vodafone (Bahrain)
Wataniya (Algeria)
OTA Djezzy (Algeria)
Government Public Institutional Investors Private Sector Foreign
Total Gov’t
Ownership
Ownership Comparison of Non-incumbent Mobile Operatorsin Arab Countries
(*) Both Syrian Operators are operating on a BOT contract. At the end of the agreement, ownership of the network goes back to the government Source: EMC World Cellular Database; Zawya; Arab Advisors Group; Operators
---
12%--
25%24%
100%100%
8%-
15%---
40%--
Cross Ownership
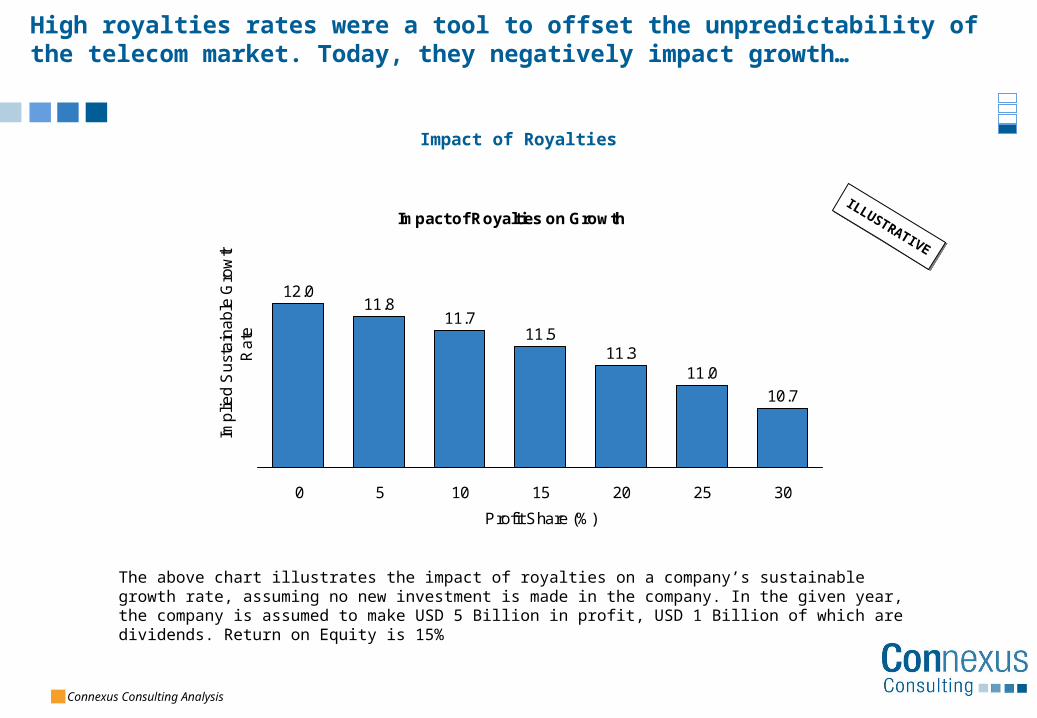
High royalties rates were a tool to offset the unpredictability of the telecom market. Today, they negatively impact growth…
Impact of Royalties on Growth
12.011.8
11.711.5
11.311.0
10.7
0 5 10 15 20 25 30
Profit Share (%)
Imp
lied
Su
sta
ina
ble
Gro
wth
R
ate
ILLUSTRATIVE
ILLUSTRATIVE
Impact of Royalties
The above chart illustrates the impact of royalties on a company’s sustainable growth rate, assuming no new investment is made in the company. In the given year, the company is assumed to make USD 5 Billion in profit, USD 1 Billion of which are dividends. Return on Equity is 15%
Connexus Consulting Analysis

… and discourage investment in the sector
Impact of Royalties
In Ireland, lower tax rates have contributed to attracting investment to the telecom sector. The above graph shows investment in telecom per capita in Ireland as a % of investment in telecom per capita in the OECD as tax rates decreased
Irish Development Agency Report, ITU
Impact of Increased Corporate Tax Rates on Telecom Investment in Ireland
10%
15%
20%
25%
30%
1999 2000 2001 2002 2003 2004 2005
50%60%70%80%90%100%110%120%130%140%
Corporation Tax Rate Relative Investment in Telecom per Capita

Conclusions On Liberalization
No or limited exclusivities granted Launch of additional mobile licenses
Prepare for facilities-based and service-based competition
No revenues sharing in competitive market segments
Divestment of government ownership from the exiting mobile businesses Maintain government stake in Liban Telecom after restructuring and privatizing Prohibition of any form of cross ownership between telecommunications operators whether public
or private
22
11
33
44


