Embed Size (px)
Citation preview

Monday 10 June 2013 – AfternoonGCSE GATEWAY SCIENCEBIOLOGY B
B732/01 Biology modules B4, B5, B6 (Foundation Tier)
F
INSTRUCTIONS TO CANDIDATES
• Write your name, centre number and candidate number in the boxes above. Please write clearly and in capital letters.
• Use black ink. HB pencil may be used for graphs and diagrams only.• Answer all the questions.• Read each question carefully. Make sure you know what you have to do before starting
your answer.• Write your answer to each question in the space provided. Additional paper may be
used if necessary but you must clearly show your candidate number, centre number and question number(s).
• Do not write in the bar codes.
INFORMATION FOR CANDIDATES
• Your quality of written communication is assessed in questions marked with apencil ( ).
• The number of marks is given in brackets [ ] at the end of each question or part question.
• The total number of marks for this paper is 85.• This document consists of 28 pages. Any blank pages are indicated.
* B 7 3 2 0 1 *
OCR is an exempt CharityTurn over
© OCR 2013 [L/601/7588]DC (NF/JG) 65553/5
Candidates answer on the Question Paper.A calculator may be used for this paper.
OCR supplied materials:None
Other materials required:• Pencil• Ruler (cm/mm)
THIS IS A NEW SPECIFICATION
*B736960613*
Duration: 1 hour 30 minutes

2
© OCR 2013
Answer all the questions.
SECTION A – Module B4
1 Humans treat food in different ways to stop decay.
(a) Some examples of traditional methods are shown in the table.
Name of food Country Treatment
bummalo Indiafish are hung up in the open air for five days
atchara Philippinespapaya fruit are mixed
with vinegar and spices
blatjang South Africaapricots are put into pots with other fruit,
water and sugar
adobo Philippinesmeat is mixed with
vinegar, garlic and bay leaves
(i) When adobo is made, which substance is added to the meat to stop decay?
..................................................................................................................................... [1]
(ii) A modern way of preserving milk is to remove all the water.
One food in the table is preserved using the same idea.
Write down the name of the food.
..................................................................................................................................... [1]
(b) Most methods of food preservation stop microorganisms from working.
Write down one type of microorganism that decays food.
............................................................................................................................................. [1]
(c) How are microorganisms useful in treating human waste?
............................................................................................................................................. [1]
[Total: 4]
3
Turn over© OCR 2013
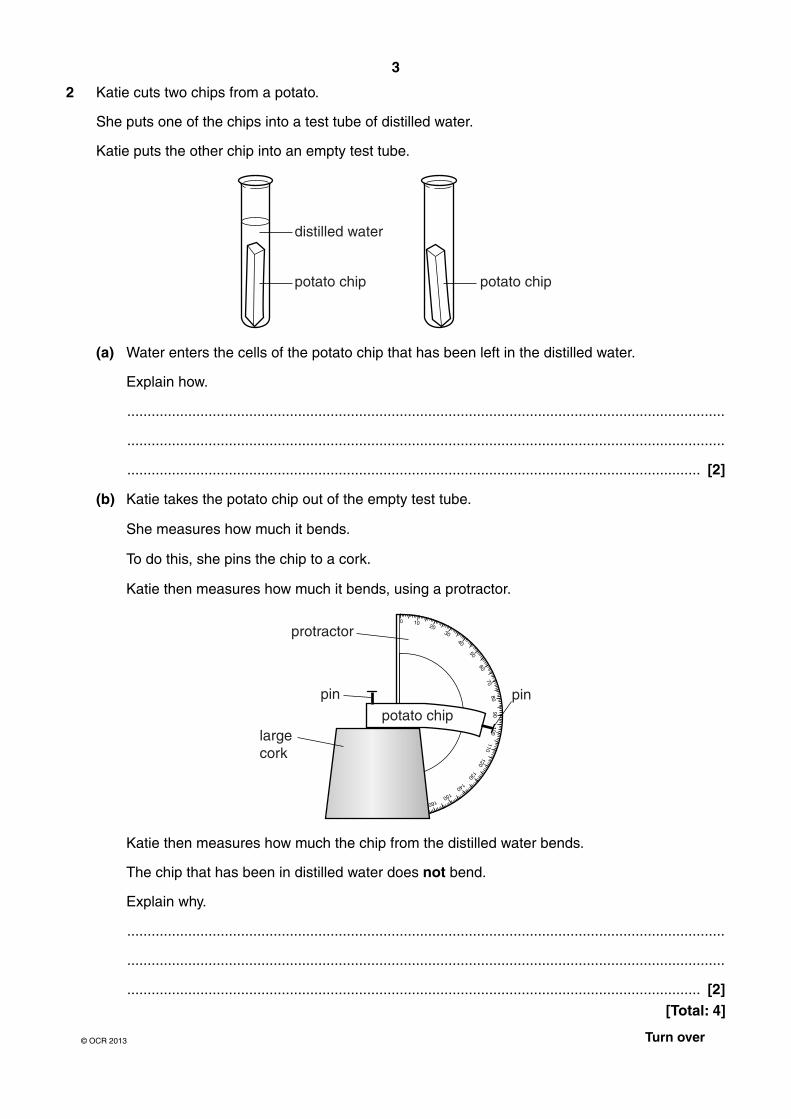
2 Katie cuts two chips from a potato.
She puts one of the chips into a test tube of distilled water.
Katie puts the other chip into an empty test tube.
distilled water
potato chip potato chip
(a) Water enters the cells of the potato chip that has been left in the distilled water.
Explain how.
...................................................................................................................................................
...................................................................................................................................................
............................................................................................................................................. [2]
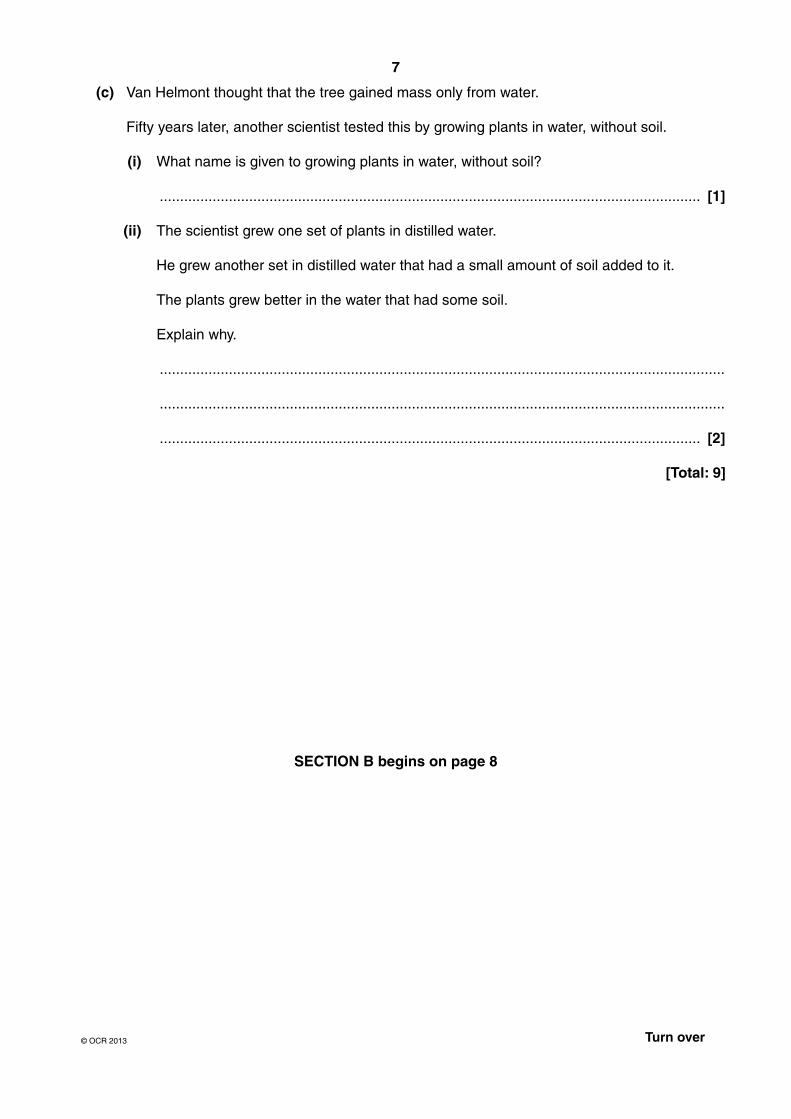
(b) Katie takes the potato chip out of the empty test tube.
She measures how much it bends.
To do this, she pins the chip to a cork.
Katie then measures how much it bends, using a protractor.
protractor
pin pin
largecork
potato chip
Katie then measures how much the chip from the distilled water bends.
The chip that has been in distilled water does not bend.
Explain why.
...................................................................................................................................................
...................................................................................................................................................
............................................................................................................................................. [2] [Total: 4]

4
© OCR 2013
3 (a) Chris is an organic farmer.
He is growing swedes in a field.
There are many slugs in the field.
The slugs move over the surface of the soil and eat his swede plants.
Chris decides to buy some beetles to release into the field.
These beetles eat slugs.
(i) What name is given to this type of pest control?
..................................................................................................................................... [1]
(ii) Chris can not use pesticides to kill the slugs.
Write down the reason why.
..................................................................................................................................... [1]

5
Turn over© OCR 2013
(b) Before releasing the beetles, Chris wants to know how many slugs are in the field.
He does a capture-recapture experiment.
Chris catches some slugs, marks them and releases them.
A few days later, he catches some slugs again.
Chris works out that there are about 900 slugs in the field.
He does the experiment again, several weeks after releasing the beetles.
Here are the results of his second experiment:
Number of slugs in 1st sample
Number of slugs in 2nd sample
Number of marked slugs in 2nd sample
50 45 5
This is the formula he uses to analyse the results.
population size = number in 1st sample × number in 2nd sample
number in 2nd sample previously marked
Describe a collecting method Chris could have used to sample the slugs and explain what his results show about how successful he has been in controlling the slugs.
The quality of written communication will be assessed in your answer to this question.
...................................................................................................................................................
...................................................................................................................................................
...................................................................................................................................................
...................................................................................................................................................
...................................................................................................................................................
...................................................................................................................................................
...................................................................................................................................................
...................................................................................................................................................
...................................................................................................................................................
............................................................................................................................................. [6]
[Total: 8]

6
© OCR 2013
4 Carbon dioxide and water are needed for photosynthesis.
(a) Finish the word equation for photosynthesis.
carbon dioxide + water ............................... + ............................... [1]
(b) In 1649, scientists thought that plants grew by only taking in solid materials from the soil.
A scientist called van Helmont did an experiment to test this idea.
He grew a tree in a large pot of soil.
He measured the mass of the soil and the tree before the experiment.
He measured them again, five years later.
2 kgtree
tree grows for 5 years100 kgof soil
+ 80 kgtree
99 kgof soil
+
(i) Explain how van Helmont’s experiment proved the scientists wrong.
...........................................................................................................................................
...........................................................................................................................................
...........................................................................................................................................
..................................................................................................................................... [2]
(ii) During the five years, van Helmont watered the soil.
Describe how water enters the tree and what happens to the water once it has entered.
...........................................................................................................................................
...........................................................................................................................................
...........................................................................................................................................
..................................................................................................................................... [3]
7
Turn over© OCR 2013
(c) Van Helmont thought that the tree gained mass only from water.
Fifty years later, another scientist tested this by growing plants in water, without soil.
(i) What name is given to growing plants in water, without soil?
..................................................................................................................................... [1]
(ii) The scientist grew one set of plants in distilled water.
He grew another set in distilled water that had a small amount of soil added to it.
The plants grew better in the water that had some soil.
Explain why.
...........................................................................................................................................
...........................................................................................................................................
..................................................................................................................................... [2]
[Total: 9]
SECTION B begins on page 8

8
© OCR 2013
SECTION B – Module B5
5 Look at the diagram of a skeleton.
It shows three types of joint, labelled A, B and C.
A
B
C
(a) Write the correct letter, A, B or C, in the boxes next to the type of joint found in the skeleton.
ball and socket joint
fixed joint
hinge joint
[2]

9
Turn over© OCR 2013
(b) Look at the picture showing fractured bones.
rightleg
leftleg
Describe the types of fractures shown in the right and left legs.
...................................................................................................................................................
...................................................................................................................................................
............................................................................................................................................. [2]
(c) In some fractures, large blood vessels are damaged.
This can cause harmful blood clots inside the body.
What type of drug is used to reduce blood clotting?
Choose your answer from the list.
antibodies
anti-coagulants
anti-depressants
antigens
answer ................................................... [1]
[Total: 5]

10
© OCR 2013
6 This question is about human reproduction.
(a) Look at the diary.
It shows the notes a woman has made in February, about her menstrual cycle.
Monday TuesdayFebruary 2013
Wednesday Thursday Friday Saturday Sunday28 29 30 31 01 02 03
04 05 06 07 08 09 10
11 12 13 14 15 16 17
18 19 20 21 22 23 24
25 26 27 28 01 02 03
Diary
bleedingstarted
bleedingstarted
bleedingstopped
mostfertile
mostfertile
mostfertile
Describe what is happening in the woman’s body during her menstrual cycle.
Use dates from the diary in your answer.
...................................................................................................................................................
...................................................................................................................................................
...................................................................................................................................................
...................................................................................................................................................
............................................................................................................................................. [3]

11
Turn over© OCR 2013
(b) Gavin and Janet are a couple who want to have children.
Gavin and Janet visit the doctor.
The doctor finds out that: • Janet has very irregular periods • many of Gavin’s sperm are damaged.
How might each of these issues affect their chances of having children?
Explain your answer.
The quality of written communication will be assessed in your answer to this question.
...................................................................................................................................................
...................................................................................................................................................
...................................................................................................................................................
...................................................................................................................................................
...................................................................................................................................................
...................................................................................................................................................
...................................................................................................................................................
...................................................................................................................................................
...................................................................................................................................................
............................................................................................................................................. [6]
[Total: 9]

12
© OCR 2013
7 This question is about circulation.
(a) Look at the graph.
It shows the changes in pressure as blood leaves the heart and passes through blood vessels.
B
100
80
60
40
20
0
mean blood pressurein mm Hg
distance travelled from heart
A
(i) Blood leaving the heart has a pressure of 93 mm Hg.
The blood pressure drops by 84 mm Hg.
Calculate the percentage drop in blood pressure.
percentage drop in blood pressure .................... % [1]
(ii) Use the graph to name the type of blood vessels at point A and point B.
blood vessel at point A ...............................
blood vessel at point B ............................... [2]

13
Turn over© OCR 2013
(b) The valves inside someone’s heart can become damaged.
(i) How can damaged heart valves affect a person’s circulatory system?
...........................................................................................................................................
...........................................................................................................................................
..................................................................................................................................... [2]
(ii) The damaged valves may need to be replaced.
Put ticks (✓) in the boxes next to the two types of replacement valves that can be used.
biological
chemical
ethical
mechanical
physical
[1]
[Total: 6]

14
© OCR 2013
8 This question is about digestion.
(a) Explain why enzymes are needed for digestion.
...................................................................................................................................................
...................................................................................................................................................
............................................................................................................................................. [2]
(b) Scientists investigate two enzymes and pH levels in the digestive system.
Look at the graph.
It shows the rate of reaction of enzyme A and enzyme B in different pH conditions.
1 2 3 4 5 6 7 8 9 10
rate of reaction
pH
enzyme A
enzyme B
Look at the table.
It shows the pH in different parts of the digestive system.
Part of digestive system
pH
mouth 6.5
stomach 2.0
small intestine 7.5
large intestine 7.0

15
Turn over© OCR 2013
(i) The scientists claim their results show enzyme A is a protease enzyme and is found in the stomach.
Do the results back up their claim?
Explain your answer.
...........................................................................................................................................
...........................................................................................................................................
...........................................................................................................................................
..................................................................................................................................... [2]
(ii) In which part of the digestive system is enzyme B found?
Choose your answer from the table.
..................................................................................................................................... [1]
[Total: 5]
SECTION C begins on page 17

16
© OCR 2013
BLANK PAGE
PLEASE DO NOT WRITE ON THIS PAGE

17
Turn over© OCR 2013
SECTION C – Module B6
9 Look at the picture of a biogas plant.
(a) Biogas is a biofuel.
Finish the sentences about biogas.
Use words from the list.
argon burns digester distiller
gasohol methane rots
Biogas is made when organic matter ................................................. .
Biogas is a mixture of gases that includes ................................... .
The large container used to make biogas is called a .................................................. . [3]
(b) Yeast can be used to make biofuels.
Describe how.
...................................................................................................................................................
...................................................................................................................................................
............................................................................................................................................. [2]
[Total: 5]

18
© OCR 2013
10 Read the information about ‘spontaneous generation’.
Until the late 19th century, people thought life could be created from non-living matter.
The process was called ‘spontaneous generation’.
For example, people thought that stale bread would turn into mould and meat would turn into maggots.
In 1668, Francesco Redi believed that maggots developed from eggs laid by flies.
To test his idea, he put meat into three flasks, one open to the air, one sealed completely, and the other covered with cloth. As he expected, maggots only appeared in the open flask.
open sealed cloth
(a) Explain how Redi’s results suggest that the theory of ‘spontaneous generation’ is wrong.
...................................................................................................................................................
...................................................................................................................................................
...................................................................................................................................................
............................................................................................................................................. [2]
(b) Even after Redi published his results, many people still believed in ‘spontaneous generation’.
Suggest why.
............................................................................................................................................. [1]

19
Turn over© OCR 2013
(c) In 1674, a scientist named Leeuwenhoek, described bacteria.
He invented a microscope that was powerful enough to see microorganisms.
Look at the diagram of a bacterial cell.
X
Y
Write down the names of part X and part Y.
part X ........................................................................................................................................
part Y ........................................................................................................................................ [2]
(d) The theory of ‘spontaneous generation’ was finally disproved in 1859, by Louis Pasteur.
Look at the diagram. It shows part of his experiment.
gravy
flasks of similar shapewith different necks
flasks boiled
stage 3after two weeks
stage 1 stage 2
bacterialgrowth
nobacterialgrowth
A A AB B B
Use your scientific knowledge to explain the results in flasks A and B after two weeks.
...................................................................................................................................................
...................................................................................................................................................
...................................................................................................................................................
...................................................................................................................................................
............................................................................................................................................. [3] [Total: 8]

20
© OCR 2013
11 A factory accidently releases fertiliser into a river.
The numbers of fish and bacteria, and the levels of oxygen in the river are measured.
The measurements start at a place called point P.
The graphs show the levels at different distances from point P.
number oforganisms
oxygenlevel
number of fish
number of bacteria
distance from point P (km)
distance from point P (km)
P 10 20 30 40 50
factory
P 10 20 30 40 50
factory
(a) Write down the distance the factory is from point P ...................................... km [1]

21
Turn over© OCR 2013
(b) Describe and explain any patterns shown by the graphs opposite.
The quality of written communication will be assessed in your answer to this question.
...................................................................................................................................................
...................................................................................................................................................
...................................................................................................................................................
...................................................................................................................................................
...................................................................................................................................................
...................................................................................................................................................
...................................................................................................................................................
...................................................................................................................................................
...................................................................................................................................................
............................................................................................................................................. [6]
[Total: 7]

22
© OCR 2013
12 Deidre has diabetes.
The table shows acceptable levels of glucose in the blood.
Glucose level before a meal
in mmol per litre
Glucose level 2 hours after a
mealin mmol per litre
Without diabetes 4.0–5.9 � 7.8
Type 2 diabetes 4.0–7.0 � 8.5
Type 1 diabetes 4.0–7.0 � 9.0
She uses a meter to test her blood glucose level two hours after eating a meal.
Look at the picture. It shows the reading Deidre has taken.
8.7mmol/l
(a) The reading tells Deidre that her glucose level is acceptable for her type of diabetes.
Use the data to explain what this tells you about the type of diabetes Deidre has.
...................................................................................................................................................
...................................................................................................................................................
............................................................................................................................................. [2]
(b) The meter uses immobilised enzymes.
What ways can enzymes be immobilised?
...................................................................................................................................................
...................................................................................................................................................
............................................................................................................................................. [2]

23
Turn over© OCR 2013
(c) Deidre needs to have insulin injections.
A process is used to change bacteria so that they can make human insulin.
Put a tick in the box (✓) next to the name of this process.
cloning
genetic engineering
fermentation
sterilisation
[1]
[Total: 5]
SECTION D begins on page 25

24
© OCR 2013
BLANK PAGE
PLEASE DO NOT WRITE ON THIS PAGE

25
© OCR 2013 Turn over for the remainder of question 13
SECTION D
13 Look at the table about people in five different countries.
It shows their mean blood cholesterol and mean BMI (body mass index).
Country Mean blood cholesterol in mmol per litre
Mean BMI in kg per m2
Females Males Females Males
China 5.5 5.7 23.4 24.6
Cyprus 5.8 6.1 26.7 25.5
Ethiopia 4.3 4.6 19.9 20.7
India 5.3 5.2 21.4 22.0
Uruguay 6.1 6.2 27.2 27.3
(a) (i) Which country has females with the lowest mean blood cholesterol?
..................................................................................................................................... [1]
(ii) Which country has males with the highest mean BMI?
..................................................................................................................................... [1]
(b) Rakesh uses the information in the table to make two conclusions:
• in most of the countries, females have a higher mean blood cholesterol than males
• in most of the countries, males have a higher mean BMI than females.
Do you agree with these conclusions?
Use the data to explain your answer.
...................................................................................................................................................
...................................................................................................................................................
...................................................................................................................................................
...................................................................................................................................................
............................................................................................................................................. [3]

26
© OCR 2013
(c) Rakesh wants to see if there is a link between blood cholesterol levels and BMI.
He uses the data about males to plot a graph.
mean blood cholesterolin mmol per litre
meanBMIin
kg perm2
28
27
26
25
24
23
22
21
203.0 4.0 5.0 6.0 7.0
Uruguay
Cyprus
China
India
Ethiopia
What pattern does the graph show?
...................................................................................................................................................
............................................................................................................................................. [1]

27
© OCR 2013
(d) Rakesh finds information about five other countries.
Country Mean blood cholesterol in mmol per litre
Mean BMI in kg per m2
Males Males
Cameroon 3.2 24.5
Greece 4.7 28.0
Netherlands 4.7 25.2
Nigeria 3.6 22.6
United Kingdom 5.0 27.0
(i) Add this data to Rakesh’s graph.
Use crosses (✕) to plot the points. [2]
(ii) What does the graph now show about a link between blood cholesterol levels and BMI?
Explain your answer.
...........................................................................................................................................
...........................................................................................................................................
...........................................................................................................................................
..................................................................................................................................... [2]
[Total: 10]
END OF QUESTION PAPER

28
© OCR 2013
PLEASE DO NOT WRITE ON THIS PAGE
Copyright Information
OCR is committed to seeking permission to reproduce all third-party content that it uses in its assessment materials. OCR has attempted to identify and contact all copyright holders whose work is used in this paper. To avoid the issue of disclosure of answer-related information to candidates, all copyright acknowledgements are reproduced in the OCR Copyright Acknowledgements Booklet. This is produced for each series of examinations and is freely available to download from our public website (www.ocr.org.uk) after the live examination series.
If OCR has unwittingly failed to correctly acknowledge or clear any third-party content in this assessment material, OCR will be happy to correct its mistake at the earliest possible opportunity.
For queries or further information please contact the Copyright Team, First Floor, 9 Hills Road, Cambridge CB2 1GE.
OCR is part of the Cambridge Assessment Group; Cambridge Assessment is the brand name of University of Cambridge Local Examinations Syndicate (UCLES), which is itself a department of the University of Cambridge.


![[Franciscus Mercurius van Helmont] SEDER OLAM · [Franciscus Mercurius van Helmont] SEDER OLAM : O R, T H E Order, Series, or Succession O F A L L T H E Ages, Periods, and Times O](https://img.dokumen.tips/doc/110x75/5fc28158b03781560345d3b3/franciscus-mercurius-van-helmont-seder-franciscus-mercurius-van-helmont-seder.jpg)


![Van Helmont Tritemio, - laszlo.ind.brlaszlo.ind.br/admin/artigos/arquivos/Spagyria_1.pdf · 2 Jean Baptiste Van Helmont [15771644] 3Johannes Trithemius pseudonimo di Johann Heidenberg](https://img.dokumen.tips/doc/110x75/5fc27dc8468d2810573ce32f/van-helmont-tritemio-2-jean-baptiste-van-helmont-15771644-3johannes-trithemius.jpg)


