Embed Size (px)
Citation preview

Analyst Presentation
Monday 10 December 2018

Disclaimer
This presentation contains certain forward-looking statements with respect to the operations, performance
and financial condition of Renewi. These forward-looking statements are subject to risks, uncertainties
and other factors which as a result could cause Renewi’s actual future financial condition, performance
and results to differ materially from the plans, goals and expectations set out in the forward-looking
statements. Such statements are made only as at the date of this presentation and, except to the extent
legally required, Renewi undertakes no obligation to revise or update such forward-looking statements.
2

Introduction to Renewi Team
3
Peter DilnotCEO
Toby WoolrychCFO
Otto de BontManaging Director CW NL
Adam RichfordTreasurer
Peter van KesselCommunications
Sandor KarremanGeneral Area Manager
Christine CooperFinancial Controller

4
Safety First
Fire alarms & exits
Your personal protective equipment - jacket, boots, helmet, glasses
Rules on all operating sites:
Key risks will be advised during tour
If in doubt – ask us!
If you see unsafe action – tell us!
▶ Be properly dressed
▶ Stay close to your guide
▶ Stay on marked walkways
▶ No use of mobile phones
▶ No eating, drinking or smoking
▶ Wash hands afterwards

5
Safety at Renewi
Our Safety Vision:
Safety is our top priority and first value. There is nothing more
important that ensuring our people get home safely every day.
We aspire to have zero accidents.
• Fewer accidents in 2018 with >3 day accident rate down, 14%
• Successful recent first safety week improves awareness
and focus
• Safety culture plan created to deliver change
• Leadership and employee engagement are the fundamental
factors
We are focused on improving our safety culture and meeting our stretch targets

Secondary Listing Plans
6
Majority of activities in Benelux region
Euronext Amsterdam listing increases visibility and allows easier access to
Renewi shares in our core Benelux markets
Contributing to additional volume and liquidity in Renewi shares for
existing and new investors
Extended equity research coverage in European market and broader
investor interest, especially given greater focus on ESG investing
Rabobank - Kepler Cheuvreux acts as Listing Agent and Financial Advisor
with respect to the secondary listing
Intention for secondary listing on Euronext Amsterdam in 2019

department, name of presentation, date 7
ContentsI. Renewi – Introduction 10:30
II. Our structurally growing markets
III. Our strategy for growth
IV. Sustainability at our core
V. Site tour – safety briefing
- LUNCH AND SITE TOUR- 12:00 (lunch); 12:30 (site tour)
VI. Operational divisions 14:00
VII. Financial and operational summary
VIII. Concluding remarks
- Q&A -
Departure 16:00

I. Renewi – Introduction

Renewi at a Glance
• Formed in February 2017 from merger of Shanks
Group plc and van Gansewinkel Groep BV
• Listed on London Stock Exchange since 1988
• Leading pure play recycling business serving the
growing circular economy
• The Benelux market lies at the heart of the business
• A sustainable investment: entirely Green certified
borrowings and listed on FTSE4Good Index
• Four divisions:
Commercial
Hazardous
Monostreams
Municipal
9
2017/18 Year End Highlights
• €1.9b revenue
• €178m EBITDA
• €78.5m Underlying EBIT
• 14M tonnes of waste p/a
• c. 8,000 people
Our vision: “To be the leading waste-to-product company”

10
Our Excom and Board
Toby WoolrychCFO
Niko VeenstraHR Director
George SladeIT Director
Patrick DeprezProducts Director
Baukje DreimullerGeneral Counsel
Otto de BontMD, Commercial NL
Wim GeensMD, Commercial BE
Jonny KappenMD, Hazardous
James PriestleyMD, Municipal
Bas BlomMD, Monostreams
Renewi Board
• Colin MatthewsChairman
• Jacques PetrySenior Independent Director
• Marina WyattChair of Audit Committee
• Allard CasteleinChair of Remuneration
Committee
• Luc SterckxNED
• Jolande SapNED
Peter DilnotCEO

Merger
11
EU strong recycling leader
More products and services to our customers
Broader geographical footprint
Complementary businesses
Robust financial base underpinned by synergies
Significant earnings accretion
Exciting long-term growth opportunities
Sustainable
Competitive
Advantages
Rationale

Our Divisions
12All divisions have waste-to-product business model
• #1 in waste
collection and
processing
• #1 in most main
market segments
• Complete
geographical
coverage in the
Netherlands
Commercial NL
• #1 in glass
recycling and
trading of recycled
glass “cullet”
• #1 handler of
mineral waste in
NL
• #2 in NL organics
• Leading EU WEEE
recycling player
Monostreams
• UK leader in MBT
treatment of waste
• Canadian leader in
treatment of
organic waste
Municipal
• #1 or 2 in waste
collection and
processing
• #1 in most main
market segments
• Complete
geographical
coverage in
Belgium
Commercial BE
• #1 in European
thermal soil
treatment, Dutch
waste water
treatment and high
end industrial
cleaning
• Primarily in the
Netherlands
Hazardous
• Revenue: €736.9m
• Underlying EBIT:
€44.0m
• c. 3,000 FTEs
• Revenue: €422.2m
• Underlying EBIT :
€29.3m
• c. 1,900 FTEs
• Revenue: €231.0m
• Underlying EBIT :
€19.9m
• c. 950 FTEs
• Revenue: €219.3m
• Underlying EBIT :
€(10.6)m
• C. 700 FTEs
• Revenue: €204.4m
• Underlying EBIT :
€18.2m
• c. 470 FTEs
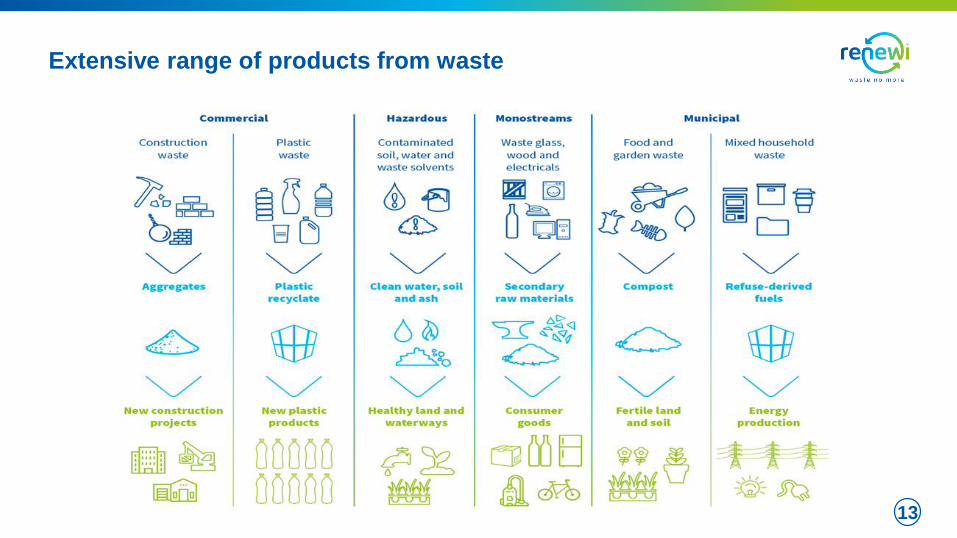
Extensive range of products from waste
13

Our Key Growth Drivers
14
Structural growth in EU
recycling
Advantaged position as
leading Benelux player
Significant value to be
unlocked from merger
Current challenges are short
term or contained
Clear momentum to increase
margins and returns
Significant long term growth
opportunities
• Increasing demand for recycling driven by regulation, society and corporate reputations
• Growing new circular economy requiring scale and innovation
• Renewi has increasingly powerful social purpose
• Scale benefits due to industry cost structure
• Widest range of recycling services
• Transformational merger has consolidated core Benelux markets
• Further €14m annual cost synergies to be delivered by FY20 to meet €40m target
• Revenue and margin benefits will read through over time
• ATM soil issue recovery expected in FY20
• Municipal ring-fenced through provisions
• Recyclate price pressure actively mitigated
• Margins increasing from structural lows
• Returns in Benelux >20% with further upside
• Multiple innovation ideas and options
• Proven M&A capability to build or divest

II. Our structurally growing markets

Renewi connects the Circular Economy
16

Structural Growth in EU Recycling
17Underpinned by GDP recovery and capacity balance improvements in our sector
Clear
environmental
need
Greater
customer
pull
Increasing
regulatory
push

Increasing Demand for Renewi’s Services
18
Renewi strongly positioned as the leading waste-to-product company to capture market growth
UN reports 12 years to keep global
warming to a maximum of 1.5C,
beyond which even half a degree
will significantly worsen the risks of
drought, floods, extreme heat and
poverty
Frequency and intensity of storms
(e.g. US hurricane ‘Michael’)
continues to increase
In 2050, our oceans will have
more plastic than fish, if present
trends continue (UN statement on
World Environment Day)
Clear environmental need Increasing regulatory push Greater customer pull
Dutch incineration tax increase of
120% drives demand for recycling
Dutch Concrete agreement
outlines goal for 100% of concrete
waste to be recycled by 2030
Belgium raised a €4.5B green
bond to finance the transition
towards a sustainable economy
European Union Circular Economy
Package sets recycling targets for
municipal waste of 55% by 2025
and 65% by 2035
Petrochemical industry looking for
virgin feedstock alternatives,
driving 4x growth of market for
secondary plastics towards 2025
Many OEMs (including e.g. Philips)
state a 2020 vision of using 20%
recyclates in their products
OEMs adopting circular models,
e.g. KPN, Dutch telco operator and
sponsor of the Dutch ice skating
federation, recycles precious
metals from set top into medals
via our Coolrec business
Regulation

Greater Customer Pull – Recent Examples
19
Sustainability increasingly important evaluation metric in large tenders
Plastic from old vacuum cleaners make 36%
of their newest top spec vacuum cleaner. Full
closed loop example
Bio-LNG product for vehicles made from organic
anaerobic digestion. Currently in experimental phase
Further refinement of the waste into
High Impact Polystyrene for 3D
printing produces significant value
Together we make Fenix paints from
waste paints, which is available in
stores now
Albert Heijn segregated citrus
peel is collected and refined to
extract limonene for detergents
Customer

Monetising the structural growth in our markets
• Increasing recycling rates will drive higher volume growth
• More stringent legislation on source separation will help larger and more sophisticated waste collectors
• Growth in use of secondary raw materials in construction will increase demand for materials for NL Commercial, ATM
and Mineralz
• Growth in use of secondary raw materials in packaging, glass and insulation products will drive volume growth in Maltha
business
• OEMs will seek partnerships to source stable and high quality metal and plastic secondary raw materials
• Growth in volumes of sludges, source segregated organics and over-date food materials for organic processing
• Investment and partnership opportunities to create more secondary materials, such as waste-to-chemicals, organic
waste-to-food etc.
20
Clear and increasing opportunities for growth
Customer

III. Our strategy for growth

\
Our Strategy Captures Structural Market Growth
22
Renewi strategy for profitable growth… …underpinned by the external market
Clear
environmental
need
Greater
customer
pull
Increasing
regulatory
push
From Service Delivery to Product Manufacturing
23
• Waste management
supply driven
• Primarily service
provision
• Reliance on commodity
recyclate markets
Current
• Demand driven
• Secondary product
manufacturing
• Value-added products
Future
• Regulatory pressure
• Fiscal stimulus
• Societal demand
• Commodity scarcity
Renewi well-positioned with waste-to-product focus
and advanced recycling capabilities
Sorting RecyclingWaste
generationCollection
New product
creation
Low HighValue Chain FocusSupply driven
Sorting RecyclingWaste
generationCollection
New product
creation
Demand driven

Accelerating our Strategy
24
Stage 1:
Focus
Stage 2:
Grow
Time
Execution of Stage 1 “Focus” progressing well.
Ramping-up Stage 2 “Grow”

Accelerating our Strategy
25
Expanded margins, lower leverage
and higher quality earnings
Sustained growth in EPS,
returns and dividends
Deliver integration benefits: complete €40m
programme and extend to integration phase 2
Expand margins in Benelux core: drive commercial
effectiveness and operational levers
Dispose of non-core assets: Canada and Reym
Sustain UK platform: manage contracts within
provisions and renegotiate wherever possible
Bring ATM back to full production
Extend existing business models: further treatment
capability in growing secondary materials markets
Digitalisation: new digital channels/offerings and
break-through digital business models
Circular innovation: deploy capital in adjacent new
recycling technologies
Portfolio: tuck-in acquisitions to accelerate growth
Stage 1: FocusCreating a cash-generative group with competitive
advantage in Benelux recycling
Stage 2: Grow - Generating profitable growth and
attractive returns through market leadership in
Benelux recycling

Focus: Integration Delivery
26
Committed initial €40m programme Future synergies: integration phase 2
• Move to one system within each division
• Direct savings from route and site optimisation
• Delivering cost/scale synergies
• One common platform
• Efficiencies across group and divisions
• Renewi harmonisation
Primary focus on direct
savings in growing market
Further savings from
overhead optimisation
End FY20

27
• Cost synergies ahead in year one (€15m)
• On track to deliver €30m this financial year
and €40m in 2019/20
• Further cost synergies being identified and
quantified
• Strong revenue and margin synergies
underpinning commercial gains
• Leading player in Benelux recycling market
• Strong future growth in demand for Renewi
services
• Significant competitive advantages from
scale, breadth and expertise
• Strong funnel of future growth options
through technology and expansion
Merger benefits coming through… …positioning Renewi for growth
Focus: Merger on Track Short and Long Term
Renewi becoming leader in demand driven recycling market

28
Commercial NL Commercial BE
Focus: Margin Expansion with H1 Large Tenders
Before contract renewal After contract renewal
Annual contract value (€)Annual contract value (€)
Contract gross margin (%)
00
Contract gross margin (%)

Focus: Expanding Margins in Inflationary Markets
29Our scale and market leadership enable margin improvement in inflationary environment
Operational LeverageCost Base Inflation Commercial Excellence
Overhead/
SG&A
Transport
costs
Processing
costs
Disposal
costs
MarginDynamic pricing
Customer surcharges
Contract renewals
Value added services
Additional fees
Long-term contracts
Scale/purchasing power
Scale and throughput
Technology capability
Continuous improvement
Local market share
Route planning capability
Fleet CAPEX/investment
Scale (and lean approach)
Optimal organisation designP&L Components

Focus: Post-Merger Portfolio
30
• Benelux waste-to-product
expertise and breadth
• Market leading recycling
operations and technology
• Advantaged scale and cost
position
• Innovation funnel and growth
opportunities
Post merger portfolio strength
• Tuck-ins to reinforce core business
• Technology to capture growth opportunities
Buy later
Deploy capital where advantaged to drive growth and achieve attractive returns
• Canada Municipal
• Reym Industrial Cleaning
Sell now

Grow: Initial Capital-Light Approach to Capturing Growth
31
Wide range of growth opportunities exists
• University cooperations
(e.g. Delft University of Technology,
Wageningen University)
• Startup partnerships
(e.g. PeelPioneers, PMC)
• Long-term joint ventures
• Strategic ‘tuck-in’ acquisitions
Capital-light approach
Extend existing
business
models
• Plastics (market for secondary plastics
expected to quadruple towards 2025)
• 3D printer filaments
• Phosphates
Digitalisation
• New digital channels and offerings
(e.g. e-sales/service)
• Break-through digital business models (e.g.
based on the Internet of Things)
Circular
innovation
• Waste-to-chemicals
• Cellulose recovery
Strengthening
our portfolio
• Add-on acquisitions to further strengthen our
leadership position in our core markets
Targeting pre-tax 16-20% ROI on all investments

Grow: Extend Existing business Models - Plastics Example
Source: Deloitte sustainability - Blueprint for plastics packaging waste: Quality sorting & recycling32
Renewi well positioned
to capture growth
Sufficient scale to provide
meaningful volumes
Advanced capabilities in
plastics sourcing, sorting
and recycling (e.g. Coolrec)
Proven capability to run
profitable processing and
recycling plants in Benelux
Developing experience in
new advanced recycling
technologies (e.g. two
waste-to-chemicals pilots
ongoing)
Secondary plastics market
expected to grow rapidly
• EU demand for plastics at >30m
tonne and continuing to grow
• Currently only ~3m tonne
recycled
• Recycling volume expected to
quadruple (>12m tonne)
towards 2025
• New technologies (e.g. waste-
to-chemicals) present promising
new recycling methods
• Planet: Plastics regarded as
a key environmental concern
• Regulation: Increasing
governmental policy towards
waste prevention and
recycling
• Customer: Growing end-
customer demand drives
companies to adopt circular
models
External market drives demand
for secondary materials
Renewi well-positioned to capture growth opportunities from shift towards demand-driven model

Grow: Digitalisation – Example Opportunities
33
• Renewi currently capturing growth in digitalisation via
webshops, MyRenewi Portal and MyContainerApp
• Webshop: Site visits +7% vs. last year while online
sales increased ~15% indicating increase in
conversion rate
• MyRenewi Portal: Facilitates cross- & upsell funnel,
personalised contract renewal offers and successful
loyalty program
• MyContainerApp: 23% more orders vs. last year
• Internet of Things (i.e. enabled by sensing and
connectivity technology):
• Predictive insights for waste management
• Smart bins/skips for automated scanning,
collecting & optimising waste performance
• Education and benchmarking:
• “Afvaltest” provides lead generation via
education
• “Afval Prestatie Profiel” provides benchmarking
Expanding digital channels and offerings Break-through digital business models
Continue to capture growth via
digital channels and offerings
Invest in new promising
technology enabling break-through digital
business models

Grow: Innovation Approach and Examples
34
Funnel approach
to innovation managementRecent examples in action
Ideation &Project Selection
Project Development
Implement
Market- & Business Intelligence

Grow: Plastics and Cellulose
35
• Appliances significant part of household electronics
and plastics waste
• Strong demand from OEMs to re-use plastics from
discarded appliances as secondary raw material
• Our Coolrec business is the largest European
plastics recycling business from WEEE
• Market for secondary plastics expected to quadruple
towards 2025
Plastics
• Nappies (diapers), incontinence pads account for
~5-8% of municipal solid waste
• Municipalities as well as healthcare/ daycare
industry demand a recycling solution
• Renewi working with Wageningen University, with a
proven cellulose refinement technology
• Total market is ~400Ktpa (implying a ~30x of our
current volumes)
Cellulose

36
Grow: Innovation Examples
Peel Pioneers• Recycling 250 million kg of
citrus peels
• Turned into essential oils for
e.g. detergents
PMC• Recycling of asbestos-
contaminated steel
• Unique, safe and circular
soliton
Circular Watches• World’s first range of
circular watches
• Made from discarded
electrical appliances
Beautiful Cups• New life to 11 million
disposable cups
• Recycled into toilet paper
and other products
3D Filament• Sustainable material for
3D printing
• Made from recycled fridges
Philips• Recycled plastics supplied for
SENSEO coffee machines
• Over 30% recycled plastics
Circular Bags• Circular concept for plastic film
• Top-quality collection bags made
from plastic waste collected
Fenix Paint• Woking with AkzoNobel to
give new life to used paint
• 100% recycled paint

Accelerated Strategy Execution
37
Merger on track, well-positioned to capture
structural growth in Benelux recycling
Expanded margins, lower leverage
and higher quality earnings
Sustained growth in EPS,
returns and dividends
Stage 1:
Focus
Stage 2:
Grow

IV. Sustainability at our core

Recognised as a Leader in Sustainability
• Waste-to-product as our Vision
• Sustainability as a core Value
• Listed on FTSE4Good Index
• First UK company to issue Green Retail Bond
• First FTSE company to put Green Framework
around all borrowings
• First FTSE company to enter into sustainability
framework based on ESG own targets
• Founder member of Netherlands Circular Coalition
39

Sustainability Legislation Driving our Business Model
• Our activities meet development goals within five of the UN’s Sustainable Development Goals
(SDGs)
• We help countries achieve the requirements of the EU Waste Directive by diverting 90% of our waste
from landfill
• We help meet the obligations of the Paris COP Treaty by avoiding over 3m tonnes of CO2 per annum
• We operate higher up the waste hierarchy than any other leading waste company through our focus
on re-use and recycling rather than incineration or landfill
• We are well positioned to meet the needs of the EU Circular Economy Package and Dutch
legislation by connecting waste produced back to raw material consumers, particularly in construction
40
We meet the sustainability goals of our customers and regulators

Our ESG Credentials
41More information at: www.renewiplc.com

Green Finance completed in May
Green Framework
42
Green Scorecard Other
1 2 3
• Renewi is a “Pure Play” sustainability
company: virtually all assets &
operations are “Green”
• Focused on “pollution prevention
and control”, which results in Waste to
product and carbon avoidance amongst
other benefits
• ICMA Green Bond principles and LMA
Green Loan principles applied
• Verified Green approach by
Sustainalytics
• Maintain green assets > green debt
• All future issuance can be Green
• Five performance measures
1. Recycling and Recovery Rate;
2. Carbon Avoidance;
3. Fleet efficiency, reducing emissions;
4. Low polluting Euro VI fleet; and
5. Reduction in 3 day accident rate.
• Renewi will benefit from a lower margin
for achieving each of these objectives
• Supported by our six core banks
• Duration extended to May 2023
• Options to extend duration to 2025
• Facility of €550m
• Leverage ratio covenant:
• 3.50x for FY19;
• 3.25x for FY20; and
• 3.00x thereafter

V. Site tour – safety briefing

Nieuwegein – Site Tour Safety briefing
44
You are required to
wear reflective and
fluorescent outwear
You are required to
wear safety shoes
Open fires are
prohibited on the entire
site
Smoking is prohibited
on the entire site,
except for the smoking
area
You are visiting, please
always follow the
instructions given by
our staff
You are required to
wear a safety helmet in
our hall
No use of mobile
phones allowed during
tour
Stay on the indicated
pathways

Many logistical movements take place on our site. For the site tour this is the main risk:
▶ Trucks
▶ Shovels
▶ Cranes
We cannot expect you to immediately assess all the risks properly.
▶ So stay with your guide and follow his instructions.
▶ Do not walk away when you see something, but ask your guide if it is possible.
▶ Do not make or receive phone calls whilst on the site tour
45
Nieuwegein – Site Tour Safety briefing

Renewi Nieuwegein – The Site
Our main activities:
- Wood factory: 180.000 tons a year
- Sorting line: 160.000 tons a year
- Special waste depot: 18.000 tons a year
- Storage and transhipment of waste: 70.000 tons a year
- Transport department, c.120 trucks
46

LUNCH AND SITE TOUR

VI. Operational divisions

Commercial Waste Division - Business model
49
Source: Annual Report 2017/18
The commercial waste market covers the collection, sorting, treatment and recycling of waste materials from a
range of sources. It also includes the ultimate disposal of waste streams that cannot be recycled or incinerated

Commercial Waste Division - Netherlands
50
Legacy VGG location
Legacy Shanks location
• NL GDP growth
• Construction market recovery
• Incineration utilisation & spot pricing
• Legislation to increase recycling
• Recyclate de-regulation and quality
• Skilled labour including drivers
Growth Drivers
• Logistic efficiency collection (lifts/km)
• Volumes processed by waste stream
• Price per tonne per waste stream
• Processing efficiency (tonnes/hr)
• Quality, volume and pricing/ spread
of recyclates
• Leveraging purchasing power
• Digitalisation/automation/innovation
• Differentiated customer offerings
InternalExternal

Commercial Waste Division - Netherlands - Key sites
51
AMSTERDAM: C&D, DOMESTIC AMSTERDAM: ICOPELLETS NIEUWEGEIN: C&D,WOOD WATERINGEN: C&D, ROCKWOOL
BREDA: CONFIDENTIAL PAPER ZOUTEWOUDE: PAPER PIJNACKER: SORTING ACHT: PLASTIC SORTING
SON: FOOD WASTE PROCESSING DRACHTEN: CHEMICAL WASTE AMERSFOORT: minerals HOEK V HOLLAND: horticulture

Commercial Waste Division – Netherlands - Financials
52
Note. Results in the year to 31 March 2017 and 31 March 2016 show pro forma revenue and EBIT and include Van
Gansewinkel as if owned throughout the period rather than from legal completion on 28 February 2017; on 1 April 2018
the Dutch property portfolio entity was transferred to the Netherlands Commercial Division from Group Central Services
and the glass activities of van Tuijl were transferred to the Monostreams Division
Netherlands
• Underlying market conditions positive
• GDP grew by c3% annually
• Strong construction market growth from historically low
levels
• Higher incinerator gate fees and taxes support recycling
pricing
• Recyclate revenue has fallen following the Chinese
import ban, with restricted margin impact as forecast
• Strong growth in underlying profit
• Commercial effectiveness: selling for margin not volume
and tender margins increasing
• Synergy delivery on track to date. Key system migrations
and route optimisation scheduled for the second half of
FY19.
• Cost inflationary pressures offset by strong pricing
Mar-16 Mar-17 Mar-18 Sep-17 Sep-18
€m €m €m €m €m
Revenue 667.5 690.5 736.9 363.9 375.8
Revenue growth 3.4% 6.7%
Underlying EBIT 15.5 26.4 44.0 25.1 25.3
Underlying EBIT growth 70.3% 66.7%
Underlying EBIT Margin 2.3% 3.8% 6.0% 6.9% 6.7%
Return on operating assets N/A 10.5% 18.0% 14.8% 17.0%Total Return on operating assets (pro forma)
12 months ended 6 months ended

53
Commercial: Recyclate Pricing Impact
Situation
• Chinese import ban reduced
import of low quality paper and
plastic recyclates in 2017
• Trend of further restrictions
• Market pricing now stabilised
but at lower levels
• Some low grade plastics going
to incineration
• Governments and regulators
engaged
Pricing Trends Active Management
• Renewi focused on higher
quality recyclates
• Dynamic pricing mechanism
maintains Renewi paper
margin for 75% volume
• Proactive pricing to offset,
including surcharges
• Scale enables reach into new
outlets
• Increasing trend towards
demand driven business will
over time reduce reliance
€ 0
€ 50
€ 100
€ 150
€ 200
apr-17
sep-17
mar-18
sep-18
Paper
€ 0
€ 50
€ 100
€ 150
€ 200
€ 250
apr-17
sep-17
mar-18
sep-18
Plastics

54
NL Commercial Case Synergy Case Study Rotterdam Site Rationalisation
Actions Timing
• Works counsel approval Completed
• Management team moved into
Vlaardingen
Completed
• Close Rotterdam Ophemerstraat 6/19
• Close Rotterdam Keentstraat 12/18
• Expand Vlaardingen 3/19
• Keep Molenvliet & Vareseweg

55
1. Rotterdam Molenvliet – sorting line building &
demolition waste + rooftop recycling
2. Vlaardingen – focus on shredding wood & water
connection for bulky waste inter alia
3. Rotterdam Vareseweg - focus on paper recycling
Rotterdam Site Rationalisation – specialised processing sites

Commercial Waste Division - Belgium
56
• BE GDP growth
• Outlet availability and pricing
• Legislation/ regulation to increase
recycling rates
• Recyclate pricing
• New markets
• Strategic alliances
Growth Drivers
• Volumes processed by waste stream
• Average price per tonne by waste
stream
• Logistic efficiency collection (lifts/km
or /day)
• Processing efficiency (tonnes/hr)
• Recyclate volumes (tonnes/ stream)
• Recyclate prices and spread
• Innovation/ digitalisation/ automation
• Improving quality of incoming
volumes
InternalExternal

57
Commercial Waste Division - Belgium - Key Sites
Puurs: Commercial Waste collection and
sorting line
Mont-Saint-Guibert: Commercial Waste
collection and sorting line
Roeselare: Hazardous waste Bree: wood recycling
Mol: hazardous waste Evergem: Commercial Waste collection
and wood pre-treatment
Gent: SRF production line and water
treatment
Châtelet: Commercial Waste collection
and sorting line
Seraing: Waste collection and sorting Houthalen: Commercial Waste collection
and PET sorting line
CETEM: landfill with green power Kampenhout: commercial waste
collection and organic waste pre-
treatment

Commercial Waste Division - Belgium - Financials
58
Note. Results in the year to 31 March 2017 and 31 March 2016 show pro forma revenue and EBIT and include Van
Gansewinkel as if owned throughout the period rather than from legal completion on 28 February 2017
Belgium
• Underlying volume growth in line with market
• GDP grew by c2% annually
• Inbound volume stable in last six months: some secondary
disposers turned away
• Recyclate income as per Netherlands
• Tighter balance of incinerator capacity
• Steady growth in underlying profit
• Synergy delivery on track to date. Successful migration of
two sites in the summer with the remainder on track for the
second half.
• Increasing focus on processing
• Decline in profitability of Cetem landfill as volumes
reduce prior to 2019 closure
Mar-16 Mar-17 Mar-18 Sep-17 Sep-18
€m €m €m €m €m
Revenue 409.6 415.4 422.2 211.3 210.9
Revenue growth 1.4% 1.6%
Underlying EBIT 21.5 27.5 29.3 16.0 15.2
Underlying EBIT growth 27.9% 6.5%
Underlying EBIT Margin 5.2% 6.6% 6.9% 7.6% 7.2%
Return on operating assets N/A 25.3% 27.4% 25.7% 29.5%Total Return on operating assets (pro forma)
12 months ended 6 months ended

Commercial Belgium – Integration Overview
59
Organisation
Synergy projects
Site Migration to One Renewi IT platform Gent, Braine, MSG, Vorst (rb), Monceau in ‘18. Seraing, Villerot and Vorst (skip) in Q1/Q2 ‘19.
Site Migration to One Renewi IT platform Kortemark pilot (1 May ‘18).
Weave - Fiscal and legal integrationPartnership, Combi-routing across two legal entities
HR Integration: Joint Labour Committee Harmonisation
Target Operating Model & Overheads
Route optimisation: Flanders roll-bins completed in 2018.Flanders skip in Q1 ‘19, Brussels & Hainaut and Chemical & Medical in ‘19.
Site rationalisations and development: 5/6 sites will be closed and 9 sites / regions. Manhay sale completed in 2018. Seneffe/Monceau, Wandre/Liège/Seraing, Lokeren/Gent to be completed mid Q2/Q3 2019
Miscellaneous: Including sales, procurement, branding, freight exchange, fleet, finance.
Materials: Optimal use of scale, facilities, processing, sorting. Investments in new sorting lines & installations (o.a. Seraing, Vilvoorde.)
FY 2017/2018 FY 2018/2019 FY 2019/2020

60
Hazardous Waste Division - Business Model
Source: Annual Report 2017/18
The Hazardous Waste Division is made up of two businesses: Reym and ATM.
ATM is one of Europe’s largest sites for the treatment of contaminated soil and
water, as well as for the disposal of a broad range of hazardous waste such as
waste paints and solvents. Reym is to be divested.

Hazardous Waste Division
• #1 in European thermal soil treatment
• #1 in Dutch waste water treatment (heavily
contaminated)
• #1 in Dutch high end industrial cleaning
Hazardous
61
Strategy
Increase capacity to treat additional volumes and
broaden the range of products treated while retaining
attractive returns

62
ATM: An Integrated Plant
Activities
• Thermally treated soil
• Waterside (wastewater & sludges)
• Packaged waste

63
Hazardous Waste Division - ATM
600KT of storage capacity Thermal treatment kiln Soil transport for offset
2,500 ships cleaned at jetty 30,000m³ storage Separation treatment of oil,
water & sludge
Biological water treatment
Noxious gases destroyed
in incinerator
Cools gases after burning Recovers dust from gases Clean air monitored in
stack
SOIL
WATER
CHEMICALS /
EMISSION

64
Regulatory Status Implications Supply and Demand
* Current pipeline of demand is >5 million tonnes (or 5 years ATM production)
Dialogue with authorities now
collective and intensifying
Do not expect full production to
start in H2
• Last month, notification received
that our soil product meets existing
technical specification
• On 7 November 2018, regulators
collectively informed us that
additional tests are required
• Further testing to start with
technical and legal dialogue
continuing at pace and at all levels
• Reducing ATM soil production to
~30% capacity until situation
becomes clearer
• Financial impact up to €3m profit
per calendar month
• Accelerating plans for innovative
process to create products for
secondary building materials
market
Robust and compelling business
model
• Strong supply of contaminated soil
from Dutch and international
sources
• Backlog of contaminated soil at
customer sites needing treatment
• Strong ‘pull’ for ATM soil product
from construction players*, as
sustainable and financially
attractive
ATM Update

Hazardous Waste Division - Focus: Reym Divestment
65
• Leading industrial cleaning
company in the Netherlands
• Outstanding reputation for service,
safety, quality and innovation
• Integration of VGIS already
completed
Key Benefits
Focuses Hazardous Waste
management on ATM
Tighter portfolio alignment
with waste-to-product vision
Concentrates resources on
Benelux growth in Benelux
recycling
Proceeds free up cash to
delever or invest
Considerations
• Professional services
business not fully in line with
Renewi vision
• Requires focused
management and
investment in people
• Limited operational
synergies with rest of
Renewi business
• Able to execute without
disrupting ATM and linkage
to Renewi protected through
long-term agreement
Business Overview

Hazardous Waste Division - Financials
66
Note. Results in the year to 31 March 2017 and 31 March 2016 show pro forma revenue and EBIT and include Van
Gansewinkel as if owned throughout the period rather than from legal completion on 28 February 2017
ATM
• Historic stable revenues and strong sustainable
margins and returns
• Production of thermally treated soil reduced in August
2017 and further in November 2018 in response to
IL&T review
• Waterside intake and treatment performing well
• Strong average pricing of packed chemicals treatment
Reym
• Very long term customer relationships
• Core oil and gas markets mixed with fewer major
shutdowns this year
• Erratic customer demand patterns impacting
productivity and profitability
• Successful VGIS integration: site rationalisation
completed
Mar-16 Mar-17 Mar-18 Sep-17 Sep-18
€m €m €m €m €m
Revenue 212.5 224.3 231.0 117.3 108.0
Revenue growth 5.6% 3.0%
Underlying EBIT 21.5 24.8 19.9 15.7 5.9
Underlying EBIT growth 15.3% -19.8%
Underlying EBIT Margin 10.1% 11.1% 8.6% 13.4% 5.5%
Return on operating assets N/A 26.0% 24.1% 28.1% 14.0%Total Return on operating assets (pro forma)
12 months ended 6 months ended

67
Monostreams Division - Business Model
Source: Annual Report 2017/18
The Monostreams Division comprises
four businesses: Coolrec, Mineralz,
Orgaworld and Maltha. These businesses
produce materials into specific markets
from waste streams such as glass
bottlebanks, discarded electrical and
electronic equipment, source separated
organics and incinerators’ bottom ashes

Monostreams Division
• #1 in European glass recycling and trading of
recycled glass “cullet”
• #1 handler of mineral waste in Netherlands
• #2 in Netherlands organics processing
• Top 3 in European WEEE recycling
Monostreams
68
Strategy
Deliver profitable growth through existing operational
footprint and in the longer term grow profits through a
larger product portfolio

Monostreams Division – an Overview
69
MineralzMaltha
CoolrecOrgaworld
• Maasvlakte specialist landfill, unique in
Netherlands
• Bottom ashes treatment market growing
• Legacy landfills
• Turns waste glass into cullet and powder
• Operates in Benelux, France and Portugal
• 33% owned by Owens-Illinois
• Driving operational improvements
• Leader in secondary materials production
• Margins challenged by metal prices
• Underlying volume growth drivers
• Restructuring to focus on higher value
activities
• Leader in food waste anaerobic digestion
• Dry and wet anaerobic digestion as well as
composting
• Innovator in next generation organic
treatment

70
Monostreams Division - Our Sites
Maltha, Dintelmond, NL Maltha, Béziers, France
Coolrec Recydel, Liège, BE
Mineralz, Maasvlakte, NLMineralz, Zweekhorst, NL
Orgaworld, Amsterdam, NL Orgaworld, Lelystad, NL Coolrec, Dordrecht, NL

Monostreams Division - Financials
71
Note. Results in the year to 31 March 2017 and 31 March 2016 show pro forma revenue and EBIT and include Van
Gansewinkel as if owned throughout the period rather than from legal completion on 28 February 2017
• Mineralz: Strong growth in bottom ashes volumes,
preparations to extend Maasvlakte specialist landfill
underway
• Orgaworld: Earnings growth based on strong
volumes, operational recovery, improving markets
• Coolrec: Income recently impacted by a fall in price of
aluminium; cost actions underway including
rationalisation of activities
• Maltha: Ongoing recovery plan addressing operational
issues at key sites in Netherlands
Mar-16 Mar-17 Mar-18 Sep-17 Sep-18
€m €m €m €m €m
Revenue 176.9 190.4 204.4 102.4 110.5
Revenue growth 7.6% 7.4%
Underlying EBIT 11.3 14.7 18.2 10.8 8.8
Underlying EBIT growth 30.1% 23.8%
Underlying EBIT Margin 6.4% 7.7% 8.9% 10.5% 8.0%
Return on operating assets N/A 19.4% 25.6% 23.2% 22.8%Total Return on operating assets (pro forma)
12 months ended 6 months ended
72
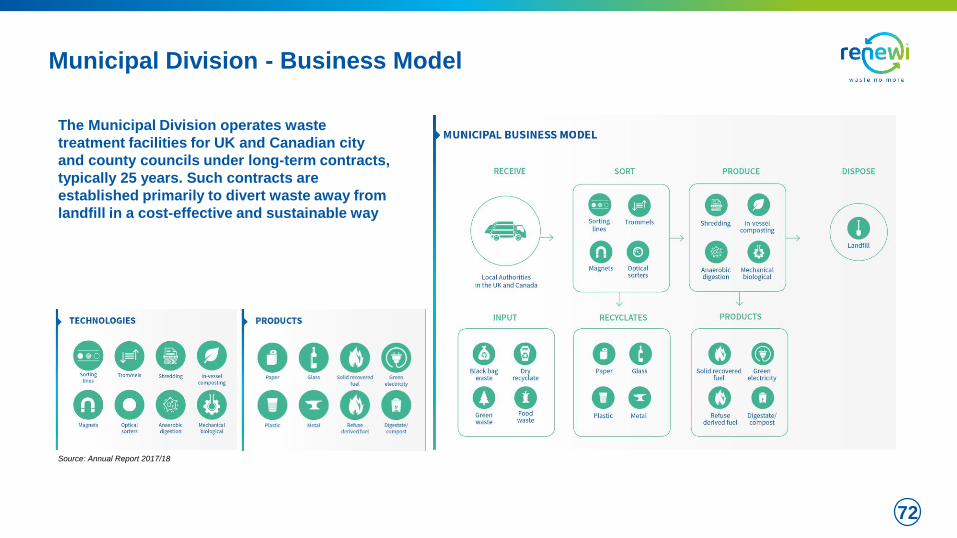
Source: Annual Report 2017/18
The Municipal Division operates waste
treatment facilities for UK and Canadian city
and county councils under long-term contracts,
typically 25 years. Such contracts are
established primarily to divert waste away from
landfill in a cost-effective and sustainable way
Municipal Division - Business Model

Municipal Division
• UK leader in MBT treatment of waste
• Canadian leader in treatment of organic waste
• Business underpinned by long-term contracts
incorporating investments in associated SPVs
Municipal
73
Strategy
Reduce losses through recovery plan that stabilises,
improves and de-risks the business, while bringing
new assets into full and profitable operation

74
Municipal Division - Our UK Sites
Barnsley, Doncaster and Rotherham (BDR) Wakefield Cumbria
Derby East London (ELWA) Argyll and Bute

• H1 performance a strong recovery
• Long-term offtake contracts signed to mitigate risks
• All operations now stabilised and with continuous
improvement underway
• Negotiations ongoing with councils to reshape and
reposition services
• Interserve working to bring Derby into full service
and now processing waste on all three lines
• Planned exit from non-core UK anaerobic digestion
market completed successfully in H1
o EBG £10m profit on sale to private equity
o Westcott Park sold to strategic buyer
• Exit from loss-making D&G contract negotiated and
transition underway
• Termination payment equivalent to less than 3
year losses on 10 year contract
Ongoing Operational Grip Portfolio Management
Municipal Division - Focus: Sustain UK Platform
75
Manage within provisions and
renegotiate wherever possible Exit where in shareholders’ interest

Municipal Division - Focus: Canada Municipal Divestment
76
• Strong stand-alone position - #1 in
organics
• Well-placed and good footprint in a
growing market
• Financials show strong profit growth
this financial year
• Strong cash generation
Key benefits
Concentrates resources on
Europe/Benelux growth
UK management focus on
managing PFI contracts
Simplifies our portfolio and
equity story
Proceeds free up cash to
delever or invest
Considerations
• Small position in overall
Renewi portfolio
• Remote location relative to
Renewi’s core operations
• Requires cash and
management for expansion
• Limited synergies with rest
of the Renewi businesses
• Significant inbound interest
from potential buyers
• Divestment manageable
without disruptions
Business overview
Surrey
Biofuel
Facility
London composting plant
Ottawa
composting
plant
Key Benefits
Concentrates resources on
Europe/Benelux growth
UK management focus on
managing PFI contracts
Simplifies our portfolio and
equity story
Proceeds free up cash to
delever or invest
Considerations
• Small position in overall
Renewi portfolio
• Remote location relative to
Renewi’s core operations
• Requires cash and
management for expansion
• Limited synergies with rest
of the Renewi businesses
• Divestment manageable
without disruptions
Business Overview

Municipal Division - Financials
77
Note. Results presented for March 2016 have been restated to EUR from the original reporting currency (GBP)
UK
• Recovery in the UK profitability as expected
• BDR and Wakefield fully operational, and provisions
recognised
• Significant progress on the Derby project but long stop
date missed by Interserve
• Westcott Park and EBG sold, D&G exited
Canada
• London facility now at full operational performance
• Surrey bio-fuel facility entered full service in May 2018
Mar-16 Mar-17 Mar-18 Sep-17 Sep-18
€m €m €m €m €m
Revenue 256.5 247.8 219.3 112.3 113.4
Revenue growth -3.4% -11.5%
Underlying EBIT 12.8 (2.9) (10.6) (5.6) 4.3
Underlying EBIT growth N/A N/A
Underlying EBIT Margin 5.0% -1.2% -4.8% -5.0% 3.8%Total Return on operating assets (pro forma)
12 months ended 6 months ended

VII. Financial and operational summary

Income Statement
79
Note. Results in the year to 31 March 2017 and 31 March 2016 show pro forma revenue and EBIT and include Van
Gansewinkel as if owned throughout the period rather than from legal completion on 28 February 2017; Results
presented for March 2016 have been restated to EUR from the original reporting currency (GBP)
Highlights
• All results presented in Euros and on a proforma basis for
Revenue and EBIT in the years to March 2016 and 2017
• Merger completed February 2017
• Synergies on track and delivering incremental EBIT
• Inflationary cost pressures being offset by increased
pricing
• Interest increased as expected for merger funding
• Underlying EPS shows merger accretion
• Dividends maintained and expected to increase once
target cover level is reached
Mar-16 Mar-17 Mar-18 Sep-17 Sep-18
€m €m €m €m €m
Revenue (pro forma) 1,697.3 1,730.2 1,779.1 890.4 900.4
Revenue growth 1.9% 2.8%
Underlying EBIT (pro forma) 46.7 63.6 78.5 49.5 44.8
Underlying EBIT growth 36.2% 23.4%
Revenue (as reported) 840.1 927.7 1,779.1 890.4 900.4
Underlying EBIT (as reported) 45.5 43.7 78.5 49.5 44.8
Net Interest (18.3) (15.3) (22.7) (11.9) (11.5)
Income from associates and JVs 1.4 2.4 2.6 1.1 0.6
Underlying profit before tax 28.6 30.8 58.4 38.7 33.9
Non-trading and exceptional items (31.1) (101.9) (115.1) (13.4) (10.4)
Profit (loss) before tax (2.5) (71.1) (56.7) 25.3 23.5
Taxation (2.2) 0.4 2.4 (7.7) (3.0)
Profit (loss) after tax (4.7) (70.7) (54.3) 17.6 20.5
Discontinued operations 0.1 (0.6) 0.4 (0.1) -
Total Profit (loss) after tax (4.6) (71.3) (53.9) 17.5 20.5
Continuing operations:
Basic earnings (loss) per share (cents) (1.1) (13.1) (6.8) 2.2 2.5
Underlying earnings per share (cents) 5.7 4.5 5.4 3.7 3.1
Dividend (pence per share) 3.45p 3.05p 3.05p 0.95p 0.95p
12 months ended 6 months ended

Note. Results presented for March 2016 have been restated to EUR from the original reporting currency (GBP)
Non-trading and Exceptional Items
80
• Merger related costs including synergy delivery and
integration total €70m as per original guidance
• Integration costs include adviser fees, costs of integration
management teams and initial branding and IT costs that
cannot be capitalised.
• Portfolio management includes the exit of the D&G
contract and Westcott Park AD facility
• Onerous contract provisions represents the net
present value of the future estimated loses at UK
Municipal contracts over their remaining life
• Exceptional finance costs relate to the merger
Mar-16 Mar-17 Mar-18 Sep-17 Sep-18
€m €m €m €m €m
Merger related costs - (8.6) (25.0) (8.8) (16.9)
Portfolio management activity (12.6) (22.3) (26.1) (0.3) 11.1
UK Municipal onerous contract provisions (6.4) (33.0) (59.8) 0.2 -
ATM soil issues - - (2.9) - (1.3)
Other items (9.2) (10.9) 5.3 (1.2) -
Amortisation of acquisition intangibles (2.4) (2.5) (6.6) (3.3) (3.2)
Exceptional finance costs - (13.6) - - -
Change in fair value of derivatives 0.1 - - - (0.1)
Impairment of assets (0.6) (11.0) - - -
Total non-trading and exceptional items (31.1) (101.9) (115.1) (13.4) (10.4)
12 months ended 6 months ended
FY17 FY18 FY19 FY20 TOTAL
€m €m €m €m €m
Synergy delivery costs - cash 5 14 23 8 50
Integration costs 3 9 7 1 20
Merger related costs - cash 8 23 30 9 70
Synergy delivery costs - non-cash - 3 N/A N/A 3
Total merger related costs 8 26 30 9 73

Cash Flow Performance
81
Note. Results presented for March 2018 have been restated to EUR from the original reporting currency (GBP)
• Cash flow prior to year ended March 2018 relates to
Shanks Group only and therefore not comparable
• Capital expenditure tightly controlled across all divisions• March 2018 at 88% of depreciation
• September 2018 at 92% of depreciation
• Canada Municipal funding relates to the build of the
Surrey bio-fuel facility, and in the half year to September
2018 the municipality one-off contribution as the facility
entered into full service
• Other includes cash spend on UK Municipal onerous
contracts, and funding of UK defined benefit pension
scheme, amongst others
12 months ended
Mar-18 Sep-17 Sep-18
€m €m €m
EBITDA 178.3 99.0 92.6
Working capital movement and other 21.5 14.0 (4.8)
Net replacement capital expenditure (86.3) (40.5) (44.5)
Interest and tax (25.1) (14.6) (15.1)
Underlying free cash flow 88.4 57.9 28.2
Growth capital expenditure (3.5) (1.4) (2.2)
UK PFI funding (2.5) (2.0) (0.5)
Canada Municipal funding (11.5) (6.6) 7.4
Acquisitions and disposals (7.4) - 23.0
Dividends paid (27.6) (19.0) (18.9)
Restructuring spend (1.3) (0.9) (0.1)
Synergy & integration spend (20.4) (8.2) (19.2)
Transaction related spend (12.5) (10.7) (0.1)
Other (15.7) (12.7) (12.7)
VGG acquisition - net cash 0.8 - -
Net core cash flow (13.2) (3.6) 4.9
Free cash flow conversion 113% 117% 63%
6 months ended

82
Core Funding (excluding project companies) at September 2018
Liquidity headroom
• Significant undrawn headroom and cash
• Largely long term maturity
• RCF options to extend duration to 2025
Leverage ratio
• Half year end leverage ratio at 2.99x
• Leverage expected to peak in December 18
• Sustained fall in leverage thereafter from the flow
through of business growth, increased synergies and
the resumption of soil production at ATM in FY20
• Disposals of Reym and Canada will deleverage the
ratio by approximately 0.6x once completed
• These actions expected to reduce leverage to
Board’s revised target of <2.0x
2019 Bond
€100m
2022 Bond
€100m
Term Loan
€137.5m
Revolving
Credit Facility
€412.5m
Finance Leases
Facilities
2019 Bond
2022 Bond
Term Loan
Drawn RCF
Finance Leases
Gross Debt
Cash
€105.2m
Net Debt
€496.1m
Net Debt
Undrawn RCF
(€182.6m)Gross debt
€601.3m
Other
Other
83
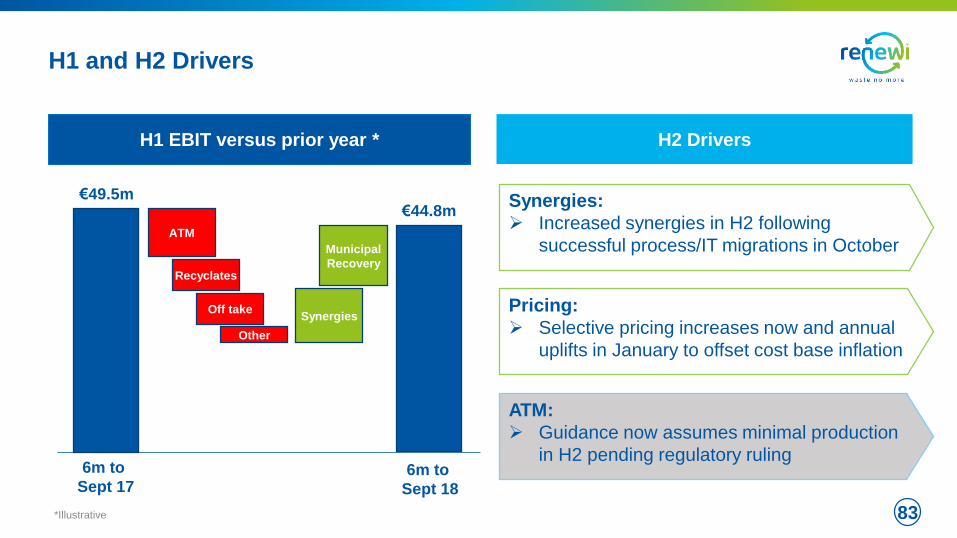
H1 and H2 Drivers
ATM
Recyclates
Off take
Other
Synergies
Municipal
Recovery
6m to
Sept 18
6m to
Sept 17
€49.5m€44.8m
H2 DriversH1 EBIT versus prior year *
*Illustrative
Synergies:
Increased synergies in H2 following
successful process/IT migrations in October
Pricing:
Selective pricing increases now and annual
uplifts in January to offset cost base inflation
ATM:
Guidance now assumes minimal production
in H2 pending regulatory ruling

H2 Divisional Outlook
84
Reduced expectations:
• ATM soil line to remain at reduced
production
• Reym actions on margins and productivity
Hazardous
Stronger performance in H2:
• Price increases to offset outlet cost pressures
• Additional cost actions
• Synergy benefits following IT migration
• Reduced outlet shortages
Commercial
In line with expectations:
• Contractor expected to bring Derby to full
service
• Ongoing operational improvements
Municipal
In line with expectations:
• Cost action in Coolrec and glass businesses
• Investment in Maasvlakte expansion
Monostreams

VIII. Concluding Remarks

The Leading Waste-to-Product Company
86
Structural growth in EU
recycling
Advantaged position as
leading Benelux player
Significant value to be
unlocked from merger
Current challenges are short
term or contained
Clear momentum to increase
margins and returns
Significant long term growth
opportunities
• Increasing demand for recycling driven by regulation, society and corporate reputations
• Growing new circular economy requiring scale and innovation
• Renewi has increasingly powerful social purpose
• Scale benefits due to industry cost structure
• Widest range of recycling services
• Transformational merger has consolidated core Benelux markets
• Further €14m annual cost synergies to be delivered by FY20 to meet €40m target
• Revenue and margin benefits will read through over time
• ATM soil issue recovery expected in FY20
• Municipal ring-fenced through provisions
• Recyclate price pressure actively mitigated
• Margins increasing from structural lows
• Returns in Benelux >20% with further upside
• Multiple innovation ideas and options
• Proven M&A capability to build or divest

Q&A

Appendix

89
Renewi Values
WHAT WE ARE HOW WE ACT
Our values are at the heart of everything we do!

90
Presenter Bio’s
Peter Dilnot
CEO
Appointed
February 2012
To be succeeded
as CEO by Otto
de Bont per April
2019
Previous
experience at
Danaher and BCG
Independent non-
executive director
of Rotork.
Toby Woolrych
CFO
Appointed
August 2012
Qualified as
chartered
accountant
Previous
experience at
Arthur Andersen,
Medicom
International,
Acta, Consort
Medical and
Johnson Matthey
Otto de Bont
CEO designate
MD NL Commercial
Appointed
May 2017
To succeed Peter
as CEO per April
2019
Previous
experience at a.o.
United
Technologies and
General Electric
Adam Richford
Treasurer
Appointed
January 2016
Qualified
chartered
accountant and
treasurer.
Previous
experience at
Gala Coral, GE
Capital and EY
Peter van
Kessel
Communications
Appointed
October 2014
Responsible for
internal and
external
communication
and press and
media relations
around the merger
Previous PR
experience at
DAF
Patrick Schillemans
FD NL Commercial
Appointed May
2018
Previous
experience in
finance with
Sabic, Rockwell
Automation and
Covisint
Sandor Karreman
General Area
Manager
Appointed in
September 2017
Previous
experience at Van
Vliet, ATM
Moerdijk and
KPMG
Christine Cooper
Financial
Controller
Appointed
November 2006
Qualified as
chartered
accountant with
BDO in the UK
Previous controller
experience across
listed and private
equity owned
international
groups

91
Developed in line with the voluntary guidelines of the Green Bond Principles, and Green Loan Principles
Consistent with recommendations of the EU High Level Expert Group and will align with EU rules once published
Pollution Prevention and Control is the key category within the Bond and Loan Principles taxonomy
• Waste Collection
• Waste Treatment
• Waste Recycling
• Waste to Energy
Waste Minimisation is the key category within the proposed EU taxonomy
Sustainable Development Goals:
• 7: Affordable and clean energy
• 9: Industry, innovation and infrastructure
• 11: Sustainable cities and communities
• 12: Responsible consumption and production
Renewi Green Finance Framework Approach

92
Renewi Green Finance Framework Overview
Total
Consolidated
Assets
£1.8B
Assets
Other
Liabilities
Equity
£0.4B
Green
Buffer
Green
Buffer
>£1B
Green Assets
Green
Facilities
£0.6B
Liabilities
Green
Activities
Excluded <5%
Simple approach
• Renewi is a “Pure Play” sustainability
focused company and virtually all assets &
operations are “Green”
• Green as they are focused on pollution
prevention and control, which results in
Waste to product and carbon avoidance
amongst other benefits
Future proof
• Enables further Green issuances
Large buffer
• Group leverage covenant restricts Green
Debt and preserves the Green Buffer

93
0%
10%
20%
30%
40%
50%
60%
70%
80%
90%
100%
Pre 2015 Pre Acq Acquisition 2018 2019 Future
2022 Green Bond
RCF
2022 Green Bond
2022 Green Bond
2022 Green Bond
2022 Green Bond
Renewi Green Finance Target
Green Finance Framework can apply to all future financing
RCF
Term Loan
2019 Bond
2019 Bond
2019 Bond
Finance leasesFinance leases Finance leases
New issuance, e.g. EUPP
IFRS16 Operating Leases
RCFRCF
RCF
Term Loan
Term Loan
Term Loan
New issuance, e.g. EUPP

NE
W C
SR
Me
as
ure
s
Green Key Performance Indicators
1 Waste no more Recycling and recovery rate% of waste accepted by our sites which is recycled or recovered for energy production, either direct or via the production of waste derived fuels
2 Carbon footprint Carbon avoidanceIncrease in the CO2 emissions avoided as a result of our activities per tonne of waste handled
3 Energy efficiency Efficient collectionsReduction in energy used by our waste collection activities per tonne of waste collected/transported
4 Pollution prevention % trucks Euro VI compliant % of our truck fleet compliant with Euro VI requirements
5 Safety & Health ≥3 day accident rate Number of ≥3 day accidents per 100.000 FTE
94