Embed Size (px)
Citation preview
Annual Reportyear ended 30 june 2018
Momentum Collective Investments Scheme
Page 2 of 70 Momentum Collective Investments Scheme | Annual Report | Year Ended 30 June 2018
Annual report for the year ended 30 June 2018
• Chief executive officer’s report 3
• Report of the trustees 4
• Abridged balance sheet 6
• Abridged income statement 8
• Abridged statement of changes in equity 10
• Investment performance 12
• Income distributions 13
• Portfolio details and fees 25
• Cost ratios 51
• Asset allocations 59
• Contact details 70
Momentum Collective Investments Scheme
contents
Page 3 of 70Momentum Collective Investments Scheme | Annual Report | Year Ended 30 June 2018
Business overviewWe remain committed to delivering on the desired investment outcomes of our clients and we continued to bolster our market-leading outcome-based investment offering in the past year. Opportunities at various roadshows targeting financial advisers have been used to further develop the widespread acceptance of our investment philosophy and our unique investment solutions.
On the back of these events, improved support into the flagship outcome-based solution range has been visible, with new business volumes increasing meaningfully. During the period of review, it is pleasing to confirm that our portfolios have performed in line with their respective mandates and have broadly delivered on client expectations. These portfolios remain well positioned to achieve their predefined real-return objectives, regardless of unpredictable market and economic conditions.
Subdued local growth and increasingly challenging emerging market sentiment Loose monetary policy continues to support developed market growth, but global liquidity may well have peaked. Although obvious signs of an imminent recession remain elusive, escalating risks of trade wars and geopolitical headwinds have begun to stimulate investor anxiety, thus resulting in increasingly bouts of market volatility. At this late stage in the on-going global market cycle, it feels intuitive that that the probability of a market correction appears greater than an indefinite continuation of positive market returns.
Global equities are expected to outperform global government bonds, as long as global growth remains intact. Meanwhile, developed market government bond market fundamentals remain negative, while the wide bond valuation premium with equities still persists. The future path of the United States (US) dollar is likely to be a major determinant of relative regional global equity returns. During weaker US dollar periods, local currency returns in US and emerging market (EM) equities typically outpace those in Europe and Japan.
The strength of the US dollar and an escalation in trade disputes were some of the main challenges to EMs in the first half of the year. In South Africa (SA), the president’s herculean task to address deep inequities has the potential to be achieved through his ten-point growth plan, but the land reform debate and a delay in a satisfactory new mining charter are inhibiting sentiment. Although government’s fiscal actions are likely to stave off a further sovereign ratings downgrade, a migration of the debt of state-owned enterprises to government’s balance sheet or populist political posturing could trigger negative ratings action.
Tepid growth and confidence are likely to delay the first interest rate increase into the first quarter of 2019, despite renewed upside risks to inflation and a widening external imbalance in an environment of tightening global financial conditions.
Recent rand weakness has driven significant SA corporate earnings upgrades, which have improved the return prospects of the SA equity asset class. In the absence of additional negative share-specific news from the listed property sector, good property returns should be expected from the current valuation. Local cash is expected to deliver lower absolute returns than nominal local bonds, but the scope for interest rate hikes in 2019 and beyond should bolster returns from this asset class in due course.
The year aheadConsidering the increased financial market volatility and escalating geopolitical concerns, particularly in the context of trade disputes and mounting inflationary pressures, investors could not be faulted for adopting a cautious sentiment.
The consensus view is, closer to home in South Africa, the optimistic start to the year has failed to maintain its momentum, with investor sentiment reflective of the economy yet to benefit from recent political leadership changes. Coupled with the lack of structural reform to raise the bar, the pressure continues to mount on economic growth and, thus, investment returns. It is exacerbated by external market pressures and rand weakness, which is taking inflation above the SA Reserve Bank’s targeted range.
In spite of these obvious market challenges, muted investment prospects, sentiment-driven investment and a political risk-on environment, staying invested is of utmost importance. It is this fundamental philosophy that makes outcome-based investing unique.
Finally, we would like to thank our investors for supporting us and for giving us the opportunity to tell our story. We believe our investment philosophy and approach to investing is unique and this will hopefully reward investors with the outcomes they have entrusted us to achieve.
Yours sincerely,
Etienne GouwsCEO: Momentum Collective Investments
Chief executive officer’s reportfor the year ended 30 June 2018
Page 4 of 70 Momentum Collective Investments Scheme | Annual Report | Year Ended 30 June 2018
The Standard Bank of South Africa Limited (Reg. No. 1962/000738/06) Authorised financial services provider and registered credit provider (NCRCP15) Directors: TS Gcabashe (Chairman) L Fuzile* (Chief Executive) A Daehnke* GJ Fraser-Moleketi Hao Hu1 GMB Kennealy BJ Kruger* JH Maree NNA Matyumza KD Moroka ML Oduor-Otieno2 AC Parker ANA Peterside CON3 MJD Ruck PD Sullivan4 SK Tshabalala* JM Vice Lubin Wang1 Company Secretary: Z Stephen – 23/05/2018 *Executive Director 1Chinese 2Kenyan 3Nigerian 4Australian
The Manager Momentum Collective Investments (RF) (Pty) Ltd 268 West Avenue Centurion Gauteng 0157 REPORT OF THE TRUSTEE FOR THE MOMENTUM COLLECTIVE INVESTMENT SCHEME We, the Standard Bank of South Africa Limited, in our capacity as Trustee of the Momentum Collective Investments Scheme (“the Scheme”) have prepared a report in terms of Section 70(1)(f) of the Collective Investment Schemes Control Act, 45 of 2002, as amended (“the Act”), for the financial year ended 30 June 2018. In support of our report we have adopted certain processes and procedures that allow us to form a reasonable conclusion on whether the Manager has administered the Scheme in accordance with the Act and the Scheme Deed. As Trustees of the Scheme we are also obliged to in terms of Section 70(3) of the Act to satisfy ourselves that every statement of comprehensive income, statement of financial position or other return prepared by the Manager of the Scheme as required by Section 90 of the Act fairly represents the assets and liabilities, as well as the income and distribution of income, of every portfolio of the Scheme. The Manager is responsible for maintaining the accounting records and preparing the annual financial statements of the Scheme in conformity with generally accepted accounting practice. This responsibility also includes appointing an external auditor to the Scheme to ensure that the financial statements are properly drawn up so as to fairly represent the financial position of every portfolio of its collective investment scheme are in accordance with generally accepted accounting practice and in the manner required by the Act. Our enquiry into the administration of the Scheme by the Manager does not cover a review of the annual financial statements and hence we do not provide an opinion thereon. Based on our records, internal processes and procedures we report that nothing has come to our attention that causes us to believe that the accompanying financial statements do not fairly represent the assets and liabilities, as well as the income and distribution of income, of every portfolio of the Scheme administered by the Manager.

Page 5 of 70Momentum Collective Investments Scheme | Annual Report | Year Ended 30 June 2018
2
We confirm that according to the records available to us, no losses were suffered in the portfolios and no investor was prejudiced as a result thereof. We conclude our report by stating that we reasonably believe that the Manager has administered the Scheme in accordance with:
(i) the limitations imposed on the investment and borrowing powers of the manager by this
Act;
(ii) and the provisions of this Act and the deed;
Melinda Mostert Seggie Moodley Standard Bank of South Africa Limited Standard Bank of South Africa Limited 25 September 2018
Page 6 of 70 Momentum Collective Investments Scheme | Annual Report | Year Ended 30 June 2018
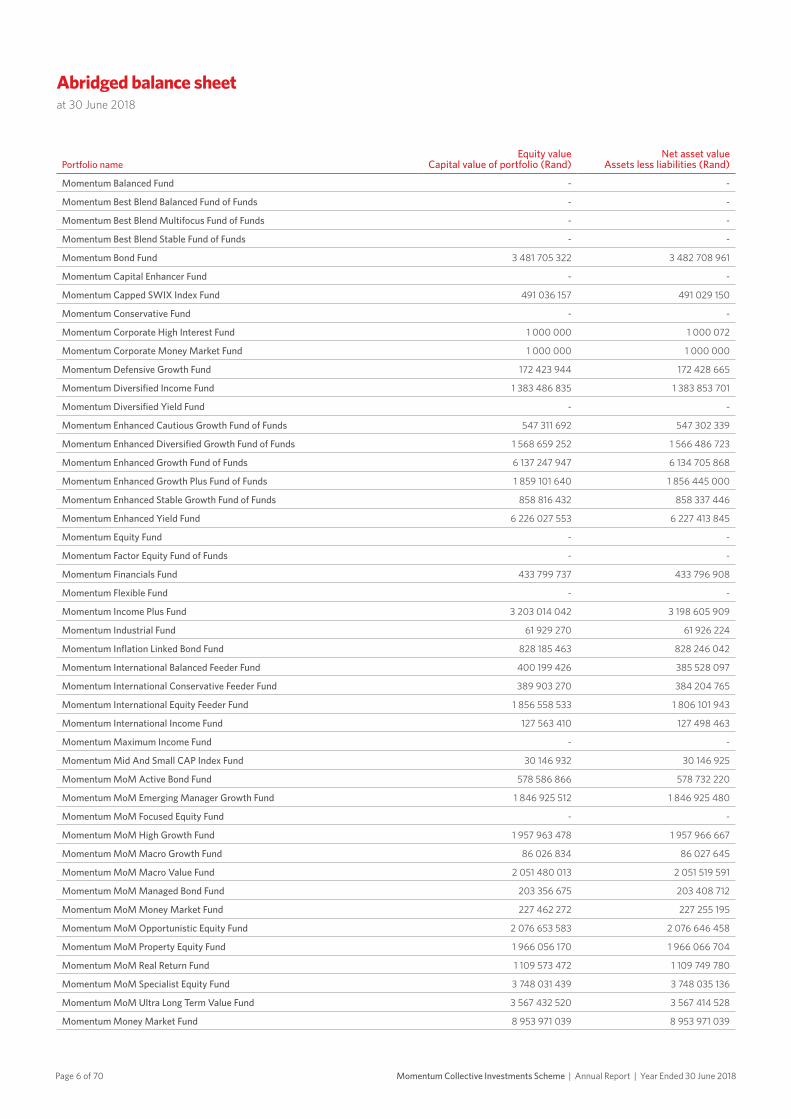
Portfolio nameEquity value
Capital value of portfolio (Rand)Net asset value
Assets less liabilities (Rand)
Momentum Balanced Fund - -
Momentum Best Blend Balanced Fund of Funds - -
Momentum Best Blend Multifocus Fund of Funds - -
Momentum Best Blend Stable Fund of Funds - -
Momentum Bond Fund 3 481 705 322 3 482 708 961
Momentum Capital Enhancer Fund - -
Momentum Capped SWIX Index Fund 491 036 157 491 029 150
Momentum Conservative Fund - -
Momentum Corporate High Interest Fund 1 000 000 1 000 072
Momentum Corporate Money Market Fund 1 000 000 1 000 000
Momentum Defensive Growth Fund 172 423 944 172 428 665
Momentum Diversified Income Fund 1 383 486 835 1 383 853 701
Momentum Diversified Yield Fund - -
Momentum Enhanced Cautious Growth Fund of Funds 547 311 692 547 302 339
Momentum Enhanced Diversified Growth Fund of Funds 1 568 659 252 1 566 486 723
Momentum Enhanced Growth Fund of Funds 6 137 247 947 6 134 705 868
Momentum Enhanced Growth Plus Fund of Funds 1 859 101 640 1 856 445 000
Momentum Enhanced Stable Growth Fund of Funds 858 816 432 858 337 446
Momentum Enhanced Yield Fund 6 226 027 553 6 227 413 845
Momentum Equity Fund - -
Momentum Factor Equity Fund of Funds - -
Momentum Financials Fund 433 799 737 433 796 908
Momentum Flexible Fund - -
Momentum Income Plus Fund 3 203 014 042 3 198 605 909
Momentum Industrial Fund 61 929 270 61 926 224
Momentum Inflation Linked Bond Fund 828 185 463 828 246 042
Momentum International Balanced Feeder Fund 400 199 426 385 528 097
Momentum International Conservative Feeder Fund 389 903 270 384 204 765
Momentum International Equity Feeder Fund 1 856 558 533 1 806 101 943
Momentum International Income Fund 127 563 410 127 498 463
Momentum Maximum Income Fund - -
Momentum Mid And Small CAP Index Fund 30 146 932 30 146 925
Momentum MoM Active Bond Fund 578 586 866 578 732 220
Momentum MoM Emerging Manager Growth Fund 1 846 925 512 1 846 925 480
Momentum MoM Focused Equity Fund - -
Momentum MoM High Growth Fund 1 957 963 478 1 957 966 667
Momentum MoM Macro Growth Fund 86 026 834 86 027 645
Momentum MoM Macro Value Fund 2 051 480 013 2 051 519 591
Momentum MoM Managed Bond Fund 203 356 675 203 408 712
Momentum MoM Money Market Fund 227 462 272 227 255 195
Momentum MoM Opportunistic Equity Fund 2 076 653 583 2 076 646 458
Momentum MoM Property Equity Fund 1 966 056 170 1 966 066 704
Momentum MoM Real Return Fund 1 109 573 472 1 109 749 780
Momentum MoM Specialist Equity Fund 3 748 031 439 3 748 035 136
Momentum MoM Ultra Long Term Value Fund 3 567 432 520 3 567 414 528
Momentum Money Market Fund 8 953 971 039 8 953 971 039
Abridged balance sheetat 30 June 2018
Page 7 of 70Momentum Collective Investments Scheme | Annual Report | Year Ended 30 June 2018
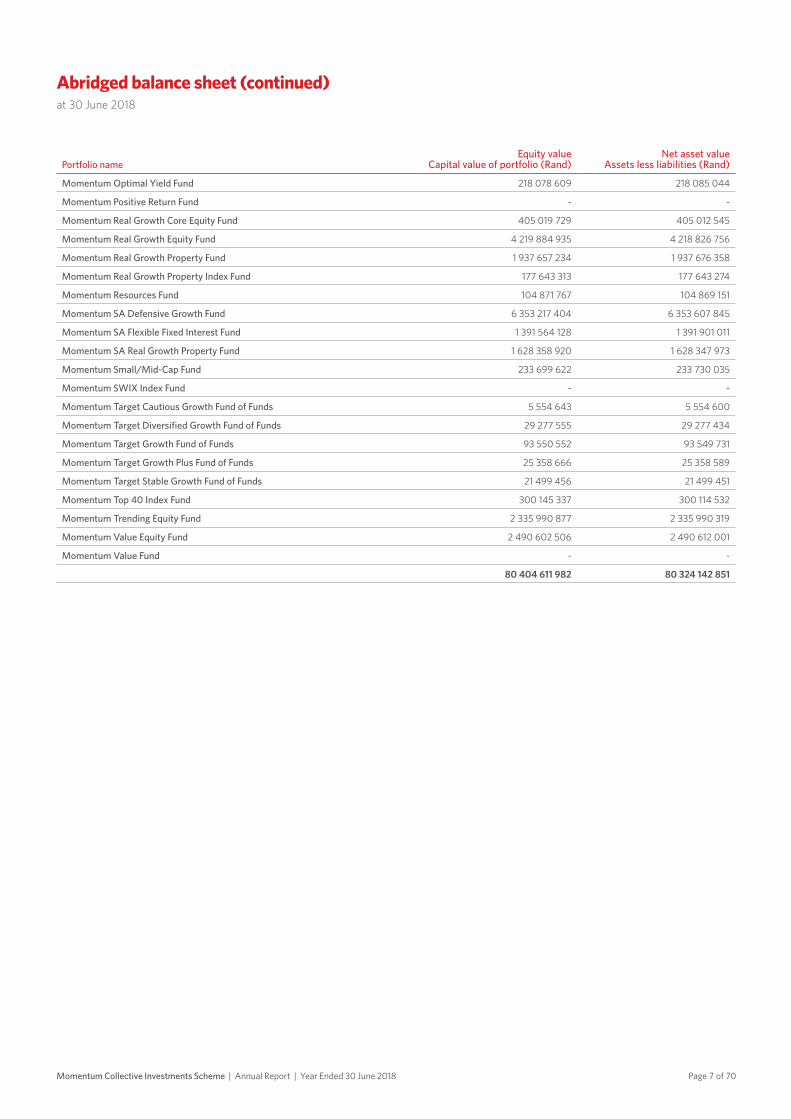
Portfolio nameEquity value
Capital value of portfolio (Rand)Net asset value
Assets less liabilities (Rand)
Momentum Optimal Yield Fund 218 078 609 218 085 044
Momentum Positive Return Fund - -
Momentum Real Growth Core Equity Fund 405 019 729 405 012 545
Momentum Real Growth Equity Fund 4 219 884 935 4 218 826 756
Momentum Real Growth Property Fund 1 937 657 234 1 937 676 358
Momentum Real Growth Property Index Fund 177 643 313 177 643 274
Momentum Resources Fund 104 871 767 104 869 151
Momentum SA Defensive Growth Fund 6 353 217 404 6 353 607 845
Momentum SA Flexible Fixed Interest Fund 1 391 564 128 1 391 901 011
Momentum SA Real Growth Property Fund 1 628 358 920 1 628 347 973
Momentum Small/Mid-Cap Fund 233 699 622 233 730 035
Momentum SWIX Index Fund - -
Momentum Target Cautious Growth Fund of Funds 5 554 643 5 554 600
Momentum Target Diversified Growth Fund of Funds 29 277 555 29 277 434
Momentum Target Growth Fund of Funds 93 550 552 93 549 731
Momentum Target Growth Plus Fund of Funds 25 358 666 25 358 589
Momentum Target Stable Growth Fund of Funds 21 499 456 21 499 451
Momentum Top 40 Index Fund 300 145 337 300 114 532
Momentum Trending Equity Fund 2 335 990 877 2 335 990 319
Momentum Value Equity Fund 2 490 602 506 2 490 612 001
Momentum Value Fund - -
80 404 611 982 80 324 142 851
Abridged balance sheet (continued)at 30 June 2018

Page 8 of 70 Momentum Collective Investments Scheme | Annual Report | Year Ended 30 June 2018
Portfolio nameIncome (Rand)
Expense (Rand)
Net profit/(loss) (Rand)
Momentum Balanced Fund 73 084 926 12 012 076 61 072 850
Momentum Best Blend Balanced Fund of Funds 33 515 702 5 768 169 27 747 533
Momentum Best Blend Multifocus Fund of Funds 16 197 748 646 715 15 551 033
Momentum Best Blend Stable Fund of Funds 5 217 004 711 912 4 505 092
Momentum Bond Fund 205 002 693 2 552 748 202 449 945
Momentum Capital Enhancer Fund 11 338 417 3 208 926 8 129 491
Momentum Capped SWIX Index Fund 9 013 134 307 354 8 705 780
Momentum Conservative Fund 10 618 325 2 693 296 7 925 029
Momentum Corporate High Interest Fund 32 229 25 683 6 546
Momentum Corporate Money Market Fund 32 717 66 32 651
Momentum Defensive Growth Fund 6 025 055 580 508 5 444 547
Momentum Diversified Income Fund 101 982 188 11 606 531 90 375 657
Momentum Diversified Yield Fund 5 557 247 1 043 919 4 513 328
Momentum Enhanced Cautious Growth Fund of Funds 28 452 623 5 559 220 22 893 403
Momentum Enhanced Diversified Growth Fund of Funds 40 874 731 14 657 988 26 216 743
Momentum Enhanced Growth Fund of Funds 98 869 751 23 929 037 74 940 714
Momentum Enhanced Growth Plus Fund of Funds 37 305 155 15 007 304 22 297 851
Momentum Enhanced Stable Growth Fund of Funds 21 509 312 7 941 771 13 567 541
Momentum Enhanced Yield Fund 484 958 979 23 922 159 461 036 820
Momentum Equity Fund 27 221 572 8 112 656 19 108 916
Momentum Factor Equity Fund of Funds 445 100 199 760 245 340
Momentum Financials Fund 20 220 698 6 559 832 13 660 866
Momentum Flexible Fund 8 553 375 2 394 141 6 159 234
Momentum Income Plus Fund 306 880 152 34 048 785 272 831 367
Momentum Industrial Fund 1 542 530 1 380 069 162 461
Momentum Inflation Linked Bond Fund 27 940 429 2 150 991 25 789 438
Momentum International Balanced Feeder Fund 600 317 2 878 584 (2 278 267)
Momentum International Conservative Feeder Fund 1 181 729 551 692 630 037
Momentum International Equity Feeder Fund 2 401 107 8 843 794 (6 442 687)
Momentum International Income Fund 3 114 320 1 193 943 1 920 377
Momentum Maximum Income Fund 18 047 919 1 957 953 16 089 966
Momentum Mid And Small CAP Index Fund 1 175 924 71 043 1 104 881
Momentum MoM Active Bond Fund 52 775 911 183 546 52 592 365
Momentum MoM Emerging Manager Growth Fund 66 424 227 601 769 65 822 458
Momentum MoM Focused Equity Fund 3 008 062 4 137 783 (1 129 721)
Momentum MoM High Growth Fund 65 208 846 2 616 293 62 592 553
Momentum MoM Macro Growth Fund 3 484 935 850 551 2 634 384
Momentum MoM Macro Value Fund 58 613 030 534 843 58 078 187
Momentum MoM Managed Bond Fund 18 466 601 117 235 18 349 366
Momentum MoM Money Market Fund 16 102 620 125 463 15 977 157
Momentum MoM Opportunistic Equity Fund 71 812 540 2 728 252 69 084 288
Momentum MoM Property Equity Fund 141 580 781 519 090 141 061 691
Momentum MoM Real Return Fund 87 258 369 1 919 792 85 338 577
Momentum MoM Specialist Equity Fund 161 167 525 435 720 160 731 805
Momentum MoM Ultra Long Term Value Fund 136 945 585 4 444 784 132 500 801
Abridged income statementfor the year ended 30 June 2018
Page 9 of 70Momentum Collective Investments Scheme | Annual Report | Year Ended 30 June 2018
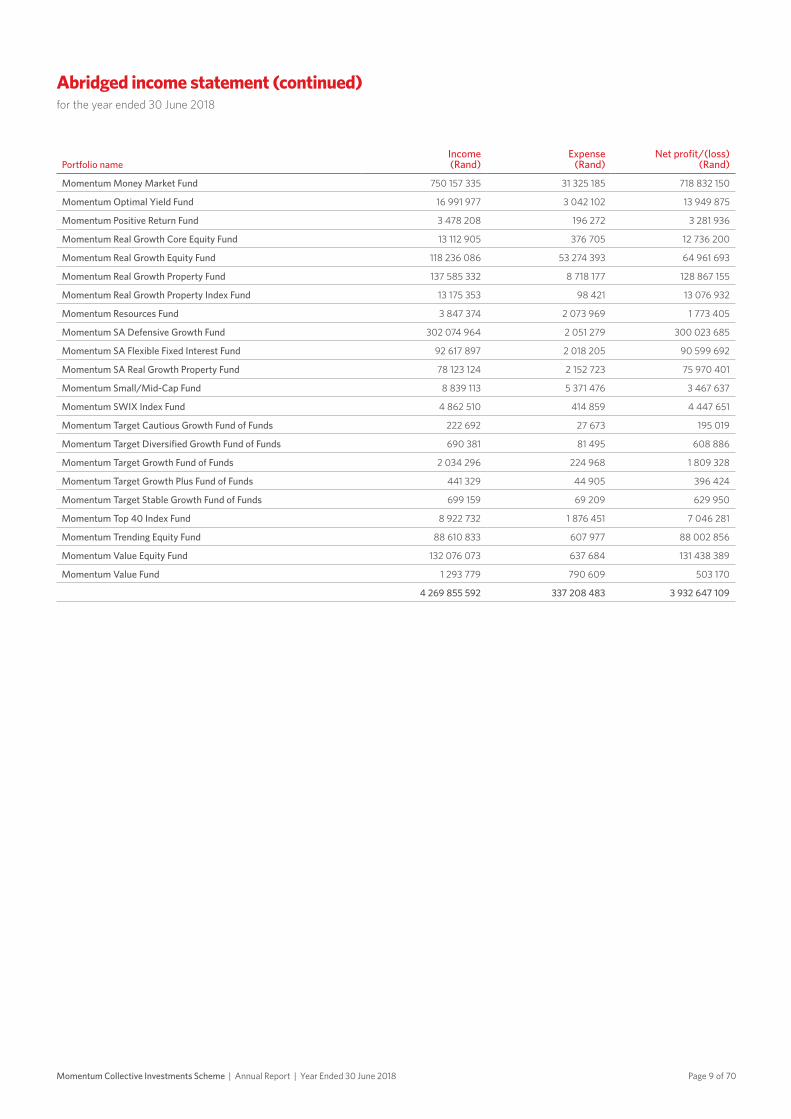
Portfolio nameIncome (Rand)
Expense (Rand)
Net profit/(loss) (Rand)
Momentum Money Market Fund 750 157 335 31 325 185 718 832 150
Momentum Optimal Yield Fund 16 991 977 3 042 102 13 949 875
Momentum Positive Return Fund 3 478 208 196 272 3 281 936
Momentum Real Growth Core Equity Fund 13 112 905 376 705 12 736 200
Momentum Real Growth Equity Fund 118 236 086 53 274 393 64 961 693
Momentum Real Growth Property Fund 137 585 332 8 718 177 128 867 155
Momentum Real Growth Property Index Fund 13 175 353 98 421 13 076 932
Momentum Resources Fund 3 847 374 2 073 969 1 773 405
Momentum SA Defensive Growth Fund 302 074 964 2 051 279 300 023 685
Momentum SA Flexible Fixed Interest Fund 92 617 897 2 018 205 90 599 692
Momentum SA Real Growth Property Fund 78 123 124 2 152 723 75 970 401
Momentum Small/Mid-Cap Fund 8 839 113 5 371 476 3 467 637
Momentum SWIX Index Fund 4 862 510 414 859 4 447 651
Momentum Target Cautious Growth Fund of Funds 222 692 27 673 195 019
Momentum Target Diversified Growth Fund of Funds 690 381 81 495 608 886
Momentum Target Growth Fund of Funds 2 034 296 224 968 1 809 328
Momentum Target Growth Plus Fund of Funds 441 329 44 905 396 424
Momentum Target Stable Growth Fund of Funds 699 159 69 209 629 950
Momentum Top 40 Index Fund 8 922 732 1 876 451 7 046 281
Momentum Trending Equity Fund 88 610 833 607 977 88 002 856
Momentum Value Equity Fund 132 076 073 637 684 131 438 389
Momentum Value Fund 1 293 779 790 609 503 170
4 269 855 592 337 208 483 3 932 647 109
Abridged income statement (continued)for the year ended 30 June 2018
Page 10 of 70 Momentum Collective Investments Scheme | Annual Report | Year Ended 30 June 2018
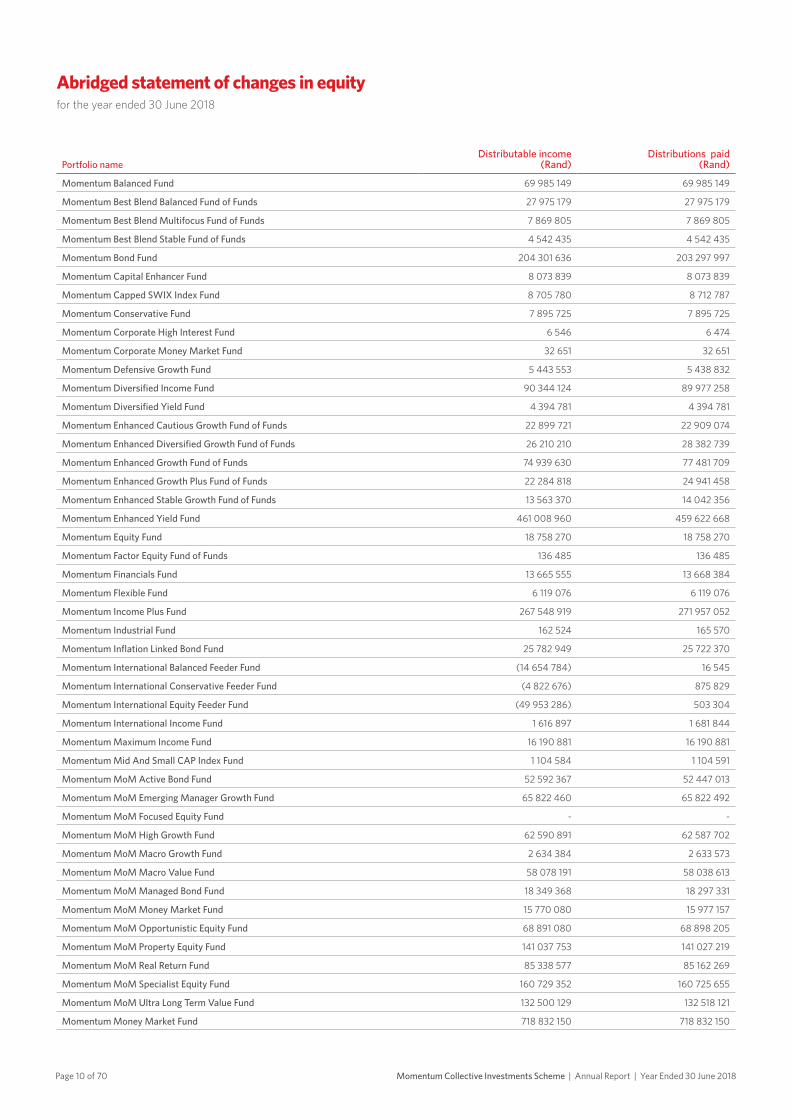
Portfolio nameDistributable income
(Rand)Distributions paid
(Rand)
Momentum Balanced Fund 69 985 149 69 985 149
Momentum Best Blend Balanced Fund of Funds 27 975 179 27 975 179
Momentum Best Blend Multifocus Fund of Funds 7 869 805 7 869 805
Momentum Best Blend Stable Fund of Funds 4 542 435 4 542 435
Momentum Bond Fund 204 301 636 203 297 997
Momentum Capital Enhancer Fund 8 073 839 8 073 839
Momentum Capped SWIX Index Fund 8 705 780 8 712 787
Momentum Conservative Fund 7 895 725 7 895 725
Momentum Corporate High Interest Fund 6 546 6 474
Momentum Corporate Money Market Fund 32 651 32 651
Momentum Defensive Growth Fund 5 443 553 5 438 832
Momentum Diversified Income Fund 90 344 124 89 977 258
Momentum Diversified Yield Fund 4 394 781 4 394 781
Momentum Enhanced Cautious Growth Fund of Funds 22 899 721 22 909 074
Momentum Enhanced Diversified Growth Fund of Funds 26 210 210 28 382 739
Momentum Enhanced Growth Fund of Funds 74 939 630 77 481 709
Momentum Enhanced Growth Plus Fund of Funds 22 284 818 24 941 458
Momentum Enhanced Stable Growth Fund of Funds 13 563 370 14 042 356
Momentum Enhanced Yield Fund 461 008 960 459 622 668
Momentum Equity Fund 18 758 270 18 758 270
Momentum Factor Equity Fund of Funds 136 485 136 485
Momentum Financials Fund 13 665 555 13 668 384
Momentum Flexible Fund 6 119 076 6 119 076
Momentum Income Plus Fund 267 548 919 271 957 052
Momentum Industrial Fund 162 524 165 570
Momentum Inflation Linked Bond Fund 25 782 949 25 722 370
Momentum International Balanced Feeder Fund (14 654 784) 16 545
Momentum International Conservative Feeder Fund (4 822 676) 875 829
Momentum International Equity Feeder Fund (49 953 286) 503 304
Momentum International Income Fund 1 616 897 1 681 844
Momentum Maximum Income Fund 16 190 881 16 190 881
Momentum Mid And Small CAP Index Fund 1 104 584 1 104 591
Momentum MoM Active Bond Fund 52 592 367 52 447 013
Momentum MoM Emerging Manager Growth Fund 65 822 460 65 822 492
Momentum MoM Focused Equity Fund - -
Momentum MoM High Growth Fund 62 590 891 62 587 702
Momentum MoM Macro Growth Fund 2 634 384 2 633 573
Momentum MoM Macro Value Fund 58 078 191 58 038 613
Momentum MoM Managed Bond Fund 18 349 368 18 297 331
Momentum MoM Money Market Fund 15 770 080 15 977 157
Momentum MoM Opportunistic Equity Fund 68 891 080 68 898 205
Momentum MoM Property Equity Fund 141 037 753 141 027 219
Momentum MoM Real Return Fund 85 338 577 85 162 269
Momentum MoM Specialist Equity Fund 160 729 352 160 725 655
Momentum MoM Ultra Long Term Value Fund 132 500 129 132 518 121
Momentum Money Market Fund 718 832 150 718 832 150
Abridged statement of changes in equityfor the year ended 30 June 2018
Page 11 of 70Momentum Collective Investments Scheme | Annual Report | Year Ended 30 June 2018
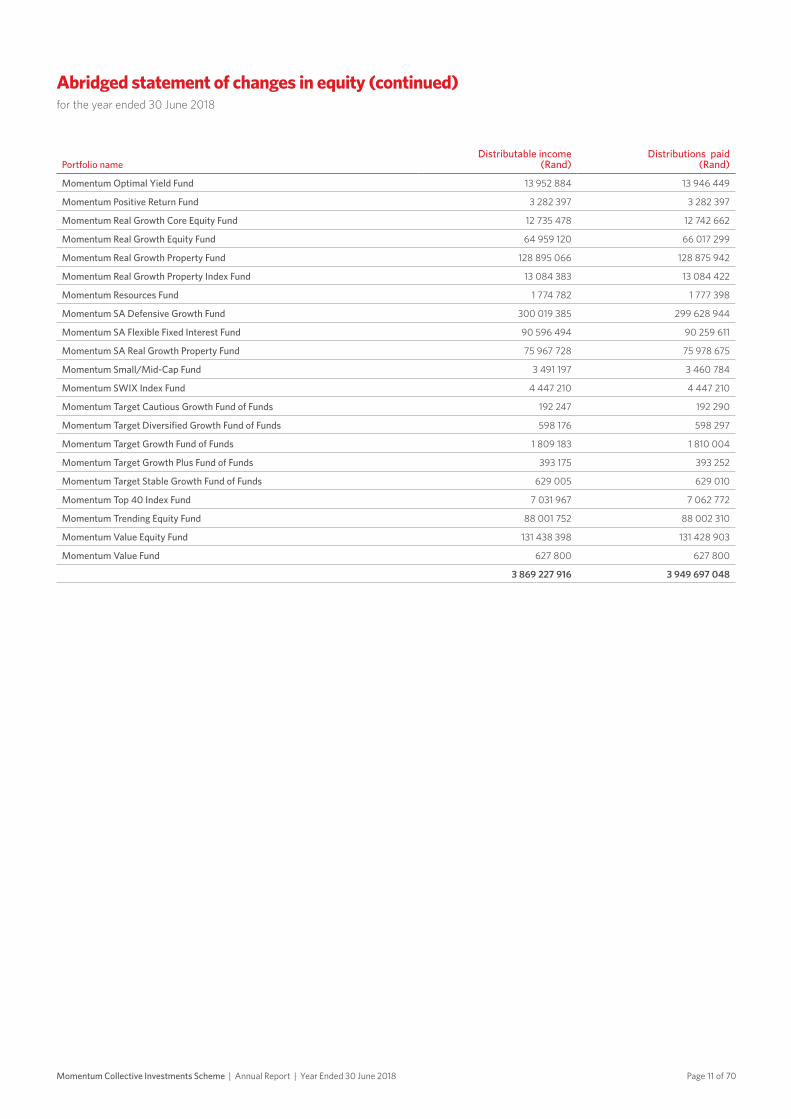
Portfolio nameDistributable income
(Rand)Distributions paid
(Rand)
Momentum Optimal Yield Fund 13 952 884 13 946 449
Momentum Positive Return Fund 3 282 397 3 282 397
Momentum Real Growth Core Equity Fund 12 735 478 12 742 662
Momentum Real Growth Equity Fund 64 959 120 66 017 299
Momentum Real Growth Property Fund 128 895 066 128 875 942
Momentum Real Growth Property Index Fund 13 084 383 13 084 422
Momentum Resources Fund 1 774 782 1 777 398
Momentum SA Defensive Growth Fund 300 019 385 299 628 944
Momentum SA Flexible Fixed Interest Fund 90 596 494 90 259 611
Momentum SA Real Growth Property Fund 75 967 728 75 978 675
Momentum Small/Mid-Cap Fund 3 491 197 3 460 784
Momentum SWIX Index Fund 4 447 210 4 447 210
Momentum Target Cautious Growth Fund of Funds 192 247 192 290
Momentum Target Diversified Growth Fund of Funds 598 176 598 297
Momentum Target Growth Fund of Funds 1 809 183 1 810 004
Momentum Target Growth Plus Fund of Funds 393 175 393 252
Momentum Target Stable Growth Fund of Funds 629 005 629 010
Momentum Top 40 Index Fund 7 031 967 7 062 772
Momentum Trending Equity Fund 88 001 752 88 002 310
Momentum Value Equity Fund 131 438 398 131 428 903
Momentum Value Fund 627 800 627 800
3 869 227 916 3 949 697 048
Abridged statement of changes in equity (continued)for the year ended 30 June 2018

Page 12 of 70 Momentum Collective Investments Scheme | Annual Report | Year Ended 30 June 2018
Investment performance (%)
One year toJun-17
Benchmark to Jun-17
One year toJun-18
Benchmark to Jun-18
Momentum Bond Fund 7.12 7.93 10.40 10.19
Momentum Capped SWIX Index Fund N/A N/A N/A N/A
Momentum Corporate High Interest Fund N/A N/A N/A N/A
Momentum Corporate Money Market Fund N/A N/A N/A N/A
Momentum Defensive Growth Fund N/A N/A N/A N/A
Momentum Diversified Income Fund 8.13 9.30 8.34 8.35
Momentum Enhanced Cautious Growth Fund of Funds 2.92 8.49 5.65 6.80
Momentum Enhanced Diversified Growth Fund of Funds 1.75 10.49 6.56 8.80
Momentum Enhanced Growth Fund of Funds N/A N/A 6.27 9.38
Momentum Enhanced Growth Plus Fund of Funds 1.66 12.50 7.06 10.80
Momentum Enhanced Stable Growth Fund of Funds N/A N/A 6.27 7.38
Momentum Enhanced Yield Fund 8.98 8.06 8.24 7.85
Momentum Financials Fund 2.71 2.63 19.08 10.51
Momentum Income Plus Fund 8.98 10.63 9.26 10.35
Momentum Industrial Fund -0.30 1.74 -2.26 7.52
Momentum Inflation Linked Bond Fund 1.74 2.57 0.97 1.57
Momentum International Balanced Feeder Fund 3.03 -0.17 11.17 12.83
Momentum International Conservative Feeder Fund -3.86 -6.80 5.71 9.21
Momentum International Equity Feeder Fund 9.57 6.84 15.48 16.44
Momentum International Income Fund -11.84 -10.20 5.73 6.64
Momentum Mid & Small Cap Index Fund N/A N/A N/A N/A
Momentum MoM Active Bond Fund 8.70 7.93 10.46 10.19
Momentum MoM Emerging Manager Growth Fund -2.68 0.28 13.77 11.68
Momentum MoM High Growth Fund 2.74 0.28 13.43 11.68
Momentum MoM Macro Growth Fund -2.32 0.28 12.11 11.68
Momentum MoM Macro Value Fund 0.84 0.28 -0.61 11.68
Momentum MoM Managed Bond Fund 9.07 7.93 10.66 10.19
Momentum MoM Money Market Fund 8.85 7.25 8.04 6.99
Momentum MoM Opportunistic Equity Fund N/A N/A 5.26 11.68
Momentum MoM Property Equity Fund 4.92 2.82 -7.43 -9.94
Momentum MoM Real Return Fund 4.16 8.49 8.37 7.38
Momentum MoM Specialist Equity Fund 0.91 0.28 6.43 11.68
Momentum MoM Ultra Long Term Value Fund 3.83 0.28 17.18 11.68
Momentum Money Market Fund 7.64 7.63 7.46 7.33
Momentum Optimal Yield Fund 5.25 6.97 9.12 6.70
Momentum Real Growth Core Equity Fund N/A N/A 12.13 11.68
Momentum Real Growth Equity Fund 1.68 0.28 10.27 11.68
Momentum Real Growth Property Fund 1.25 2.82 -10.51 -9.94
Momentum Real Growth Property Index Fund N/A N/A -10.63 -9.94
Momentum Resources Fund 2.97 1.89 28.80 42.13
Momentum SA Defensive Growth Fund N/A N/A 6.53 6.89
Momentum SA Flexible Fixed Interest Fund N/A N/A 9.15 8.94
Momentum SA Real Growth Property Fund N/A N/A -10.89 -9.94
Momentum Small/Mid-Cap Fund 11.17 0.28 7.19 11.68
Momentum Target Cautious Growth Fund of Funds N/A N/A 6.17 6.38
Momentum Target Diversified Growth Fund of Funds N/A N/A 9.14 8.38
Momentum Target Growth Fund of Funds N/A N/A 9.64 9.38
Momentum Target Growth Plus Fund of Funds N/A N/A 9.25 10.38
Momentum Target Stable Growth Fund of Funds N/A N/A 7.60 7.38
Momentum Top 40 Index Fund 0.03 1.56 15.24 16.75
Momentum Trending Equity Fund N/A N/A 16.44 8.17
Momentum Value Equity Fund N/A N/A 17.56 7.91
Collective investment portfolios under managementInvestment performance (%)

Page 13 of 70 Momentum Collective Investments Scheme | Annual Report | Year Ended 30 June 2018
Portfolio name Jun 2018
May 2018
Apr 2018
Mar 2018
Feb 2018
Jan 2018
Dec 2017
Nov 2017
Oct 2017
Sept 2017
Aug 2017
Jul 2017
Momentum Balanced Fund (A) - - - - - - - 9.402 - - - -
Momentum Balanced Fund (B1) - - - - - - - 6.532 - - - -
Momentum Balanced Fund (B2) - - - - - - - 9.500 - - - -
Momentum Balanced Fund (B3) - - - - - - - 13.268 - - - -
Momentum Balanced Fund (B4) - - - - - - - 15.006 - - - -
Momentum Balanced Fund (B5) - - - - - - - 8.829 - - - -
Momentum Balanced Fund (B8) - - - - - - - 9.786 - - - -
Momentum Balanced Fund (B9) - - - - - - - 13.638 - - - -
Momentum Balanced Fund (B11) - - - - - - - 13.635 - - - -
Momentum Balanced Fund (B12) - - - - - - - 13.631 - - - -
Momentum Balanced Fund (C1) - - - - - - - 13.631 - - - -
Momentum Balanced Fund (R) - - - - - - - 9.787 - - - -
Momentum Best Blend BalancedFund of Funds (B1) - - - - - - - 33.443 - 40.555 - -
Momentum Best Blend BalancedFund of Funds (B2) - - - - - - - 30.585 - 36.182 - -
Momentum Best Blend BalancedFund of Funds (B3) - - - - - - - 41.912 - 54.261 - -
Momentum Best Blend BalancedFund of Funds (B4) - - - - - - - 22.948 - 20.559 - -
Momentum Best Blend BalancedFund of Funds (B6) - - - - - - - 42.564 - 54.810 - -
Momentum Best Blend BalancedFund of Funds (C1) - - - - - - - 37.051 - 46.238 - -
Momentum Best Blend MultifocusFund of Funds (A) - - - - - - - 33.663 - - - -
Momentum Best Blend MultifocusFund of Funds (B1) - - - - - - - 48.923 - - - -
Momentum Best Blend StableFund of Funds (B1) - - - - - - - - 33.909 29.742 - -
Momentum Best Blend StableFund of Funds (B2) - - - - - - - - 33.213 25.427 - -
Momentum Best Blend StableFund of Funds (B3) - - - - - - - - 35.154 37.209 - -
Momentum Best Blend StableFund of Funds (B4) - - - - - - - - 32.419 20.524 - -
Momentum Best Blend StableFund of Funds (B6) - - - - - - - - 35.163 37.501 - -
Momentum Best Blend StableFund of Funds (C1) - - - - - - - - 34.247 32.679 - -
Momentum Bond Fund (A) 3.246 - - 3.163 - - 3.146 - - 3.331 - -
Momentum Bond Fund (B1) 2.611 - - 2.544 - - 2.577 - - 2.723 - -
Momentum Bond Fund (B2) 3.012 - - 2.934 - - 2.949 - - 3.104 - -
Momentum Bond Fund (B3) 3.083 - - 3.003 - - 3.015 - - 3.172 - -
Momentum Bond Fund (B4) 3.599 - - 3.505 - - 3.509 - - 3.667 - -
Momentum Bond Fund (B7) 3.248 - - 3.162 - - 3.168 - - 3.326 - -
Momentum Bond Fund (B9) 3.623 - - 3.503 - - 3.497 - - 3.664 - -
Momentum Bond Fund (B10) 3.499 - - 3.410 - - 3.399 - - 3.459 - -
Momentum Bond Fund (C1) 3.365 - - 3.275 - - 3.276 - - 3.438 - -
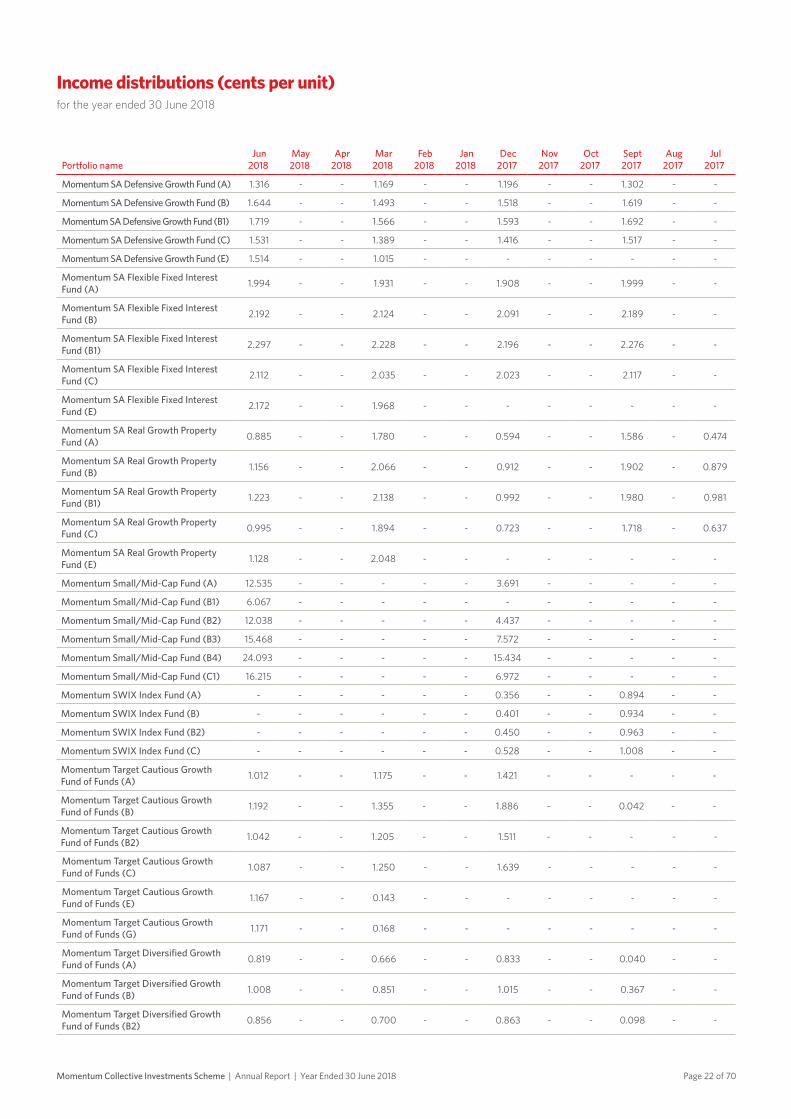
Income distributions (cents per unit)for the year ended 30 June 2018

Page 14 of 70Momentum Collective Investments Scheme | Annual Report | Year Ended 30 June 2018
Portfolio name Jun 2018
May 2018
Apr 2018
Mar 2018
Feb 2018
Jan 2018
Dec 2017
Nov 2017
Oct 2017
Sept 2017
Aug 2017
Jul 2017
Momentum Bond Fund (E) 3.426 - - 3.102 - - - - - - - -
Momentum Bond Fund (G) 3.426 - - 3.102 - - - - - - - -
Momentum Capital Enhancer Fund (A) - 1.028 - 1.932 - - 1.422 - - 2.164 - -
Momentum Capital Enhancer Fund (B2) - 0.972 - 1.791 - - 1.279 - - 2.026 - -
Momentum Capital Enhancer Fund (B3) - 1.028 - 1.932 - - 1.422 - - 2.166 - -
Momentum Capital Enhancer Fund (B4) - 1.307 - 2.640 - - 2.140 - - 2.857 - -
Momentum Capital Enhancer Fund (B6) - 1.308 - 2.641 - - 2.142 - - 2.858 - -
Momentum Capital Enhancer Fund (B7) - 0.783 - 1.311 - - 0.792 - - 1.557 - -
Momentum Capital Enhancer Fund (C1) - 1.095 - 2.102 - - 1.595 - - 2.330 - -
Momentum Capped SWIX Index Fund (A) 0.814 - - 0.824 - - - - - - - -
Momentum Capped SWIX Index Fund (A1) 0.903 - - 0.879 - - - - - - - -
Momentum Capped SWIX Index Fund (A2) 0.933 - - 0.898 - - - - - - - -
Momentum Capped SWIX Index Fund (C) 0.860 - - 0.852 - - - - - - - -
Momentum Conservative Fund (A) - - - - - - - - 0.407 2.082 - -
Momentum Conservative Fund (B1) - - - - - - - - 0.367 1.982 - -
Momentum Conservative Fund (B2) - - - - - - - - 0.386 1.944 - -
Momentum Conservative Fund (B3) - - - - - - - - 0.314 1.478 - -
Momentum Conservative Fund (B4) - - - - - - - - 0.427 2.213 - -
Momentum Conservative Fund (B6) - - - - - - - - 0.512 2.765 - -
Momentum Conservative Fund (C1) - - - - - - - - 0.441 2.302 - -
Momentum Corporate High Interest Fund (A) 0.035 0.048 0.057 0.039 0.072 0.078 0.046 - - - - -
Momentum Corporate High Interest Fund (A1) 0.065 0.078 0.084 0.064 0.099 0.104 0.044 - - - - -
Momentum Corporate High Interest Fund (A2) 0.074 0.088 0.095 0.073 0.107 0.114 0.044 - - - - -
Momentum Corporate High Interest Fund (A3) 0.083 0.098 0.106 0.083 0.116 0.124 0.045 - - - - -
Momentum Corporate High Interest Fund (C) 0.060 0.073 0.079 0.059 0.094 0.099 0.044 - - - - -
Momentum Corporate Money Market Fund (A) 0.416 0.433 0.422 0.465 0.438 0.488 0.296 - - - - -
Momentum Corporate Money Market Fund (B) 0.449 0.467 0.455 0.489 0.461 0.514 0.312 - - - - -
Momentum Corporate Money Market Fund (C) 0.458 0.477 0.465 0.498 0.470 0.524 0.318 - - - - -
Momentum Corporate Money Market Fund (D) 0.467 0.486 0.473 0.509 0.479 0.534 0.324 - - - - -
Momentum Corporate Money Market Fund (E) 0.444 0.462 0.450 0.484 0.457 0.509 0.309 - - - - -
Momentum Defensive Growth Fund (A) 1.013 - - 0.982 - - 0.459 - - - - -
Momentum Defensive Growth Fund (B) 1.338 - - 1.294 - - 0.736 - - - - -
Momentum Defensive Growth Fund (B1) 1.410 - - 1.363 - - 0.819 - - - - -
Momentum Defensive Growth Fund (C) 1.132 - - 1.078 - - 0.567 - - - - -
Momentum Defensive Growth Fund (E) 1.206 - - 0.860 - - - - - - - -
Momentum Diversified Income Fund (B1) 26.416 - - 27.072 - - 10.243 13.209 - 28.065 - -
Momentum Diversified Income Fund (B2) 25.101 - - 25.817 - - 9.493 12.522 - 26.781 - -
Momentum Diversified Income Fund (B3) 30.757 - - 31.282 - - 12.772 15.492 - 32.319 - -
Income distributions (cents per unit)for the year ended 30 June 2018
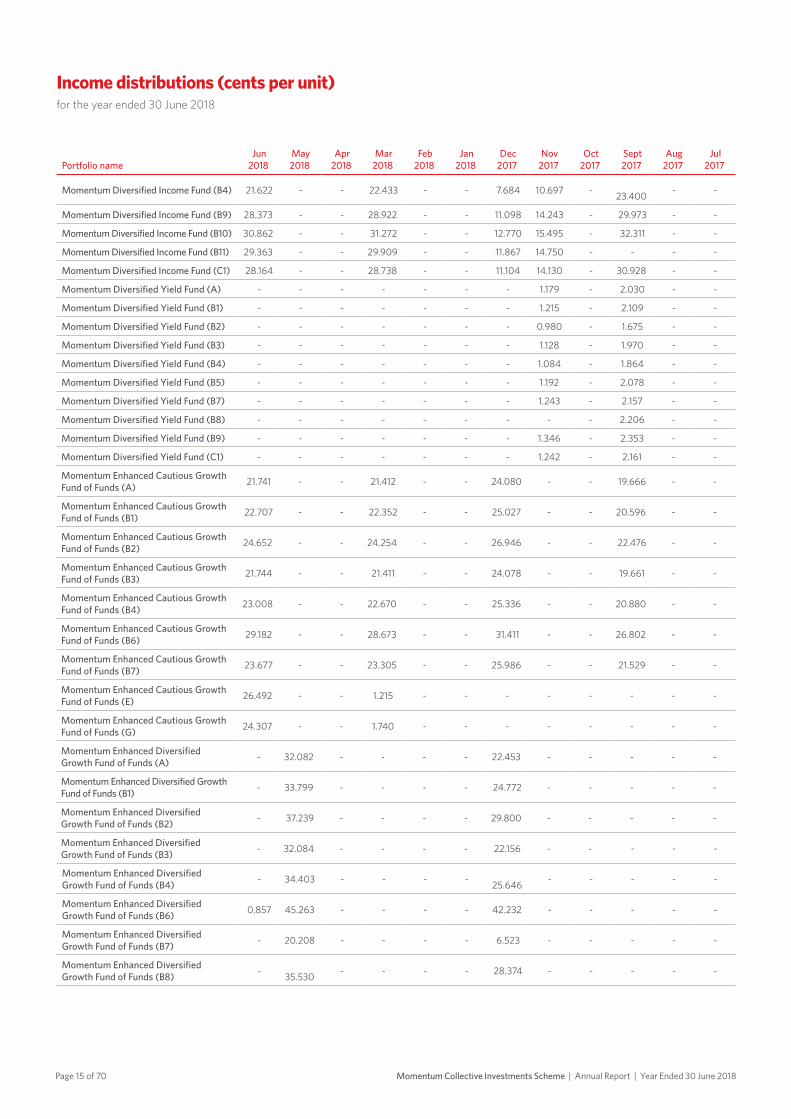
Page 15 of 70 Momentum Collective Investments Scheme | Annual Report | Year Ended 30 June 2018
Portfolio name Jun 2018
May 2018
Apr 2018
Mar 2018
Feb 2018
Jan 2018
Dec 2017
Nov 2017
Oct 2017
Sept 2017
Aug 2017
Jul 2017
Momentum Diversified Income Fund (B4) 21.622 - - 22.433 - - 7.684 10.697 - 23.400 - -
Momentum Diversified Income Fund (B9) 28.373 - - 28.922 - - 11.098 14.243 - 29.973 - -
Momentum Diversified Income Fund (B10) 30.862 - - 31.272 - - 12.770 15.495 - 32.311 - -
Momentum Diversified Income Fund (B11) 29.363 - - 29.909 - - 11.867 14.750 - - - -
Momentum Diversified Income Fund (C1) 28.164 - - 28.738 - - 11.104 14.130 - 30.928 - -
Momentum Diversified Yield Fund (A) - - - - - - - 1.179 - 2.030 - -
Momentum Diversified Yield Fund (B1) - - - - - - - 1.215 - 2.109 - -
Momentum Diversified Yield Fund (B2) - - - - - - - 0.980 - 1.675 - -
Momentum Diversified Yield Fund (B3) - - - - - - - 1.128 - 1.970 - -
Momentum Diversified Yield Fund (B4) - - - - - - - 1.084 - 1.864 - -
Momentum Diversified Yield Fund (B5) - - - - - - - 1.192 - 2.078 - -
Momentum Diversified Yield Fund (B7) - - - - - - - 1.243 - 2.157 - -
Momentum Diversified Yield Fund (B8) - - - - - - - - - 2.206 - -
Momentum Diversified Yield Fund (B9) - - - - - - - 1.346 - 2.353 - -
Momentum Diversified Yield Fund (C1) - - - - - - - 1.242 - 2.161 - -
Momentum Enhanced Cautious Growth Fund of Funds (A) 21.741 - - 21.412 - - 24.080 - - 19.666 - -
Momentum Enhanced Cautious Growth Fund of Funds (B1) 22.707 - - 22.352 - - 25.027 - - 20.596 - -
Momentum Enhanced Cautious Growth Fund of Funds (B2) 24.652 - - 24.254 - - 26.946 - - 22.476 - -
Momentum Enhanced Cautious Growth Fund of Funds (B3) 21.744 - - 21.411 - - 24.078 - - 19.661 - -
Momentum Enhanced Cautious Growth Fund of Funds (B4) 23.008 - - 22.670 - - 25.336 - - 20.880 - -
Momentum Enhanced Cautious Growth Fund of Funds (B6) 29.182 - - 28.673 - - 31.411 - - 26.802 - -
Momentum Enhanced Cautious Growth Fund of Funds (B7) 23.677 - - 23.305 - - 25.986 - - 21.529 - -
Momentum Enhanced Cautious Growth Fund of Funds (E) 26.492 - - 1.215 - - - - - - - -
Momentum Enhanced Cautious Growth Fund of Funds (G) 24.307 - - 1.740 - - - - - - - -
Momentum Enhanced Diversified Growth Fund of Funds (A) - 32.082 - - - - 22.453 - - - - -
Momentum Enhanced Diversified Growth Fund of Funds (B1) - 33.799 - - - - 24.772 - - - - -
Momentum Enhanced Diversified Growth Fund of Funds (B2) - 37.239 - - - - 29.800 - - - - -
Momentum Enhanced Diversified Growth Fund of Funds (B3) - 32.084 - - - - 22.156 - - - - -
Momentum Enhanced Diversified Growth Fund of Funds (B4) - 34.403 - - - -
25.646 - - - - -
Momentum Enhanced Diversified Growth Fund of Funds (B6) 0.857 45.263 - - - - 42.232 - - - - -
Momentum Enhanced Diversified Growth Fund of Funds (B7) - 20.208 - - - - 6.523 - - - - -
Momentum Enhanced Diversified Growth Fund of Funds (B8) -
35.530 - - - - 28.374 - - - - -
Income distributions (cents per unit)for the year ended 30 June 2018
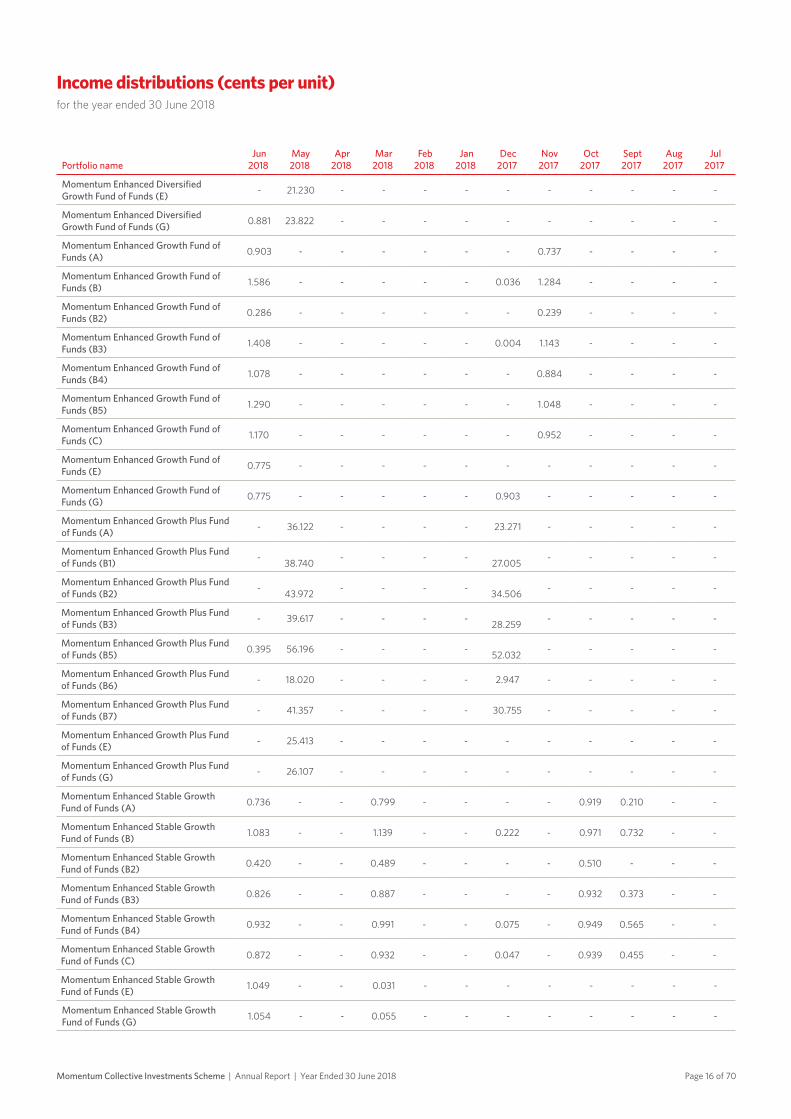
Page 16 of 70Momentum Collective Investments Scheme | Annual Report | Year Ended 30 June 2018
Portfolio name Jun 2018
May 2018
Apr 2018
Mar 2018
Feb 2018
Jan 2018
Dec 2017
Nov 2017
Oct 2017
Sept 2017
Aug 2017
Jul 2017
Momentum Enhanced Diversified Growth Fund of Funds (E) - 21.230 - - - - - - - - - -
Momentum Enhanced Diversified Growth Fund of Funds (G) 0.881 23.822 - - - - - - - - - -
Momentum Enhanced Growth Fund of Funds (A) 0.903 - - - - - - 0.737 - - - -
Momentum Enhanced Growth Fund of Funds (B) 1.586 - - - - - 0.036 1.284 - - - -
Momentum Enhanced Growth Fund of Funds (B2) 0.286 - - - - - - 0.239 - - - -
Momentum Enhanced Growth Fund of Funds (B3) 1.408 - - - - - 0.004 1.143 - - - -
Momentum Enhanced Growth Fund of Funds (B4) 1.078 - - - - - - 0.884 - - - -
Momentum Enhanced Growth Fund of Funds (B5) 1.290 - - - - - - 1.048 - - - -
Momentum Enhanced Growth Fund of Funds (C) 1.170 - - - - - - 0.952 - - - -
Momentum Enhanced Growth Fund of Funds (E) 0.775 - - - - - - - - - - -
Momentum Enhanced Growth Fund of Funds (G) 0.775 - - - - - 0.903 - - - - -
Momentum Enhanced Growth Plus Fund of Funds (A) - 36.122 - - - - 23.271 - - - - -
Momentum Enhanced Growth Plus Fund of Funds (B1) -
38.740 - - - - 27.005 - - - - -
Momentum Enhanced Growth Plus Fund of Funds (B2) -
43.972 - - - - 34.506 - - - - -
Momentum Enhanced Growth Plus Fund of Funds (B3) - 39.617 - - - -
28.259 - - - - -
Momentum Enhanced Growth Plus Fund of Funds (B5) 0.395 56.196 - - - -
52.032 - - - - -
Momentum Enhanced Growth Plus Fund of Funds (B6) - 18.020 - - - - 2.947 - - - - -
Momentum Enhanced Growth Plus Fund of Funds (B7) - 41.357 - - - - 30.755 - - - - -
Momentum Enhanced Growth Plus Fund of Funds (E) - 25.413 - - - - - - - - - -
Momentum Enhanced Growth Plus Fund of Funds (G) - 26.107 - - - - - - - - - -
Momentum Enhanced Stable Growth Fund of Funds (A) 0.736 - - 0.799 - - - - 0.919 0.210 - -
Momentum Enhanced Stable Growth Fund of Funds (B) 1.083 - - 1.139 - - 0.222 - 0.971 0.732 - -
Momentum Enhanced Stable Growth Fund of Funds (B2) 0.420 - - 0.489 - - - - 0.510 - - -
Momentum Enhanced Stable Growth Fund of Funds (B3) 0.826 - - 0.887 - - - - 0.932 0.373 - -
Momentum Enhanced Stable Growth Fund of Funds (B4) 0.932 - - 0.991 - - 0.075 - 0.949 0.565 - -
Momentum Enhanced Stable Growth Fund of Funds (C) 0.872 - - 0.932 - - 0.047 - 0.939 0.455 - -
Momentum Enhanced Stable Growth Fund of Funds (E) 1.049 - - 0.031 - - - - - - - -
Momentum Enhanced Stable Growth Fund of Funds (G) 1.054 - - 0.055 - - - - - - - -
Income distributions (cents per unit)for the year ended 30 June 2018

Page 17 of 70 Momentum Collective Investments Scheme | Annual Report | Year Ended 30 June 2018
Portfolio name Jun 2018
May 2018
Apr 2018
Mar 2018
Feb 2018
Jan 2018
Dec 2017
Nov 2017
Oct 2017
Sept 2017
Aug 2017
Jul 2017
Momentum Enhanced Yield Fund (A) 0.551 0.597 0.637 0.566 0.546 0.644 0.561 0.587 0.619 0.556 0.595 0.610
Momentum Enhanced Yield Fund (B1) 0.543 0.588 0.628 0.558 0.538 0.636 0.553 0.579 0.609 0.548 0.586 0.603
Momentum Enhanced Yield Fund (B2) 0.576 0.623 0.664 0.590 0.569 0.672 0.585 0.609 0.644 0.580 0.620 0.635
Momentum Enhanced Yield Fund (B3) 0.551 0.597 0.637 0.566 0.546 0.645 0.561 0.591 0.615 0.556 0.594 0.642
Momentum Enhanced Yield Fund (B4) 0.577 0.623 0.663 0.590 0.570 0.672 0.586 0.612 0.646 0.581 0.621 0.637
Momentum Enhanced Yield Fund (B5) 0.559 0.605 0.646 0.573 0.553 0.654 0.569 0.595 0.627 0.564 0.604 0.618
Momentum Enhanced Yield Fund (B6) 0.592 0.640 0.682 0.606 0.585 0.690 0.601 0.628 0.663 0.599 0.638 0.654
Momentum Enhanced Yield Fund (B7) 0.571 0.618 0.659 0.585 0.565 0.667 0.582 0.607 0.641 0.576 0.616 0.632
Momentum Enhanced Yield Fund (B8) 0.499 0.540 0.578 0.513 0.495 0.585 0.509 0.532 0.560 0.504 0.539 0.490
Momentum Enhanced Yield Fund (E) 0.571 0.601 0.660 0.586 0.565 0.543 - - - - - -
Momentum Equity Fund (A) - - - - - - - - - 27.248 - -
Momentum Equity Fund (B1) - - - - - - - - - 16.298 - -
Momentum Equity Fund (B2) - - - - - - - - - 22.090 - -
Momentum Equity Fund (B3) - - - - - - - - - 29.263 - -
Momentum Equity Fund (B4) - - - - - - - - - 39.760 - -
Momentum Equity Fund (B5) - - - - - - - - - 24.801 - -
Momentum Equity Fund (B7) - - - - - - - - - 27.367 - -
Momentum Equity Fund (B8) - - - - - - - - - 29.937 - -
Momentum Equity Fund (B9) - - - - - - - - - 40.254 - -
Momentum Equity Fund (B10) - - - - - - - - - 40.275 - -
Momentum Equity Fund (B11) - - - - - - - - - 40.277 - -
Momentum Equity Fund (C1) - - - - - - - - - 37.072 - -
Momentum Equity Fund (R) - - - - - - - - - 29.936 - -
Momentum Factor Equity Fund of Funds (A) - - - - - - - - - 0.532 - -
Momentum Factor Equity Fund of Funds (B1) - - - - - - - - - 0.700 - -
Momentum Factor Equity Fund of Funds (B2) - - - - - - - - - 0.775 - -
Momentum Factor Equity Fund of Funds (B3) - - - - - - - - - 0.722 - -
Momentum Factor Equity Fund of Funds (B5) - - - - - - - - - 1.365 - -
Momentum Financials Fund (A) 9.080 - - - - - 9.968 - - - - -
Momentum Financials Fund (B1) 5.049 - - - - - 6.447 - - - - -
Momentum Financials Fund (B2) 9.079 - - - - - 9.968 - - - - -
Momentum Financials Fund (B3) 10.000 - - - - - 10.765 - - - - -
Momentum Financials Fund (B4) 13.709 - - - - - 13.990 - - - - -
Momentum Flexible Fund (A) - 4.483 - - - - 8.119 - - - - -
Momentum Flexible Fund (B1) - 2.206 - - - - 3.801 - - - - -
Momentum Flexible Fund (B3) - 4.772 - - - - 9.256 - - - - -
Momentum Flexible Fund (B4) - 7.381 - - - - 12.941 - - - - -
Momentum Flexible Fund (B5) - 5.082 - - - - 9.318 - - - - -
Momentum Flexible Fund (B7) - 5.174 - - - - 8.126 - - - - -
Momentum Flexible Fund (B8) - 7.933 - - - - 12.162 - - - - -
Momentum Flexible Fund (C1) - 5.946 - - - - 9.252 - - - - -
Momentum Income Plus Fund (A) 2.491 - - 2.460 - - 2.334 - - 2.376 - -
Momentum Income Plus Fund (B1) 2.329 - - 2.302 - - 2.173 - - 2.220 - -
Income distributions (cents per unit)for the year ended 30 June 2018

Page 18 of 70Momentum Collective Investments Scheme | Annual Report | Year Ended 30 June 2018
Portfolio name Jun 2018
May 2018
Apr 2018
Mar 2018
Feb 2018
Jan 2018
Dec 2017
Nov 2017
Oct 2017
Sept 2017
Aug 2017
Jul 2017
Momentum Income Plus Fund (B3) 2.817 - - 2.772 - - 2.652 - - 2.697 - -
Momentum Income Plus Fund (B4) 2.133 - - 2.116 - - 1.983 - - 2.030 - -
Momentum Income Plus Fund (B5) 2.542 - - 2.506 - - 2.380 - - 2.435 - -
Momentum Income Plus Fund (B6) 2.576 - - 2.537 - - 2.411 - - 2.458 - -
Momentum Income Plus Fund (B8) 2.556 - - 2.521 - - 2.397 - - 2.444 - -
Momentum Income Plus Fund (C1) 2.621 - - 2.587 - - 2.458 - - 2.504 - -
Momentum Industrial Fund (A) 1.736 - - - - - 0.700 - - - - -
Momentum Industrial Fund (B1) 3.344 - - - - - 2.406 - - - - -
Momentum Industrial Fund (B2) 11.644 - - - - - 10.961 - - - - -
Momentum Inflation Linked Bond Fund (A) 1.746 - - - - - 1.887 - - - - -
Momentum Inflation Linked Bond Fund (B1) 2.662 - - - - - 2.788 - - - - -
Momentum Inflation Linked Bond Fund (B2) 1.967 - - - - - 2.201 - - - - -
Momentum Inflation Linked Bond Fund (B3) 2.478 - - - - - 2.604 - - - - -
Momentum Inflation Linked Bond Fund (E) 2.442 - - - - - - - - - - -
Momentum International Balanced Feeder Fund( A) - - - - - - - - - - - -
Momentum International Balanced Feeder Fund (B1) - - - - - - - - - - - -
Momentum International Balanced Feeder Fund (B2) - - - - - - - - - - - -
Momentum International Balanced Feeder Fund (B3) - - - - - - - - - - - -
Momentum International Balanced Feeder Fund (B4) 0.084 - - - - - 0.017 - - - - -
Momentum International Balanced Feeder Fund (B5) - - - - - - - - - - - -
Momentum International Balanced Feeder Fund (B7) - - - - - - - - - - - -
Momentum International Balanced Feeder Fund (C1) 0.084 - - - - - - - - - - -
Momentum International Balanced Feeder Fund (M1) - - - - - - 0.013 - - - - -
Momentum International Conservative Feeder Funds (A) - - - - - - - - - - - -
Momentum International Conservative Feeder Funds (B1) - - - - - - - - - - - -
Momentum International Conservative Feeder Funds (B2) - - - - - - - - - - - -
Momentum International Conservative Feeder Funds (B3) - - - - - - - - - - - -
Momentum International Conservative Feeder Funds (B4) 0.293 - - - - - 0.408 - - - - -
Momentum International Conservative Feeder Funds (C1) - - - - - - - - - - - -
Momentum International Conservative Feeder Funds (M1) 0.292 - - - - - 0.410 - - - - -
Momentum International Equity Feeder Fund (B2) 0.140 - - - - - 0.163 - - - - -
Momentum International Equity Feeder Fund (M1) 0.136 - - - - - 0.157 - - - - -
Income distributions (cents per unit)for the year ended 30 June 2018

Page 19 of 70 Momentum Collective Investments Scheme | Annual Report | Year Ended 30 June 2018
Portfolio name Jun 2018
May 2018
Apr 2018
Mar 2018
Feb 2018
Jan 2018
Dec 2017
Nov 2017
Oct 2017
Sept 2017
Aug 2017
Jul 2017
Momentum International Income Fund (A) 0.652 - - 0.200 - - 0.368 - - 0.323 - -
Momentum International Income Fund (B1) 0.068 - - - - - - - - - - -
Momentum International Income Fund (B2) 0.556 - - 0.115 - - - - - - - -
Momentum International Income Fund (B3) 0.571 - - 0.127 - - - - - - - -
Momentum International Income Fund (B4) 0.923 - - 0.456 - - 0.657 - - 0.877 - -
Momentum International Income Fund (B5) 0.253 - - - - - - - - - - -
Momentum International Income Fund (B6) 0.460 - - 0.028 - - - - - - - -
Momentum International Income Fund (B7) 0.777 - - 0.319 - - 0.504 - - 0.731 - -
Momentum International Income Fund (C1) 0.777 - - 0.320 - - 0.505 - - 0.729 - -
Momentum Maximum Income Fund (A) - - - - - - - 0.313 0.705 0.623 0.677 0.692
Momentum Maximum Income Fund (B1) - - - - - - - 0.247 0.581 0.509 0.556 0.573
Momentum Maximum Income Fund (B2) - - - - - - - 0.296 0.673 0.593 0.645 0.662
Momentum Maximum Income Fund (B3) - - - - - - - 0.278 0.640 0.564 0.614 0.630
Momentum Maximum Income Fund (B4) - - - - - - - 0.353 0.782 0.684 0.750 0.767
Momentum Maximum Income Fund (B5) - - - - - - - 0.313 0.705 0.623 0.677 0.693
Momentum Maximum Income Fund (B7) - - - - - - - 0.307 0.787 0.613 0.666 0.684
Momentum Maximum Income Fund (B8) - - - - - - - 0.356 0.695 0.697 0.756 0.773
Momentum Maximum Income Fund (B9) - - - - - - - 0.302 0.686 0.606 0.658 0.674
Momentum Maximum Income Fund (B10) - - - - - - - 0.356 0.787 0.697 0.755 0.772
Momentum Maximum Income Fund (C1) - - - - - - - 0.336 0.750 0.662 0.717 0.735
Momentum Mid and Small CapIndex Fund (A) 0.911 - - 1.358 - - 0.792 - - - - -
Momentum Mid and Small CapIndex Fund (B) 0.965 - - 1.442 - - 0.894 - - - - -
Momentum Mid and Small CapIndex Fund (B1) 1.036 - - 1.517 - - 1.004 - - - - -
Momentum Mid and Small CapIndex Fund (C) 1.009 - - 1.487 - - 0.959 - - - - -
Momentum Mid and Small CapIndex Fund (E) 0.964 - - 1.390 - - - - - - - -
Momentum Mid and Small CapIndex Fund (G) 0.964 - - 1.390 - - - - - - - -
Momentum MoM Active Bond Fund (B1) 3.800 - - 3.429 - - 3.580 - - 3.659 - -
Momentum MoM Active Bond Fund (B2) 3.805 - - 3.427 - - 3.575 - - 3.481 - -
Momentum MoM Emerging Manager Growth Fund (B1) 4.595 - - - - - 3.726 - - - - -
Momentum MoM Emerging Manager Growth Fund (F1) 4.204 - - - - - 3.360 - - - - -
Momentum MoM Emerging Manager Growth Ringfenced Fund (A) - - - - - - 3.768 - - - - -
Momentum MoM Focused Equity Fund (B1) - - - - - - - - - - - -
Momentum MoM Focused Equity Fund (B4) - - - - - - - - - - - -
Momentum MoM High Growth Fund (B1) 4.742 - - - - - 3.428 - - - - -
Momentum MoM High Growth Fund (B4) 3.514 - - - - - 0.887 - - - - -
Momentum MoM High Growth Fund (F1) 4.053 - - - - - 2.783 - - - - -
Momentum MoM Macro Growth Fund (B1) 3.262 - - - - - 2.574 - - - - -
Momentum MoM Macro Value Fund (B1) 2.974 - - - - - 3.754 - - - - -
Income distributions (cents per unit)for the year ended 30 June 2018

Page 20 of 70Momentum Collective Investments Scheme | Annual Report | Year Ended 30 June 2018
Portfolio name Jun 2018
May 2018
Apr 2018
Mar 2018
Feb 2018
Jan 2018
Dec 2017
Nov 2017
Oct 2017
Sept 2017
Aug 2017
Jul 2017
Momentum MoM Managed Bond Fund (B1) 3.244 - - 3.163 - - 3.182 - - 3.188 - -
Momentum MoM Money Market Fund (B1) 0.608 0.668 0.648 0.667 0.612 0.704 0.653 0.626 0.660 0.619 0.664 0.683
Momentum MoM Money Market Fund (B4) 0.545 0.447 118.573 0.659 0.603 0.646 0.651 0.625 0.640 0.559 0.662 0.697
Momentum MoM Opportunistic Equity Fund (A) 1.705 - - - - - 1.811 - - - - -
Momentum MoM Opportunistic Equity Fund (B) 1.681 - - - - - 1.753 - - - - -
Momentum MoM Opportunistic Equity Fund (C) 1.643 - - - - - 1.682 - - - - -
Momentum MoM Opportunistic Equity Fund (D) 1.939 - - - - - 2.107 - - - - -
Momentum MoM Opportunistic Equity Fund (E) 1.695 - - - - - - - - - - -
Momentum MoM Property Equity Fund (B1) 7.327 - - - - - 6.354 - - - - -
Momentum MoM Property Equity Fund (B4) 6.496 - - - - - 5.476 - - - - -
Momentum MoM Property Equity Fund (F1) - - - - - - - - - - - -
Momentum MoM Real Return Fund (A) 7.306 - - - - - 7.677 - - - - -
Momentum MoM Real Return Fund (B1) 7.836 - - - - - 7.137 - - - - -
Momentum MoM Real Return Fund (F1) - - - - - - - - - - - -
Momentum MoM Real Return Ring-fenced Fund (A) - - - - - - - - - - - -
Momentum MoM Specialist Equity Fund (A) 2.381 - - - - - 1.533 - - - - -
Momentum MoM Specialist Equity Fund (E) 2.269 - - - - - - - - - - -
Momentum MoM Specialist Equity Fund (F1) 2.127 - - - - - 0.763 - - - - -
Momentum MoM Ultra Long Term Value Fund (B1) 6.042 - - - - - 3.640 - - - - -
Momentum MoM Ultra Long Term Value Fund (B4) 4.980 - - - - - 2.810 - - - - -
Momentum MoM Ultra Long Term Value Fund (F1) 5.338 - - - - - 2.980 - - - - -
Momentum Money Market Fund Class A 0.582 0.609 0.603 0.632 0.557 0.610 0.608 0.586 0.605 0.613 0.637 0.638
Momentum Money Market Fund Class B3 0.592 0.626 0.613 0.633 2.612 0.616 0.599 0.601 0.608 0.593 0.602 0.563
Momentum Money Market Fund Class B4 0.535 0.574 0.558 0.590 0.773 0.581 0.570 0.474 0.566 0.558 0.591 0.596
Momentum Money Market Fund Class B5 0.692 0.675 0.721 0.694 0.621 0.708 0.660 0.641 0.704 0.627 0.724 0.665
Momentum Money Market Fund Class B6 0.743 0.775 0.684 0.833 0.602 0.708 0.859 0.527 0.870 0.649 0.631 0.659
Momentum Money Market Fund Class B7 0.584 0.612 0.608 0.620 0.612 0.664 0.613 0.580 0.622 0.620 0.651 0.660
Momentum Money Market Fund Class B8 0.587 0.621 0.608 0.628 0.568 0.624 0.618 0.597 0.620 0.616 0.641 0.647
Momentum Money Market Fund Class B9 0.594 0.616 0.624 0.635 0.589 0.640 0.629 0.643 0.607 0.650 0.698 0.658
Momentum Money Market Fund Class B10 0.622 0.624 0.825 1.098 0.601 0.658 0.652 0.653 0.620 0.693 0.629 0.652
Momentum Money Market Fund Class B11 0.611 0.646 0.633 0.653 0.591 0.587 - - - - - -
Momentum Money Market Fund Class B12 0.597 0.632 0.619 0.639 0.578 0.573 - - - - - -
Momentum Optimal Yield Fund (A) 2.054 - - - - - 2.874 - - - - -
Momentum Optimal Yield Fund (B2) 0.562 - - - - - 1.313 - - - - -
Momentum Optimal Yield Fund (B3) 1.378 - - - - - 2.167 - - - - -
Momentum Optimal Yield Fund (B4) 1.635 - - - - - 2.188 - - - - -
Momentum Optimal Yield Fund (B5) 2.721 - - - - - 3.324 - - - - -
Momentum Optimal Yield Fund (B10) 2.829 - - - - - 3.718 - - - - -
Income distributions (cents per unit)for the year ended 30 June 2018

Page 21 of 70 Momentum Collective Investments Scheme | Annual Report | Year Ended 30 June 2018
Portfolio name Jun 2018
May 2018
Apr 2018
Mar 2018
Feb 2018
Jan 2018
Dec 2017
Nov 2017
Oct 2017
Sept 2017
Aug 2017
Jul 2017
Momentum Optimal Yield Fund (B11) 1.860 - - - - - 2.672 - - - - -
Momentum Optimal Yield Fund (B12) 2.780 - - - - - 3.635 - - - - -
Momentum Optimal Yield Fund (C1) 2.346 - - - - - 3.178 - - - - -
Momentum Positive Return Fund (A) - - - - - - - - 1.874 - - -
Momentum Positive Return Fund (B1) - - - - - - - - 2.295 - - -
Momentum Real Growth Core Equity Fund (A) 1.057 - - 1.055 - - 0.726 - - 1.397 - -
Momentum Real Growth Core Equity Fund (B) 1.216 - - 1.266 - - 0.626 - - 1.543 - -
Momentum Real Growth Core Equity Fund (B2) 1.190 - - 1.241 - - 0.604 - - 1.547 - -
Momentum Real Growth Core Equity Fund (C) 1.104 - - 1.153 - - 0.521 - - 1.289 - -
Momentum Real Growth Core Equity Fund (E) 1.107 - - 1.128 - - - - - - - -
Momentum Real Growth Core Equity Fund (G) 1.107 - - 1.128 - - - - - - - -
Momentum Real Growth Equity Fund (A) 2.391 - - - - - - - - 1.346 - -
Momentum Real Growth Equity Fund (B2) 2.841 - - - - - 0.128 - - 1.539 - -
Momentum Real Growth Equity Fund (B3) 4.537 - - - - - 0.952 - - 2.274 - -
Momentum Real Growth Equity Fund (B4) 1.377 - - - - - - - - 0.913 - -
Momentum Real Growth Equity Fund (B5) 2.754 - - - - - 0.085 - - 1.505 - -
Momentum Real Growth Equity Fund (B7) 3.333 - - - - - 0.363 - - 1.750 - -
Momentum Real Growth Equity Fund (B8) 3.598 - - - - - 0.128 - - - - -
Momentum Real Growth Equity Fund (B10) 3.697 - - - - - 0.534 - - 1.927 - -
Momentum Real Growth Equity Fund (B11) 2.308 - - - - - - - - 1.343 - -
Momentum Real Growth Equity Fund (C1) 3.334 - - - - - 0.362 - - 1.749 - -
Momentum Real Growth Property Fund (A) 3.556 - - 7.253 - - 2.412 - - 6.302 - -
Momentum Real Growth Property Fund (B1) 2.635 - - 6.277 - - 1.331 - - 5.248 - -
Momentum Real Growth Property Fund (B2) 3.285 - - 6.966 - - 2.094 - - 5.993 - -
Momentum Real Growth Property Fund (B3) 3.719 - - 7.426 - - 2.604 - - 6.489 - -
Momentum Real Growth Property Fund (B4) 4.915 - - 8.696 - - 4.006 - - 7.855 - -
Momentum Real Growth Property Fund (B6) 2.957 - - 6.666 - - 1.657 - - 5.684 - -
Momentum Real Growth Property Fund (B7) 3.827 - - 7.541 - - 2.730 - - 6.613 - -
Momentum Real Growth Property Fund (B8) 4.914 - - 8.695 - - 4.005 - - 7.855 - -
Momentum Real Growth Property Fund (B10) 4.925 - - 8.705 - - 3.799 - - 7.559 - -
Momentum Real Growth Property Fund (C1) 3.995 - - 7.721 - - 2.924 - - 6.805 - -
Momentum Real Growth PropertyIndex Fund (A) 1.117 - - 2.056 - 1.038 - - - 2.173 - -
Momentum Real Growth PropertyIndex Fund (B) 1.154 - - 2.098 - 1.083 - - - 2.218 - -
Momentum Real Growth PropertyIndex Fund (B1) 1.223 - - 2.172 - 1.162 - - - 2.295 - -
Momentum Real Growth PropertyIndex Fund (C) 1.183 - - 2.130 - 1.116 - - - 2.248 - -
Momentum Real Growth PropertyIndex Fund (E) 0.966 - - 2.124 - - - - - - - -
Momentum Real Growth Property Index Fund (G) 1.168 - - 2.124 - - - - - - - -
Momentum Resources Fund (A) 16.264 - - - - - 12.932 - - - - -
Momentum Resources Fund (B1) 31.606 - - - - - 27.334 - - - - -
Income distributions (cents per unit)for the year ended 30 June 2018
Page 22 of 70Momentum Collective Investments Scheme | Annual Report | Year Ended 30 June 2018
Portfolio name Jun 2018
May 2018
Apr 2018
Mar 2018
Feb 2018
Jan 2018
Dec 2017
Nov 2017
Oct 2017
Sept 2017
Aug 2017
Jul 2017
Momentum SA Defensive Growth Fund (A) 1.316 - - 1.169 - - 1.196 - - 1.302 - -
Momentum SA Defensive Growth Fund (B) 1.644 - - 1.493 - - 1.518 - - 1.619 - -
Momentum SA Defensive Growth Fund (B1) 1.719 - - 1.566 - - 1.593 - - 1.692 - -
Momentum SA Defensive Growth Fund (C) 1.531 - - 1.389 - - 1.416 - - 1.517 - -
Momentum SA Defensive Growth Fund (E) 1.514 - - 1.015 - - - - - - - -
Momentum SA Flexible Fixed Interest Fund (A) 1.994 - - 1.931 - - 1.908 - - 1.999 - -
Momentum SA Flexible Fixed Interest Fund (B) 2.192 - - 2.124 - - 2.091 - - 2.189 - -
Momentum SA Flexible Fixed Interest Fund (B1) 2.297 - - 2.228 - - 2.196 - - 2.276 - -
Momentum SA Flexible Fixed Interest Fund (C) 2.112 - - 2.035 - - 2.023 - - 2.117 - -
Momentum SA Flexible Fixed Interest Fund (E) 2.172 - - 1.968 - - - - - - - -
Momentum SA Real Growth Property Fund (A) 0.885 - - 1.780 - - 0.594 - - 1.586 - 0.474
Momentum SA Real Growth Property Fund (B) 1.156 - - 2.066 - - 0.912 - - 1.902 - 0.879
Momentum SA Real Growth Property Fund (B1) 1.223 - - 2.138 - - 0.992 - - 1.980 - 0.981
Momentum SA Real Growth Property Fund (C) 0.995 - - 1.894 - - 0.723 - - 1.718 - 0.637
Momentum SA Real Growth Property Fund (E) 1.128 - - 2.048 - - - - - - - -
Momentum Small/Mid-Cap Fund (A) 12.535 - - - - - 3.691 - - - - -
Momentum Small/Mid-Cap Fund (B1) 6.067 - - - - - - - - - - -
Momentum Small/Mid-Cap Fund (B2) 12.038 - - - - - 4.437 - - - - -
Momentum Small/Mid-Cap Fund (B3) 15.468 - - - - - 7.572 - - - - -
Momentum Small/Mid-Cap Fund (B4) 24.093 - - - - - 15.434 - - - - -
Momentum Small/Mid-Cap Fund (C1) 16.215 - - - - - 6.972 - - - - -
Momentum SWIX Index Fund (A) - - - - - - 0.356 - - 0.894 - -
Momentum SWIX Index Fund (B) - - - - - - 0.401 - - 0.934 - -
Momentum SWIX Index Fund (B2) - - - - - - 0.450 - - 0.963 - -
Momentum SWIX Index Fund (C) - - - - - - 0.528 - - 1.008 - -
Momentum Target Cautious Growth Fund of Funds (A) 1.012 - - 1.175 - - 1.421 - - - - -
Momentum Target Cautious Growth Fund of Funds (B) 1.192 - - 1.355 - - 1.886 - - 0.042 - -
Momentum Target Cautious Growth Fund of Funds (B2) 1.042 - - 1.205 - - 1.511 - - - - -
Momentum Target Cautious Growth Fund of Funds (C) 1.087 - - 1.250 - - 1.639 - - - - -
Momentum Target Cautious Growth Fund of Funds (E) 1.167 - - 0.143 - - - - - - - -
Momentum Target Cautious Growth Fund of Funds (G) 1.171 - - 0.168 - - - - - - - -
Momentum Target Diversified Growth Fund of Funds (A) 0.819 - - 0.666 - - 0.833 - - 0.040 - -
Momentum Target Diversified Growth Fund of Funds (B) 1.008 - - 0.851 - - 1.015 - - 0.367 - -
Momentum Target Diversified Growth Fund of Funds (B2) 0.856 - - 0.700 - - 0.863 - - 0.098 - -
Income distributions (cents per unit)for the year ended 30 June 2018

Page 23 of 70 Momentum Collective Investments Scheme | Annual Report | Year Ended 30 June 2018
Portfolio name Jun 2018
May 2018
Apr 2018
Mar 2018
Feb 2018
Jan 2018
Dec 2017
Nov 2017
Oct 2017
Sept 2017
Aug 2017
Jul 2017
Momentum Target Diversified Growth Fund of Funds (C) 0.901 - - 0.745 - - 0.909 - - 0.177 - -
Momentum Target Diversified Growth Fund of Funds (E) 0.938 - - 0.007 - - - - - - - -
Momentum Target Diversified Growth Fund of Funds (G) 0.958 - - 0.032 - - - - - - - -
Momentum Target Growth Fund of Funds (A) 1.468 - - - - - 1.207 - - - - -
Momentum Target Growth Fund of Funds (B) 1.839 - - - - - 1.578 - - - - -
Momentum Target Growth Fund of Funds (B2) 1.530 - - - - - 1.280 - - - - -
Momentum Target Growth Fund of Funds (C) 1.624 - - - - - 1.369 - - - - -
Momentum Target Growth Fund of Funds (E) 1.047 - - - - - - - - - - -
Momentum Target Growth Fund of Funds (G) 1.106 - - - - - - - - - - -
Momentum Target Growth Plus Fund of Funds (A) 1.230 - - - - - 0.733 - - - - -
Momentum Target Growth Plus Fund of Funds (B) 1.600 - - - - - 1.245 - - - - -
Momentum Target Growth Plus Fund of Funds (B2) 1.291 - - - - - 0.822 - - - - -
Momentum Target Growth Plus Fund of Funds (C) 1.380 - - - - - 0.803 - - - - -
Momentum Target Growth Plus Fund of Funds (E) 0.787 - - - - - - - - - - -
Momentum Target Growth Plus Fund of Funds (G) 0.854 - - - - - - - - - - -
Momentum Target Stable Growth Fund of Funds (A) 1.020 - - 0.986 - - 1.246 - - 0.525 - -
Momentum Target Stable Growth Fund of Funds (B) 1.160 - - 1.168 - - 1.425 - - 0.699 - -
Momentum Target Stable Growth Fund of Funds (B2) 1.007 - - 1.019 - - 1.275 - - 0.555 - -
Momentum Target Stable Growth Fund of Funds (C) 1.053 - - 1.063 - - 1.320 - - 0.597 - -
Momentum Target Stable Growth Fund of Funds (E) 1.077 - - 0.102 - - - - - - - -
Momentum Target Stable Growth Fund of Funds (G) 1.103 - - 0.135 - - - - - - - -
Momentum Top 40 Index Fund (A) 3.788 - - 5.034 - - 1.154 - - 7.768 - -
Momentum Top 40 Index Fund (B1) 1.072 - - 2.318 - - - - - 4.252 - -
Momentum Top 40 Index Fund (B2) 2.278 - - 3.526 - - - - - 6.334 - -
Momentum Top 40 Index Fund (B3) 4.296 - - 5.538 - - 1.664 - - 8.247 - -
Momentum Top 40 Index Fund (B5) 4.802 - - 6.043 - - 2.178 - - 8.730 - -
Momentum Trending Equity Fund (A) 0.834 - - 1.667 - - 0.342 - - 1.703 - -
Momentum Trending Equity Fund (B) 0.977 - - 1.820 - - 0.393 - - 1.839 - -
Momentum Trending Equity Fund (B1) 0.882 - - 1.716 - - 0.489 - - 1.750 - -
Momentum Trending Equity Fund (C) 0.954 - - 1.792 - - 0.462 - - 1.815 - -
Momentum Trending Equity Fund (E) 0.868 - - 1.702 - - - - - - - -
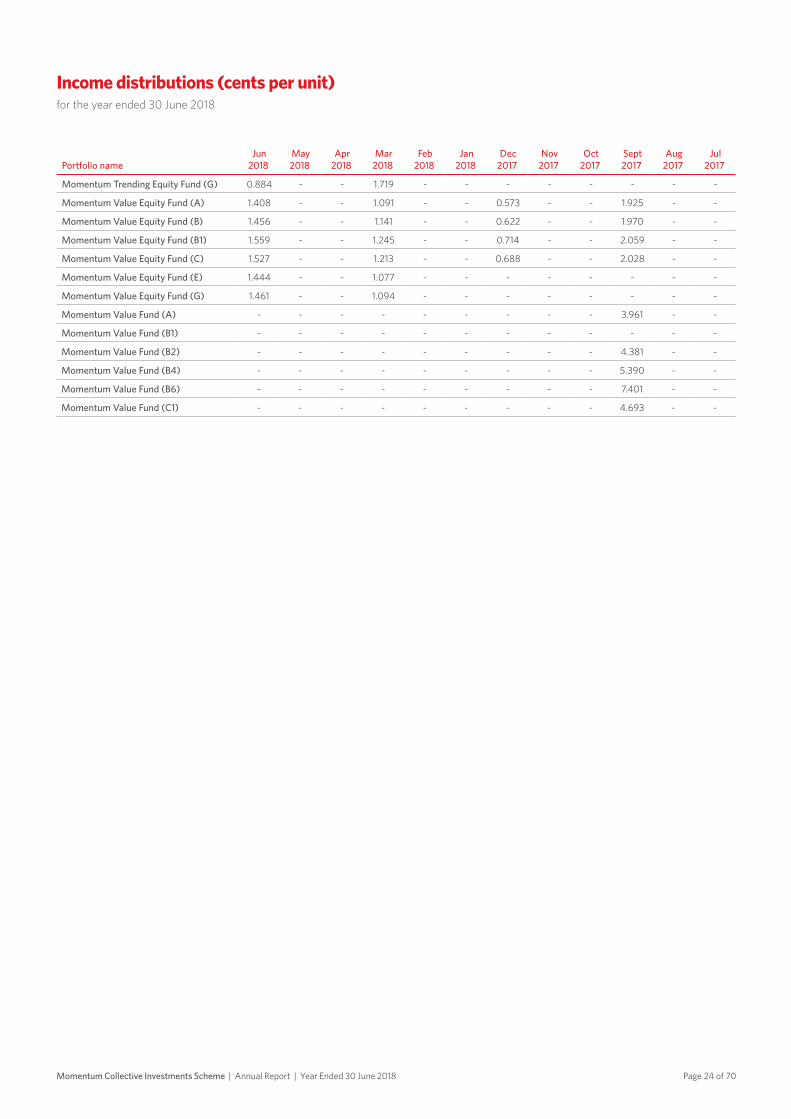
Income distributions (cents per unit)for the year ended 30 June 2018
Page 24 of 70Momentum Collective Investments Scheme | Annual Report | Year Ended 30 June 2018
Portfolio name Jun 2018
May 2018
Apr 2018
Mar 2018
Feb 2018
Jan 2018
Dec 2017
Nov 2017
Oct 2017
Sept 2017
Aug 2017
Jul 2017
Momentum Trending Equity Fund (G) 0.884 - - 1.719 - - - - - - - -
Momentum Value Equity Fund (A) 1.408 - - 1.091 - - 0.573 - - 1.925 - -
Momentum Value Equity Fund (B) 1.456 - - 1.141 - - 0.622 - - 1.970 - -
Momentum Value Equity Fund (B1) 1.559 - - 1.245 - - 0.714 - - 2.059 - -
Momentum Value Equity Fund (C) 1.527 - - 1.213 - - 0.688 - - 2.028 - -
Momentum Value Equity Fund (E) 1.444 - - 1.077 - - - - - - - -
Momentum Value Equity Fund (G) 1.461 - - 1.094 - - - - - - - -
Momentum Value Fund (A) - - - - - - - - - 3.961 - -
Momentum Value Fund (B1) - - - - - - - - - - - -
Momentum Value Fund (B2) - - - - - - - - - 4.381 - -
Momentum Value Fund (B4) - - - - - - - - - 5.390 - -
Momentum Value Fund (B6) - - - - - - - - - 7.401 - -
Momentum Value Fund (C1) - - - - - - - - - 4.693 - -
Income distributions (cents per unit)for the year ended 30 June 2018
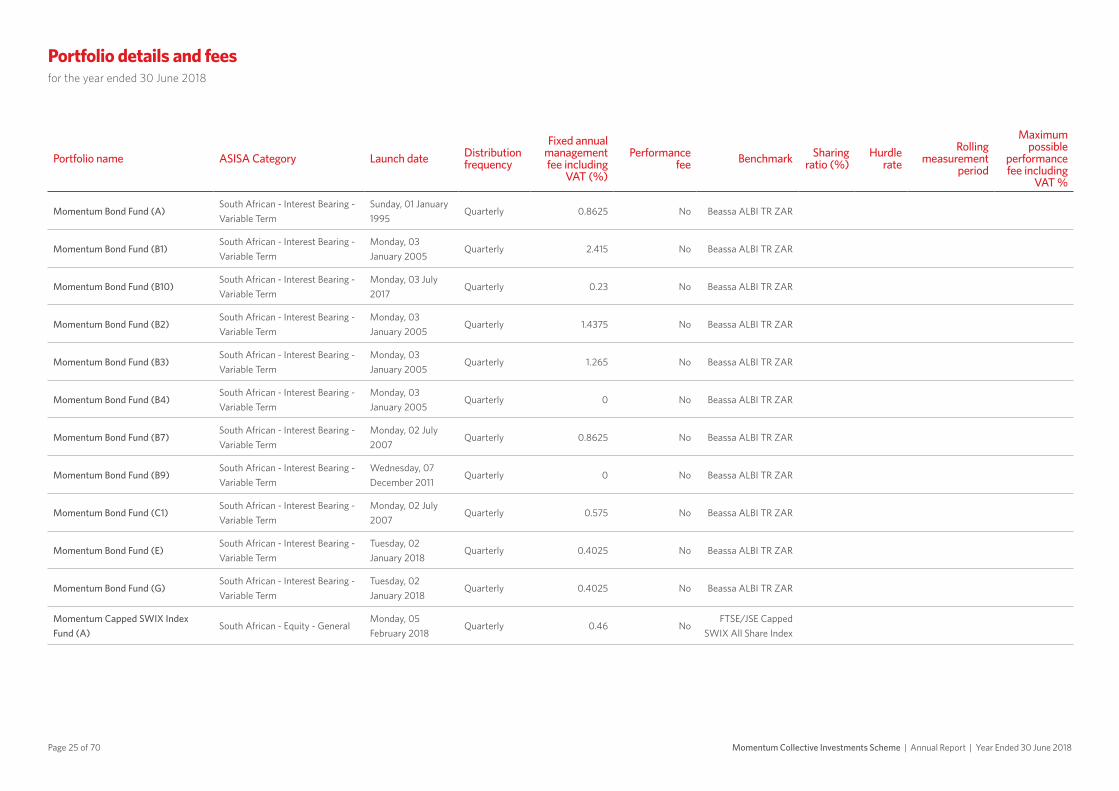
Portfolio details and feesfor the year ended 30 June 2018
Page 25 of 70 Momentum Collective Investments Scheme | Annual Report | Year Ended 30 June 2018
Portfolio name ASISA Category Launch date Distribution frequency
Fixed annual management fee including
VAT (%)
Performance fee Benchmark Sharing
ratio (%)Hurdle
rate Rolling
measurement period
Maximum possible
performance fee including
VAT %
Momentum Bond Fund (A)South African - Interest Bearing - Variable Term
Sunday, 01 January 1995
Quarterly 0.8625 No Beassa ALBI TR ZAR
Momentum Bond Fund (B1)South African - Interest Bearing - Variable Term
Monday, 03 January 2005
Quarterly 2.415 No Beassa ALBI TR ZAR
Momentum Bond Fund (B10)South African - Interest Bearing - Variable Term
Monday, 03 July 2017
Quarterly 0.23 No Beassa ALBI TR ZAR
Momentum Bond Fund (B2)South African - Interest Bearing - Variable Term
Monday, 03 January 2005
Quarterly 1.4375 No Beassa ALBI TR ZAR
Momentum Bond Fund (B3)South African - Interest Bearing - Variable Term
Monday, 03 January 2005
Quarterly 1.265 No Beassa ALBI TR ZAR
Momentum Bond Fund (B4)South African - Interest Bearing - Variable Term
Monday, 03 January 2005
Quarterly 0 No Beassa ALBI TR ZAR
Momentum Bond Fund (B7)South African - Interest Bearing - Variable Term
Monday, 02 July 2007
Quarterly 0.8625 No Beassa ALBI TR ZAR
Momentum Bond Fund (B9)South African - Interest Bearing - Variable Term
Wednesday, 07 December 2011
Quarterly 0 No Beassa ALBI TR ZAR
Momentum Bond Fund (C1)South African - Interest Bearing - Variable Term
Monday, 02 July 2007
Quarterly 0.575 No Beassa ALBI TR ZAR
Momentum Bond Fund (E)South African - Interest Bearing - Variable Term
Tuesday, 02 January 2018
Quarterly 0.4025 No Beassa ALBI TR ZAR
Momentum Bond Fund (G)South African - Interest Bearing - Variable Term
Tuesday, 02 January 2018
Quarterly 0.4025 No Beassa ALBI TR ZAR
Momentum Capped SWIX Index Fund (A)
South African - Equity - GeneralMonday, 05 February 2018
Quarterly 0.46 NoFTSE/JSE Capped
SWIX All Share Index
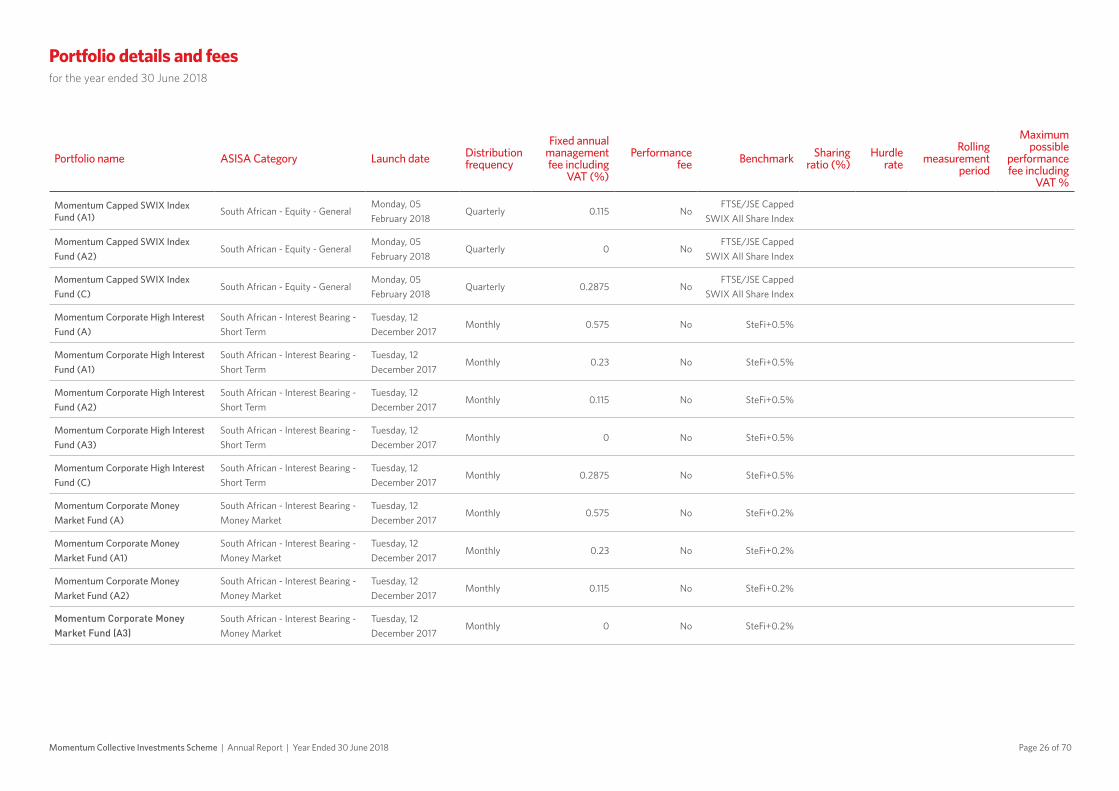
Portfolio details and feesfor the year ended 30 June 2018
Page 26 of 70Momentum Collective Investments Scheme | Annual Report | Year Ended 30 June 2018
Portfolio name ASISA Category Launch date Distribution frequency
Fixed annual management fee including
VAT (%)
Performance fee Benchmark Sharing
ratio (%)Hurdle
rate Rolling
measurement period
Maximum possible
performance fee including
VAT %
Momentum Capped SWIX Index Fund (A1) South African - Equity - General
Monday, 05 February 2018
Quarterly 0.115 NoFTSE/JSE Capped
SWIX All Share Index
Momentum Capped SWIX Index Fund (A2)
South African - Equity - GeneralMonday, 05 February 2018
Quarterly 0 NoFTSE/JSE Capped
SWIX All Share Index
Momentum Capped SWIX Index Fund (C)
South African - Equity - GeneralMonday, 05 February 2018
Quarterly 0.2875 NoFTSE/JSE Capped
SWIX All Share Index
Momentum Corporate High Interest Fund (A)
South African - Interest Bearing - Short Term
Tuesday, 12 December 2017
Monthly 0.575 No SteFi+0.5%
Momentum Corporate High Interest Fund (A1)
South African - Interest Bearing - Short Term
Tuesday, 12 December 2017
Monthly 0.23 No SteFi+0.5%
Momentum Corporate High Interest Fund (A2)
South African - Interest Bearing - Short Term
Tuesday, 12 December 2017
Monthly 0.115 No SteFi+0.5%
Momentum Corporate High Interest Fund (A3)
South African - Interest Bearing - Short Term
Tuesday, 12 December 2017
Monthly 0 No SteFi+0.5%
Momentum Corporate High Interest Fund (C)
South African - Interest Bearing - Short Term
Tuesday, 12 December 2017
Monthly 0.2875 No SteFi+0.5%
Momentum Corporate Money Market Fund (A)
South African - Interest Bearing - Money Market
Tuesday, 12 December 2017
Monthly 0.575 No SteFi+0.2%
Momentum Corporate Money Market Fund (A1)
South African - Interest Bearing - Money Market
Tuesday, 12 December 2017
Monthly 0.23 No SteFi+0.2%
Momentum Corporate Money Market Fund (A2)
South African - Interest Bearing - Money Market
Tuesday, 12 December 2017
Monthly 0.115 No SteFi+0.2%
Momentum Corporate Money Market Fund (A3)
South African - Interest Bearing - Money Market
Tuesday, 12 December 2017
Monthly 0 No SteFi+0.2%

Portfolio details and feesfor the year ended 30 June 2018
Page 27 of 70 Momentum Collective Investments Scheme | Annual Report | Year Ended 30 June 2018
Portfolio name ASISA Category Launch date Distribution frequency
Fixed annual management fee including
VAT (%)
Performance fee Benchmark Sharing
ratio (%)Hurdle
rate Rolling
measurement period
Maximum possible
performance fee including
VAT %
Momentum Corporate Money Market Fund (C)
South African - Interest Bearing - Money Market
Tuesday, 12 December 2017
Monthly 0.2875 No SteFi+0.2%
Momentum Defensive Growth Fund (A)
South African - Multi Asset - Low Equity
Tuesday, 10 October 2017
Quarterly 1.5525 NoCPI + 3% p.a. over a 4 year rolling period
Momentum Defensive Growth Fund (B)
South African - Multi Asset - Low Equity
Tuesday, 10 October 2017
Quarterly 0.2875 NoCPI + 3% p.a. over a 4 year rolling period
Momentum Defensive Growth Fund (B1)
South African - Multi Asset - Low Equity
Tuesday, 10 October 2017
Quarterly 0 NoCPI + 3% p.a. over a 4 year rolling period
Momentum Defensive Growth Fund (C)
South African - Multi Asset - Low Equity
Tuesday, 10 October 2017
Quarterly 1.0925 NoCPI + 3% p.a. over a 4 year rolling period
Momentum Defensive Growth Fund (E)
South African - Multi Asset - Low Equity
Tuesday, 02 January 2018
Quarterly 0.805 NoCPI + 3% p.a. over a 4 year rolling period
Momentum Diversified Income Fund (B1)
South African - Multi Asset - Income
Thursday, 01 November 2007
Quarterly 1.15 No SteFi+1% p.a.
Momentum Diversified Income Fund (B10)
South African - Multi Asset - Income
Wednesday, 15 February 2012
Quarterly 0 No SteFi+1% p.a.
Momentum Diversified Income Fund (B11)
South African - Multi Asset - Income
Monday, 03 October 2016
Quarterly 0.3795 No SteFi+1% p.a.
Momentum Diversified Income Fund (B2)
South African - Multi Asset - Income
Thursday, 01 November 2007
Quarterly 1.495 No SteFi+1% p.a.
Momentum Diversified Income Fund (B3)
South African - Multi Asset - Income
Thursday, 01 November 2007
Quarterly 0 Yes SteFi+1% p.a. 0 0 0 No Cap
Momentum Diversified Income Fund (B4)
South African - Multi Asset - Income
Thursday, 01 November 2007
Quarterly 2.415 No SteFi+1% p.a.
Portfolio details and feesfor the year ended 30 June 2018
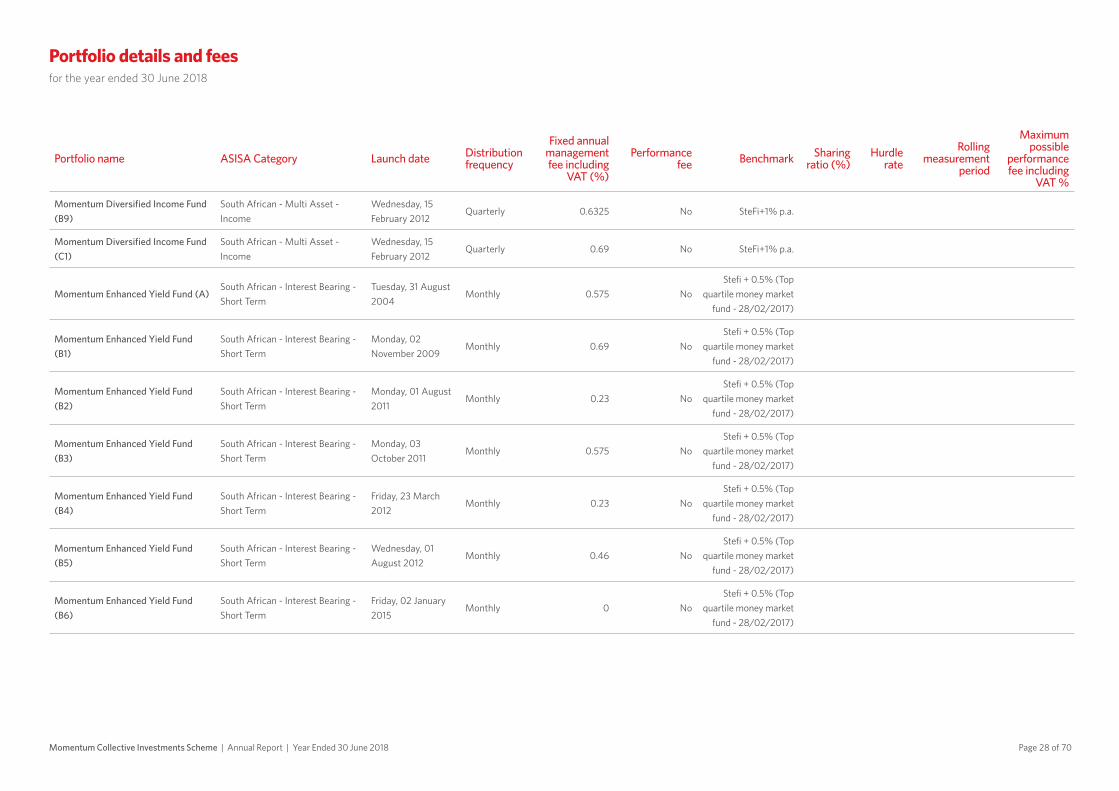
Page 28 of 70Momentum Collective Investments Scheme | Annual Report | Year Ended 30 June 2018
Portfolio name ASISA Category Launch date Distribution frequency
Fixed annual management fee including
VAT (%)
Performance fee Benchmark Sharing
ratio (%)Hurdle
rate Rolling
measurement period
Maximum possible
performance fee including
VAT %
Momentum Diversified Income Fund (B9)
South African - Multi Asset - Income
Wednesday, 15 February 2012
Quarterly 0.6325 No SteFi+1% p.a.
Momentum Diversified Income Fund (C1)
South African - Multi Asset - Income
Wednesday, 15 February 2012
Quarterly 0.69 No SteFi+1% p.a.
Momentum Enhanced Yield Fund (A)South African - Interest Bearing - Short Term
Tuesday, 31 August 2004
Monthly 0.575 NoStefi + 0.5% (Top
quartile money market fund - 28/02/2017)
Momentum Enhanced Yield Fund (B1)
South African - Interest Bearing - Short Term
Monday, 02 November 2009
Monthly 0.69 NoStefi + 0.5% (Top
quartile money market fund - 28/02/2017)
Momentum Enhanced Yield Fund (B2)
South African - Interest Bearing - Short Term
Monday, 01 August 2011
Monthly 0.23 NoStefi + 0.5% (Top
quartile money market fund - 28/02/2017)
Momentum Enhanced Yield Fund (B3)
South African - Interest Bearing - Short Term
Monday, 03 October 2011
Monthly 0.575 NoStefi + 0.5% (Top
quartile money market fund - 28/02/2017)
Momentum Enhanced Yield Fund (B4)
South African - Interest Bearing - Short Term
Friday, 23 March 2012
Monthly 0.23 NoStefi + 0.5% (Top
quartile money market fund - 28/02/2017)
Momentum Enhanced Yield Fund (B5)
South African - Interest Bearing - Short Term
Wednesday, 01 August 2012
Monthly 0.46 NoStefi + 0.5% (Top
quartile money market fund - 28/02/2017)
Momentum Enhanced Yield Fund (B6)
South African - Interest Bearing - Short Term
Friday, 02 January 2015
Monthly 0 NoStefi + 0.5% (Top
quartile money market fund - 28/02/2017)

Portfolio details and feesfor the year ended 30 June 2018
Page 29 of 70 Momentum Collective Investments Scheme | Annual Report | Year Ended 30 June 2018
Portfolio name ASISA Category Launch date Distribution frequency
Fixed annual management fee including
VAT (%)
Performance fee Benchmark Sharing
ratio (%)Hurdle
rate Rolling
measurement period
Maximum possible
performance fee including
VAT %
Momentum Enhanced Yield Fund (B7)South African - Interest Bearing - Short Term
Monday, 02 March 2015
Monthly 0.2875 NoStefi + 0.5% (Top
quartile money market fund - 28/02/2017)
Momentum Enhanced Yield Fund (B8)South African - Interest Bearing - Short Term
Monday, 03 July 2017
Monthly 1.3225 NoStefi + 0.5% (Top
quartile money market fund - 28/02/2017)
Momentum Enhanced Yield Fund (E)South African - Interest Bearing - Short Term
Tuesday, 02 January 2018
Monthly 0.2875 NoStefi + 0.5% (Top
quartile money market fund - 28/02/2017)
Momentum Enhanced Cautious Growth Fund of Funds (A)
South African - Multi Asset - Low Equity
Monday, 02 July 2007
Quarterly 1.3225 NoCPI + 2% p.a. over any
3 year rolling period
Momentum Enhanced Cautious Growth Fund of Funds (B1)
South African - Multi Asset - Low Equity
Friday, 21 October 2011
Quarterly 1.15 NoCPI + 2% p.a. over any
3 year rolling period
Momentum Enhanced Cautious Growth Fund of Funds (B2)
South African - Multi Asset - Low Equity
Wednesday, 01 February 2012
Quarterly 0.805 NoCPI + 2% p.a. over any
3 year rolling period
Momentum Enhanced Cautious Growth Fund of Funds (B3)
South African - Multi Asset - Low Equity
Wednesday, 02 May 2012
Quarterly 1.3225 NoCPI + 2% p.a. over any
3 year rolling period
Momentum Enhanced Cautious Growth Fund of Funds (B4)
South African - Multi Asset - Low Equity
Saturday, 01 December 2012
Quarterly 1.0925 NoCPI + 2% p.a. over any
3 year rolling period
Momentum Enhanced Cautious Growth Fund of Funds (B6)
South African - Multi Asset - Low Equity
Friday, 02 January 2015
Quarterly 0 NoCPI + 2% p.a. over any
3 year rolling period
Momentum Enhanced Cautious Growth Fund of Funds (B7)
South African - Multi Asset - Low Equity
Tuesday, 03 January 2017
Quarterly 0.9775 NoCPI + 2% p.a. over any
3 year rolling period
Momentum Enhanced Cautious Growth Fund of Funds (E)
South African - Multi Asset - Low Equity
Tuesday, 02 January 2018
Quarterly 0.9775 NoCPI + 2% p.a. over any
3 year rolling period
Portfolio details and feesfor the year ended 30 June 2018
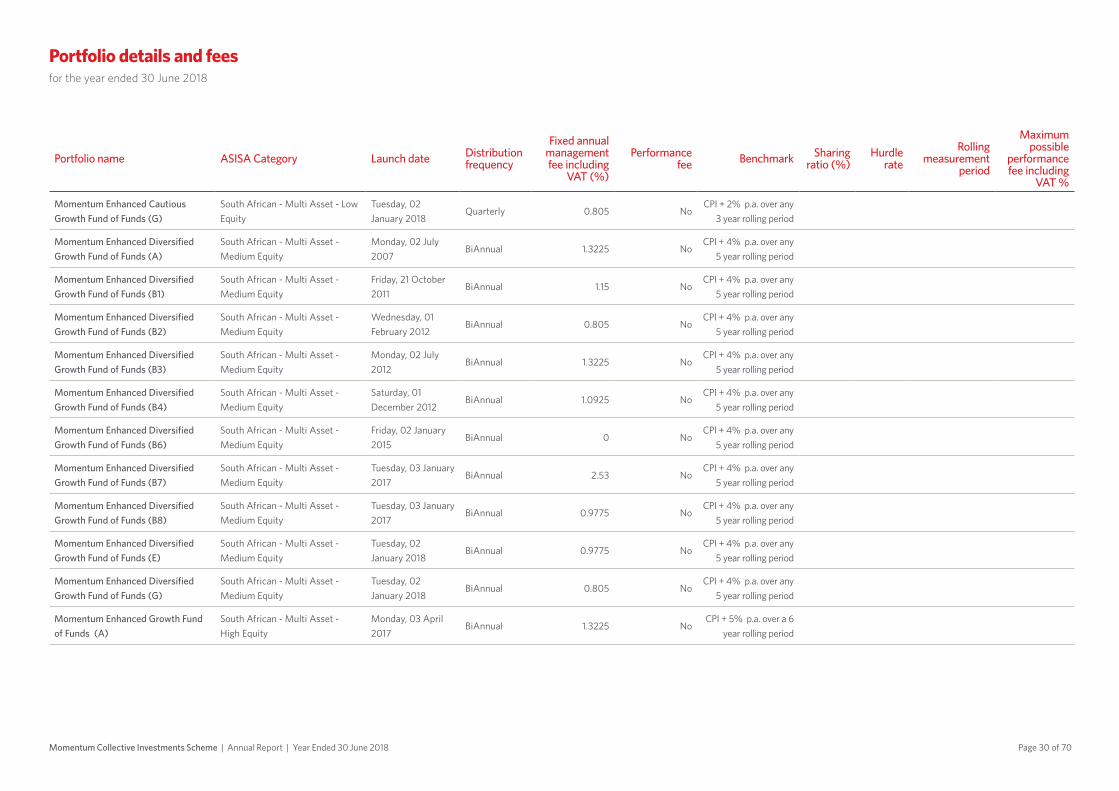
Page 30 of 70Momentum Collective Investments Scheme | Annual Report | Year Ended 30 June 2018
Portfolio name ASISA Category Launch date Distribution frequency
Fixed annual management fee including
VAT (%)
Performance fee Benchmark Sharing
ratio (%)Hurdle
rate Rolling
measurement period
Maximum possible
performance fee including
VAT %
Momentum Enhanced Cautious Growth Fund of Funds (G)
South African - Multi Asset - Low Equity
Tuesday, 02 January 2018
Quarterly 0.805 NoCPI + 2% p.a. over any
3 year rolling period
Momentum Enhanced Diversified Growth Fund of Funds (A)
South African - Multi Asset - Medium Equity
Monday, 02 July 2007
BiAnnual 1.3225 NoCPI + 4% p.a. over any
5 year rolling period
Momentum Enhanced Diversified Growth Fund of Funds (B1)
South African - Multi Asset - Medium Equity
Friday, 21 October 2011
BiAnnual 1.15 NoCPI + 4% p.a. over any
5 year rolling period
Momentum Enhanced Diversified Growth Fund of Funds (B2)
South African - Multi Asset - Medium Equity
Wednesday, 01 February 2012
BiAnnual 0.805 NoCPI + 4% p.a. over any
5 year rolling period
Momentum Enhanced Diversified Growth Fund of Funds (B3)
South African - Multi Asset - Medium Equity
Monday, 02 July 2012
BiAnnual 1.3225 NoCPI + 4% p.a. over any
5 year rolling period
Momentum Enhanced Diversified Growth Fund of Funds (B4)
South African - Multi Asset - Medium Equity
Saturday, 01 December 2012
BiAnnual 1.0925 NoCPI + 4% p.a. over any
5 year rolling period
Momentum Enhanced Diversified Growth Fund of Funds (B6)
South African - Multi Asset - Medium Equity
Friday, 02 January 2015
BiAnnual 0 NoCPI + 4% p.a. over any
5 year rolling period
Momentum Enhanced Diversified Growth Fund of Funds (B7)
South African - Multi Asset - Medium Equity
Tuesday, 03 January 2017
BiAnnual 2.53 NoCPI + 4% p.a. over any
5 year rolling period
Momentum Enhanced Diversified Growth Fund of Funds (B8)
South African - Multi Asset - Medium Equity
Tuesday, 03 January 2017
BiAnnual 0.9775 NoCPI + 4% p.a. over any
5 year rolling period
Momentum Enhanced Diversified Growth Fund of Funds (E)
South African - Multi Asset - Medium Equity
Tuesday, 02 January 2018
BiAnnual 0.9775 NoCPI + 4% p.a. over any
5 year rolling period
Momentum Enhanced Diversified Growth Fund of Funds (G)
South African - Multi Asset - Medium Equity
Tuesday, 02 January 2018
BiAnnual 0.805 NoCPI + 4% p.a. over any
5 year rolling period
Momentum Enhanced Growth Fund of Funds (A)
South African - Multi Asset - High Equity
Monday, 03 April 2017
BiAnnual 1.3225 NoCPI + 5% p.a. over a 6
year rolling period
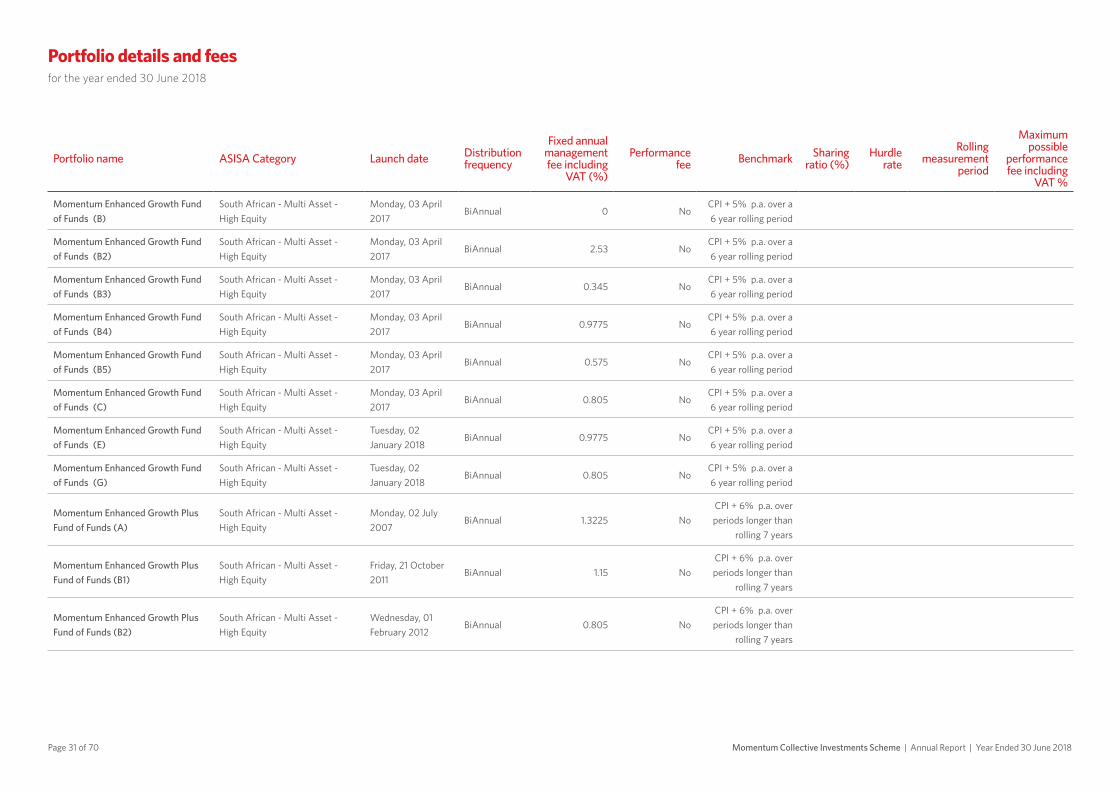
Portfolio details and feesfor the year ended 30 June 2018
Page 31 of 70 Momentum Collective Investments Scheme | Annual Report | Year Ended 30 June 2018
Portfolio name ASISA Category Launch date Distribution frequency
Fixed annual management fee including
VAT (%)
Performance fee Benchmark Sharing
ratio (%)Hurdle
rate Rolling
measurement period
Maximum possible
performance fee including
VAT %
Momentum Enhanced Growth Fund of Funds (B)
South African - Multi Asset - High Equity
Monday, 03 April 2017
BiAnnual 0 NoCPI + 5% p.a. over a 6 year rolling period
Momentum Enhanced Growth Fund of Funds (B2)
South African - Multi Asset - High Equity
Monday, 03 April 2017
BiAnnual 2.53 NoCPI + 5% p.a. over a 6 year rolling period
Momentum Enhanced Growth Fund of Funds (B3)
South African - Multi Asset - High Equity
Monday, 03 April 2017
BiAnnual 0.345 NoCPI + 5% p.a. over a 6 year rolling period
Momentum Enhanced Growth Fund of Funds (B4)
South African - Multi Asset - High Equity
Monday, 03 April 2017
BiAnnual 0.9775 NoCPI + 5% p.a. over a 6 year rolling period
Momentum Enhanced Growth Fund of Funds (B5)
South African - Multi Asset - High Equity
Monday, 03 April 2017
BiAnnual 0.575 NoCPI + 5% p.a. over a 6 year rolling period
Momentum Enhanced Growth Fund of Funds (C)
South African - Multi Asset - High Equity
Monday, 03 April 2017
BiAnnual 0.805 NoCPI + 5% p.a. over a 6 year rolling period
Momentum Enhanced Growth Fund of Funds (E)
South African - Multi Asset - High Equity
Tuesday, 02 January 2018
BiAnnual 0.9775 NoCPI + 5% p.a. over a 6 year rolling period
Momentum Enhanced Growth Fund of Funds (G)
South African - Multi Asset - High Equity
Tuesday, 02 January 2018
BiAnnual 0.805 NoCPI + 5% p.a. over a 6 year rolling period
Momentum Enhanced Growth Plus Fund of Funds (A)
South African - Multi Asset - High Equity
Monday, 02 July 2007
BiAnnual 1.3225 NoCPI + 6% p.a. over periods longer than
rolling 7 years
Momentum Enhanced Growth Plus Fund of Funds (B1)
South African - Multi Asset - High Equity
Friday, 21 October 2011
BiAnnual 1.15 NoCPI + 6% p.a. over periods longer than
rolling 7 years
Momentum Enhanced Growth Plus Fund of Funds (B2)
South African - Multi Asset - High Equity
Wednesday, 01 February 2012
BiAnnual 0.805 NoCPI + 6% p.a. over periods longer than
rolling 7 years
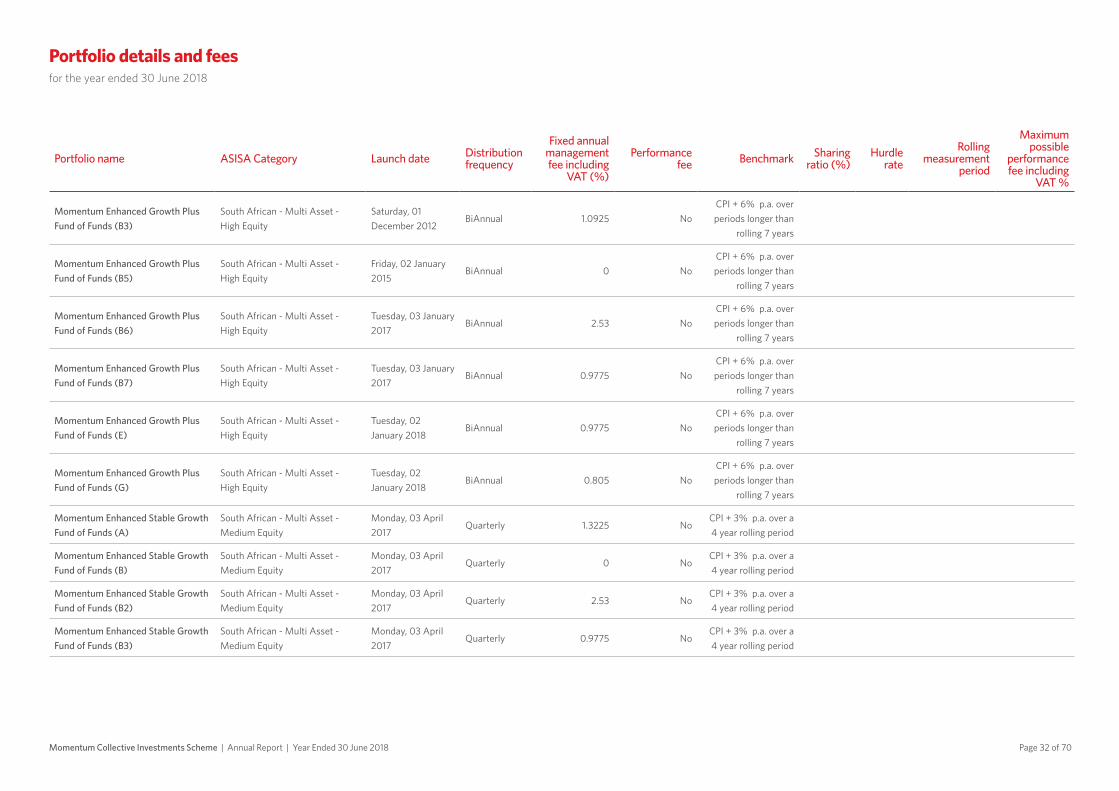
Portfolio details and feesfor the year ended 30 June 2018
Page 32 of 70Momentum Collective Investments Scheme | Annual Report | Year Ended 30 June 2018
Portfolio name ASISA Category Launch date Distribution frequency
Fixed annual management fee including
VAT (%)
Performance fee Benchmark Sharing
ratio (%)Hurdle
rate Rolling
measurement period
Maximum possible
performance fee including
VAT %
Momentum Enhanced Growth Plus Fund of Funds (B3)
South African - Multi Asset - High Equity
Saturday, 01 December 2012
BiAnnual 1.0925 NoCPI + 6% p.a. over periods longer than
rolling 7 years
Momentum Enhanced Growth Plus Fund of Funds (B5)
South African - Multi Asset - High Equity
Friday, 02 January 2015
BiAnnual 0 NoCPI + 6% p.a. over periods longer than
rolling 7 years
Momentum Enhanced Growth Plus Fund of Funds (B6)
South African - Multi Asset - High Equity
Tuesday, 03 January 2017
BiAnnual 2.53 NoCPI + 6% p.a. over periods longer than
rolling 7 years
Momentum Enhanced Growth Plus Fund of Funds (B7)
South African - Multi Asset - High Equity
Tuesday, 03 January 2017
BiAnnual 0.9775 NoCPI + 6% p.a. over periods longer than
rolling 7 years
Momentum Enhanced Growth Plus Fund of Funds (E)
South African - Multi Asset - High Equity
Tuesday, 02 January 2018
BiAnnual 0.9775 NoCPI + 6% p.a. over periods longer than
rolling 7 years
Momentum Enhanced Growth Plus Fund of Funds (G)
South African - Multi Asset - High Equity
Tuesday, 02 January 2018
BiAnnual 0.805 NoCPI + 6% p.a. over periods longer than
rolling 7 years
Momentum Enhanced Stable Growth Fund of Funds (A)
South African - Multi Asset - Medium Equity
Monday, 03 April 2017
Quarterly 1.3225 NoCPI + 3% p.a. over a 4 year rolling period
Momentum Enhanced Stable Growth Fund of Funds (B)
South African - Multi Asset - Medium Equity
Monday, 03 April 2017
Quarterly 0 NoCPI + 3% p.a. over a 4 year rolling period
Momentum Enhanced Stable Growth Fund of Funds (B2)
South African - Multi Asset - Medium Equity
Monday, 03 April 2017
Quarterly 2.53 NoCPI + 3% p.a. over a 4 year rolling period
Momentum Enhanced Stable Growth Fund of Funds (B3)
South African - Multi Asset - Medium Equity
Monday, 03 April 2017
Quarterly 0.9775 NoCPI + 3% p.a. over a 4 year rolling period

Portfolio details and feesfor the year ended 30 June 2018
Page 33 of 70 Momentum Collective Investments Scheme | Annual Report | Year Ended 30 June 2018
Portfolio name ASISA Category Launch date Distribution frequency
Fixed annual management fee including
VAT (%)
Performance fee Benchmark Sharing
ratio (%)Hurdle
rate Rolling
measurement period
Maximum possible
performance fee including
VAT %
Momentum Enhanced Stable Growth Fund of Funds (B4)
South African - Multi Asset - Medium Equity
Monday, 03 April 2017
Quarterly 0.575 NoCPI + 3% p.a. over a 4 year rolling period
Momentum Enhanced Stable Growth Fund of Funds (C)
South African - Multi Asset - Medium Equity
Monday, 03 April 2017
Quarterly 0.805 NoCPI + 3% p.a. over a 4 year rolling period
Momentum Enhanced Stable Growth Fund of Funds (E)
South African - Multi Asset - Medium Equity
Tuesday, 02 January 2018
Quarterly 0.9775 NoCPI + 3% p.a. over a 4 year rolling period
Momentum Enhanced Stable Growth Fund of Funds (G)
South African - Multi Asset - Medium Equity
Tuesday, 02 January 2018
Quarterly 0.805 NoCPI + 3% p.a. over a 4 year rolling period
Momentum Financials Fund (A) South African - Equity - FinancialThursday, 01 January 1998
BiAnnual 1.4375 NoFTSE/JSE Ind/
Financials TR ZAR
Momentum Financials Fund (B1) South African - Equity - FinancialWednesday, 02 January 2002
BiAnnual 2.7025 NoFTSE/JSE Ind/
Financials TR ZAR
Momentum Financials Fund (B2) South African - Equity - FinancialMonday, 02 July 2007
BiAnnual 1.4375 NoFTSE/JSE Ind/
Financials TR ZAR
Momentum Financials Fund (B3) South African - Equity - FinancialMonday, 02 July 2007
BiAnnual 1.15 NoFTSE/JSE Ind/
Financials TR ZAR
Momentum Financials Fund (B4) South African - Equity - FinancialFriday, 02 January 2015
BiAnnual 0 NoFTSE/JSE Ind/
Financials TR ZAR
Momentum Income Plus Fund (A)South African - Multi Asset - Income
Tuesday, 28 June 2005
Quarterly 1.15 No SteFi+3%
Momentum Income Plus Fund (B1)South African - Multi Asset - Income
Friday, 01 July 2005 Quarterly 1.725 No SteFi+3%
Momentum Income Plus Fund (B3)South African - Multi Asset - Income
Sunday, 01 April 2007
Quarterly 0 No SteFi+3%
Momentum Income Plus Fund (B4)South African - Multi Asset - Income
Monday, 02 July 2007
Quarterly 2.415 No SteFi+3%
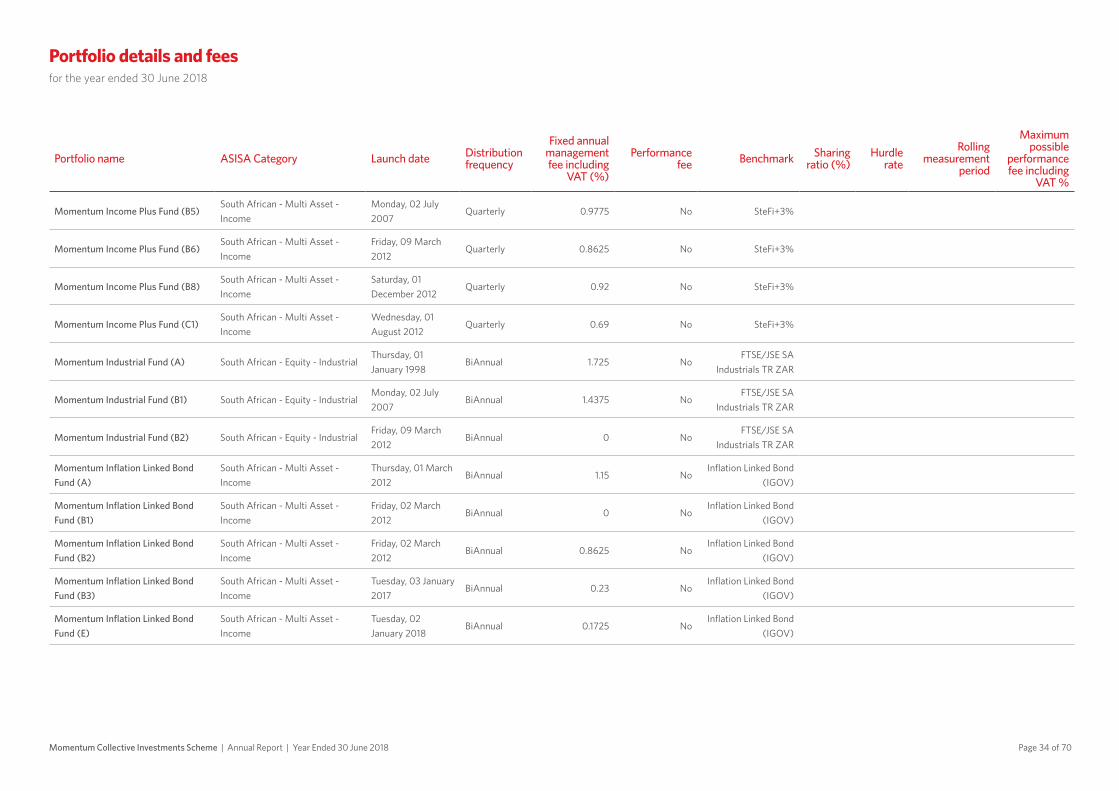
Portfolio details and feesfor the year ended 30 June 2018
Page 34 of 70Momentum Collective Investments Scheme | Annual Report | Year Ended 30 June 2018
Portfolio name ASISA Category Launch date Distribution frequency
Fixed annual management fee including
VAT (%)
Performance fee Benchmark Sharing
ratio (%)Hurdle
rate Rolling
measurement period
Maximum possible
performance fee including
VAT %
Momentum Income Plus Fund (B5)South African - Multi Asset - Income
Monday, 02 July 2007
Quarterly 0.9775 No SteFi+3%
Momentum Income Plus Fund (B6)South African - Multi Asset - Income
Friday, 09 March 2012
Quarterly 0.8625 No SteFi+3%
Momentum Income Plus Fund (B8)South African - Multi Asset - Income
Saturday, 01 December 2012
Quarterly 0.92 No SteFi+3%
Momentum Income Plus Fund (C1)South African - Multi Asset - Income
Wednesday, 01 August 2012
Quarterly 0.69 No SteFi+3%
Momentum Industrial Fund (A) South African - Equity - IndustrialThursday, 01 January 1998
BiAnnual 1.725 NoFTSE/JSE SA
Industrials TR ZAR
Momentum Industrial Fund (B1) South African - Equity - IndustrialMonday, 02 July 2007
BiAnnual 1.4375 NoFTSE/JSE SA
Industrials TR ZAR
Momentum Industrial Fund (B2) South African - Equity - IndustrialFriday, 09 March 2012
BiAnnual 0 NoFTSE/JSE SA
Industrials TR ZAR
Momentum Inflation Linked Bond Fund (A)
South African - Multi Asset - Income
Thursday, 01 March 2012
BiAnnual 1.15 NoInflation Linked Bond
(IGOV)
Momentum Inflation Linked Bond Fund (B1)
South African - Multi Asset - Income
Friday, 02 March 2012
BiAnnual 0 NoInflation Linked Bond
(IGOV)
Momentum Inflation Linked Bond Fund (B2)
South African - Multi Asset - Income
Friday, 02 March 2012
BiAnnual 0.8625 NoInflation Linked Bond
(IGOV)
Momentum Inflation Linked Bond Fund (B3)
South African - Multi Asset - Income
Tuesday, 03 January 2017
BiAnnual 0.23 NoInflation Linked Bond
(IGOV)
Momentum Inflation Linked Bond Fund (E)
South African - Multi Asset - Income
Tuesday, 02 January 2018
BiAnnual 0.1725 NoInflation Linked Bond
(IGOV)
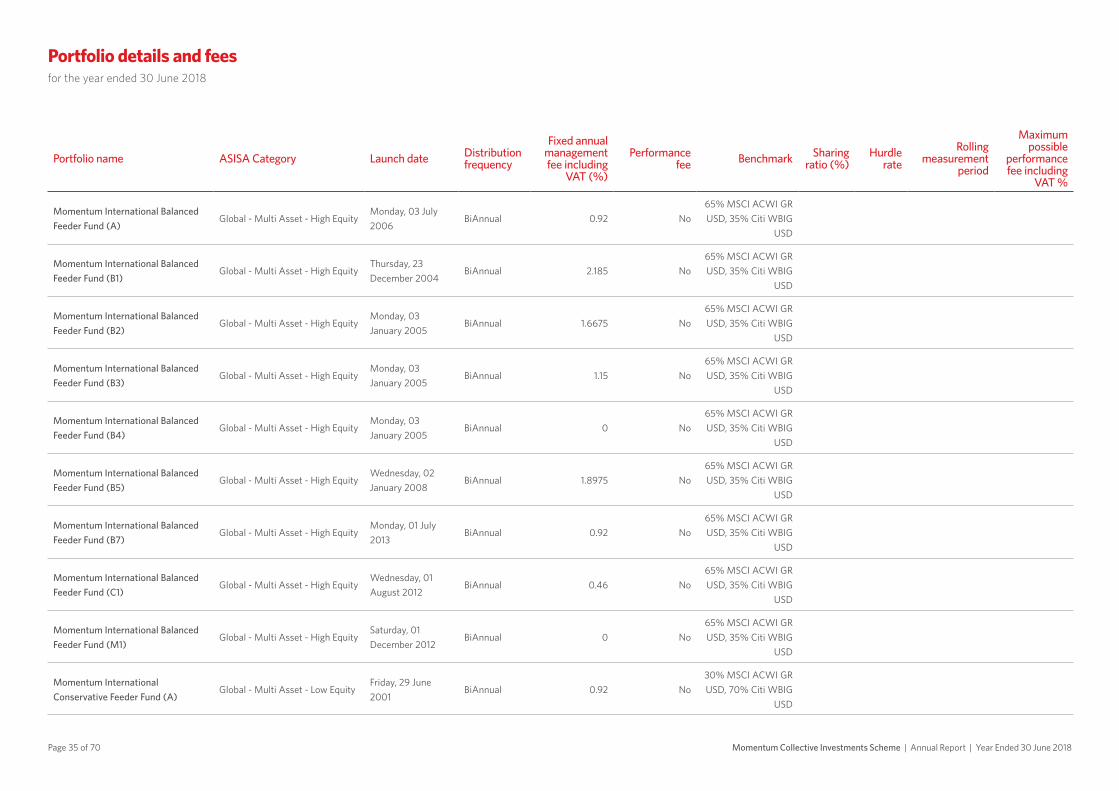
Portfolio details and feesfor the year ended 30 June 2018
Page 35 of 70 Momentum Collective Investments Scheme | Annual Report | Year Ended 30 June 2018
Portfolio name ASISA Category Launch date Distribution frequency
Fixed annual management fee including
VAT (%)
Performance fee Benchmark Sharing
ratio (%)Hurdle
rate Rolling
measurement period
Maximum possible
performance fee including
VAT %
Momentum International Balanced Feeder Fund (A)
Global - Multi Asset - High EquityMonday, 03 July 2006
BiAnnual 0.92 No65% MSCI ACWI GR USD, 35% Citi WBIG
USD
Momentum International Balanced Feeder Fund (B1)
Global - Multi Asset - High EquityThursday, 23 December 2004
BiAnnual 2.185 No65% MSCI ACWI GR USD, 35% Citi WBIG
USD
Momentum International Balanced Feeder Fund (B2)
Global - Multi Asset - High EquityMonday, 03 January 2005
BiAnnual 1.6675 No65% MSCI ACWI GR USD, 35% Citi WBIG
USD
Momentum International Balanced Feeder Fund (B3)
Global - Multi Asset - High EquityMonday, 03 January 2005
BiAnnual 1.15 No65% MSCI ACWI GR USD, 35% Citi WBIG
USD
Momentum International Balanced Feeder Fund (B4)
Global - Multi Asset - High EquityMonday, 03 January 2005
BiAnnual 0 No65% MSCI ACWI GR USD, 35% Citi WBIG
USD
Momentum International Balanced Feeder Fund (B5)
Global - Multi Asset - High EquityWednesday, 02 January 2008
BiAnnual 1.8975 No65% MSCI ACWI GR USD, 35% Citi WBIG
USD
Momentum International Balanced Feeder Fund (B7)
Global - Multi Asset - High EquityMonday, 01 July 2013
BiAnnual 0.92 No65% MSCI ACWI GR USD, 35% Citi WBIG
USD
Momentum International Balanced Feeder Fund (C1)
Global - Multi Asset - High EquityWednesday, 01 August 2012
BiAnnual 0.46 No65% MSCI ACWI GR USD, 35% Citi WBIG
USD
Momentum International Balanced Feeder Fund (M1)
Global - Multi Asset - High EquitySaturday, 01 December 2012
BiAnnual 0 No65% MSCI ACWI GR USD, 35% Citi WBIG
USD
Momentum International Conservative Feeder Fund (A)
Global - Multi Asset - Low EquityFriday, 29 June 2001
BiAnnual 0.92 No30% MSCI ACWI GR USD, 70% Citi WBIG
USD
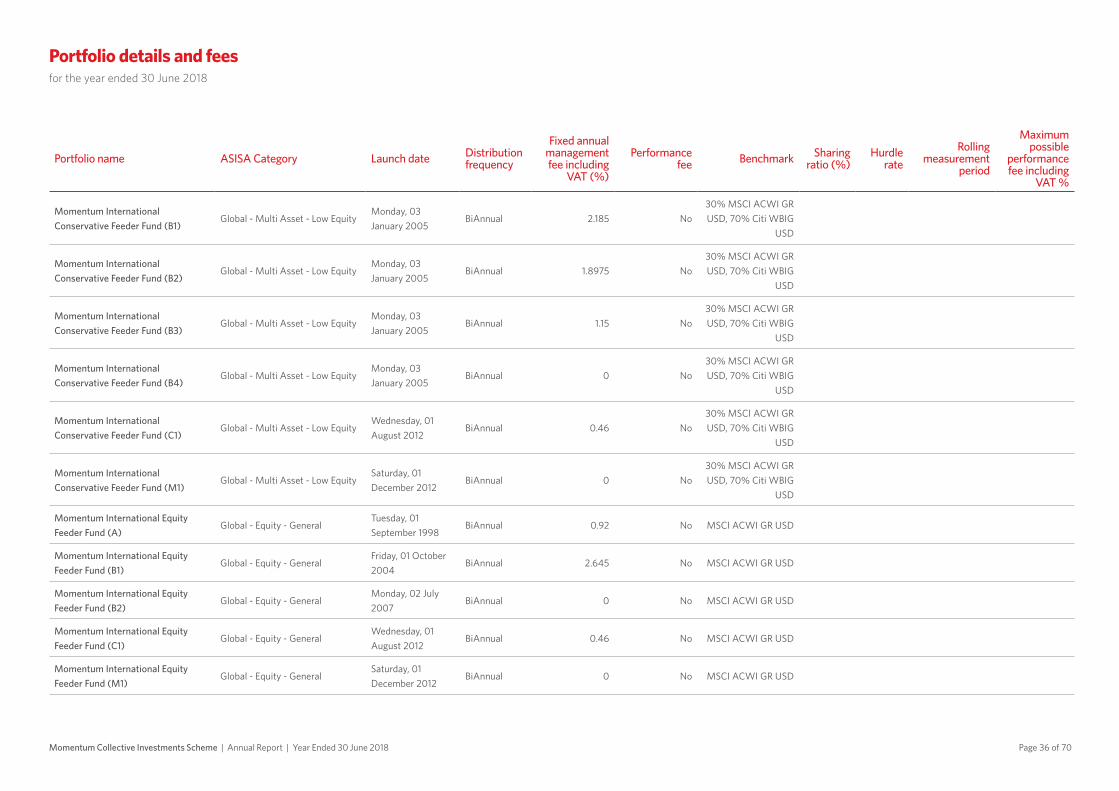
Portfolio details and feesfor the year ended 30 June 2018
Page 36 of 70Momentum Collective Investments Scheme | Annual Report | Year Ended 30 June 2018
Portfolio name ASISA Category Launch date Distribution frequency
Fixed annual management fee including
VAT (%)
Performance fee Benchmark Sharing
ratio (%)Hurdle
rate Rolling
measurement period
Maximum possible
performance fee including
VAT %
Momentum International Conservative Feeder Fund (B1)
Global - Multi Asset - Low EquityMonday, 03 January 2005
BiAnnual 2.185 No30% MSCI ACWI GR USD, 70% Citi WBIG
USD
Momentum International Conservative Feeder Fund (B2)
Global - Multi Asset - Low EquityMonday, 03 January 2005
BiAnnual 1.8975 No30% MSCI ACWI GR USD, 70% Citi WBIG
USD
Momentum International Conservative Feeder Fund (B3)
Global - Multi Asset - Low EquityMonday, 03 January 2005
BiAnnual 1.15 No30% MSCI ACWI GR USD, 70% Citi WBIG
USD
Momentum International Conservative Feeder Fund (B4)
Global - Multi Asset - Low EquityMonday, 03 January 2005
BiAnnual 0 No30% MSCI ACWI GR USD, 70% Citi WBIG
USD
Momentum International Conservative Feeder Fund (C1)
Global - Multi Asset - Low EquityWednesday, 01 August 2012
BiAnnual 0.46 No30% MSCI ACWI GR USD, 70% Citi WBIG
USD
Momentum International Conservative Feeder Fund (M1)
Global - Multi Asset - Low EquitySaturday, 01 December 2012
BiAnnual 0 No30% MSCI ACWI GR USD, 70% Citi WBIG
USD
Momentum International Equity Feeder Fund (A)
Global - Equity - GeneralTuesday, 01 September 1998
BiAnnual 0.92 No MSCI ACWI GR USD
Momentum International Equity Feeder Fund (B1)
Global - Equity - GeneralFriday, 01 October 2004
BiAnnual 2.645 No MSCI ACWI GR USD
Momentum International Equity Feeder Fund (B2)
Global - Equity - GeneralMonday, 02 July 2007
BiAnnual 0 No MSCI ACWI GR USD
Momentum International Equity Feeder Fund (C1)
Global - Equity - GeneralWednesday, 01 August 2012
BiAnnual 0.46 No MSCI ACWI GR USD
Momentum International Equity Feeder Fund (M1)
Global - Equity - GeneralSaturday, 01 December 2012
BiAnnual 0 No MSCI ACWI GR USD

Portfolio details and feesfor the year ended 30 June 2018
Page 37 of 70 Momentum Collective Investments Scheme | Annual Report | Year Ended 30 June 2018
Portfolio name ASISA Category Launch date Distribution frequency
Fixed annual management fee including
VAT (%)
Performance fee Benchmark Sharing
ratio (%)Hurdle
rate Rolling
measurement period
Maximum possible
performance fee including
VAT %
Momentum International Income Fund (A)
Global - Interest Bearing - Short Term
Tuesday, 31 December 2002
Quarterly 0.8625 No13 US 3m Libor, 13 Euro
3m Libor, 13 UK 3m Libor
Momentum International Income Fund (B1)
Global - Interest Bearing - Short Term
Friday, 01 October 2004
Quarterly 2.1275 No13 US 3m Libor, 13 Euro
3m Libor, 13 UK 3m Libor
Momentum International Income Fund (B2)
Global - Interest Bearing - Short Term
Monday, 03 January 2005
Quarterly 1.15 No13 US 3m Libor, 13 Euro
3m Libor, 13 UK 3m Libor
Momentum International Income Fund (B3)
Global - Interest Bearing - Short Term
Friday, 01 July 2005 Quarterly 1.104 No13 US 3m Libor, 13 Euro
3m Libor, 13 UK 3m Libor
Momentum International Income Fund (B4)
Global - Interest Bearing - Short Term
Monday, 02 July 2007
Quarterly 0 No13 US 3m Libor, 13 Euro
3m Libor, 13 UK 3m Libor
Momentum International Income Fund (B5)
Global - Interest Bearing - Short Term
Monday, 03 October 2011
Quarterly 1.817 No13 US 3m Libor, 13 Euro
3m Libor, 13 UK 3m Libor
Momentum International Income Fund (B6)
Global - Interest Bearing - Short Term
Monday, 03 October 2011
Quarterly 1.4375 No13 US 3m Libor, 13 Euro
3m Libor, 13 UK 3m Libor
Momentum International Income Fund (B7)
Global - Interest Bearing - Short Term
Saturday, 01 December 2012
Quarterly 0.46 No13 US 3m Libor, 13 Euro
3m Libor, 13 UK 3m Libor
Momentum International Income Fund (C1)
Global - Interest Bearing - Short Term
Monday, 01 July 2013
Quarterly 0.46 No13 US 3m Libor, 13 Euro
3m Libor, 13 UK 3m Libor
Momentum Mid & Small Cap Index Fund (A)
South African - Equity - Mid & Small Cap
Monday, 31 July 2017
Quarterly 0.46 NoMMI Proprietory Mid
& Small Cap Index
Momentum Mid & Small Cap Index Fund (B)
South African - Equity - Mid & Small Cap
Monday, 31 July 2017
Quarterly 0.2875 NoMMI Proprietory Mid
& Small Cap Index
Momentum Mid & Small Cap Index Fund (B1)
South African - Equity - Mid & Small Cap
Monday, 31 July 2017
Quarterly 0 NoMMI Proprietory Mid
& Small Cap Index
Momentum Mid & Small Cap Index Fund (C)
South African - Equity - Mid & Small Cap
Monday, 31 July 2017
Quarterly 0.115 NoMMI Proprietory Mid
& Small Cap Index

Portfolio details and feesfor the year ended 30 June 2018
Page 38 of 70Momentum Collective Investments Scheme | Annual Report | Year Ended 30 June 2018
Portfolio name ASISA Category Launch date Distribution frequency
Fixed annual management fee including
VAT (%)
Performance fee Benchmark Sharing
ratio (%)Hurdle
rate Rolling
measurement period
Maximum possible
performance fee including
VAT %
Momentum Mid & Small Cap Index Fund (E)
South African - Equity - Mid & Small Cap
Tuesday, 02 January 2018
Quarterly 0.2875 NoMMI Proprietory Mid
& Small Cap Index
Momentum Mid & Small Cap Index Fund (G)
South African - Equity - Mid & Small Cap
Tuesday, 02 January 2018
Quarterly 0.2875 NoMMI Proprietory Mid
& Small Cap Index
Momentum Money Market Fund (A)South African - Interest Bearing - Money Market
Friday, 20 March 2009
Monthly 0.575 No STeFI Composite ZAR
Momentum Money Market Fund (B10)
South African - Interest Bearing - Money Market
Wednesday, 07 December 2011
Monthly 0 No STeFI Composite ZAR
Momentum Money Market Fund (B3)
South African - Interest Bearing - Money Market
Monday, 03 January 2005
Monthly 0.345 No STeFI Composite ZAR
Momentum Money Market Fund (B4)
South African - Interest Bearing - Money Market
Monday, 03 January 2005
Monthly 1.012 No STeFI Composite ZAR
Momentum Money Market Fund (B5)
South African - Interest Bearing - Money Market
Monday, 03 January 2005
Monthly 0 No STeFI Composite ZAR
Momentum Money Market Fund (B6)
South African - Interest Bearing - Money Market
Wednesday, 01 February 2006
Monthly 0.115 No STeFI Composite ZAR
Momentum Money Market Fund (B7)
South African - Interest Bearing - Money Market
Monday, 02 July 2007
Monthly 0.46 No STeFI Composite ZAR
Momentum Money Market Fund (B8)
South African - Interest Bearing - Money Market
Monday, 01 December 2008
Monthly 0.4025 No STeFI Composite ZAR
Momentum Money Market Fund (C1)
South African - Interest Bearing - Money Market
Monday, 01 December 2008
Monthly 0.2875 No STeFI Composite ZAR
Momentum Money Market Fund (E)South African - Interest Bearing - Money Market
Tuesday, 02 January 2018
Monthly 0.115 No STeFI Composite ZAR
Momentum Money Market Fund (G)South African - Interest Bearing - Money Market
Tuesday, 02 January 2018
Monthly 0.2875 No STeFI Composite ZAR
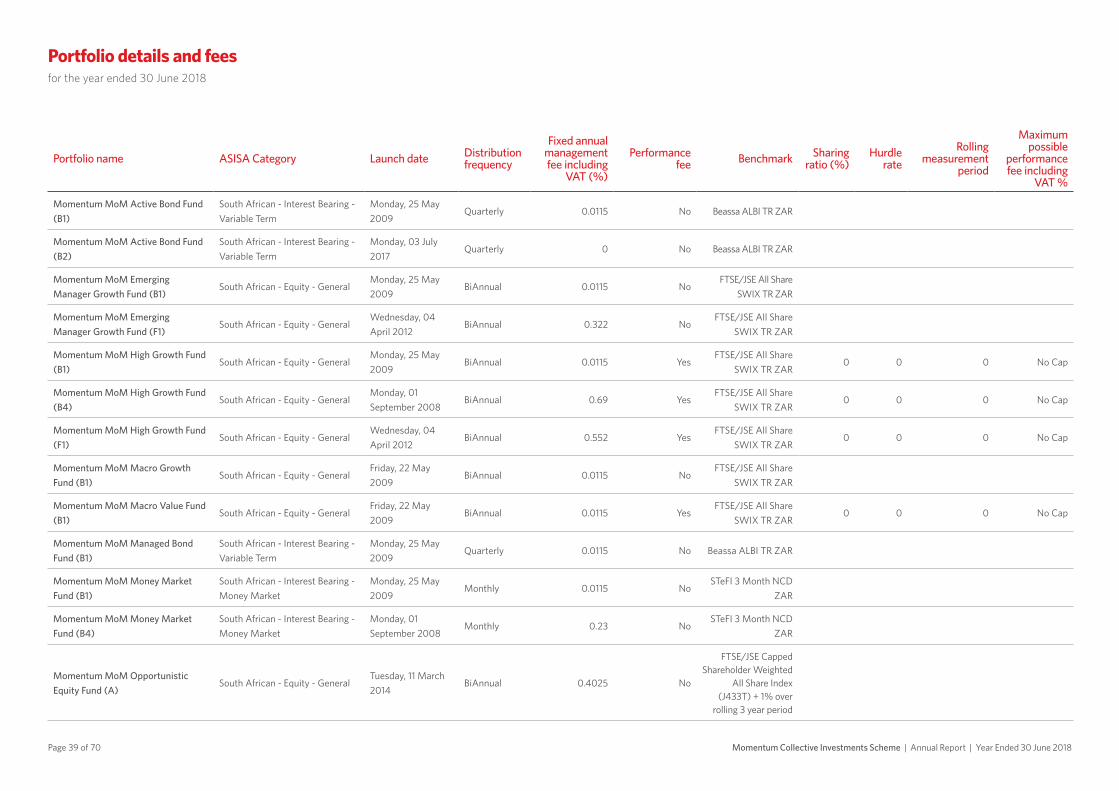
Portfolio details and feesfor the year ended 30 June 2018
Page 39 of 70 Momentum Collective Investments Scheme | Annual Report | Year Ended 30 June 2018
Portfolio name ASISA Category Launch date Distribution frequency
Fixed annual management fee including
VAT (%)
Performance fee Benchmark Sharing
ratio (%)Hurdle
rate Rolling
measurement period
Maximum possible
performance fee including
VAT %
Momentum MoM Active Bond Fund (B1)
South African - Interest Bearing - Variable Term
Monday, 25 May 2009
Quarterly 0.0115 No Beassa ALBI TR ZAR
Momentum MoM Active Bond Fund (B2)
South African - Interest Bearing - Variable Term
Monday, 03 July 2017
Quarterly 0 No Beassa ALBI TR ZAR
Momentum MoM Emerging Manager Growth Fund (B1)
South African - Equity - GeneralMonday, 25 May 2009
BiAnnual 0.0115 NoFTSE/JSE All Share
SWIX TR ZAR
Momentum MoM Emerging Manager Growth Fund (F1)
South African - Equity - GeneralWednesday, 04 April 2012
BiAnnual 0.322 NoFTSE/JSE All Share
SWIX TR ZAR
Momentum MoM High Growth Fund (B1)
South African - Equity - GeneralMonday, 25 May 2009
BiAnnual 0.0115 YesFTSE/JSE All Share
SWIX TR ZAR0 0 0 No Cap
Momentum MoM High Growth Fund (B4)
South African - Equity - GeneralMonday, 01 September 2008
BiAnnual 0.69 YesFTSE/JSE All Share
SWIX TR ZAR0 0 0 No Cap
Momentum MoM High Growth Fund (F1)
South African - Equity - GeneralWednesday, 04 April 2012
BiAnnual 0.552 YesFTSE/JSE All Share
SWIX TR ZAR0 0 0 No Cap
Momentum MoM Macro Growth Fund (B1)
South African - Equity - GeneralFriday, 22 May 2009
BiAnnual 0.0115 NoFTSE/JSE All Share
SWIX TR ZAR
Momentum MoM Macro Value Fund (B1)
South African - Equity - GeneralFriday, 22 May 2009
BiAnnual 0.0115 YesFTSE/JSE All Share
SWIX TR ZAR0 0 0 No Cap
Momentum MoM Managed Bond Fund (B1)
South African - Interest Bearing - Variable Term
Monday, 25 May 2009
Quarterly 0.0115 No Beassa ALBI TR ZAR
Momentum MoM Money Market Fund (B1)
South African - Interest Bearing - Money Market
Monday, 25 May 2009
Monthly 0.0115 NoSTeFI 3 Month NCD
ZAR
Momentum MoM Money Market Fund (B4)
South African - Interest Bearing - Money Market
Monday, 01 September 2008
Monthly 0.23 NoSTeFI 3 Month NCD
ZAR
Momentum MoM Opportunistic Equity Fund (A)
South African - Equity - GeneralTuesday, 11 March 2014
BiAnnual 0.4025 No
FTSE/JSE Capped Shareholder Weighted
All Share Index (J433T) + 1% over
rolling 3 year period
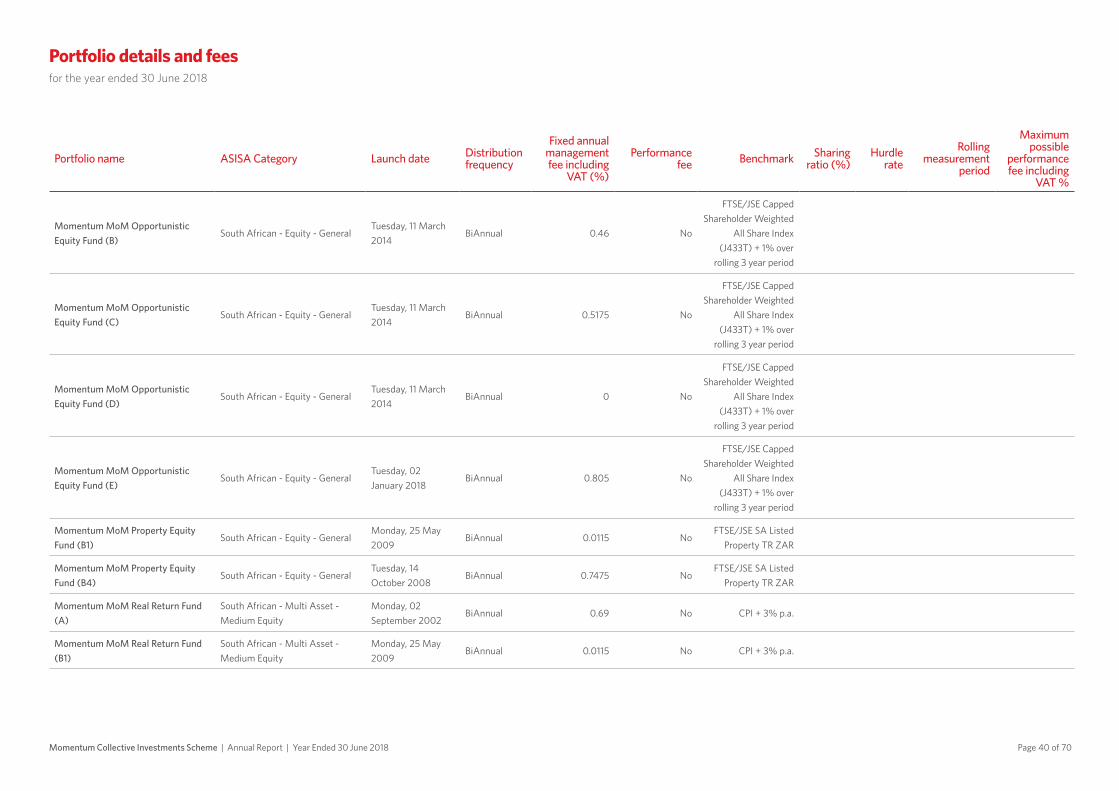
Portfolio details and feesfor the year ended 30 June 2018
Page 40 of 70Momentum Collective Investments Scheme | Annual Report | Year Ended 30 June 2018
Portfolio name ASISA Category Launch date Distribution frequency
Fixed annual management fee including
VAT (%)
Performance fee Benchmark Sharing
ratio (%)Hurdle
rate Rolling
measurement period
Maximum possible
performance fee including
VAT %
Momentum MoM Opportunistic Equity Fund (B)
South African - Equity - GeneralTuesday, 11 March 2014
BiAnnual 0.46 No
FTSE/JSE Capped Shareholder Weighted
All Share Index (J433T) + 1% over
rolling 3 year period
Momentum MoM Opportunistic Equity Fund (C)
South African - Equity - GeneralTuesday, 11 March 2014
BiAnnual 0.5175 No
FTSE/JSE Capped Shareholder Weighted
All Share Index (J433T) + 1% over
rolling 3 year period
Momentum MoM Opportunistic Equity Fund (D)
South African - Equity - GeneralTuesday, 11 March 2014
BiAnnual 0 No
FTSE/JSE Capped Shareholder Weighted
All Share Index (J433T) + 1% over
rolling 3 year period
Momentum MoM Opportunistic Equity Fund (E)
South African - Equity - GeneralTuesday, 02 January 2018
BiAnnual 0.805 No
FTSE/JSE Capped Shareholder Weighted
All Share Index (J433T) + 1% over
rolling 3 year period
Momentum MoM Property Equity Fund (B1)
South African - Equity - GeneralMonday, 25 May 2009
BiAnnual 0.0115 NoFTSE/JSE SA Listed
Property TR ZAR
Momentum MoM Property Equity Fund (B4)
South African - Equity - GeneralTuesday, 14 October 2008
BiAnnual 0.7475 NoFTSE/JSE SA Listed
Property TR ZAR
Momentum MoM Real Return Fund (A)
South African - Multi Asset - Medium Equity
Monday, 02 September 2002
BiAnnual 0.69 No CPI + 3% p.a.
Momentum MoM Real Return Fund (B1)
South African - Multi Asset - Medium Equity
Monday, 25 May 2009
BiAnnual 0.0115 No CPI + 3% p.a.

Portfolio details and feesfor the year ended 30 June 2018
Page 41 of 70 Momentum Collective Investments Scheme | Annual Report | Year Ended 30 June 2018
Portfolio name ASISA Category Launch date Distribution frequency
Fixed annual management fee including
VAT (%)
Performance fee Benchmark Sharing
ratio (%)Hurdle
rate Rolling
measurement period
Maximum possible
performance fee including
VAT %
Momentum MoM Specialist Equity Fund (A)
South African - Equity - GeneralTuesday, 18 March 2014
BiAnnual 0 Yes
FTSE/JSE Capped Shareholder Weighted
All Share Index (J433T) + 1% over
rolling 3 year period
0 0 No Cap
Momentum MoM Specialist Equity Fund (F1)
South African - Equity - GeneralTuesday, 03 January 2017
BiAnnual 0.552 No
FTSE/JSE Capped Shareholder Weighted
All Share Index (J433T) + 1% over
rolling 3 year period
Momentum MoM Specialist Equity Fund (E)
South African - Equity - GeneralTuesday, 02 January 2018
BiAnnual 0.805 No
FTSE/JSE Capped Shareholder Weighted
All Share Index (J433T) + 1% over
rolling 3 year period
Momentum MoM Ultra Long Term Value Fund (B1)
South African - Equity - GeneralFriday, 16 October 2009
BiAnnual 0.0115 No
FTSE/JSE Capped Shareholder Weighted
All Share Index (J433T) + 1% over
rolling 3 year period
Momentum MoM Ultra Long Term Value Fund (B4)
South African - Equity - GeneralFriday, 16 October 2009
BiAnnual 0.69 No
FTSE/JSE Capped Shareholder Weighted
All Share Index (J433T) + 1% over
rolling 3 year period
Momentum MoM Ultra Long Term Value Fund (F1)
South African - Equity - GeneralWednesday, 04 April 2012
BiAnnual 0.552 No
FTSE/JSE Capped Shareholder Weighted
All Share Index (J433T) + 1% over
rolling 3 year period

Portfolio details and feesfor the year ended 30 June 2018
Page 42 of 70Momentum Collective Investments Scheme | Annual Report | Year Ended 30 June 2018
Portfolio name ASISA Category Launch date Distribution frequency
Fixed annual management fee including
VAT (%)
Performance fee Benchmark Sharing
ratio (%)Hurdle
rate Rolling
measurement period
Maximum possible
performance fee including
VAT %
Momentum Optimal Yield Fund (A)South African - Multi Asset - Income
Tuesday, 31 December 2002
BiAnnual 0.92 NoSTeFI Call Deposit
ZAR
Momentum Optimal Yield Fund (B10)
South African - Multi Asset - Income
Tuesday, 02 January 2007
BiAnnual 0 NoSTeFI Call Deposit
ZAR
Momentum Optimal Yield Fund (B11)South African - Multi Asset - Income
Monday, 02 July 2007
BiAnnual 1.15 NoSTeFI Call Deposit
ZAR
Momentum Optimal Yield Fund (B12)
South African - Multi Asset - Income
Wednesday, 07 December 2011
BiAnnual 0.0575 NoSTeFI Call Deposit
ZAR
Momentum Optimal Yield Fund (B2)South African - Multi Asset - Income
Friday, 01 October 2004
BiAnnual 2.7025 NoSTeFI Call Deposit
ZAR
Momentum Optimal Yield Fund (B3)South African - Multi Asset - Income
Monday, 03 January 2005
BiAnnual 1.725 NoSTeFI Call Deposit
ZAR
Momentum Optimal Yield Fund (B4)South African - Multi Asset - Income
Monday, 03 January 2005
BiAnnual 0.2875 YesSTeFI Call Deposit
ZAR12.5 0 1 1.4375
Momentum Optimal Yield Fund (B5)South African - Multi Asset - Income
Monday, 03 January 2005
BiAnnual 0 YesSTeFI Call Deposit
ZAR12.5 0 1 1.4375
Momentum Optimal Yield Fund (C1)South African - Multi Asset - Income
Friday, 01 July 2005 BiAnnual 0.575 NoSTeFI Call Deposit
ZAR
Momentum Real Growth Core Equity Fund (A)
South African - Equity - GeneralMonday, 03 April 2017
Quarterly 0.575 NoFTSE/JSE All Share
SWIX TR ZAR
Momentum Real Growth Core Equity Fund (B)
South African - Equity - GeneralMonday, 03 April 2017
Quarterly 0 NoFTSE/JSE All Share
SWIX TR ZAR
Momentum Real Growth Core Equity Fund (B2)
South African - Equity - GeneralMonday, 03 July 2017
Quarterly 0.092 NoFTSE/JSE All Share
SWIX TR ZAR
Momentum Real Growth Core Equity Fund (C)
South African - Equity - GeneralMonday, 03 April 2017
Quarterly 0.4025 NoFTSE/JSE All Share
SWIX TR ZAR
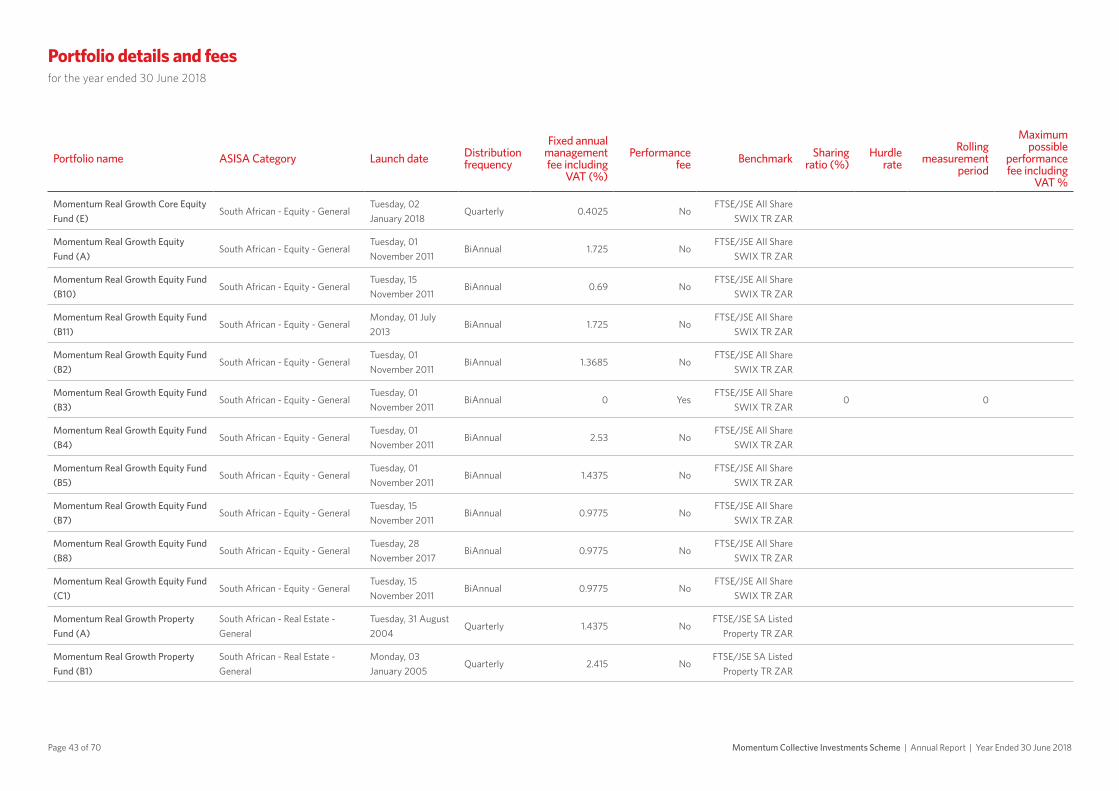
Portfolio details and feesfor the year ended 30 June 2018
Page 43 of 70 Momentum Collective Investments Scheme | Annual Report | Year Ended 30 June 2018
Portfolio name ASISA Category Launch date Distribution frequency
Fixed annual management fee including
VAT (%)
Performance fee Benchmark Sharing
ratio (%)Hurdle
rate Rolling
measurement period
Maximum possible
performance fee including
VAT %
Momentum Real Growth Core Equity Fund (E)
South African - Equity - GeneralTuesday, 02 January 2018
Quarterly 0.4025 NoFTSE/JSE All Share
SWIX TR ZAR
Momentum Real Growth Equity Fund (A)
South African - Equity - GeneralTuesday, 01 November 2011
BiAnnual 1.725 NoFTSE/JSE All Share
SWIX TR ZAR
Momentum Real Growth Equity Fund (B10)
South African - Equity - GeneralTuesday, 15 November 2011
BiAnnual 0.69 NoFTSE/JSE All Share
SWIX TR ZAR
Momentum Real Growth Equity Fund (B11)
South African - Equity - GeneralMonday, 01 July 2013
BiAnnual 1.725 NoFTSE/JSE All Share
SWIX TR ZAR
Momentum Real Growth Equity Fund (B2)
South African - Equity - GeneralTuesday, 01 November 2011
BiAnnual 1.3685 NoFTSE/JSE All Share
SWIX TR ZAR
Momentum Real Growth Equity Fund (B3)
South African - Equity - GeneralTuesday, 01 November 2011
BiAnnual 0 YesFTSE/JSE All Share
SWIX TR ZAR0 0
Momentum Real Growth Equity Fund (B4)
South African - Equity - GeneralTuesday, 01 November 2011
BiAnnual 2.53 NoFTSE/JSE All Share
SWIX TR ZAR
Momentum Real Growth Equity Fund (B5)
South African - Equity - GeneralTuesday, 01 November 2011
BiAnnual 1.4375 NoFTSE/JSE All Share
SWIX TR ZAR
Momentum Real Growth Equity Fund (B7)
South African - Equity - GeneralTuesday, 15 November 2011
BiAnnual 0.9775 NoFTSE/JSE All Share
SWIX TR ZAR
Momentum Real Growth Equity Fund (B8)
South African - Equity - GeneralTuesday, 28 November 2017
BiAnnual 0.9775 NoFTSE/JSE All Share
SWIX TR ZAR
Momentum Real Growth Equity Fund (C1)
South African - Equity - GeneralTuesday, 15 November 2011
BiAnnual 0.9775 NoFTSE/JSE All Share
SWIX TR ZAR
Momentum Real Growth Property Fund (A)
South African - Real Estate - General
Tuesday, 31 August 2004
Quarterly 1.4375 NoFTSE/JSE SA Listed
Property TR ZAR
Momentum Real Growth Property Fund (B1)
South African - Real Estate - General
Monday, 03 January 2005
Quarterly 2.415 NoFTSE/JSE SA Listed
Property TR ZAR
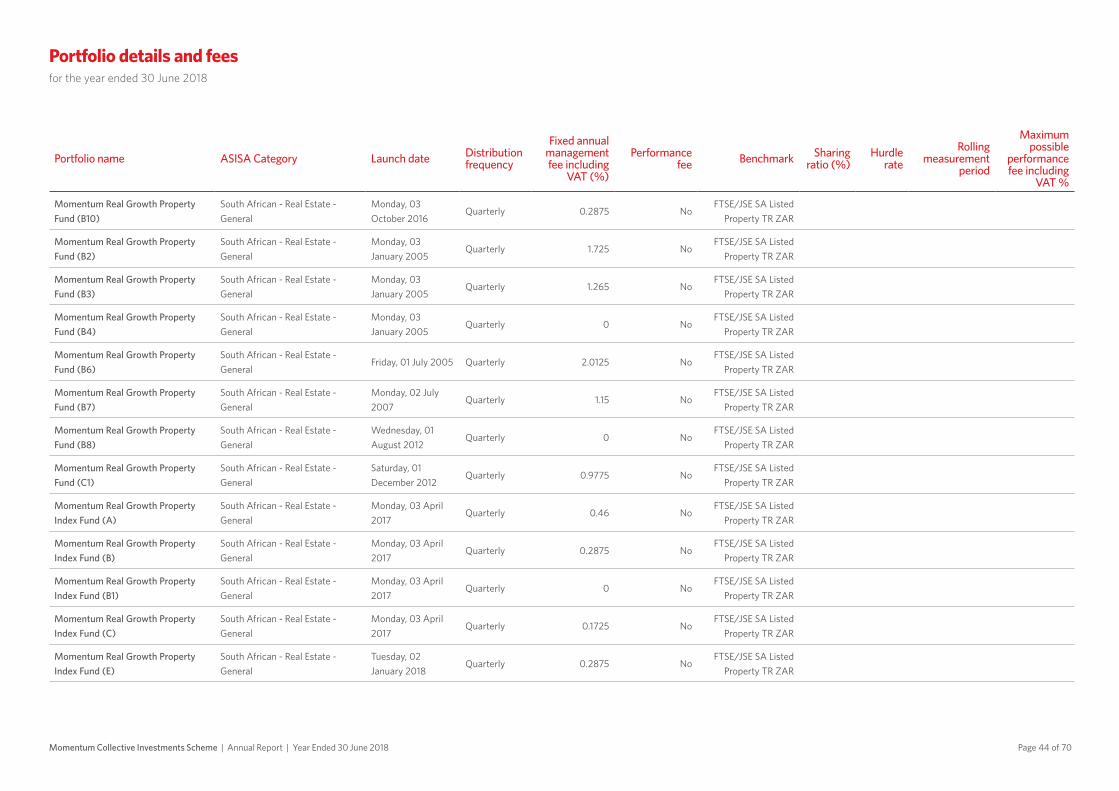
Portfolio details and feesfor the year ended 30 June 2018
Page 44 of 70Momentum Collective Investments Scheme | Annual Report | Year Ended 30 June 2018
Portfolio name ASISA Category Launch date Distribution frequency
Fixed annual management fee including
VAT (%)
Performance fee Benchmark Sharing
ratio (%)Hurdle
rate Rolling
measurement period
Maximum possible
performance fee including
VAT %
Momentum Real Growth Property Fund (B10)
South African - Real Estate - General
Monday, 03 October 2016
Quarterly 0.2875 NoFTSE/JSE SA Listed
Property TR ZAR
Momentum Real Growth Property Fund (B2)
South African - Real Estate - General
Monday, 03 January 2005
Quarterly 1.725 NoFTSE/JSE SA Listed
Property TR ZAR
Momentum Real Growth Property Fund (B3)
South African - Real Estate - General
Monday, 03 January 2005
Quarterly 1.265 NoFTSE/JSE SA Listed
Property TR ZAR
Momentum Real Growth Property Fund (B4)
South African - Real Estate - General
Monday, 03 January 2005
Quarterly 0 NoFTSE/JSE SA Listed
Property TR ZAR
Momentum Real Growth Property Fund (B6)
South African - Real Estate - General
Friday, 01 July 2005 Quarterly 2.0125 NoFTSE/JSE SA Listed
Property TR ZAR
Momentum Real Growth Property Fund (B7)
South African - Real Estate - General
Monday, 02 July 2007
Quarterly 1.15 NoFTSE/JSE SA Listed
Property TR ZAR
Momentum Real Growth Property Fund (B8)
South African - Real Estate - General
Wednesday, 01 August 2012
Quarterly 0 NoFTSE/JSE SA Listed
Property TR ZAR
Momentum Real Growth Property Fund (C1)
South African - Real Estate - General
Saturday, 01 December 2012
Quarterly 0.9775 NoFTSE/JSE SA Listed
Property TR ZAR
Momentum Real Growth Property Index Fund (A)
South African - Real Estate - General
Monday, 03 April 2017
Quarterly 0.46 NoFTSE/JSE SA Listed
Property TR ZAR
Momentum Real Growth Property Index Fund (B)
South African - Real Estate - General
Monday, 03 April 2017
Quarterly 0.2875 NoFTSE/JSE SA Listed
Property TR ZAR
Momentum Real Growth Property Index Fund (B1)
South African - Real Estate - General
Monday, 03 April 2017
Quarterly 0 NoFTSE/JSE SA Listed
Property TR ZAR
Momentum Real Growth Property Index Fund (C)
South African - Real Estate - General
Monday, 03 April 2017
Quarterly 0.1725 NoFTSE/JSE SA Listed
Property TR ZAR
Momentum Real Growth Property Index Fund (E)
South African - Real Estate - General
Tuesday, 02 January 2018
Quarterly 0.2875 NoFTSE/JSE SA Listed
Property TR ZAR

Portfolio details and feesfor the year ended 30 June 2018
Page 45 of 70 Momentum Collective Investments Scheme | Annual Report | Year Ended 30 June 2018
Portfolio name ASISA Category Launch date Distribution frequency
Fixed annual management fee including
VAT (%)
Performance fee Benchmark Sharing
ratio (%)Hurdle
rate Rolling
measurement period
Maximum possible
performance fee including
VAT %
Momentum Real Growth Property Index Fund (G)
South African - Real Estate - General
Tuesday, 02 January 2018
Quarterly 0.2875 NoFTSE/JSE SA Listed
Property TR ZAR
Momentum Resources Fund (A)South African - Equity - Resources
Monday, 02 July 2007
BiAnnual 1.725 NoFTSE/JSE SA
Resources TR ZAR
Momentum Resources Fund (B1)South African - Equity - Resources
Wednesday, 07 December 2011
BiAnnual 0 NoFTSE/JSE SA
Resources TR ZAR
Momentum SA Defensive Growth Fund (A)
South African - Multi Asset - Low Equity
Monday, 03 April 2017
Quarterly 1.5525 No(ASISA) South African
MA Low Equity
Momentum SA Defensive Growth Fund (B)
South African - Multi Asset - Low Equity
Monday, 03 April 2017
Quarterly 0.2875 No(ASISA) South African
MA Low Equity
Momentum SA Defensive Growth Fund (B1)
South African - Multi Asset - Low Equity
Monday, 03 April 2017
Quarterly 0 No(ASISA) South African
MA Low Equity
Momentum SA Defensive Growth Fund (C)
South African - Multi Asset - Low Equity
Monday, 03 April 2017
Quarterly 1.0925 No(ASISA) South African
MA Low Equity
Momentum SA Defensive Growth Fund (E)
South African - Multi Asset - Low Equity
Tuesday, 02 January 2018
Quarterly 0.805 No(ASISA) South African
MA Low Equity
Momentum SA Flexible Fixed Interest Fund (A)
South African - Multi Asset - Income
Monday, 03 April 2017
Quarterly 1.15 No(ASISA) South
African MA Income
Momentum SA Flexible Fixed Interest Fund (B)
South African - Multi Asset - Income
Monday, 03 April 2017
Quarterly 0.4025 No(ASISA) South
African MA Income
Momentum SA Flexible Fixed Interest Fund (B1)
South African - Multi Asset - Income
Monday, 03 April 2017
Quarterly 0 No(ASISA) South
African MA Income
Momentum SA Flexible Fixed Interest Fund (C)
South African - Multi Asset - Income
Monday, 03 April 2017
Quarterly 0.69 No(ASISA) South
African MA Income
Momentum SA Flexible Fixed Interest Fund (E)
South African - Multi Asset - Income
Tuesday, 02 January 2018
Quarterly 0.46 No(ASISA) South
African MA Income

Portfolio details and feesfor the year ended 30 June 2018
Page 46 of 70Momentum Collective Investments Scheme | Annual Report | Year Ended 30 June 2018
Portfolio name ASISA Category Launch date Distribution frequency
Fixed annual management fee including
VAT (%)
Performance fee Benchmark Sharing
ratio (%)Hurdle
rate Rolling
measurement period
Maximum possible
performance fee including
VAT %
Momentum SA Real Growth Property Fund (A)
South African - Real Estate - General
Monday, 03 April 2017
Quarterly 1.4375 NoFTSE/JSE SA Listed
Property TR ZAR
Momentum SA Real Growth Property Fund (B)
South African - Real Estate - General
Monday, 03 April 2017
Quarterly 0.2875 NoFTSE/JSE SA Listed
Property TR ZAR
Momentum SA Real Growth Property Fund (B1)
South African - Real Estate - General
Monday, 03 April 2017
Quarterly 0 NoFTSE/JSE SA Listed
Property TR ZAR
Momentum SA Real Growth Property Fund (C)
South African - Real Estate - General
Monday, 03 April 2017
Quarterly 0.9775 NoFTSE/JSE SA Listed
Property TR ZAR
Momentum SA Real Growth Property Fund (E)
South African - Real Estate - General
Tuesday, 02 January 2018
Quarterly 0.46 NoFTSE/JSE SA Listed
Property TR ZAR
Momentum Small/Mid-Cap Fund (A)
South African - Equity - Mid & Small Cap
Wednesday, 26 April 2000
BiAnnual 1.725 YesFTSE/JSE All Share
SWIX TR ZAR15 0 1 1.15
Momentum Small/Mid-Cap Fund (B1)
South African - Equity - Mid & Small Cap
Tuesday, 02 April 2002
BiAnnual 2.99 NoFTSE/JSE All Share
SWIX TR ZAR
Momentum Small/Mid-Cap Fund (B2)
South African - Equity - Mid & Small Cap
Monday, 03 January 2005
BiAnnual 2.0125 NoFTSE/JSE All Share
SWIX TR ZAR
Momentum Small/Mid-Cap Fund (B3)
South African - Equity - Mid & Small Cap
Monday, 02 July 2007
BiAnnual 1.4375 NoFTSE/JSE All Share
SWIX TR ZAR
Momentum Small/Mid-Cap Fund (B4)
South African - Equity - Mid & Small Cap
Monday, 01 August 2011
BiAnnual 0 NoFTSE/JSE All Share
SWIX TR ZAR
Momentum Small/Mid-Cap Fund (C1)
South African - Equity - Mid & Small Cap
Saturday, 01 December 2012
BiAnnual 1.0925 YesFTSE/JSE All Share
SWIX TR ZAR15 0 1 1.15
Momentum Target Cautious Growth Fund of Funds (A)
South African - Multi Asset - Low Equity
Monday, 03 April 2017
Quarterly 0.69 NoCPI + 2% p.a. over a 3 year rolling period
Momentum Target Cautious Growth Fund of Funds (B)
South African - Multi Asset - Low Equity
Monday, 03 April 2017
Quarterly 0 NoCPI + 2% p.a. over a 3 year rolling period
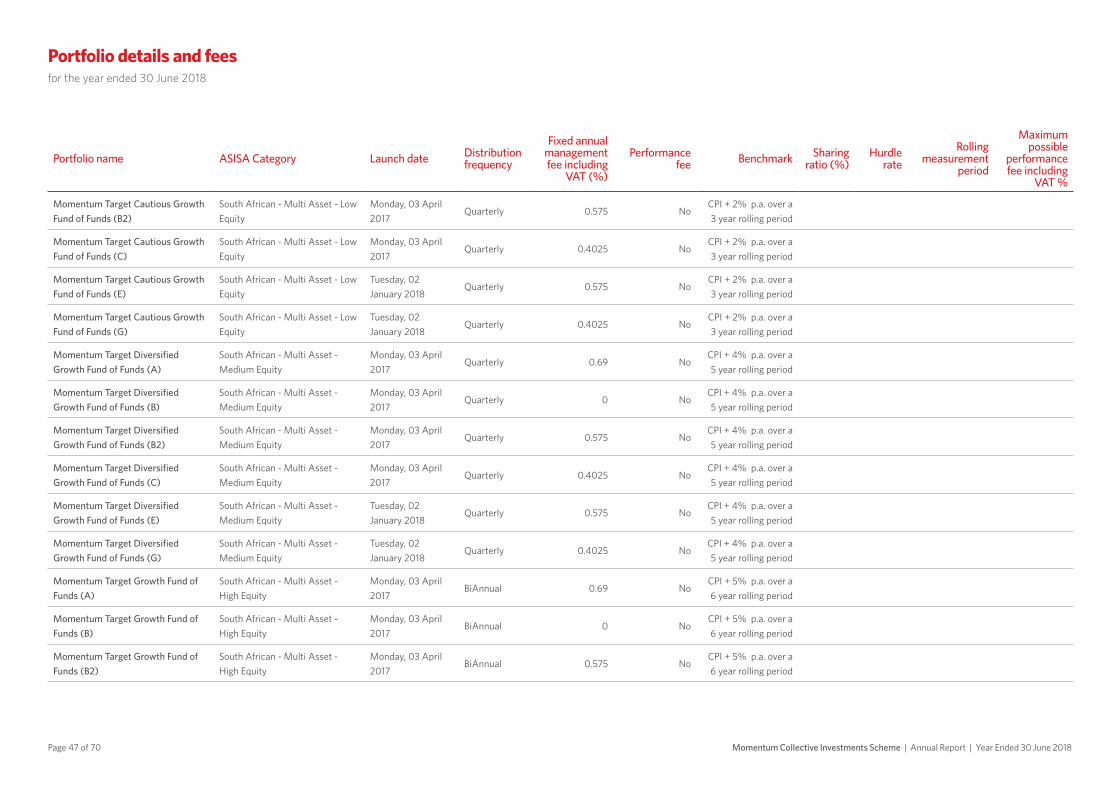
Portfolio details and feesfor the year ended 30 June 2018
Page 47 of 70 Momentum Collective Investments Scheme | Annual Report | Year Ended 30 June 2018
Portfolio name ASISA Category Launch date Distribution frequency
Fixed annual management fee including
VAT (%)
Performance fee Benchmark Sharing
ratio (%)Hurdle
rate Rolling
measurement period
Maximum possible
performance fee including
VAT %
Momentum Target Cautious Growth Fund of Funds (B2)
South African - Multi Asset - Low Equity
Monday, 03 April 2017
Quarterly 0.575 NoCPI + 2% p.a. over a 3 year rolling period
Momentum Target Cautious Growth Fund of Funds (C)
South African - Multi Asset - Low Equity
Monday, 03 April 2017
Quarterly 0.4025 NoCPI + 2% p.a. over a 3 year rolling period
Momentum Target Cautious Growth Fund of Funds (E)
South African - Multi Asset - Low Equity
Tuesday, 02 January 2018
Quarterly 0.575 NoCPI + 2% p.a. over a 3 year rolling period
Momentum Target Cautious Growth Fund of Funds (G)
South African - Multi Asset - Low Equity
Tuesday, 02 January 2018
Quarterly 0.4025 NoCPI + 2% p.a. over a 3 year rolling period
Momentum Target Diversified Growth Fund of Funds (A)
South African - Multi Asset - Medium Equity
Monday, 03 April 2017
Quarterly 0.69 NoCPI + 4% p.a. over a 5 year rolling period
Momentum Target Diversified Growth Fund of Funds (B)
South African - Multi Asset - Medium Equity
Monday, 03 April 2017
Quarterly 0 NoCPI + 4% p.a. over a 5 year rolling period
Momentum Target Diversified Growth Fund of Funds (B2)
South African - Multi Asset - Medium Equity
Monday, 03 April 2017
Quarterly 0.575 NoCPI + 4% p.a. over a 5 year rolling period
Momentum Target Diversified Growth Fund of Funds (C)
South African - Multi Asset - Medium Equity
Monday, 03 April 2017
Quarterly 0.4025 NoCPI + 4% p.a. over a 5 year rolling period
Momentum Target Diversified Growth Fund of Funds (E)
South African - Multi Asset - Medium Equity
Tuesday, 02 January 2018
Quarterly 0.575 NoCPI + 4% p.a. over a 5 year rolling period
Momentum Target Diversified Growth Fund of Funds (G)
South African - Multi Asset - Medium Equity
Tuesday, 02 January 2018
Quarterly 0.4025 NoCPI + 4% p.a. over a 5 year rolling period
Momentum Target Growth Fund of Funds (A)
South African - Multi Asset - High Equity
Monday, 03 April 2017
BiAnnual 0.69 NoCPI + 5% p.a. over a 6 year rolling period
Momentum Target Growth Fund of Funds (B)
South African - Multi Asset - High Equity
Monday, 03 April 2017
BiAnnual 0 NoCPI + 5% p.a. over a 6 year rolling period
Momentum Target Growth Fund of Funds (B2)
South African - Multi Asset - High Equity
Monday, 03 April 2017
BiAnnual 0.575 NoCPI + 5% p.a. over a 6 year rolling period

Portfolio details and feesfor the year ended 30 June 2018
Page 48 of 70Momentum Collective Investments Scheme | Annual Report | Year Ended 30 June 2018
Portfolio name ASISA Category Launch date Distribution frequency
Fixed annual management fee including
VAT (%)
Performance fee Benchmark Sharing
ratio (%)Hurdle
rate Rolling
measurement period
Maximum possible
performance fee including
VAT %
Momentum Target Growth Fund of Funds (C)
South African - Multi Asset - High Equity
Monday, 03 April 2017
BiAnnual 0.4025 NoCPI + 5% p.a. over a 6 year rolling period
Momentum Target Growth Fund of Funds (E)
South African - Multi Asset - High Equity
Tuesday, 02 January 2018
BiAnnual 0.6325 NoCPI + 5% p.a. over a 6 year rolling period
Momentum Target Growth Fund of Funds (G)
South African - Multi Asset - High Equity
Tuesday, 02 January 2018
BiAnnual 0.4025 NoCPI + 5% p.a. over a 6 year rolling period
Momentum Target Growth Plus Fund of Funds (A)
South African - Multi Asset - High Equity
Monday, 03 April 2017
BiAnnual 0.69 NoCPI + 6% p.a. over periods longer than
rolling 7 years
Momentum Target Growth Plus Fund of Funds (B)
South African - Multi Asset - High Equity
Monday, 03 April 2017
BiAnnual 0 NoCPI + 6% p.a. over periods longer than
rolling 7 years
Momentum Target Growth Plus Fund of Funds (B2)
South African - Multi Asset - High Equity
Monday, 03 April 2017
BiAnnual 0.575 NoCPI + 6% p.a. over periods longer than
rolling 7 years
Momentum Target Growth Plus Fund of Funds (C)
South African - Multi Asset - High Equity
Monday, 03 April 2017
BiAnnual 0.4025 NoCPI + 6% p.a. over periods longer than
rolling 7 years
Momentum Target Growth Plus Fund of Funds (E)
South African - Multi Asset - High Equity
Tuesday, 02 January 2018
BiAnnual 0.6325 NoCPI + 6% p.a. over periods longer than
rolling 7 years
Momentum Target Growth Plus Fund of Funds (G)
South African - Multi Asset - High Equity
Tuesday, 02 January 2018
BiAnnual 0.4025 NoCPI + 6% p.a. over periods longer than
rolling 7 years
Momentum Target Stable Growth Fund of Funds (A)
South African - Multi Asset - Medium Equity
Monday, 03 April 2017
Quarterly 0.69 NoCPI + 3% p.a. over a 4 year rolling period

Portfolio details and feesfor the year ended 30 June 2018
Page 49 of 70 Momentum Collective Investments Scheme | Annual Report | Year Ended 30 June 2018
Portfolio name ASISA Category Launch date Distribution frequency
Fixed annual management fee including
VAT (%)
Performance fee Benchmark Sharing
ratio (%)Hurdle
rate Rolling
measurement period
Maximum possible
performance fee including
VAT %
Momentum Target Stable Growth Fund of Funds (B)
South African - Multi Asset - Medium Equity
Monday, 03 April 2017
Quarterly 0 NoCPI + 3% p.a. over a 4 year rolling period
Momentum Target Stable Growth Fund of Funds (B2)
South African - Multi Asset - Medium Equity
Monday, 03 April 2017
Quarterly 0.575 NoCPI + 3% p.a. over a 4 year rolling period
Momentum Target Stable Growth Fund of Funds (C)
South African - Multi Asset - Medium Equity
Monday, 03 April 2017
Quarterly 0.4025 NoCPI + 3% p.a. over a 4 year rolling period
Momentum Target Stable Growth Fund of Funds (E)
South African - Multi Asset - Medium Equity
Tuesday, 02 January 2018
Quarterly 0.6325 NoCPI + 3% p.a. over a 4 year rolling period
Momentum Target Stable Growth Fund of Funds (G)
South African - Multi Asset - Medium Equity
Tuesday, 02 January 2018
Quarterly 0.4025 NoCPI + 3% p.a. over a 4 year rolling period
Momentum Top 40 Index Fund (A) South African - Equity - Large CapMonday, 01 January 1996
Quarterly 0.575 NoFTSE/JSE Top 40 TR
ZAR
Momentum Top 40 Index Fund (B1) South African - Equity - Large CapFriday, 01 October 2004
Quarterly 2.1275 NoFTSE/JSE Top 40 TR
ZAR
Momentum Top 40 Index Fund (B2) South African - Equity - Large CapMonday, 03 January 2005
Quarterly 1.4375 NoFTSE/JSE Top 40 TR
ZAR
Momentum Top 40 Index Fund (B3) South African - Equity - Large CapMonday, 02 July 2007
Quarterly 0.2875 NoFTSE/JSE Top 40 TR
ZAR
Momentum Top 40 Index Fund (B5) South African - Equity - Large CapFriday, 02 January 2015
Quarterly 0 NoFTSE/JSE Top 40 TR
ZAR
Momentum Trending Equity Fund (A)
South African - Equity - GeneralMonday, 03 April 2017
Quarterly 0.5175 NoFTSE/JSE Capped
SWIX (J433T)
Momentum Trending Equity Fund (B) South African - Equity - GeneralMonday, 03 April 2017
Quarterly 0.345 NoFTSE/JSE Capped
SWIX (J433T)
Momentum Trending Equity Fund (B1)
South African - Equity - GeneralMonday, 03 April 2017
Quarterly 0 NoFTSE/JSE Capped
SWIX (J433T)
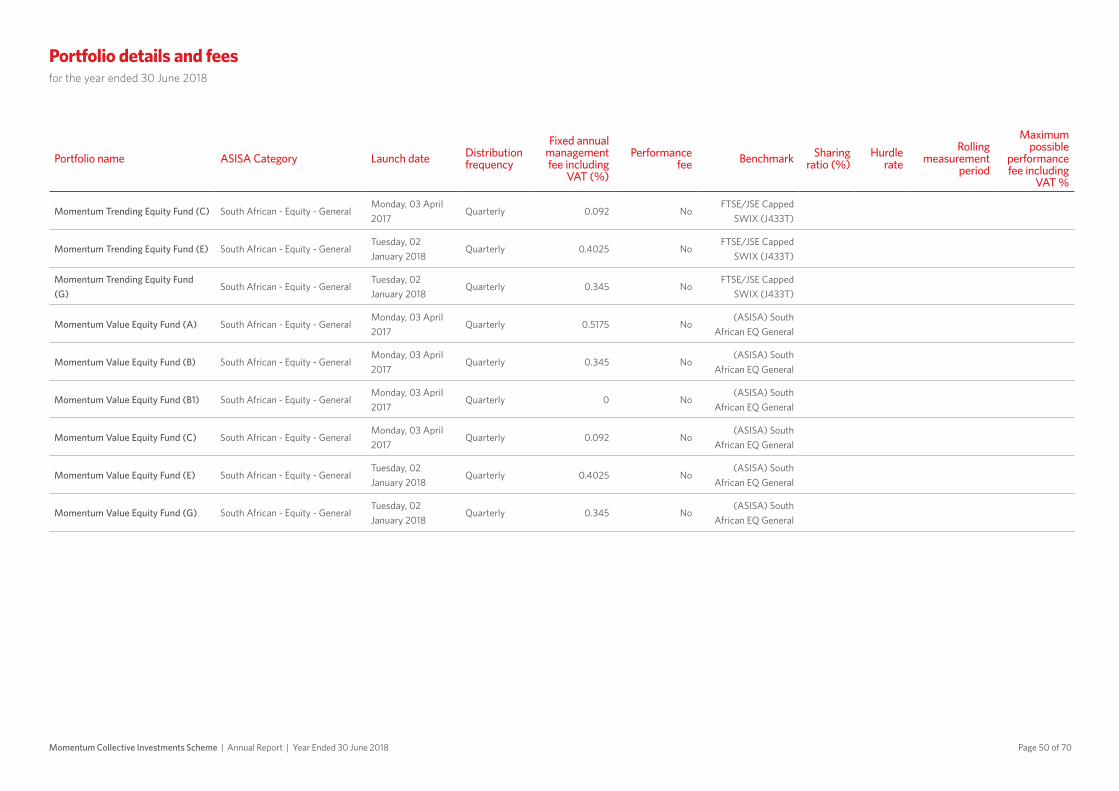
Portfolio details and feesfor the year ended 30 June 2018
Page 50 of 70Momentum Collective Investments Scheme | Annual Report | Year Ended 30 June 2018
Portfolio name ASISA Category Launch date Distribution frequency
Fixed annual management fee including
VAT (%)
Performance fee Benchmark Sharing
ratio (%)Hurdle
rate Rolling
measurement period
Maximum possible
performance fee including
VAT %
Momentum Trending Equity Fund (C) South African - Equity - GeneralMonday, 03 April 2017
Quarterly 0.092 NoFTSE/JSE Capped
SWIX (J433T)
Momentum Trending Equity Fund (E) South African - Equity - GeneralTuesday, 02 January 2018
Quarterly 0.4025 NoFTSE/JSE Capped
SWIX (J433T)
Momentum Trending Equity Fund (G)
South African - Equity - GeneralTuesday, 02 January 2018
Quarterly 0.345 NoFTSE/JSE Capped
SWIX (J433T)
Momentum Value Equity Fund (A) South African - Equity - GeneralMonday, 03 April 2017
Quarterly 0.5175 No(ASISA) South
African EQ General
Momentum Value Equity Fund (B) South African - Equity - GeneralMonday, 03 April 2017
Quarterly 0.345 No(ASISA) South
African EQ General
Momentum Value Equity Fund (B1) South African - Equity - GeneralMonday, 03 April 2017
Quarterly 0 No(ASISA) South
African EQ General
Momentum Value Equity Fund (C) South African - Equity - GeneralMonday, 03 April 2017
Quarterly 0.092 No(ASISA) South
African EQ General
Momentum Value Equity Fund (E) South African - Equity - GeneralTuesday, 02 January 2018
Quarterly 0.4025 No(ASISA) South
African EQ General
Momentum Value Equity Fund (G) South African - Equity - GeneralTuesday, 02 January 2018
Quarterly 0.345 No(ASISA) South
African EQ General
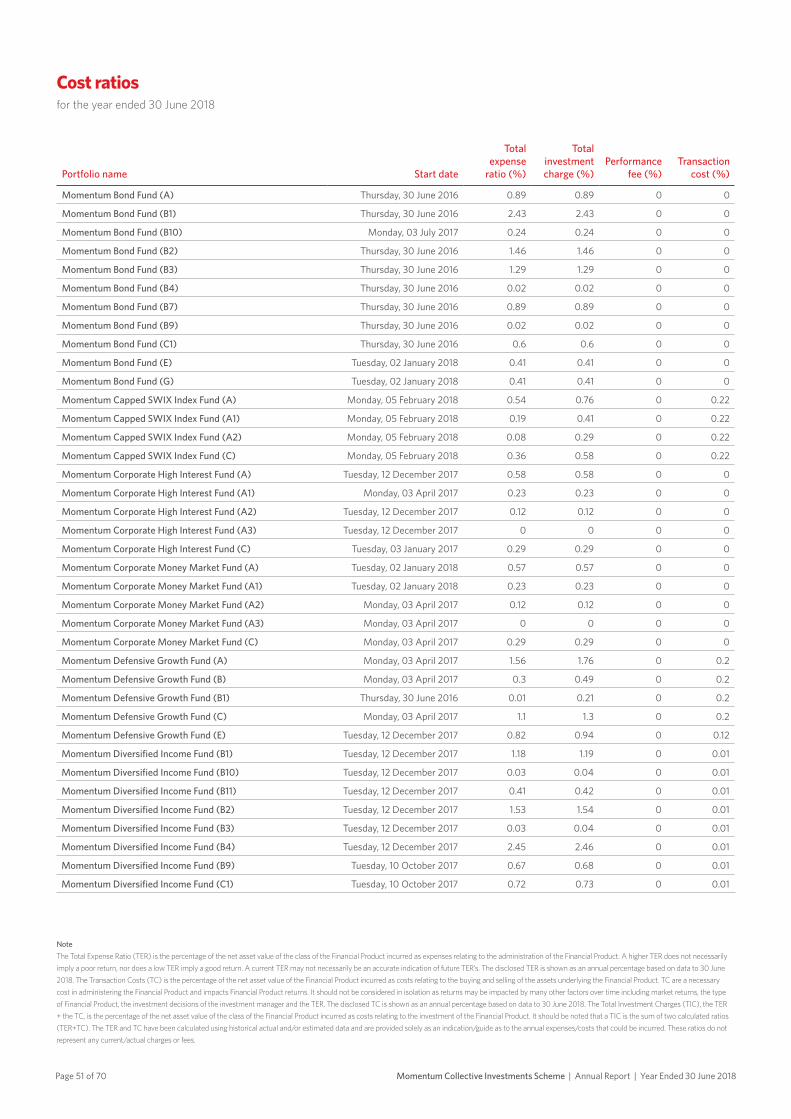
Page 51 of 70 Momentum Collective Investments Scheme | Annual Report | Year Ended 30 June 2018
NoteThe Total Expense Ratio (TER) is the percentage of the net asset value of the class of the Financial Product incurred as expenses relating to the administration of the Financial Product. A higher TER does not necessarily imply a poor return, nor does a low TER imply a good return. A current TER may not necessarily be an accurate indication of future TER’s. The disclosed TER is shown as an annual percentage based on data to 30 June 2018. The Transaction Costs (TC) is the percentage of the net asset value of the Financial Product incurred as costs relating to the buying and selling of the assets underlying the Financial Product. TC are a necessary cost in administering the Financial Product and impacts Financial Product returns. It should not be considered in isolation as returns may be impacted by many other factors over time including market returns, the type of Financial Product, the investment decisions of the investment manager and the TER. The disclosed TC is shown as an annual percentage based on data to 30 June 2018. The Total Investment Charges (TIC), the TER + the TC, is the percentage of the net asset value of the class of the Financial Product incurred as costs relating to the investment of the Financial Product. It should be noted that a TIC is the sum of two calculated ratios (TER+TC). The TER and TC have been calculated using historical actual and/or estimated data and are provided solely as an indication/guide as to the annual expenses/costs that could be incurred. These ratios do not represent any current/actual charges or fees.
Portfolio name Start date
Totalexpense
ratio (%)
Totalinvestment charge (%)
Performance fee (%)
Transaction cost (%)
Momentum Bond Fund (A) Thursday, 30 June 2016 0.89 0.89 0 0
Momentum Bond Fund (B1) Thursday, 30 June 2016 2.43 2.43 0 0
Momentum Bond Fund (B10) Monday, 03 July 2017 0.24 0.24 0 0
Momentum Bond Fund (B2) Thursday, 30 June 2016 1.46 1.46 0 0
Momentum Bond Fund (B3) Thursday, 30 June 2016 1.29 1.29 0 0
Momentum Bond Fund (B4) Thursday, 30 June 2016 0.02 0.02 0 0
Momentum Bond Fund (B7) Thursday, 30 June 2016 0.89 0.89 0 0
Momentum Bond Fund (B9) Thursday, 30 June 2016 0.02 0.02 0 0
Momentum Bond Fund (C1) Thursday, 30 June 2016 0.6 0.6 0 0
Momentum Bond Fund (E) Tuesday, 02 January 2018 0.41 0.41 0 0
Momentum Bond Fund (G) Tuesday, 02 January 2018 0.41 0.41 0 0
Momentum Capped SWIX Index Fund (A) Monday, 05 February 2018 0.54 0.76 0 0.22
Momentum Capped SWIX Index Fund (A1) Monday, 05 February 2018 0.19 0.41 0 0.22
Momentum Capped SWIX Index Fund (A2) Monday, 05 February 2018 0.08 0.29 0 0.22
Momentum Capped SWIX Index Fund (C) Monday, 05 February 2018 0.36 0.58 0 0.22
Momentum Corporate High Interest Fund (A) Tuesday, 12 December 2017 0.58 0.58 0 0
Momentum Corporate High Interest Fund (A1) Monday, 03 April 2017 0.23 0.23 0 0
Momentum Corporate High Interest Fund (A2) Tuesday, 12 December 2017 0.12 0.12 0 0
Momentum Corporate High Interest Fund (A3) Tuesday, 12 December 2017 0 0 0 0
Momentum Corporate High Interest Fund (C) Tuesday, 03 January 2017 0.29 0.29 0 0
Momentum Corporate Money Market Fund (A) Tuesday, 02 January 2018 0.57 0.57 0 0
Momentum Corporate Money Market Fund (A1) Tuesday, 02 January 2018 0.23 0.23 0 0
Momentum Corporate Money Market Fund (A2) Monday, 03 April 2017 0.12 0.12 0 0
Momentum Corporate Money Market Fund (A3) Monday, 03 April 2017 0 0 0 0
Momentum Corporate Money Market Fund (C) Monday, 03 April 2017 0.29 0.29 0 0
Momentum Defensive Growth Fund (A) Monday, 03 April 2017 1.56 1.76 0 0.2
Momentum Defensive Growth Fund (B) Monday, 03 April 2017 0.3 0.49 0 0.2
Momentum Defensive Growth Fund (B1) Thursday, 30 June 2016 0.01 0.21 0 0.2
Momentum Defensive Growth Fund (C) Monday, 03 April 2017 1.1 1.3 0 0.2
Momentum Defensive Growth Fund (E) Tuesday, 12 December 2017 0.82 0.94 0 0.12
Momentum Diversified Income Fund (B1) Tuesday, 12 December 2017 1.18 1.19 0 0.01
Momentum Diversified Income Fund (B10) Tuesday, 12 December 2017 0.03 0.04 0 0.01
Momentum Diversified Income Fund (B11) Tuesday, 12 December 2017 0.41 0.42 0 0.01
Momentum Diversified Income Fund (B2) Tuesday, 12 December 2017 1.53 1.54 0 0.01
Momentum Diversified Income Fund (B3) Tuesday, 12 December 2017 0.03 0.04 0 0.01
Momentum Diversified Income Fund (B4) Tuesday, 12 December 2017 2.45 2.46 0 0.01
Momentum Diversified Income Fund (B9) Tuesday, 10 October 2017 0.67 0.68 0 0.01
Momentum Diversified Income Fund (C1) Tuesday, 10 October 2017 0.72 0.73 0 0.01
Cost ratiosfor the year ended 30 June 2018
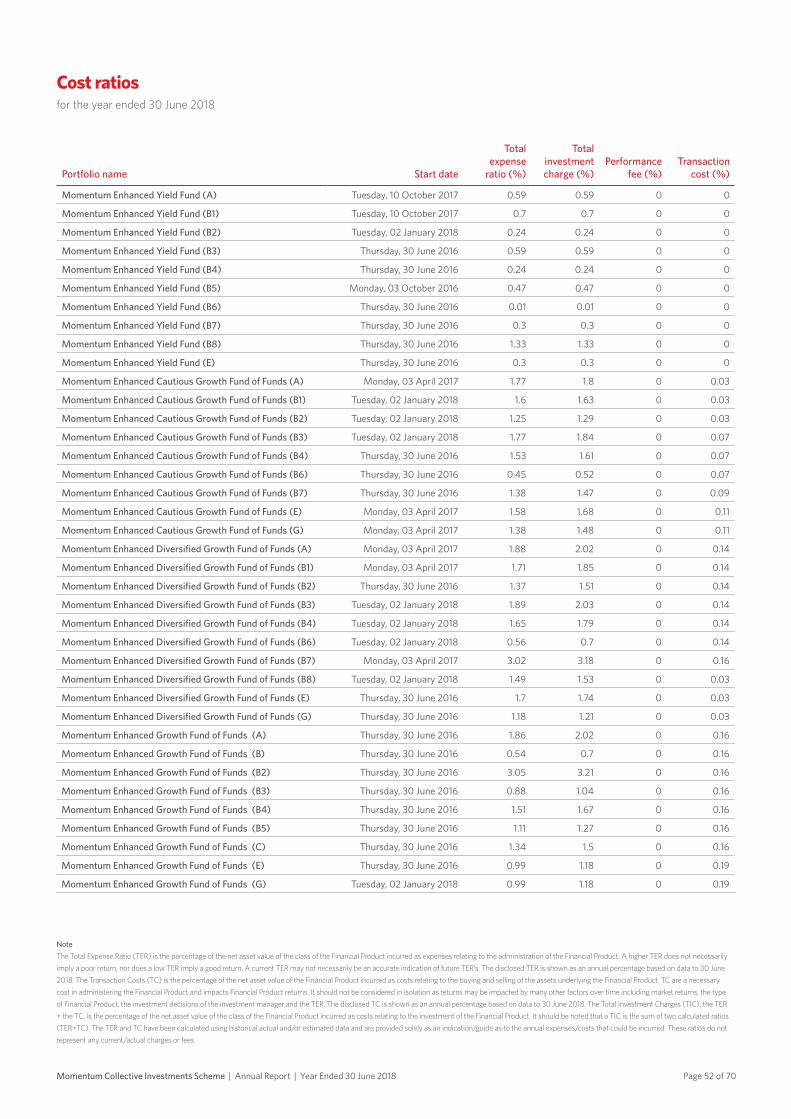
Page 52 of 70Momentum Collective Investments Scheme | Annual Report | Year Ended 30 June 2018
NoteThe Total Expense Ratio (TER) is the percentage of the net asset value of the class of the Financial Product incurred as expenses relating to the administration of the Financial Product. A higher TER does not necessarily imply a poor return, nor does a low TER imply a good return. A current TER may not necessarily be an accurate indication of future TER’s. The disclosed TER is shown as an annual percentage based on data to 30 June 2018. The Transaction Costs (TC) is the percentage of the net asset value of the Financial Product incurred as costs relating to the buying and selling of the assets underlying the Financial Product. TC are a necessary cost in administering the Financial Product and impacts Financial Product returns. It should not be considered in isolation as returns may be impacted by many other factors over time including market returns, the type of Financial Product, the investment decisions of the investment manager and the TER. The disclosed TC is shown as an annual percentage based on data to 30 June 2018. The Total Investment Charges (TIC), the TER + the TC, is the percentage of the net asset value of the class of the Financial Product incurred as costs relating to the investment of the Financial Product. It should be noted that a TIC is the sum of two calculated ratios (TER+TC). The TER and TC have been calculated using historical actual and/or estimated data and are provided solely as an indication/guide as to the annual expenses/costs that could be incurred. These ratios do not represent any current/actual charges or fees.
Portfolio name Start date
Totalexpense
ratio (%)
Totalinvestment charge (%)
Performance fee (%)
Transaction cost (%)
Momentum Enhanced Yield Fund (A) Tuesday, 10 October 2017 0.59 0.59 0 0
Momentum Enhanced Yield Fund (B1) Tuesday, 10 October 2017 0.7 0.7 0 0
Momentum Enhanced Yield Fund (B2) Tuesday, 02 January 2018 0.24 0.24 0 0
Momentum Enhanced Yield Fund (B3) Thursday, 30 June 2016 0.59 0.59 0 0
Momentum Enhanced Yield Fund (B4) Thursday, 30 June 2016 0.24 0.24 0 0
Momentum Enhanced Yield Fund (B5) Monday, 03 October 2016 0.47 0.47 0 0
Momentum Enhanced Yield Fund (B6) Thursday, 30 June 2016 0.01 0.01 0 0
Momentum Enhanced Yield Fund (B7) Thursday, 30 June 2016 0.3 0.3 0 0
Momentum Enhanced Yield Fund (B8) Thursday, 30 June 2016 1.33 1.33 0 0
Momentum Enhanced Yield Fund (E) Thursday, 30 June 2016 0.3 0.3 0 0
Momentum Enhanced Cautious Growth Fund of Funds (A) Monday, 03 April 2017 1.77 1.8 0 0.03
Momentum Enhanced Cautious Growth Fund of Funds (B1) Tuesday, 02 January 2018 1.6 1.63 0 0.03
Momentum Enhanced Cautious Growth Fund of Funds (B2) Tuesday, 02 January 2018 1.25 1.29 0 0.03
Momentum Enhanced Cautious Growth Fund of Funds (B3) Tuesday, 02 January 2018 1.77 1.84 0 0.07
Momentum Enhanced Cautious Growth Fund of Funds (B4) Thursday, 30 June 2016 1.53 1.61 0 0.07
Momentum Enhanced Cautious Growth Fund of Funds (B6) Thursday, 30 June 2016 0.45 0.52 0 0.07
Momentum Enhanced Cautious Growth Fund of Funds (B7) Thursday, 30 June 2016 1.38 1.47 0 0.09
Momentum Enhanced Cautious Growth Fund of Funds (E) Monday, 03 April 2017 1.58 1.68 0 0.11
Momentum Enhanced Cautious Growth Fund of Funds (G) Monday, 03 April 2017 1.38 1.48 0 0.11
Momentum Enhanced Diversified Growth Fund of Funds (A) Monday, 03 April 2017 1.88 2.02 0 0.14
Momentum Enhanced Diversified Growth Fund of Funds (B1) Monday, 03 April 2017 1.71 1.85 0 0.14
Momentum Enhanced Diversified Growth Fund of Funds (B2) Thursday, 30 June 2016 1.37 1.51 0 0.14
Momentum Enhanced Diversified Growth Fund of Funds (B3) Tuesday, 02 January 2018 1.89 2.03 0 0.14
Momentum Enhanced Diversified Growth Fund of Funds (B4) Tuesday, 02 January 2018 1.65 1.79 0 0.14
Momentum Enhanced Diversified Growth Fund of Funds (B6) Tuesday, 02 January 2018 0.56 0.7 0 0.14
Momentum Enhanced Diversified Growth Fund of Funds (B7) Monday, 03 April 2017 3.02 3.18 0 0.16
Momentum Enhanced Diversified Growth Fund of Funds (B8) Tuesday, 02 January 2018 1.49 1.53 0 0.03
Momentum Enhanced Diversified Growth Fund of Funds (E) Thursday, 30 June 2016 1.7 1.74 0 0.03
Momentum Enhanced Diversified Growth Fund of Funds (G) Thursday, 30 June 2016 1.18 1.21 0 0.03
Momentum Enhanced Growth Fund of Funds (A) Thursday, 30 June 2016 1.86 2.02 0 0.16
Momentum Enhanced Growth Fund of Funds (B) Thursday, 30 June 2016 0.54 0.7 0 0.16
Momentum Enhanced Growth Fund of Funds (B2) Thursday, 30 June 2016 3.05 3.21 0 0.16
Momentum Enhanced Growth Fund of Funds (B3) Thursday, 30 June 2016 0.88 1.04 0 0.16
Momentum Enhanced Growth Fund of Funds (B4) Thursday, 30 June 2016 1.51 1.67 0 0.16
Momentum Enhanced Growth Fund of Funds (B5) Thursday, 30 June 2016 1.11 1.27 0 0.16
Momentum Enhanced Growth Fund of Funds (C) Thursday, 30 June 2016 1.34 1.5 0 0.16
Momentum Enhanced Growth Fund of Funds (E) Thursday, 30 June 2016 0.99 1.18 0 0.19
Momentum Enhanced Growth Fund of Funds (G) Tuesday, 02 January 2018 0.99 1.18 0 0.19
Cost ratiosfor the year ended 30 June 2018
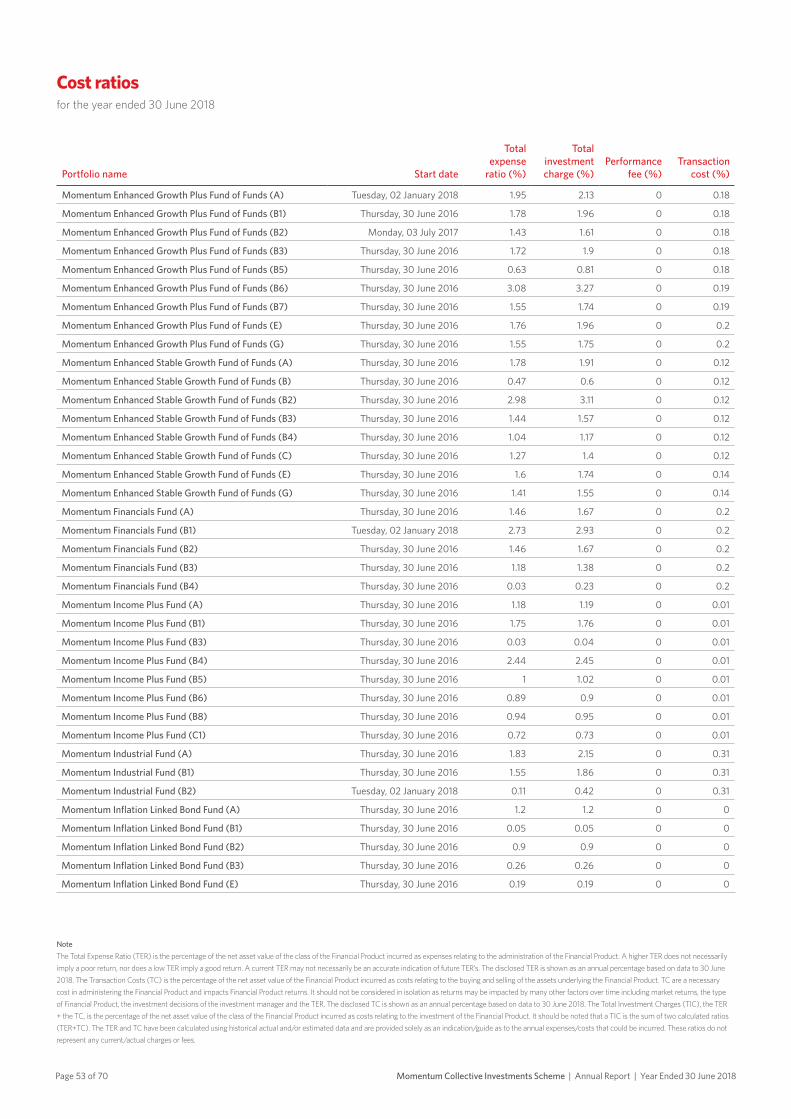
Page 53 of 70 Momentum Collective Investments Scheme | Annual Report | Year Ended 30 June 2018
Cost ratiosfor the year ended 30 June 2018
NoteThe Total Expense Ratio (TER) is the percentage of the net asset value of the class of the Financial Product incurred as expenses relating to the administration of the Financial Product. A higher TER does not necessarily imply a poor return, nor does a low TER imply a good return. A current TER may not necessarily be an accurate indication of future TER’s. The disclosed TER is shown as an annual percentage based on data to 30 June 2018. The Transaction Costs (TC) is the percentage of the net asset value of the Financial Product incurred as costs relating to the buying and selling of the assets underlying the Financial Product. TC are a necessary cost in administering the Financial Product and impacts Financial Product returns. It should not be considered in isolation as returns may be impacted by many other factors over time including market returns, the type of Financial Product, the investment decisions of the investment manager and the TER. The disclosed TC is shown as an annual percentage based on data to 30 June 2018. The Total Investment Charges (TIC), the TER + the TC, is the percentage of the net asset value of the class of the Financial Product incurred as costs relating to the investment of the Financial Product. It should be noted that a TIC is the sum of two calculated ratios (TER+TC). The TER and TC have been calculated using historical actual and/or estimated data and are provided solely as an indication/guide as to the annual expenses/costs that could be incurred. These ratios do not represent any current/actual charges or fees.
Portfolio name Start date
Totalexpense
ratio (%)
Totalinvestment charge (%)
Performance fee (%)
Transaction cost (%)
Momentum Enhanced Growth Plus Fund of Funds (A) Tuesday, 02 January 2018 1.95 2.13 0 0.18
Momentum Enhanced Growth Plus Fund of Funds (B1) Thursday, 30 June 2016 1.78 1.96 0 0.18
Momentum Enhanced Growth Plus Fund of Funds (B2) Monday, 03 July 2017 1.43 1.61 0 0.18
Momentum Enhanced Growth Plus Fund of Funds (B3) Thursday, 30 June 2016 1.72 1.9 0 0.18
Momentum Enhanced Growth Plus Fund of Funds (B5) Thursday, 30 June 2016 0.63 0.81 0 0.18
Momentum Enhanced Growth Plus Fund of Funds (B6) Thursday, 30 June 2016 3.08 3.27 0 0.19
Momentum Enhanced Growth Plus Fund of Funds (B7) Thursday, 30 June 2016 1.55 1.74 0 0.19
Momentum Enhanced Growth Plus Fund of Funds (E) Thursday, 30 June 2016 1.76 1.96 0 0.2
Momentum Enhanced Growth Plus Fund of Funds (G) Thursday, 30 June 2016 1.55 1.75 0 0.2
Momentum Enhanced Stable Growth Fund of Funds (A) Thursday, 30 June 2016 1.78 1.91 0 0.12
Momentum Enhanced Stable Growth Fund of Funds (B) Thursday, 30 June 2016 0.47 0.6 0 0.12
Momentum Enhanced Stable Growth Fund of Funds (B2) Thursday, 30 June 2016 2.98 3.11 0 0.12
Momentum Enhanced Stable Growth Fund of Funds (B3) Thursday, 30 June 2016 1.44 1.57 0 0.12
Momentum Enhanced Stable Growth Fund of Funds (B4) Thursday, 30 June 2016 1.04 1.17 0 0.12
Momentum Enhanced Stable Growth Fund of Funds (C) Thursday, 30 June 2016 1.27 1.4 0 0.12
Momentum Enhanced Stable Growth Fund of Funds (E) Thursday, 30 June 2016 1.6 1.74 0 0.14
Momentum Enhanced Stable Growth Fund of Funds (G) Thursday, 30 June 2016 1.41 1.55 0 0.14
Momentum Financials Fund (A) Thursday, 30 June 2016 1.46 1.67 0 0.2
Momentum Financials Fund (B1) Tuesday, 02 January 2018 2.73 2.93 0 0.2
Momentum Financials Fund (B2) Thursday, 30 June 2016 1.46 1.67 0 0.2
Momentum Financials Fund (B3) Thursday, 30 June 2016 1.18 1.38 0 0.2
Momentum Financials Fund (B4) Thursday, 30 June 2016 0.03 0.23 0 0.2
Momentum Income Plus Fund (A) Thursday, 30 June 2016 1.18 1.19 0 0.01
Momentum Income Plus Fund (B1) Thursday, 30 June 2016 1.75 1.76 0 0.01
Momentum Income Plus Fund (B3) Thursday, 30 June 2016 0.03 0.04 0 0.01
Momentum Income Plus Fund (B4) Thursday, 30 June 2016 2.44 2.45 0 0.01
Momentum Income Plus Fund (B5) Thursday, 30 June 2016 1 1.02 0 0.01
Momentum Income Plus Fund (B6) Thursday, 30 June 2016 0.89 0.9 0 0.01
Momentum Income Plus Fund (B8) Thursday, 30 June 2016 0.94 0.95 0 0.01
Momentum Income Plus Fund (C1) Thursday, 30 June 2016 0.72 0.73 0 0.01
Momentum Industrial Fund (A) Thursday, 30 June 2016 1.83 2.15 0 0.31
Momentum Industrial Fund (B1) Thursday, 30 June 2016 1.55 1.86 0 0.31
Momentum Industrial Fund (B2) Tuesday, 02 January 2018 0.11 0.42 0 0.31
Momentum Inflation Linked Bond Fund (A) Thursday, 30 June 2016 1.2 1.2 0 0
Momentum Inflation Linked Bond Fund (B1) Thursday, 30 June 2016 0.05 0.05 0 0
Momentum Inflation Linked Bond Fund (B2) Thursday, 30 June 2016 0.9 0.9 0 0
Momentum Inflation Linked Bond Fund (B3) Thursday, 30 June 2016 0.26 0.26 0 0
Momentum Inflation Linked Bond Fund (E) Thursday, 30 June 2016 0.19 0.19 0 0

Page 54 of 70Momentum Collective Investments Scheme | Annual Report | Year Ended 30 June 2018
Cost ratiosfor the year ended 30 June 2018
NoteThe Total Expense Ratio (TER) is the percentage of the net asset value of the class of the Financial Product incurred as expenses relating to the administration of the Financial Product. A higher TER does not necessarily imply a poor return, nor does a low TER imply a good return. A current TER may not necessarily be an accurate indication of future TER’s. The disclosed TER is shown as an annual percentage based on data to 30 June 2018. The Transaction Costs (TC) is the percentage of the net asset value of the Financial Product incurred as costs relating to the buying and selling of the assets underlying the Financial Product. TC are a necessary cost in administering the Financial Product and impacts Financial Product returns. It should not be considered in isolation as returns may be impacted by many other factors over time including market returns, the type of Financial Product, the investment decisions of the investment manager and the TER. The disclosed TC is shown as an annual percentage based on data to 30 June 2018. The Total Investment Charges (TIC), the TER + the TC, is the percentage of the net asset value of the class of the Financial Product incurred as costs relating to the investment of the Financial Product. It should be noted that a TIC is the sum of two calculated ratios (TER+TC). The TER and TC have been calculated using historical actual and/or estimated data and are provided solely as an indication/guide as to the annual expenses/costs that could be incurred. These ratios do not represent any current/actual charges or fees.
Portfolio name Start date
Totalexpense
ratio (%)
Totalinvestment charge (%)
Performance fee (%)
Transaction cost (%)
Momentum International Balanced Feeder Fund (A) Thursday, 30 June 2016 2.39 2.39 0 0
Momentum International Balanced Feeder Fund (B1) Tuesday, 03 January 2017 3.61 3.61 0 0
Momentum International Balanced Feeder Fund (B2) Tuesday, 02 January 2018 3.09 3.09 0 0
Momentum International Balanced Feeder Fund (B3) Thursday, 30 June 2016 2.6 2.6 0 0
Momentum International Balanced Feeder Fund (B4) Thursday, 30 June 2016 1.47 1.47 0 0
Momentum International Balanced Feeder Fund (B5) Thursday, 30 June 2016 3.34 3.34 0 0
Momentum International Balanced Feeder Fund (B7) Thursday, 30 June 2016 2.37 2.37 0 0
Momentum International Balanced Feeder Fund (C1) Thursday, 30 June 2016 1.92 1.92 0 0
Momentum International Balanced Feeder Fund (M1) Thursday, 30 June 2016 1.47 1.47 0 0
Momentum International Conservative Feeder Fund (A) Thursday, 30 June 2016 2.22 2.22 0 0
Momentum International Conservative Feeder Fund (B1) Thursday, 30 June 2016 3.44 3.44 0 0
Momentum International Conservative Feeder Fund (B2) Thursday, 30 June 2016 3.19 3.19 0 0
Momentum International Conservative Feeder Fund (B3) Thursday, 30 June 2016 2.44 2.44 0 0
Momentum International Conservative Feeder Fund (B4) Thursday, 30 June 2016 1.3 1.3 0 0
Momentum International Conservative Feeder Fund (C1) Thursday, 30 June 2016 1.76 1.76 0 0
Momentum International Conservative Feeder Fund (M1) Thursday, 30 June 2016 1.3 1.3 0 0
Momentum International Equity Feeder Fund (A) Thursday, 30 June 2016 1.87 1.87 0 0
Momentum International Equity Feeder Fund (B1) Thursday, 30 June 2016 3.58 3.58 0 0
Momentum International Equity Feeder Fund (B2) Thursday, 30 June 2016 0.96 0.96 0 0
Momentum International Equity Feeder Fund (C1) Thursday, 30 June 2016 1.41 1.41 0 0
Momentum International Equity Feeder Fund (M1) Thursday, 30 June 2016 0.96 0.96 0 0
Momentum International Income Fund (A) Thursday, 30 June 2016 1.06 1.06 0 0
Momentum International Income Fund (B1) Thursday, 30 June 2016 2.33 2.33 0 0
Momentum International Income Fund (B2) Thursday, 30 June 2016 1.34 1.34 0 0
Momentum International Income Fund (B3) Tuesday, 02 January 2018 1.3 1.3 0 0
Momentum International Income Fund (B4) Thursday, 30 June 2016 0.2 0.2 0 0
Momentum International Income Fund (B5) Thursday, 30 June 2016 2.02 2.02 0 0
Momentum International Income Fund (B6) Thursday, 30 June 2016 1.64 1.64 0 0
Momentum International Income Fund (B7) Tuesday, 02 January 2018 0.66 0.66 0 0
Momentum International Income Fund (C1) Tuesday, 02 January 2018 0.66 0.66 0 0
Momentum Mid & Small Cap Index Fund (A) Thursday, 30 June 2016 0.57 1.16 0 0.59
Momentum Mid & Small Cap Index Fund (B) Monday, 03 April 2017 0.39 0.98 0 0.59
Momentum Mid & Small Cap Index Fund (B1) Monday, 03 April 2017 0.1 0.69 0 0.59
Momentum Mid & Small Cap Index Fund (C) Thursday, 30 June 2016 0.22 0.81 0 0.59
Momentum Mid & Small Cap Index Fund (E) Thursday, 30 June 2016 0.37 0.54 0 0.16
Momentum Mid & Small Cap Index Fund (G) Thursday, 30 June 2016 0.37 0.54 0 0.16
Momentum Money Market Fund (A) Thursday, 30 June 2016 0.59 0.59 0 0
Momentum Money Market Fund (B10) Thursday, 30 June 2016 0.01 0.01 0 0
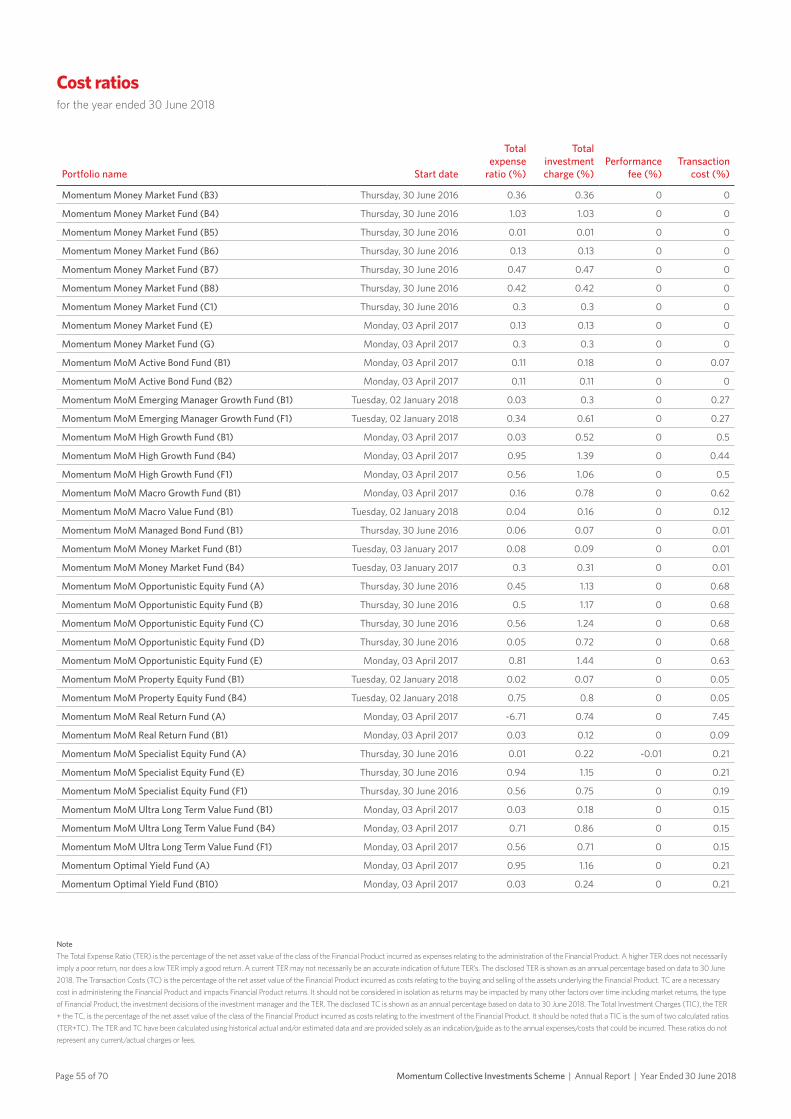
Page 55 of 70 Momentum Collective Investments Scheme | Annual Report | Year Ended 30 June 2018
Cost ratiosfor the year ended 30 June 2018
NoteThe Total Expense Ratio (TER) is the percentage of the net asset value of the class of the Financial Product incurred as expenses relating to the administration of the Financial Product. A higher TER does not necessarily imply a poor return, nor does a low TER imply a good return. A current TER may not necessarily be an accurate indication of future TER’s. The disclosed TER is shown as an annual percentage based on data to 30 June 2018. The Transaction Costs (TC) is the percentage of the net asset value of the Financial Product incurred as costs relating to the buying and selling of the assets underlying the Financial Product. TC are a necessary cost in administering the Financial Product and impacts Financial Product returns. It should not be considered in isolation as returns may be impacted by many other factors over time including market returns, the type of Financial Product, the investment decisions of the investment manager and the TER. The disclosed TC is shown as an annual percentage based on data to 30 June 2018. The Total Investment Charges (TIC), the TER + the TC, is the percentage of the net asset value of the class of the Financial Product incurred as costs relating to the investment of the Financial Product. It should be noted that a TIC is the sum of two calculated ratios (TER+TC). The TER and TC have been calculated using historical actual and/or estimated data and are provided solely as an indication/guide as to the annual expenses/costs that could be incurred. These ratios do not represent any current/actual charges or fees.
Portfolio name Start date
Totalexpense
ratio (%)
Totalinvestment charge (%)
Performance fee (%)
Transaction cost (%)
Momentum Money Market Fund (B3) Thursday, 30 June 2016 0.36 0.36 0 0
Momentum Money Market Fund (B4) Thursday, 30 June 2016 1.03 1.03 0 0
Momentum Money Market Fund (B5) Thursday, 30 June 2016 0.01 0.01 0 0
Momentum Money Market Fund (B6) Thursday, 30 June 2016 0.13 0.13 0 0
Momentum Money Market Fund (B7) Thursday, 30 June 2016 0.47 0.47 0 0
Momentum Money Market Fund (B8) Thursday, 30 June 2016 0.42 0.42 0 0
Momentum Money Market Fund (C1) Thursday, 30 June 2016 0.3 0.3 0 0
Momentum Money Market Fund (E) Monday, 03 April 2017 0.13 0.13 0 0
Momentum Money Market Fund (G) Monday, 03 April 2017 0.3 0.3 0 0
Momentum MoM Active Bond Fund (B1) Monday, 03 April 2017 0.11 0.18 0 0.07
Momentum MoM Active Bond Fund (B2) Monday, 03 April 2017 0.11 0.11 0 0
Momentum MoM Emerging Manager Growth Fund (B1) Tuesday, 02 January 2018 0.03 0.3 0 0.27
Momentum MoM Emerging Manager Growth Fund (F1) Tuesday, 02 January 2018 0.34 0.61 0 0.27
Momentum MoM High Growth Fund (B1) Monday, 03 April 2017 0.03 0.52 0 0.5
Momentum MoM High Growth Fund (B4) Monday, 03 April 2017 0.95 1.39 0 0.44
Momentum MoM High Growth Fund (F1) Monday, 03 April 2017 0.56 1.06 0 0.5
Momentum MoM Macro Growth Fund (B1) Monday, 03 April 2017 0.16 0.78 0 0.62
Momentum MoM Macro Value Fund (B1) Tuesday, 02 January 2018 0.04 0.16 0 0.12
Momentum MoM Managed Bond Fund (B1) Thursday, 30 June 2016 0.06 0.07 0 0.01
Momentum MoM Money Market Fund (B1) Tuesday, 03 January 2017 0.08 0.09 0 0.01
Momentum MoM Money Market Fund (B4) Tuesday, 03 January 2017 0.3 0.31 0 0.01
Momentum MoM Opportunistic Equity Fund (A) Thursday, 30 June 2016 0.45 1.13 0 0.68
Momentum MoM Opportunistic Equity Fund (B) Thursday, 30 June 2016 0.5 1.17 0 0.68
Momentum MoM Opportunistic Equity Fund (C) Thursday, 30 June 2016 0.56 1.24 0 0.68
Momentum MoM Opportunistic Equity Fund (D) Thursday, 30 June 2016 0.05 0.72 0 0.68
Momentum MoM Opportunistic Equity Fund (E) Monday, 03 April 2017 0.81 1.44 0 0.63
Momentum MoM Property Equity Fund (B1) Tuesday, 02 January 2018 0.02 0.07 0 0.05
Momentum MoM Property Equity Fund (B4) Tuesday, 02 January 2018 0.75 0.8 0 0.05
Momentum MoM Real Return Fund (A) Monday, 03 April 2017 -6.71 0.74 0 7.45
Momentum MoM Real Return Fund (B1) Monday, 03 April 2017 0.03 0.12 0 0.09
Momentum MoM Specialist Equity Fund (A) Thursday, 30 June 2016 0.01 0.22 -0.01 0.21
Momentum MoM Specialist Equity Fund (E) Thursday, 30 June 2016 0.94 1.15 0 0.21
Momentum MoM Specialist Equity Fund (F1) Thursday, 30 June 2016 0.56 0.75 0 0.19
Momentum MoM Ultra Long Term Value Fund (B1) Monday, 03 April 2017 0.03 0.18 0 0.15
Momentum MoM Ultra Long Term Value Fund (B4) Monday, 03 April 2017 0.71 0.86 0 0.15
Momentum MoM Ultra Long Term Value Fund (F1) Monday, 03 April 2017 0.56 0.71 0 0.15
Momentum Optimal Yield Fund (A) Monday, 03 April 2017 0.95 1.16 0 0.21
Momentum Optimal Yield Fund (B10) Monday, 03 April 2017 0.03 0.24 0 0.21
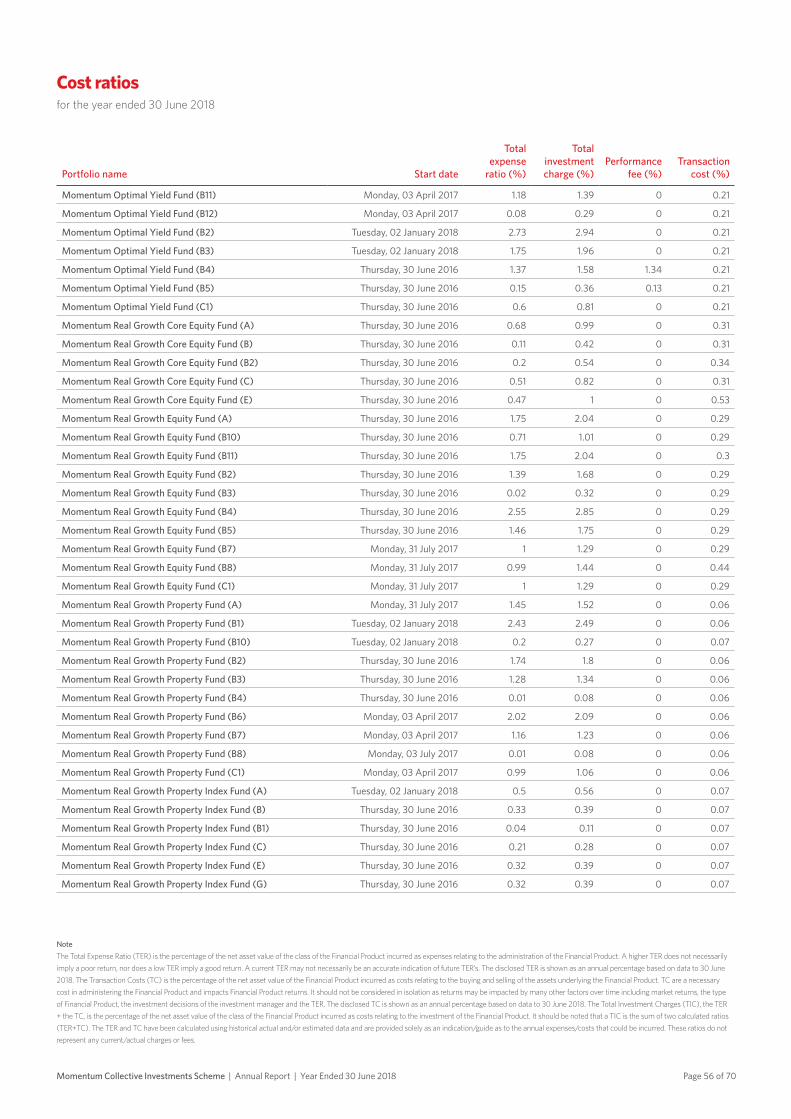
Page 56 of 70Momentum Collective Investments Scheme | Annual Report | Year Ended 30 June 2018
Cost ratiosfor the year ended 30 June 2018
NoteThe Total Expense Ratio (TER) is the percentage of the net asset value of the class of the Financial Product incurred as expenses relating to the administration of the Financial Product. A higher TER does not necessarily imply a poor return, nor does a low TER imply a good return. A current TER may not necessarily be an accurate indication of future TER’s. The disclosed TER is shown as an annual percentage based on data to 30 June 2018. The Transaction Costs (TC) is the percentage of the net asset value of the Financial Product incurred as costs relating to the buying and selling of the assets underlying the Financial Product. TC are a necessary cost in administering the Financial Product and impacts Financial Product returns. It should not be considered in isolation as returns may be impacted by many other factors over time including market returns, the type of Financial Product, the investment decisions of the investment manager and the TER. The disclosed TC is shown as an annual percentage based on data to 30 June 2018. The Total Investment Charges (TIC), the TER + the TC, is the percentage of the net asset value of the class of the Financial Product incurred as costs relating to the investment of the Financial Product. It should be noted that a TIC is the sum of two calculated ratios (TER+TC). The TER and TC have been calculated using historical actual and/or estimated data and are provided solely as an indication/guide as to the annual expenses/costs that could be incurred. These ratios do not represent any current/actual charges or fees.
Portfolio name Start date
Totalexpense
ratio (%)
Totalinvestment charge (%)
Performance fee (%)
Transaction cost (%)
Momentum Optimal Yield Fund (B11) Monday, 03 April 2017 1.18 1.39 0 0.21
Momentum Optimal Yield Fund (B12) Monday, 03 April 2017 0.08 0.29 0 0.21
Momentum Optimal Yield Fund (B2) Tuesday, 02 January 2018 2.73 2.94 0 0.21
Momentum Optimal Yield Fund (B3) Tuesday, 02 January 2018 1.75 1.96 0 0.21
Momentum Optimal Yield Fund (B4) Thursday, 30 June 2016 1.37 1.58 1.34 0.21
Momentum Optimal Yield Fund (B5) Thursday, 30 June 2016 0.15 0.36 0.13 0.21
Momentum Optimal Yield Fund (C1) Thursday, 30 June 2016 0.6 0.81 0 0.21
Momentum Real Growth Core Equity Fund (A) Thursday, 30 June 2016 0.68 0.99 0 0.31
Momentum Real Growth Core Equity Fund (B) Thursday, 30 June 2016 0.11 0.42 0 0.31
Momentum Real Growth Core Equity Fund (B2) Thursday, 30 June 2016 0.2 0.54 0 0.34
Momentum Real Growth Core Equity Fund (C) Thursday, 30 June 2016 0.51 0.82 0 0.31
Momentum Real Growth Core Equity Fund (E) Thursday, 30 June 2016 0.47 1 0 0.53
Momentum Real Growth Equity Fund (A) Thursday, 30 June 2016 1.75 2.04 0 0.29
Momentum Real Growth Equity Fund (B10) Thursday, 30 June 2016 0.71 1.01 0 0.29
Momentum Real Growth Equity Fund (B11) Thursday, 30 June 2016 1.75 2.04 0 0.3
Momentum Real Growth Equity Fund (B2) Thursday, 30 June 2016 1.39 1.68 0 0.29
Momentum Real Growth Equity Fund (B3) Thursday, 30 June 2016 0.02 0.32 0 0.29
Momentum Real Growth Equity Fund (B4) Thursday, 30 June 2016 2.55 2.85 0 0.29
Momentum Real Growth Equity Fund (B5) Thursday, 30 June 2016 1.46 1.75 0 0.29
Momentum Real Growth Equity Fund (B7) Monday, 31 July 2017 1 1.29 0 0.29
Momentum Real Growth Equity Fund (B8) Monday, 31 July 2017 0.99 1.44 0 0.44
Momentum Real Growth Equity Fund (C1) Monday, 31 July 2017 1 1.29 0 0.29
Momentum Real Growth Property Fund (A) Monday, 31 July 2017 1.45 1.52 0 0.06
Momentum Real Growth Property Fund (B1) Tuesday, 02 January 2018 2.43 2.49 0 0.06
Momentum Real Growth Property Fund (B10) Tuesday, 02 January 2018 0.2 0.27 0 0.07
Momentum Real Growth Property Fund (B2) Thursday, 30 June 2016 1.74 1.8 0 0.06
Momentum Real Growth Property Fund (B3) Thursday, 30 June 2016 1.28 1.34 0 0.06
Momentum Real Growth Property Fund (B4) Thursday, 30 June 2016 0.01 0.08 0 0.06
Momentum Real Growth Property Fund (B6) Monday, 03 April 2017 2.02 2.09 0 0.06
Momentum Real Growth Property Fund (B7) Monday, 03 April 2017 1.16 1.23 0 0.06
Momentum Real Growth Property Fund (B8) Monday, 03 July 2017 0.01 0.08 0 0.06
Momentum Real Growth Property Fund (C1) Monday, 03 April 2017 0.99 1.06 0 0.06
Momentum Real Growth Property Index Fund (A) Tuesday, 02 January 2018 0.5 0.56 0 0.07
Momentum Real Growth Property Index Fund (B) Thursday, 30 June 2016 0.33 0.39 0 0.07
Momentum Real Growth Property Index Fund (B1) Thursday, 30 June 2016 0.04 0.11 0 0.07
Momentum Real Growth Property Index Fund (C) Thursday, 30 June 2016 0.21 0.28 0 0.07
Momentum Real Growth Property Index Fund (E) Thursday, 30 June 2016 0.32 0.39 0 0.07
Momentum Real Growth Property Index Fund (G) Thursday, 30 June 2016 0.32 0.39 0 0.07
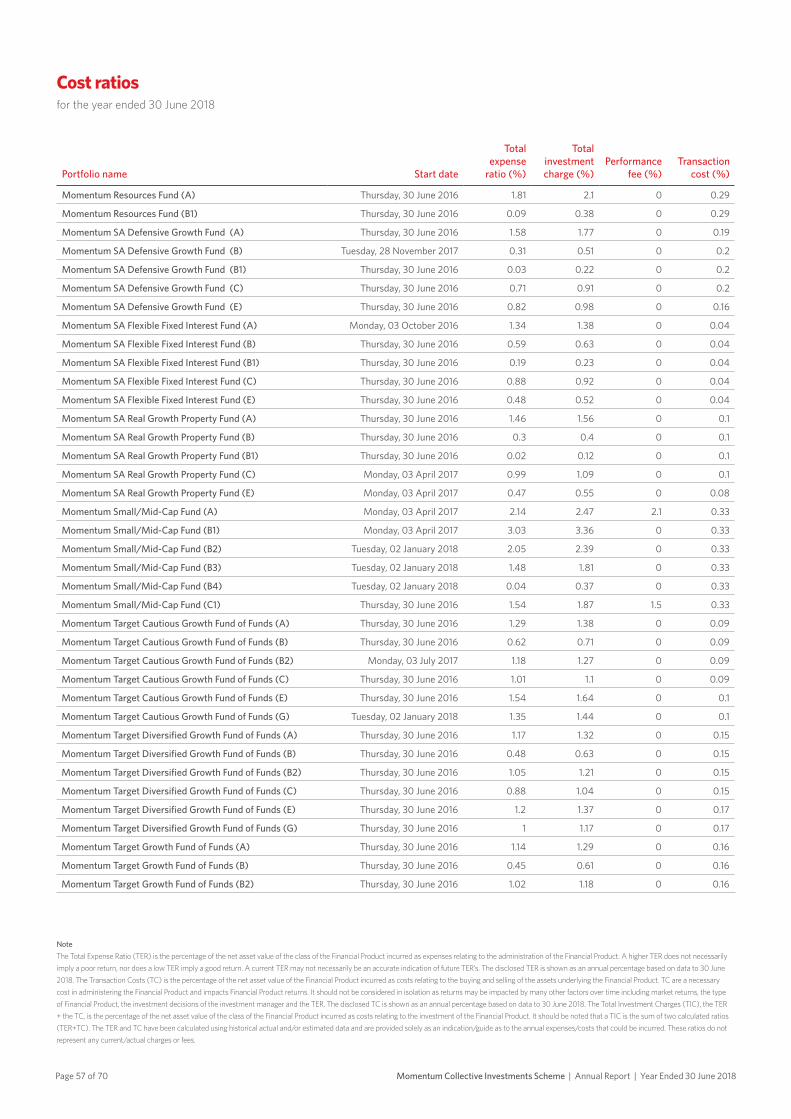
Page 57 of 70 Momentum Collective Investments Scheme | Annual Report | Year Ended 30 June 2018
Cost ratiosfor the year ended 30 June 2018
NoteThe Total Expense Ratio (TER) is the percentage of the net asset value of the class of the Financial Product incurred as expenses relating to the administration of the Financial Product. A higher TER does not necessarily imply a poor return, nor does a low TER imply a good return. A current TER may not necessarily be an accurate indication of future TER’s. The disclosed TER is shown as an annual percentage based on data to 30 June 2018. The Transaction Costs (TC) is the percentage of the net asset value of the Financial Product incurred as costs relating to the buying and selling of the assets underlying the Financial Product. TC are a necessary cost in administering the Financial Product and impacts Financial Product returns. It should not be considered in isolation as returns may be impacted by many other factors over time including market returns, the type of Financial Product, the investment decisions of the investment manager and the TER. The disclosed TC is shown as an annual percentage based on data to 30 June 2018. The Total Investment Charges (TIC), the TER + the TC, is the percentage of the net asset value of the class of the Financial Product incurred as costs relating to the investment of the Financial Product. It should be noted that a TIC is the sum of two calculated ratios (TER+TC). The TER and TC have been calculated using historical actual and/or estimated data and are provided solely as an indication/guide as to the annual expenses/costs that could be incurred. These ratios do not represent any current/actual charges or fees.
Portfolio name Start date
Totalexpense
ratio (%)
Totalinvestment charge (%)
Performance fee (%)
Transaction cost (%)
Momentum Resources Fund (A) Thursday, 30 June 2016 1.81 2.1 0 0.29
Momentum Resources Fund (B1) Thursday, 30 June 2016 0.09 0.38 0 0.29
Momentum SA Defensive Growth Fund (A) Thursday, 30 June 2016 1.58 1.77 0 0.19
Momentum SA Defensive Growth Fund (B) Tuesday, 28 November 2017 0.31 0.51 0 0.2
Momentum SA Defensive Growth Fund (B1) Thursday, 30 June 2016 0.03 0.22 0 0.2
Momentum SA Defensive Growth Fund (C) Thursday, 30 June 2016 0.71 0.91 0 0.2
Momentum SA Defensive Growth Fund (E) Thursday, 30 June 2016 0.82 0.98 0 0.16
Momentum SA Flexible Fixed Interest Fund (A) Monday, 03 October 2016 1.34 1.38 0 0.04
Momentum SA Flexible Fixed Interest Fund (B) Thursday, 30 June 2016 0.59 0.63 0 0.04
Momentum SA Flexible Fixed Interest Fund (B1) Thursday, 30 June 2016 0.19 0.23 0 0.04
Momentum SA Flexible Fixed Interest Fund (C) Thursday, 30 June 2016 0.88 0.92 0 0.04
Momentum SA Flexible Fixed Interest Fund (E) Thursday, 30 June 2016 0.48 0.52 0 0.04
Momentum SA Real Growth Property Fund (A) Thursday, 30 June 2016 1.46 1.56 0 0.1
Momentum SA Real Growth Property Fund (B) Thursday, 30 June 2016 0.3 0.4 0 0.1
Momentum SA Real Growth Property Fund (B1) Thursday, 30 June 2016 0.02 0.12 0 0.1
Momentum SA Real Growth Property Fund (C) Monday, 03 April 2017 0.99 1.09 0 0.1
Momentum SA Real Growth Property Fund (E) Monday, 03 April 2017 0.47 0.55 0 0.08
Momentum Small/Mid-Cap Fund (A) Monday, 03 April 2017 2.14 2.47 2.1 0.33
Momentum Small/Mid-Cap Fund (B1) Monday, 03 April 2017 3.03 3.36 0 0.33
Momentum Small/Mid-Cap Fund (B2) Tuesday, 02 January 2018 2.05 2.39 0 0.33
Momentum Small/Mid-Cap Fund (B3) Tuesday, 02 January 2018 1.48 1.81 0 0.33
Momentum Small/Mid-Cap Fund (B4) Tuesday, 02 January 2018 0.04 0.37 0 0.33
Momentum Small/Mid-Cap Fund (C1) Thursday, 30 June 2016 1.54 1.87 1.5 0.33
Momentum Target Cautious Growth Fund of Funds (A) Thursday, 30 June 2016 1.29 1.38 0 0.09
Momentum Target Cautious Growth Fund of Funds (B) Thursday, 30 June 2016 0.62 0.71 0 0.09
Momentum Target Cautious Growth Fund of Funds (B2) Monday, 03 July 2017 1.18 1.27 0 0.09
Momentum Target Cautious Growth Fund of Funds (C) Thursday, 30 June 2016 1.01 1.1 0 0.09
Momentum Target Cautious Growth Fund of Funds (E) Thursday, 30 June 2016 1.54 1.64 0 0.1
Momentum Target Cautious Growth Fund of Funds (G) Tuesday, 02 January 2018 1.35 1.44 0 0.1
Momentum Target Diversified Growth Fund of Funds (A) Thursday, 30 June 2016 1.17 1.32 0 0.15
Momentum Target Diversified Growth Fund of Funds (B) Thursday, 30 June 2016 0.48 0.63 0 0.15
Momentum Target Diversified Growth Fund of Funds (B2) Thursday, 30 June 2016 1.05 1.21 0 0.15
Momentum Target Diversified Growth Fund of Funds (C) Thursday, 30 June 2016 0.88 1.04 0 0.15
Momentum Target Diversified Growth Fund of Funds (E) Thursday, 30 June 2016 1.2 1.37 0 0.17
Momentum Target Diversified Growth Fund of Funds (G) Thursday, 30 June 2016 1 1.17 0 0.17
Momentum Target Growth Fund of Funds (A) Thursday, 30 June 2016 1.14 1.29 0 0.16
Momentum Target Growth Fund of Funds (B) Thursday, 30 June 2016 0.45 0.61 0 0.16
Momentum Target Growth Fund of Funds (B2) Thursday, 30 June 2016 1.02 1.18 0 0.16

Page 58 of 70Momentum Collective Investments Scheme | Annual Report | Year Ended 30 June 2018
Cost ratiosfor the year ended 30 June 2018
NoteThe Total Expense Ratio (TER) is the percentage of the net asset value of the class of the Financial Product incurred as expenses relating to the administration of the Financial Product. A higher TER does not necessarily imply a poor return, nor does a low TER imply a good return. A current TER may not necessarily be an accurate indication of future TER’s. The disclosed TER is shown as an annual percentage based on data to 30 June 2018. The Transaction Costs (TC) is the percentage of the net asset value of the Financial Product incurred as costs relating to the buying and selling of the assets underlying the Financial Product. TC are a necessary cost in administering the Financial Product and impacts Financial Product returns. It should not be considered in isolation as returns may be impacted by many other factors over time including market returns, the type of Financial Product, the investment decisions of the investment manager and the TER. The disclosed TC is shown as an annual percentage based on data to 30 June 2018. The Total Investment Charges (TIC), the TER + the TC, is the percentage of the net asset value of the class of the Financial Product incurred as costs relating to the investment of the Financial Product. It should be noted that a TIC is the sum of two calculated ratios (TER+TC). The TER and TC have been calculated using historical actual and/or estimated data and are provided solely as an indication/guide as to the annual expenses/costs that could be incurred. These ratios do not represent any current/actual charges or fees.
Portfolio name Start date
Totalexpense
ratio (%)
Totalinvestment charge (%)
Performance fee (%)
Transaction cost (%)
Momentum Target Growth Fund of Funds (C) Thursday, 30 June 2016 0.85 1.01 0 0.16
Momentum Target Growth Fund of Funds (E) Thursday, 30 June 2016 1.17 1.35 0 0.17
Momentum Target Growth Fund of Funds (G) Thursday, 30 June 2016 0.92 1.09 0 0.17
Momentum Target Growth Plus Fund of Funds (A) Thursday, 30 June 2016 1.23 1.41 0 0.17
Momentum Target Growth Plus Fund of Funds (B) Thursday, 30 June 2016 0.56 0.73 0 0.17
Momentum Target Growth Plus Fund of Funds (B2) Thursday, 30 June 2016 1.12 1.29 0 0.17
Momentum Target Growth Plus Fund of Funds (C) Thursday, 30 June 2016 0.96 1.13 0 0.17
Momentum Target Growth Plus Fund of Funds (E) Thursday, 30 June 2016 1.36 1.55 0 0.19
Momentum Target Growth Plus Fund of Funds (G) Thursday, 30 June 2016 1.09 1.28 0 0.19
Momentum Target Stable Growth Fund of Funds (A) Thursday, 30 June 2016 1.15 1.27 0 0.12
Momentum Target Stable Growth Fund of Funds (B) Thursday, 30 June 2016 0.5 0.63 0 0.12
Momentum Target Stable Growth Fund of Funds (B2) Thursday, 30 June 2016 1.07 1.19 0 0.12
Momentum Target Stable Growth Fund of Funds (C) Thursday, 30 June 2016 0.9 1.02 0 0.12
Momentum Target Stable Growth Fund of Funds (E) Thursday, 30 June 2016 1.29 1.43 0 0.14
Momentum Target Stable Growth Fund of Funds (G) Thursday, 30 June 2016 1.03 1.16 0 0.14
Momentum Top 40 Index Fund (A) Thursday, 30 June 2016 0.62 0.7 0 0.08
Momentum Top 40 Index Fund (B1) Monday, 03 April 2017 2.17 2.25 0 0.08
Momentum Top 40 Index Fund (B2) Monday, 03 April 2017 1.48 1.56 0 0.08
Momentum Top 40 Index Fund (B3) Monday, 03 April 2017 0.33 0.41 0 0.08
Momentum Top 40 Index Fund (B5) Monday, 03 April 2017 0.05 0.12 0 0.08
Momentum Trending Equity Fund (A) Tuesday, 02 January 2018 0.53 0.88 0 0.35
Momentum Trending Equity Fund (B) Monday, 03 April 2017 0.35 0.7 0 0.35
Momentum Trending Equity Fund (B1) Monday, 03 April 2017 0.01 0.36 0 0.35
Momentum Trending Equity Fund (C) Monday, 03 April 2017 0.1 0.45 0 0.35
Momentum Trending Equity Fund (E) Monday, 03 April 2017 0.41 0.83 0 0.41
Momentum Trending Equity Fund (G) Tuesday, 02 January 2018 0.36 0.77 0 0.41
Momentum Value Equity Fund (A) Monday, 03 April 2017 0.53 0.69 0 0.16
Momentum Value Equity Fund (B) Monday, 03 April 2017 0.35 0.51 0 0.16
Momentum Value Equity Fund (B1) Monday, 03 April 2017 0.01 0.17 0 0.16
Momentum Value Equity Fund (C) Monday, 03 April 2017 0.1 0.26 0 0.16
Momentum Value Equity Fund (E) Tuesday, 02 January 2018 0.41 0.64 0 0.23
Momentum Value Equity Fund (G) Thursday, 30 June 2016 0.35 0.58 0 0.23

Page 59 of 70Momentum Collective Investments Scheme | Annual Report | Year Ended 30 June 2018
Momentum Bond Fund
Momentum Capped SWIX Index Fund
Momentum Corporate High Interest Fund
Momentum Corporate Money Market Fund
Momentum Defensive Fund
Local equity unit trusts - - - - 13.82
Local equities - - - - 0.55
Basic materials - 9.04 - - 1.59
Consumer goods - 30.10 - - 5.57
Consumer services - - - - 3.32
Financials - 25.20 - - 5.93
Health care - 5.28 - - 0.89
Industrials - 8.65 - - 1.33
Oil and gas - 5.90 - - 1.18
Other - 0.06 - - 0.14
Resources - - - - 1.61
Technology - - - - -
Telecommunications - 5.79 - - 1.18
Commodity ETFs - - - - -
Preference shares - - - - 1.39
Property/Local real estate unit trusts - 7.92 - - 2.64
Local cash/money market 4.58 2.06 100.00 100.00 17.35
Local capital markets 95.42 - - - 26.56
Local capital markets unit trusts - - - - -
Local money market unit trusts - - - - 0.41
Local inflation linked bonds unit trusts - - - - -
Local other unit trusts - - - - 2.26
Inflation linked bonds - - - - -
Foreign assets - - - - -
Foreign bonds - - - - -
Foreign cash/money market - - - - 1.45
Foreign equities - - - - 10.83
Foreign equity unit trusts - - - - -
Foreign capital markets unit trusts - - - - -
Foreign money market unit trusts - - - - -
Foreign inflation linked bonds unit trusts - - - - -
Foreign other unit trusts - - - - -
Foreign other - - - - -
Asset allocationsPortfolio composition (%)
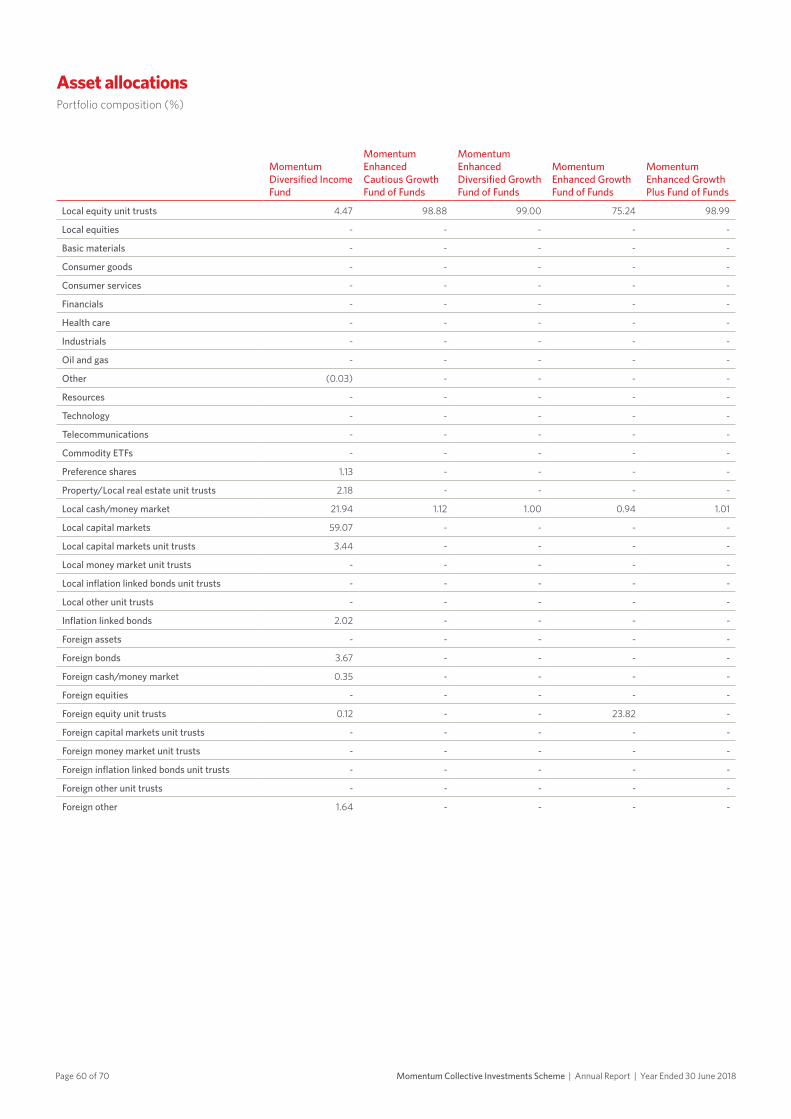
Page 60 of 70 Momentum Collective Investments Scheme | Annual Report | Year Ended 30 June 2018
Asset allocationsPortfolio composition (%)
Momentum Diversified Income Fund
Momentum Enhanced Cautious Growth Fund of Funds
Momentum Enhanced Diversified Growth Fund of Funds
Momentum Enhanced Growth Fund of Funds
Momentum Enhanced Growth Plus Fund of Funds
Local equity unit trusts 4.47 98.88 99.00 75.24 98.99
Local equities - - - - -
Basic materials - - - - -
Consumer goods - - - - -
Consumer services - - - - -
Financials - - - - -
Health care - - - - -
Industrials - - - - -
Oil and gas - - - - -
Other (0.03) - - - -
Resources - - - - -
Technology - - - - -
Telecommunications - - - - -
Commodity ETFs - - - - -
Preference shares 1.13 - - - -
Property/Local real estate unit trusts 2.18 - - - -
Local cash/money market 21.94 1.12 1.00 0.94 1.01
Local capital markets 59.07 - - - -
Local capital markets unit trusts 3.44 - - - -
Local money market unit trusts - - - - -
Local inflation linked bonds unit trusts - - - - -
Local other unit trusts - - - - -
Inflation linked bonds 2.02 - - - -
Foreign assets - - - - -
Foreign bonds 3.67 - - - -
Foreign cash/money market 0.35 - - - -
Foreign equities - - - - -
Foreign equity unit trusts 0.12 - - 23.82 -
Foreign capital markets unit trusts - - - - -
Foreign money market unit trusts - - - - -
Foreign inflation linked bonds unit trusts - - - - -
Foreign other unit trusts - - - - -
Foreign other 1.64 - - - -

Page 61 of 70Momentum Collective Investments Scheme | Annual Report | Year Ended 30 June 2018
Asset allocationsPortfolio composition (%)
Momentum Enhanced Stable Growth Fund of Funds
Momentum Enhanced Yield Fund
Momentum Financials Fund
Momentum Income Plus Fund
Momentum Industrial Fund
Local equity unit trusts 88.61 - - - -
Local equities - - - - -
Basic materials - - - - -
Consumer goods - - - - 39.46
Consumer services - - - - 38.25
Financials - - 78.79 - 2.75
Health care - - - - 5.54
Industrials - - - - 6.63
Oil and gas - - - - -
Other - (0.04) - (2.44) -
Resources - - - - -
Technology - - - - 4.83
Telecommunications - - - - 2.19
Commodity ETFs - - - - -
Preference shares - - - 1.19 -
Property/Local real estate unit trusts - - 13.51 - -
Local cash/money market 0.95 51.40 1.25 82.59 0.34
Local capital markets - 48.64 - 10.23 -
Local capital markets unit trusts 0.14 - - - -
Local money market unit trusts - - 6.44 - 0.01
Local inflation linked bonds unit trusts - - - - -
Local other unit trusts - - - - -
Inflation linked bonds - - - - -
Foreign assets - - - - -
Foreign bonds - - - 8.24 -
Foreign cash/money market - - 0.01 0.19 -
Foreign equities - - - - -
Foreign equity unit trusts 10.30 - - - -
Foreign capital markets unit trusts - - - - -
Foreign money market unit trusts - - - - -
Foreign inflation linked bonds unit trusts - - - - -
Foreign other unit trusts - - - - -
Foreign other - - - - -
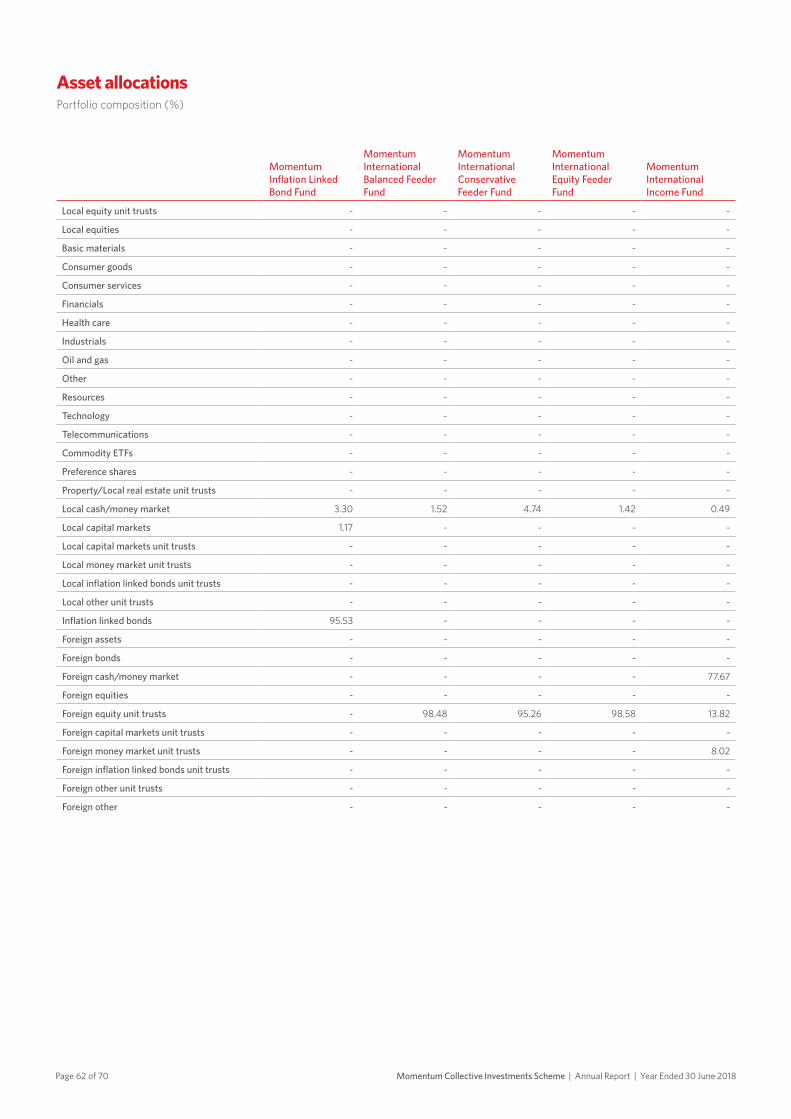
Page 62 of 70 Momentum Collective Investments Scheme | Annual Report | Year Ended 30 June 2018
Asset allocationsPortfolio composition (%)
Momentum Inflation Linked Bond Fund
Momentum International Balanced Feeder Fund
Momentum International Conservative Feeder Fund
Momentum International Equity Feeder Fund
Momentum International Income Fund
Local equity unit trusts - - - - -
Local equities - - - - -
Basic materials - - - - -
Consumer goods - - - - -
Consumer services - - - - -
Financials - - - - -
Health care - - - - -
Industrials - - - - -
Oil and gas - - - - -
Other - - - - -
Resources - - - - -
Technology - - - - -
Telecommunications - - - - -
Commodity ETFs - - - - -
Preference shares - - - - -
Property/Local real estate unit trusts - - - - -
Local cash/money market 3.30 1.52 4.74 1.42 0.49
Local capital markets 1.17 - - - -
Local capital markets unit trusts - - - - -
Local money market unit trusts - - - - -
Local inflation linked bonds unit trusts - - - - -
Local other unit trusts - - - - -
Inflation linked bonds 95.53 - - - -
Foreign assets - - - - -
Foreign bonds - - - - -
Foreign cash/money market - - - - 77.67
Foreign equities - - - - -
Foreign equity unit trusts - 98.48 95.26 98.58 13.82
Foreign capital markets unit trusts - - - - -
Foreign money market unit trusts - - - - 8.02
Foreign inflation linked bonds unit trusts - - - - -
Foreign other unit trusts - - - - -
Foreign other - - - - -
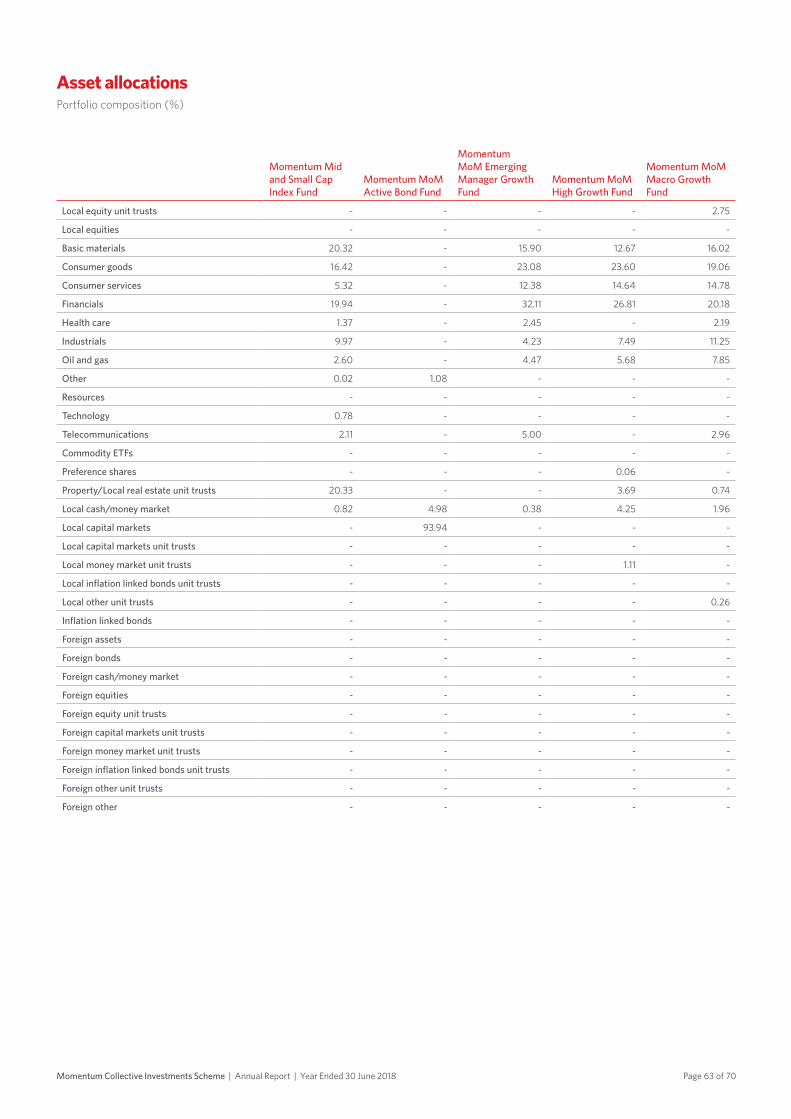
Page 63 of 70Momentum Collective Investments Scheme | Annual Report | Year Ended 30 June 2018
Asset allocationsPortfolio composition (%)
Momentum Mid and Small Cap Index Fund
Momentum MoM Active Bond Fund
Momentum MoM Emerging Manager Growth Fund
Momentum MoM High Growth Fund
Momentum MoM Macro Growth Fund
Local equity unit trusts - - - - 2.75
Local equities - - - - -
Basic materials 20.32 - 15.90 12.67 16.02
Consumer goods 16.42 - 23.08 23.60 19.06
Consumer services 5.32 - 12.38 14.64 14.78
Financials 19.94 - 32.11 26.81 20.18
Health care 1.37 - 2.45 - 2.19
Industrials 9.97 - 4.23 7.49 11.25
Oil and gas 2.60 - 4.47 5.68 7.85
Other 0.02 1.08 - - -
Resources - - - - -
Technology 0.78 - - - -
Telecommunications 2.11 - 5.00 - 2.96
Commodity ETFs - - - - -
Preference shares - - - 0.06 -
Property/Local real estate unit trusts 20.33 - - 3.69 0.74
Local cash/money market 0.82 4.98 0.38 4.25 1.96
Local capital markets - 93.94 - - -
Local capital markets unit trusts - - - - -
Local money market unit trusts - - - 1.11 -
Local inflation linked bonds unit trusts - - - - -
Local other unit trusts - - - - 0.26
Inflation linked bonds - - - - -
Foreign assets - - - - -
Foreign bonds - - - - -
Foreign cash/money market - - - - -
Foreign equities - - - - -
Foreign equity unit trusts - - - - -
Foreign capital markets unit trusts - - - - -
Foreign money market unit trusts - - - - -
Foreign inflation linked bonds unit trusts - - - - -
Foreign other unit trusts - - - - -
Foreign other - - - - -

Page 64 of 70 Momentum Collective Investments Scheme | Annual Report | Year Ended 30 June 2018
Asset allocationsPortfolio composition (%)
Momentum MoM Macro Value Fund
Momentum MoM Managed Bond Fund
Momentum MoM Money Market Fund
Momentum MoM Opportunistic Equity Fund
Momentum MoM Property Equity Fund
Local equity unit trusts - - - - -
Local equities - - - - -
Basic materials 6.75 - - 7.95 -
Consumer goods 25.65 - - 18.18 -
Consumer services 16.21 - - 11.51 -
Financials 14.36 - - 27.37 -
Health care 5.67 - - 2.00 -
Industrials 3.92 - - 11.86 -
Oil and gas 7.53 - - 10.19 -
Other - - - - -
Resources - - - - -
Technology 1.28 - - - -
Telecommunications 0.40 - - 1.93 -
Commodity ETFs 2.40 - - - -
Preference shares - - - - -
Property/Local real estate unit trusts 5.75 - - 6.02 96.59
Local cash/money market 10.08 1.78 93.16 2.99 3.41
Local capital markets - 98.22 6.84 - -
Local capital markets unit trusts - - - - -
Local money market unit trusts - - - - -
Local inflation linked bonds unit trusts - - - - -
Local other unit trusts - - - - -
Inflation linked bonds - - - - -
Foreign assets - - - - -
Foreign bonds - - - - -
Foreign cash/money market - - - - -
Foreign equities - - - - -
Foreign equity unit trusts - - - - -
Foreign capital markets unit trusts - - - - -
Foreign money market unit trusts - - - - -
Foreign inflation linked bonds unit trusts - - - - -
Foreign other unit trusts - - - - -
Foreign other - - - - -
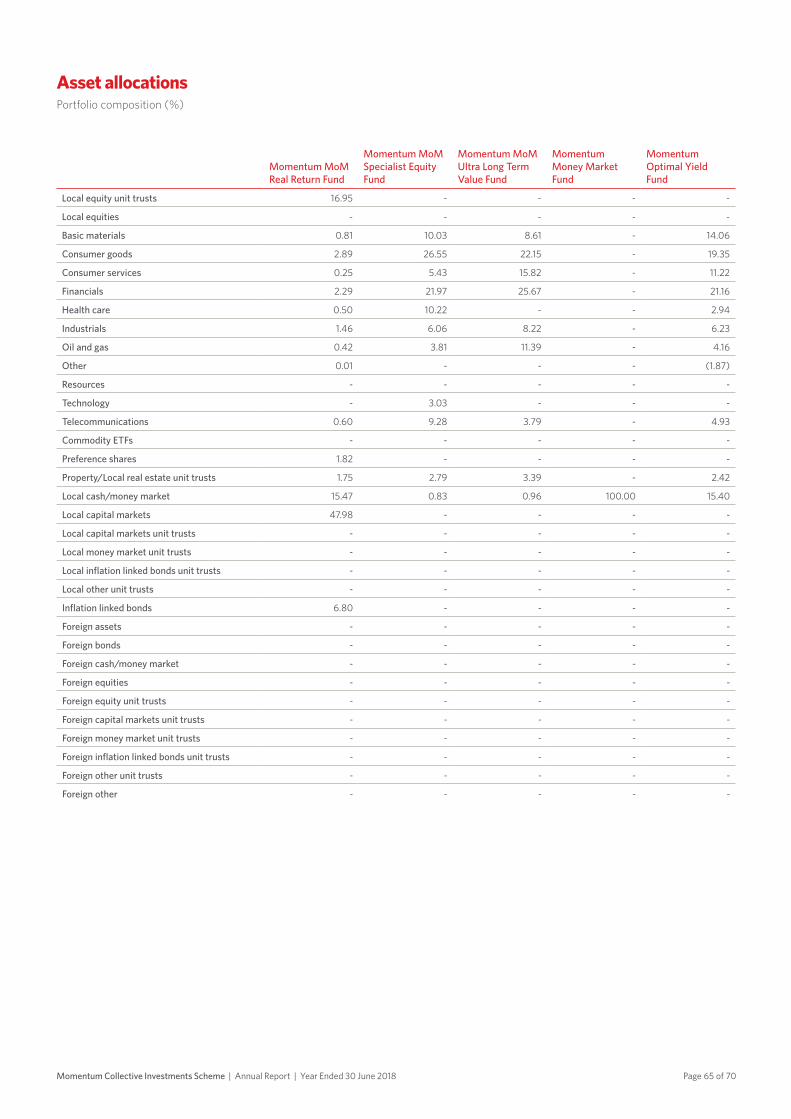
Page 65 of 70Momentum Collective Investments Scheme | Annual Report | Year Ended 30 June 2018
Asset allocationsPortfolio composition (%)
Momentum MoM Real Return Fund
Momentum MoM Specialist Equity Fund
Momentum MoM Ultra Long Term Value Fund
Momentum Money Market Fund
Momentum Optimal Yield Fund
Local equity unit trusts 16.95 - - - -
Local equities - - - - -
Basic materials 0.81 10.03 8.61 - 14.06
Consumer goods 2.89 26.55 22.15 - 19.35
Consumer services 0.25 5.43 15.82 - 11.22
Financials 2.29 21.97 25.67 - 21.16
Health care 0.50 10.22 - - 2.94
Industrials 1.46 6.06 8.22 - 6.23
Oil and gas 0.42 3.81 11.39 - 4.16
Other 0.01 - - - (1.87)
Resources - - - - -
Technology - 3.03 - - -
Telecommunications 0.60 9.28 3.79 - 4.93
Commodity ETFs - - - - -
Preference shares 1.82 - - - -
Property/Local real estate unit trusts 1.75 2.79 3.39 - 2.42
Local cash/money market 15.47 0.83 0.96 100.00 15.40
Local capital markets 47.98 - - - -
Local capital markets unit trusts - - - - -
Local money market unit trusts - - - - -
Local inflation linked bonds unit trusts - - - - -
Local other unit trusts - - - - -
Inflation linked bonds 6.80 - - - -
Foreign assets - - - - -
Foreign bonds - - - - -
Foreign cash/money market - - - - -
Foreign equities - - - - -
Foreign equity unit trusts - - - - -
Foreign capital markets unit trusts - - - - -
Foreign money market unit trusts - - - - -
Foreign inflation linked bonds unit trusts - - - - -
Foreign other unit trusts - - - - -
Foreign other - - - - -
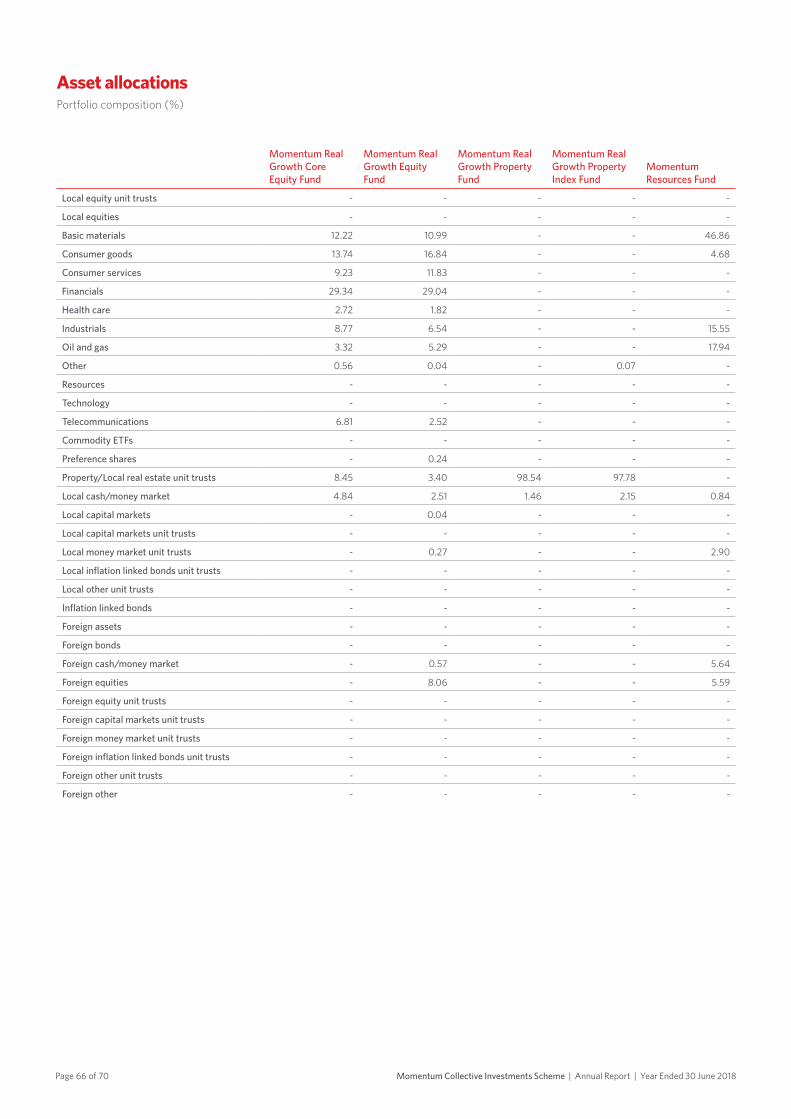
Page 66 of 70 Momentum Collective Investments Scheme | Annual Report | Year Ended 30 June 2018
Asset allocationsPortfolio composition (%)
Momentum Real Growth Core Equity Fund
Momentum Real Growth Equity Fund
Momentum Real Growth Property Fund
Momentum Real Growth Property Index Fund
Momentum Resources Fund
Local equity unit trusts - - - - -
Local equities - - - - -
Basic materials 12.22 10.99 - - 46.86
Consumer goods 13.74 16.84 - - 4.68
Consumer services 9.23 11.83 - - -
Financials 29.34 29.04 - - -
Health care 2.72 1.82 - - -
Industrials 8.77 6.54 - - 15.55
Oil and gas 3.32 5.29 - - 17.94
Other 0.56 0.04 - 0.07 -
Resources - - - - -
Technology - - - - -
Telecommunications 6.81 2.52 - - -
Commodity ETFs - - - - -
Preference shares - 0.24 - - -
Property/Local real estate unit trusts 8.45 3.40 98.54 97.78 -
Local cash/money market 4.84 2.51 1.46 2.15 0.84
Local capital markets - 0.04 - - -
Local capital markets unit trusts - - - - -
Local money market unit trusts - 0.27 - - 2.90
Local inflation linked bonds unit trusts - - - - -
Local other unit trusts - - - - -
Inflation linked bonds - - - - -
Foreign assets - - - - -
Foreign bonds - - - - -
Foreign cash/money market - 0.57 - - 5.64
Foreign equities - 8.06 - - 5.59
Foreign equity unit trusts - - - - -
Foreign capital markets unit trusts - - - - -
Foreign money market unit trusts - - - - -
Foreign inflation linked bonds unit trusts - - - - -
Foreign other unit trusts - - - - -
Foreign other - - - - -
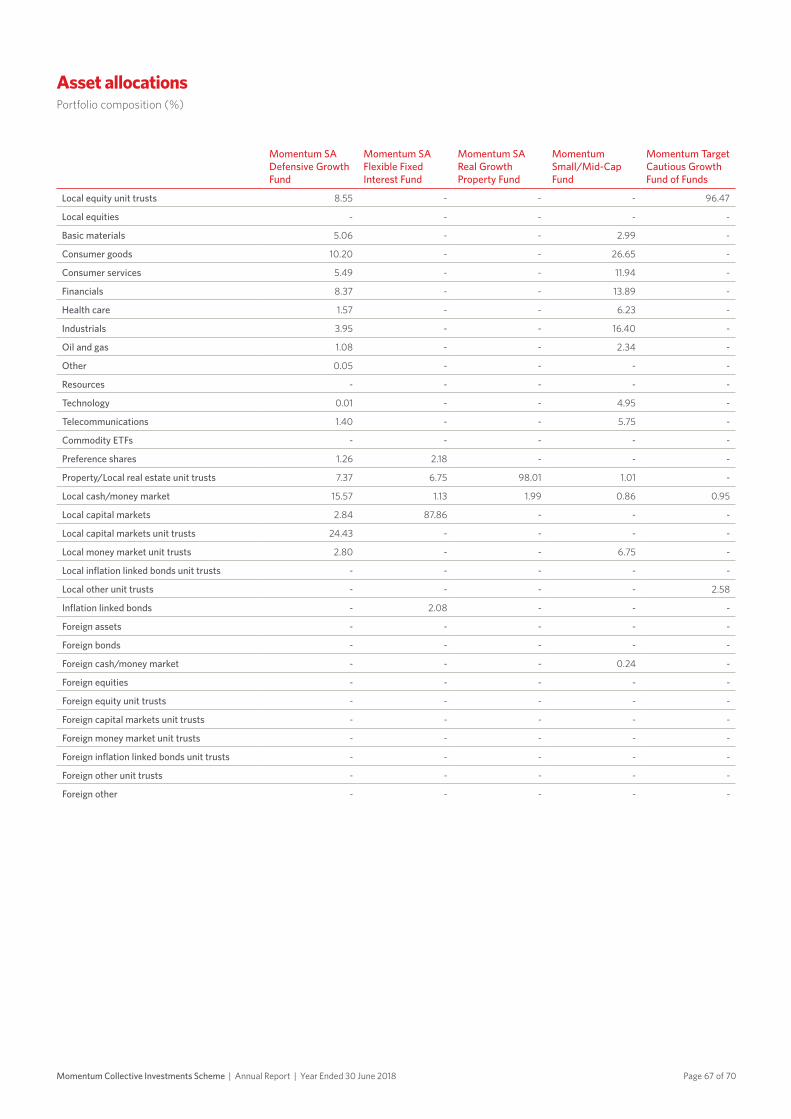
Page 67 of 70Momentum Collective Investments Scheme | Annual Report | Year Ended 30 June 2018
Asset allocationsPortfolio composition (%)
Momentum SA Defensive Growth Fund
Momentum SA Flexible Fixed Interest Fund
Momentum SA Real Growth Property Fund
Momentum Small/Mid-Cap Fund
Momentum Target Cautious Growth Fund of Funds
Local equity unit trusts 8.55 - - - 96.47
Local equities - - - - -
Basic materials 5.06 - - 2.99 -
Consumer goods 10.20 - - 26.65 -
Consumer services 5.49 - - 11.94 -
Financials 8.37 - - 13.89 -
Health care 1.57 - - 6.23 -
Industrials 3.95 - - 16.40 -
Oil and gas 1.08 - - 2.34 -
Other 0.05 - - - -
Resources - - - - -
Technology 0.01 - - 4.95 -
Telecommunications 1.40 - - 5.75 -
Commodity ETFs - - - - -
Preference shares 1.26 2.18 - - -
Property/Local real estate unit trusts 7.37 6.75 98.01 1.01 -
Local cash/money market 15.57 1.13 1.99 0.86 0.95
Local capital markets 2.84 87.86 - - -
Local capital markets unit trusts 24.43 - - - -
Local money market unit trusts 2.80 - - 6.75 -
Local inflation linked bonds unit trusts - - - - -
Local other unit trusts - - - - 2.58
Inflation linked bonds - 2.08 - - -
Foreign assets - - - - -
Foreign bonds - - - - -
Foreign cash/money market - - - 0.24 -
Foreign equities - - - - -
Foreign equity unit trusts - - - - -
Foreign capital markets unit trusts - - - - -
Foreign money market unit trusts - - - - -
Foreign inflation linked bonds unit trusts - - - - -
Foreign other unit trusts - - - - -
Foreign other - - - - -
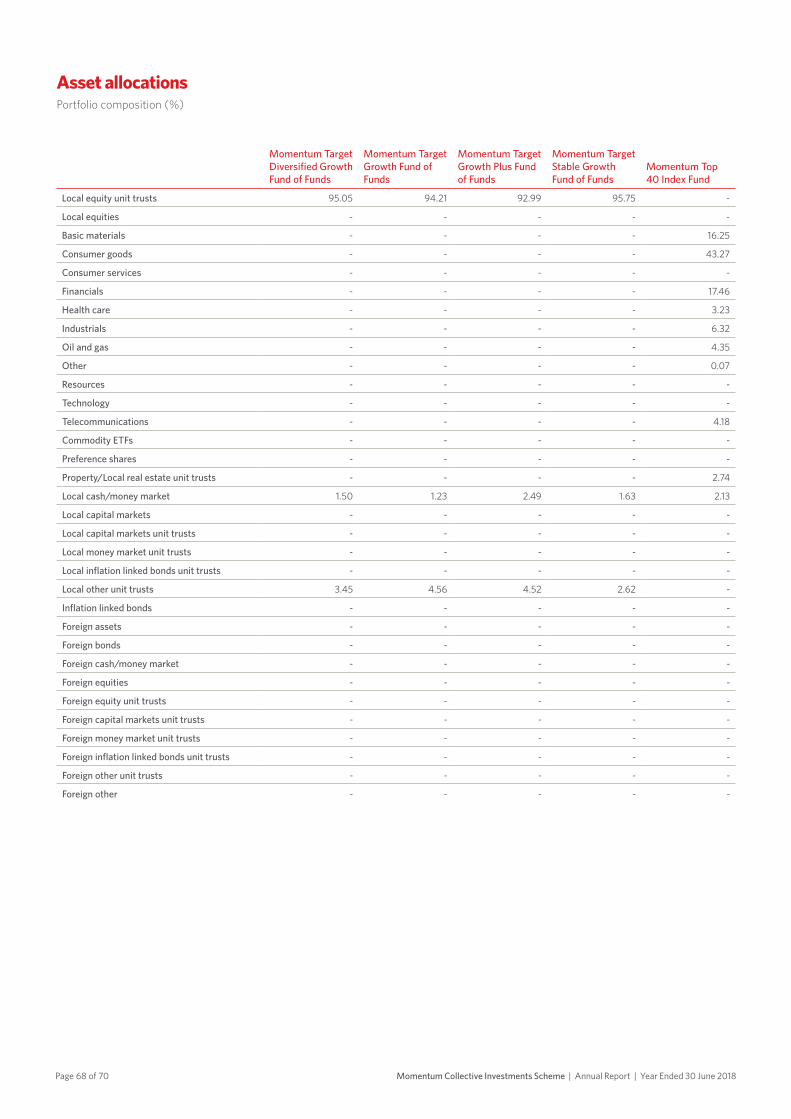
Page 68 of 70 Momentum Collective Investments Scheme | Annual Report | Year Ended 30 June 2018
Asset allocationsPortfolio composition (%)
Momentum Target Diversified Growth Fund of Funds
Momentum Target Growth Fund of Funds
Momentum Target Growth Plus Fund of Funds
Momentum Target Stable Growth Fund of Funds
Momentum Top 40 Index Fund
Local equity unit trusts 95.05 94.21 92.99 95.75 -
Local equities - - - - -
Basic materials - - - - 16.25
Consumer goods - - - - 43.27
Consumer services - - - - -
Financials - - - - 17.46
Health care - - - - 3.23
Industrials - - - - 6.32
Oil and gas - - - - 4.35
Other - - - - 0.07
Resources - - - - -
Technology - - - - -
Telecommunications - - - - 4.18
Commodity ETFs - - - - -
Preference shares - - - - -
Property/Local real estate unit trusts - - - - 2.74
Local cash/money market 1.50 1.23 2.49 1.63 2.13
Local capital markets - - - - -
Local capital markets unit trusts - - - - -
Local money market unit trusts - - - - -
Local inflation linked bonds unit trusts - - - - -
Local other unit trusts 3.45 4.56 4.52 2.62 -
Inflation linked bonds - - - - -
Foreign assets - - - - -
Foreign bonds - - - - -
Foreign cash/money market - - - - -
Foreign equities - - - - -
Foreign equity unit trusts - - - - -
Foreign capital markets unit trusts - - - - -
Foreign money market unit trusts - - - - -
Foreign inflation linked bonds unit trusts - - - - -
Foreign other unit trusts - - - - -
Foreign other - - - - -

Page 69 of 70Momentum Collective Investments Scheme | Annual Report | Year Ended 30 June 2018
Asset allocationsPortfolio composition (%)
Momentum Trending Equity Fund
Momentum Value Equity Fund
Local equity unit trusts - -
Local equities - -
Basic materials 18.73 17.12
Consumer goods 20.78 9.55
Consumer services 13.49 5.24
Financials 27.20 37.65
Health care - -
Industrials 9.00 5.81
Oil and gas 4.88 0.39
Other 0.04 0.04
Resources - -
Technology - -
Telecommunications - 10.90
Commodity ETFs - -
Preference shares - -
Property/Local real estate unit trusts 4.69 11.03
Local cash/money market 1.19 2.27
Local capital markets - -
Local capital markets unit trusts - -
Local money market unit trusts - -
Local inflation linked bonds unit trusts - -
Local other unit trusts - -
Inflation linked bonds - -
Foreign assets - -
Foreign bonds - -
Foreign cash/money market - -
Foreign equities - -
Foreign equity unit trusts - -
Foreign capital markets unit trusts - -
Foreign money market unit trusts - -
Foreign inflation linked bonds unit trusts - -
Foreign other unit trusts - -
Foreign other - -
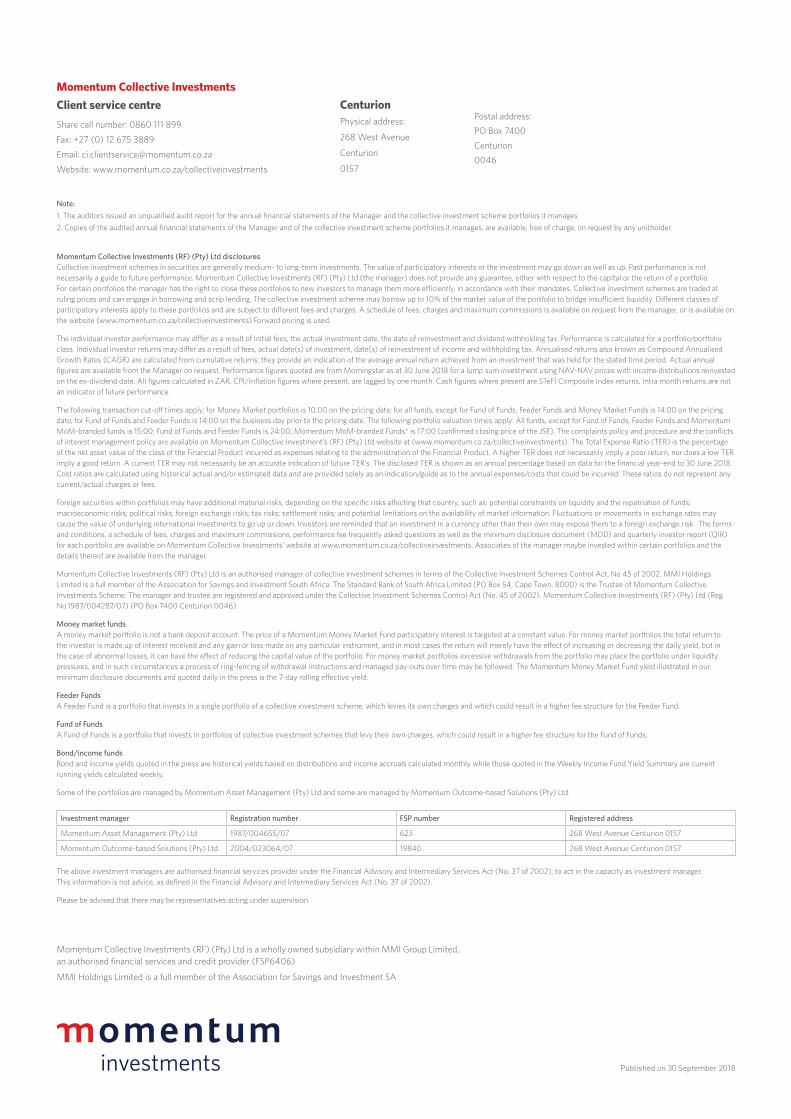
Momentum Collective Investments (RF) (Pty) Ltd disclosures Collective investment schemes in securities are generally medium- to long-term investments. The value of participatory interests or the investment may go down as well as up. Past performance is not necessarily a guide to future performance. Momentum Collective Investments (RF) (Pty) Ltd (the manager) does not provide any guarantee, either with respect to the capital or the return of a portfolio. For certain portfolios the manager has the right to close these portfolios to new investors to manage them more efficiently, in accordance with their mandates. Collective investment schemes are traded at ruling prices and can engage in borrowing and scrip lending. The collective investment scheme may borrow up to 10% of the market value of the portfolio to bridge insufficient liquidity. Different classes of participatory interests apply to these portfolios and are subject to different fees and charges. A schedule of fees, charges and maximum commissions is available on request from the manager, or is available on the website (www.momentum.co.za/collectiveinvestments).Forward pricing is used.
The individual investor performance may differ as a result of initial fees, the actual investment date, the date of reinvestment and dividend withholding tax. Performance is calculated for a portfolio/portfolio class. Individual investor returns may differ as a result of fees, actual date(s) of investment, date(s) of reinvestment of income and withholding tax. Annualised returns also known as Compound Annualised Growth Rates (CAGR) are calculated from cumulative returns; they provide an indication of the average annual return achieved from an investment that was held for the stated time period. Actual annual figures are available from the Manager on request. Performance figures quoted are from Morningstar as at 30 June 2018 for a lump sum investment using NAV-NAV prices with income distributions reinvested on the ex-dividend date. All figures calculated in ZAR, CPI/Inflation figures where present, are lagged by one month. Cash figures where present are STeFI Composite Index returns. Intra month returns are not an indicator of future performance.
The following transaction cut-off times apply: for Money Market portfolios is 10:00 on the pricing date; for all funds, except for Fund of Funds, Feeder Funds and Money Market Funds is 14:00 on the pricing date; for Fund of Funds and Feeder Funds is 14:00 on the business day prior to the pricing date. The following portfolio valuation times apply: All funds, except for Fund of Funds, Feeder Funds and Momentum MoM-branded funds is 15:00; Fund of Funds and Feeder Funds is 24:00; Momentum MoM-branded Funds* is 17:00 (confirmed closing price of the JSE). The complaints policy and procedure and the conflicts of interest management policy are available on Momentum Collective Investment’s (RF) (Pty) Ltd website at (www.momentum.co.za/collectiveinvestments). The Total Expense Ratio (TER) is the percentage of the net asset value of the class of the Financial Product incurred as expenses relating to the administration of the Financial Product. A higher TER does not necessarily imply a poor return, nor does a low TER imply a good return. A current TER may not necessarily be an accurate indication of future TER’s. The disclosed TER is shown as an annual percentage based on data for the financial year-end to 30 June 2018. Cost ratios are calculated using historical actual and/or estimated data and are provided solely as an indication/guide as to the annual expenses/costs that could be incurred. These ratios do not represent any current/actual charges or fees.
Foreign securities within portfolios may have additional material risks, depending on the specific risks affecting that country, such as: potential constraints on liquidity and the repatriation of funds; macroeconomic risks; political risks; foreign exchange risks; tax risks; settlement risks; and potential limitations on the availability of market information. Fluctuations or movements in exchange rates may cause the value of underlying international investments to go up or down. Investors are reminded that an investment in a currency other than their own may expose them to a foreign exchange risk. The terms and conditions, a schedule of fees, charges and maximum commissions, performance fee frequently asked questions as well as the minimum disclosure document (MDD) and quarterly investor report (QIR) for each portfolio are available on Momentum Collective Investments’ website at www.momentum.co.za/collectiveinvestments. Associates of the manager maybe invested within certain portfolios and the details thereof are available from the manager.
Momentum Collective Investments (RF) (Pty) Ltd is an authorised manager of collective investment schemes in terms of the Collective Investment Schemes Control Act, No 45 of 2002. MMI Holdings Limited is a full member of the Association for Savings and Investment South Africa. The Standard Bank of South Africa Limited (PO Box 54, Cape Town, 8000) is the Trustee of Momentum Collective Investments Scheme. The manager and trustee are registered and approved under the Collective Investment Schemes Control Act (No. 45 of 2002). Momentum Collective Investments (RF) (Pty) Ltd (Reg No.1987/004287/07) (PO Box 7400 Centurion 0046).
Money market fundsA money market portfolio is not a bank deposit account. The price of a Momentum Money Market Fund participatory interest is targeted at a constant value. For money market portfolios the total return to the investor is made up of interest received and any gain or loss made on any particular instrument, and in most cases the return will merely have the effect of increasing or decreasing the daily yield, but in the case of abnormal losses, it can have the effect of reducing the capital value of the portfolio. For money market portfolios excessive withdrawals from the portfolio may place the portfolio under liquidity pressures, and in such circumstances a process of ring-fencing of withdrawal instructions and managed pay-outs over time may be followed. The Momentum Money Market Fund yield illustrated in our minimum disclosure documents and quoted daily in the press is the 7-day rolling effective yield.
Feeder FundsA Feeder Fund is a portfolio that invests in a single portfolio of a collective investment scheme, which levies its own charges and which could result in a higher fee structure for the Feeder Fund.
Fund of FundsA Fund of Funds is a portfolio that invests in portfolios of collective investment schemes that levy their own charges, which could result in a higher fee structure for the Fund of Funds.
Bond/income fundsBond and income yields quoted in the press are historical yields based on distributions and income accruals calculated monthly while those quoted in the Weekly Income Fund Yield Summary are current running yields calculated weekly.
Some of the portfolios are managed by Momentum Asset Management (Pty) Ltd and some are managed by Momentum Outcome-based Solutions (Pty) Ltd.
The above investment managers are authorised financial services provider under the Financial Advisory and Intermediary Services Act (No. 37 of 2002), to act in the capacity as investment manager.This information is not advice, as defined in the Financial Advisory and Intermediary Services Act (No. 37 of 2002).
Please be advised that there may be representatives acting under supervision.
Published on 30 September 2018
Note:1. The auditors issued an unqualified audit report for the annual financial statements of the Manager and the collective investment scheme portfolios it manages.2. Copies of the audited annual financial statements of the Manager and of the collective investment scheme portfolios it manages, are available, free of charge, on request by any unitholder.
Momentum Collective InvestmentsClient service centreShare call number: 0860 111 899
Fax: +27 (0) 12 675 3889
Email: [email protected]
Website: www.momentum.co.za/collectiveinvestments
CenturionPhysical address:
268 West Avenue
Centurion
0157
Postal address:PO Box 7400Centurion0046
Momentum Collective Investments (RF) (Pty) Ltd is a wholly owned subsidiary within MMI Group Limited, an authorised financial services and credit provider (FSP6406)
MMI Holdings Limited is a full member of the Association for Savings and Investment SA
investments
Investment manager Registration number FSP number Registered address
Momentum Asset Management (Pty) Ltd 1987/004655/07 623 268 West Avenue Centurion 0157
Momentum Outcome-based Solutions (Pty) Ltd 2004/023064/07 19840 268 West Avenue Centurion 0157