Embed Size (px)
Citation preview
2
MOLECULAR MECHANISMS UNDERLYING THE ACTION OF
HISTONE DEACETYLASES INHIBITORS (HDACIs) IN OVARIAN
CANCER
Fernanda Maria Gonçalves da Silva
Orientadora: Ana Maria Félix de Campos Pinto, Professora Associada
Co-orientadora: Jacinta Serpa, Professora Auxiliar
Tese para obtenção do grau de Doutor em Ciências da Vida
na Especialidade em Biomedicina
Dezembro, 2016

i
The result chapters presented in this thesis are manuscripts published or in
preparation for subsequent publications. I clarify that I have participated fully in the
conception and execution of the experimental work, interpretation of the results and
manuscript drafting.
The work was approved by the Ethical Committee of Nova Faculty of Medicine
(1/2015) and by the IPOLFG (UIC-938).

ii
INDEX
ABSTRACT ........................................................................................................ vi
RESUMO ........................................................................................................... x
FIGURE INDEX ................................................................................................ xiv
TABLE INDEX .................................................................................................. xvi
ACKNOWLEDGMENTS ................................................................................. xviii
LIST OF PUBLICATIONS ................................................................................... xx
ABBREVIATIONS ........................................................................................... xxii
CHAPTER 1 ....................................................................................................... 1
INTRODUCTION .................................................................................................. 2
1.1 Epithelial ovarian cancer (EOC) .................................................................... 2
1.1.1 Epidemiology and Risk factors ............................................................... 2
1.1.2 Histological Types ................................................................................... 4
1.1.2.1 Serous carcinoma ............................................................................ 5
1.1.2.1.1 Low grade serous carcinomas (LGSC) ...................................... 5
1.1.2.1.2 High grade serous carcinomas (HGSC) ..................................... 6
1.1.2.2 Endometrioid carcinomas (EC) ........................................................ 7
1.1.2.3 Clear cell carcinomas (CCC) ............................................................. 8
1.1.2.4 Mucinous carcinomas (MC) .......................................................... 10
1.1.2.5 Other types of ovarian carcinomas ............................................... 11
1.1.3 Clinical presentation ............................................................................ 11
1.1.4 Treatment of ovarian cancer ............................................................... 14
1.2 Molecular features of ovarian cancer ........................................................ 18
1.2.1 Pathways involved in ovarian cancer ................................................... 19
1.2.1.1 Notch Signaling Pathway............................................................... 19
1.2.1.2 Mitogen-activated protein kinases (MAPK) pathway ................... 21
1.2.1.3 PI3K/PTEN/AKT pathway ............................................................... 22
1.2.2 Genes involved in ovarian cancer ........................................................ 25
1.2.2.1 Tumor protein 53 (TP53) ............................................................... 25
iii
1.2.2.2 Hepatocyte nuclear factor 1β (HNF1β) ......................................... 27
1.2.2.3 Cyclins and Cyclin-dependent-Kinase inhibitors ........................... 28
1.3 Epigenetics and ovarian cancer .................................................................. 29
1.3.1 DNA methylation .................................................................................. 30
1.3.2 Histone acetylation .............................................................................. 33
1.3.3 HDAC inhibitors .................................................................................... 35
1.3.3.1 Mechanisms of action of HDACI ................................................... 36
1.3.3.2 Butyric acid .................................................................................... 38
1.3.3.3 Vorinostat ...................................................................................... 39
AIM AND THESIS OUTLINE ............................................................................... 42
CHAPTER 2 ..................................................................................................... 44
PROTEIN EXPRESSION PROFILE OF HISTONE DEACETYLASES (HDAC) 1, 2, 3, 4, 6 AND
PHOSPHOHDAC4/5/7 IN OVARIAN CANCER ............................................................. 44
ABSTRACT ............................................................................................................ 45
INTRODUCTION ..................................................................................................... 46
MATERIAL AND METHODS ....................................................................................... 47
RESULTS .............................................................................................................. 53
DISCUSSION .......................................................................................................... 64
CHAPTER 3 ..................................................................................................... 70
THE IN VITRO EFFECT OF EPIGENETICS REGULATORY DRUGS, ISOLATED AND COMBINED WITH
CONVENTIONAL CHEMOTHERAPY, IN EPITHELIAL OVARIAN CANCER (EOC) ....................... 70
ABSTRACT ............................................................................................................ 71
INTRODUCTION ..................................................................................................... 72
MATERIAL AND METHODS ....................................................................................... 75
RESULTS .............................................................................................................. 79
DISCUSSION .......................................................................................................... 90
CHAPTER 4 ..................................................................................................... 96
HNF1β ACETYLATION A POSSIBLE PATH FOR VORINOSTAT IMPAIRMENT OF OVARIAN CLEAR
CELL CARCINOMA (CCC) ......................................................................................... 96

iv
ABSTRACT ............................................................................................................ 97
INTRODUCTION ..................................................................................................... 98
MATERIAL AND METHODS ....................................................................................... 99
RESULTS ............................................................................................................ 103
DISCUSSION ........................................................................................................ 109
CHAPTER 5 ................................................................................................... 112
FUNCTIONAL REDUNDANCY OF THE NOTCH PATHWAY IN OVARIAN CANCER CELL LINES ..... 112
ABSTRACT .......................................................................................................... 113
INTRODUCTION ................................................................................................... 114
MATERIAL AND METHODS ..................................................................................... 115
RESULTS ............................................................................................................ 117
DISCUSSION ........................................................................................................ 121
CHAPTER 6 ................................................................................................... 124
ESTABLISHMENT AND CHARACTERIZATION OF A NOVEL OVARIAN HIGH GRADE SEROUS
CARCINOMA CELL LINE - IPO-SOC43 ..................................................................... 124
ABSTRACT .......................................................................................................... 125
INTRODUCTION ................................................................................................... 126
MATERIAL AND METHODS ..................................................................................... 126
RESULTS ............................................................................................................ 135
DISCUSSION ........................................................................................................ 151
CHAPTER 7 ................................................................................................... 154
GENERAL DISCUSSION .......................................................................................... 156
CONCLUSIONS ..................................................................................................... 160
FUTURE PERSPECTIVES .......................................................................................... 162
REFERENCES ........................................................................................................ 164

v

vi
ABSTRACT
Epithelial ovarian cancer (EOC) is the most lethal gynecological malignancy,
despite advances in treatment. The most common histological type, high grade serous
carcinoma (HGSC) is usually diagnosed at an advanced stage, and although this type of
tumors frequently responds to surgery and platinum-based chemotherapy, they
usually recur. Ovarian clear cell carcinoma (CCC) is an unusual histological type, which
is known to be intrinsically chemoresistant and is associated with poor prognosis in
advanced stages. Hence, the discovery of new therapeutic strategies urges and the fact
that histone deacetylases (HDACs) expression is increased in ovarian cancer points out
HDAC inhibitors (HDACIs) as an attractive approach.
Our hypothesis is that HDACIs are useful drugs to treat ovarian cancer. So, the
main goal was to disclose the molecular mechanisms underlying the action of HDACIs
in ovarian cancer.
We investigated the expression profile of HDAC, class I (HDAC1, 2, 3) and class II
(HDAC4, 6 and phosphoHDAC4/5/7) in ovarian cancer. HDACs protein expression was
analyzed by immunohistochemistry on tissue microarrays (TMA) from 64 patients with
ovarian cancer (49 cases of HGSC and 15 cases of CCC). Our results showed that HGSC
expressed HDAC1, 2, 3, 4, 6 and phosphoHDAC4/5/7 whereas CCC expressed HDAC1, 2
and 6. HDAC2, 3, 4 and pHDAC4/5/7 were associated with HGSC type. Kaplan-Meier
curves showed that HDACs expression was not associated with survival. We also
evaluated the association of HDACs expression profile with the cell cycle markers and
we found that HDAC1 expression was statistically associated with p21 expression in
HGSC.
In order to understand the effects of HDACIs we used cancer cell lines (OVCAR3
and ES2) exposed to HDACIs, butyric acid and vorinostat, 5-aza-2´-deoxycytidine (DNA
methylation inhibitor) and carboplatin and paclitaxel (standard chemotherapy) alone
and combined. Analysis of cell death, proliferation and migration in cancer cell lines
was performed. Our results showed, that both HDACIs induced cell death, mainly
through apoptosis in the two cell lines. This result was further confirmed in ES2 cell

vii
line exposed to vorinostat, by the study of immunofluorescence of cleaved caspase 3
and the ratio of BAX/BCL-2 proteins, which increased after vorinostat exposure. Cell
migration was decreased by vorinostat in both cancer cell lines. Our results also
indicated that the association of different drugs were able to potentiate the effect of
standard chemotherapy, mainly in ES2 cell line (CCC), supporting that EOC treatment
can benefit from combined chemical and epigenetic therapy.
Considering that CCC is a unique clinical, histopathological and molecular entity
within ovarian cancer and having HNF1β as a pivotal pro-survival gene we evaluate the
role of HNF1β in cell cycle arrest and apoptosis in CCC upon vorinostat exposure. Our
results showed that vorinostat induced increased levels of HNF1β and at the same
time cell cycle arrest and apoptosis in ES2 cells. This effect on HNF1β is associated with
increased acetylation load of HNF1β. This study confirms that epigenetic modulation
affects not only the conformation of chromatin and gene expression, but also it may
alter the function and the turnover of proteins other than histones.
Also, epigenetic modulation of signaling pathways have been reported in HGSC
and CCC, including the overexpression of Notch pathway elements and we investigated
the modulation of the Notch pathway by vorinostat in ovarian cancer. Using
immunofluorescence and quantitative polymerase chain reaction, our results revealed
that vorinostat activated the Notch pathway in CCC and HGSC cell lines, through
different Notch ligands. The activation of Notch pathway by vorinostat, in CCC and
HGSC cell lines, culminated in the increased expression of the same downstream
transcription factors, hairy enhancer of split (Hes1) 1 and 5, and Hes-related proteins 1
and 2. Therefore, vorinostat modulates the expression of several downstream targets
of the Notch pathway and independent Notch receptors and ligands that are
expressed in HGSC and CCC. This upregulation of the Notch pathway may explain why
vorinostat therapy fails in ovarian carcinoma treatment, as shown in certain clinical
trials.
We also established a cell line from ascitic fluid from a patient with HGSC, who
had been previously treated with neoadjuvant chemotherapy. The cell spontaneous
immortalization was obtained on 2D cell culture and expansion was performed on 2D

viii
and 3D cell cultures. Characterization studies confirmed that IPO-SOC43 cell line is of
EOC origin and maintains morphological and molecular features of the primary tumor.
The success of the cell line growth in a 3D systems, allows it to be used in more
complex assays than those performed in 2D models. IPO-SOC43 is available for public
research and we hope it can contribute to enrich the in vitro models addressing EOC
heterogeneity, being useful to investigate EOC and to develop new therapeutic
modalities.
In conclusion, the results in vitro proved that there is benefits of combined
therapy, using drugs with action of epigenetic modulation and conventional therapy.
This thesis also pave the path for future studies on the role of HDACs cancer cells
pathophysiology, serving as markers for the design of personalized and specific
therapeutic strategies.
Keywords: ovarian cancer, HDAC, HDACIs, HGSC, CCC

ix

x
RESUMO
O carcinoma do ovário é a neoplasia ginecológica mais letal. Vários fatores são
identificados como responsáveis pela baixa eficácia no tratamento do carcinoma do
ovário. Assim, é postulado que a elevada taxa de mortalidade se deve principalmente,
a dificuldades no diagnóstico da doença numa fase inicial e à resistência à terapêutica
convencional. Deste modo, a investigação de novas estratégias terapêuticas é
essencial e urgente.
A expressão aumentada das desacetilases de histonas (HDAC) identificada em
carcinomas do ovário pode indicar que os inibidores de HDACs (HDACIs) possam ser
uma alternativa terapêutica. Os HDACIs são uma classe de agentes anti-neoplásicos,
que bloqueiam a desacetilação de histonas e outras proteínas, causando paragem do
ciclo celular, diferenciação e/ou apoptose das células neoplásicas. Vários HDACIs estão
a ser testados em ensaios clínicos, quer como agentes únicos quer em terapias
combinadas, apresentando alguns resultados positivos no combate a vários tumores
sólidos e hematológicos. Os mecanismos moleculares do efeito anti-tumoral dos
HDACIs não estão completamente esclarecidos, nem a avaliação da sensibilidade e/ou
resistência das células a fármacos com influência na regulação epigenética.
O cancro do ovário é um conjunto vasto de neoplasias distintas sendo os
carcinomas o grupo mais prevalente. Atualmente, não é possível, de modo fiável
prever o curso clínico da doença nem a resposta individual à quimioterapia. No
entanto, a identificação morfológica do tipo de carcinoma do ovário tem valor
prognóstico independente em análise multivariada, pelo que a avaliação de potenciais
biomarcadores que possam constituir alvos terapêuticos deverá ser efetuada de modo
independente, pois previsivelmente cada tipo histológico deverá ter uma resposta
específica ao tratamento.
Por estas razões, a hipótese geral desta tese é que os HDACIs são fármacos úteis
no tratamento do cancro do ovário, sendo o objetivo a avaliação de mecanismos
subjacentes à ação destes fármacos em carcinomas de ovário de modo a permitir uma
terapêutica mais eficaz.
xi
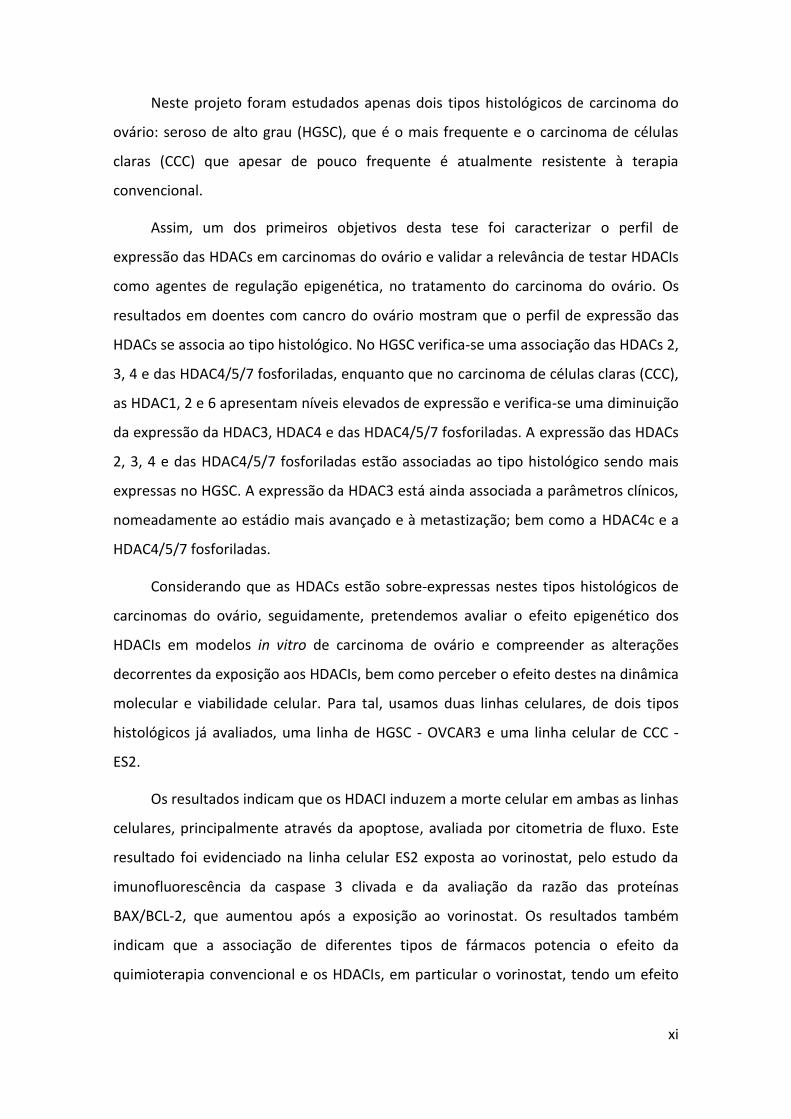
Neste projeto foram estudados apenas dois tipos histológicos de carcinoma do
ovário: seroso de alto grau (HGSC), que é o mais frequente e o carcinoma de células
claras (CCC) que apesar de pouco frequente é atualmente resistente à terapia
convencional.
Assim, um dos primeiros objetivos desta tese foi caracterizar o perfil de
expressão das HDACs em carcinomas do ovário e validar a relevância de testar HDACIs
como agentes de regulação epigenética, no tratamento do carcinoma do ovário. Os
resultados em doentes com cancro do ovário mostram que o perfil de expressão das
HDACs se associa ao tipo histológico. No HGSC verifica-se uma associação das HDACs 2,
3, 4 e das HDAC4/5/7 fosforiladas, enquanto que no carcinoma de células claras (CCC),
as HDAC1, 2 e 6 apresentam níveis elevados de expressão e verifica-se uma diminuição
da expressão da HDAC3, HDAC4 e das HDAC4/5/7 fosforiladas. A expressão das HDACs
2, 3, 4 e das HDAC4/5/7 fosforiladas estão associadas ao tipo histológico sendo mais
expressas no HGSC. A expressão da HDAC3 está ainda associada a parâmetros clínicos,
nomeadamente ao estádio mais avançado e à metastização; bem como a HDAC4c e a
HDAC4/5/7 fosforiladas.
Considerando que as HDACs estão sobre-expressas nestes tipos histológicos de
carcinomas do ovário, seguidamente, pretendemos avaliar o efeito epigenético dos
HDACIs em modelos in vitro de carcinoma de ovário e compreender as alterações
decorrentes da exposição aos HDACIs, bem como perceber o efeito destes na dinâmica
molecular e viabilidade celular. Para tal, usamos duas linhas celulares, de dois tipos
histológicos já avaliados, uma linha de HGSC - OVCAR3 e uma linha celular de CCC -
ES2.
Os resultados indicam que os HDACI induzem a morte celular em ambas as linhas
celulares, principalmente através da apoptose, avaliada por citometria de fluxo. Este
resultado foi evidenciado na linha celular ES2 exposta ao vorinostat, pelo estudo da
imunofluorescência da caspase 3 clivada e da avaliação da razão das proteínas
BAX/BCL-2, que aumentou após a exposição ao vorinostat. Os resultados também
indicam que a associação de diferentes tipos de fármacos potencia o efeito da
quimioterapia convencional e os HDACIs, em particular o vorinostat, tendo um efeito
xii
cumulativo na morte celular, principalmente na linha celular ES2 (CCC). A migração
celular também é afetada pelo vorinostat em ambas as linhas celulares de carcinoma
de ovário.
Os resultados mostram também que o vorinostat induz aumento do HNF1β e ao
mesmo tempo paragem do ciclo celular e apoptose nas células ES2. O aumento da
expressão do HNF1β é acompanhado pelo aumento dos seus níveis da acetilação.
Este estudo confirma que a modulação epigenética afeta a conformação da
cromatina e da expressão genética, mas também pode alterar a função e o turnover de
outras proteínas além das histonas. Pela primeira vez é observado que a proteína
HNF1β pode ser acetilada, contudo serão necessários mais estudos para validar o
papel da acetilação na função e degradação da proteína HNF1β.
Nesta tese foi avaliado também a modulação de outras vias de sinalização
importantes no carcinoma do ovário, como por exemplo a via Notch através da
exposição a HDACIs, nomeadamente vorinostat e ácido butírico. E os nossos resultados
mostram que o vorinostat ativa a via Notch nas linhas celulares de CCC e HGSC, através
de diferentes ligandos da via Notch. No CCC, a ativação da via Notch parece ocorrer
através dos ligandos Delta (Dll) 1, 2 e 3, enquanto nos HGSC, os ligandos Dll1, Jagged 1
e 2 são os mais expressos. A ativação da via Notch pelo vorinostat, em ambas linhas
celulares, culminou na expressão aumentada dos mesmos genes alvo da via Notch,
Hes1 e 5 e Hey 1 e 2.
Assim, o vorinostat modula a expressão de vários fatores de transcrição da via
Notch, independentemente do painel de receptores e dos ligandos expressos nas
linhas de HGSC e CCC. Esta redundância da via Notch pode explicar porque a
terapêutica isolada com vorinostat falha no tratamento do carcinoma do ovário, como
observado em vários ensaios clínicos.
Por fim, no decorrer dos trabalhos apresentados, e considerando a importância
das linhas celulares na compreensão da biologia do cancro e nos mecanismos de
sensibilidade e resistência das células aos fármacos, foi estabelecida uma linha celular,
IPO-SOC43 a partir de líquido ascítico de uma doente com HGSC que havia sido
previamente tratada com quimioterapia neoadjuvante.

xiii
Foram efetuados estudos de caracterização desta linha que demonstram que a
linha celular IPO-SOC43 é de origem epitelial e que mantém características
morfológicas e moleculares do tumor primário. As células mantêm-se em cultura em
monocamada (2D) e em agregados em 3D, com taxas de proliferação e viabilidade
dentro do esperado para uma linha neoplásica maligna. O sucesso da viabilidade em
culturas 3D permite o seu uso em ensaios mais complexos, nomeadamente, na análise
da contribuição dos vários componentes do microambiente tumoral na progressão da
doença e resposta à terapêutica.
A linha celular IPO-SOC43 está disponível para ser utilizada experimentalmente e
esperamos que possa contribuir para enriquecer os modelos in vitro que abordam a
heterogeneidade dos EOC e desenvolver novas modalidades terapêuticas.
Em suma, os resultados contribuem para a implementação racional de novas e
diferentes abordagens terapêuticas. Os resultados mostram que in vitro há benefício
de terapêutica combinada, utilizando fármacos com ação de modelação epigenética e
terapia convencional. Esta tese também abre caminho para estudos futuros mais
detalhados sobre a função das HDACs na dinâmica celular e não só na regulação
epigenética, bem como também na análise de mecanismos subjacentes à ação de
proteínas codificadas por genes relevantes em cada tipo histológico de carcinoma do
ovário.
Espera-se assim, que a compreensão dos mecanismos subjacentes à ação dos
fármacos envolvidos na regulação epigenética possa fornecer orientações para
estratégias terapêuticas mais específicas e personalizadas.
Palavras-chave: carcinoma ovário, HDAC, HDACIs, HGSC, CCC
xiv
FIGURE INDEX
Figure 1. 1 - Representative examples of the five main types of ovarian carcinoma stained with
hematoxylin and eosin (H&E) ...................................................................................................................... 5
Figure 1. 2 - Ovarian cancer signaling pathways scheme ......................................................................... 21
Figure 1. 3 – Cytosine metylation .............................................................................................................. 31
Figure 2. 1- Representative pattern of HDACs protein expression in HGSC in tissue microarray (TMA)
sections. ..................................................................................................................................................... 54
Figure 2. 2 - Representative pattern of HDACs protein expression in CCC in tissue microarray (TMA)
sections ...................................................................................................................................................... 55
Figure 2. 3 - Representative examples of immunostaining for p16, p21, p53 and cyclin D1 in different
histological types of ovarian cancer .......................................................................................................... 61
Figure 3. 1 - Mechanism of action of HDAC inhibitors (HDACI) ................................................................ 74
Figure 3. 2 - Cell death in ES2 cell line exposed to HDACIs and 5-aza-dC ................................................. 80
Figure 3. 3 - Cell death in OVCAR3 cell line exposed to HDACIs and 5-aza-dC ......................................... 81
Figure 3. 4 - mRNA expression of BCL-2 and BAD in ES2 cell line ............................................................. 82
Figure 3. 5 - Expression of BCl-2 and BAX by Western blot ...................................................................... 83
Figure 3. 6 - Expression of cleaved caspase 3 by immunofluorescence in EOC cell lines......................... 84
Figure 3. 7 - mRNA expression of BECLIN-1 and ATG-7 in ES2 cell line .................................................... 85
Figure 3. 8 - Cell death in ES2 cell line exposed to vorinostat, 5-aza-dC, carboplatin and/or paclitaxel 86
Figure 3. 9 - Cell death in HGSC-OVCAR3 cell line exposed to vorinostat, 5-aza-dC, carboplatin ........... 87
Figure 3. 10 - Cell proliferation curve for ES2 and OVCAR3 cells exposed to HDACIs and 5-aza-dC ....... 88
Figure 3. 11 - Wound healing assay in ES2 cells and OVCAR3 cells exposed to vorinostat. .................... 89
Figure 4. 1 - Vorinostat affects cell proliferation of clear cell carcinoma (ES2) but not of serous
carcinoma (OVCAR3) ............................................................................................................................... 104
Figure 4. 2 - Long term exposure of Vorinostat induces p21 expression and cell cycle arrest in clear cell
carcinoma (ES2) ....................................................................................................................................... 105
Figure 4. 3 - The expression of mutant p53 increases in ES2 upon vorinostat removal, after long term
exposure ................................................................................................................................................... 106

xv
Figure 4. 4 - Vorinostat increases cell death in clear cell carcinoma (ES2) ............................................. 107
Figure 4. 5 - Vorinostat exposure increase the levels of HNF1β in clear cell carcinoma (ES2), both in
short and long term exposure ................................................................................................................. 108
Figure 5.1 – Vorinostat increases the expression of mRNA of Notch receptors, Delta/Jagged ligands
and Hey/Hes downstream target genes ................................................................................................. 118
Figure 5. 2 – Vorinostat increases the mRNA expression of Notch receptors, ligands and downstream
targets in ovarian serous carcinoma OVCAR3 cell line ........................................................................... 120
Figure 5. 3 - Schematic representation of Notch pathway in ovarian cancer ........................................ 123
Figure 6. 1 – Morphological characterization of cells from ascitic fluid ................................................. 136
Figure 6. 2 - Characterization of the primary ovarian carcinoma of the patient from whose ascitic fluid
IPO-SOC43 was established ..................................................................................................................... 137
Figure 6. 3 - Detection of cytokeratins and vimentin in IPO-SOC43 cell line by flow cytometry .......... 138
Figure 6. 4 - Ovarian biomarkers in IPO-SOC43 cell line ......................................................................... 139
Figure 6. 5 - Expression of biological markers in 2D cell culturing models in IPO-SOC43 cell line ........ 140
Figure 6. 6 - Characterization of IPO-SOC43 cell line in 2D model .......................................................... 141
Figure 6. 7 - Proliferation curve of IPO-SOC43 cell line ........................................................................... 142
Figure 6. 8 - Wound healing assay to determine the migration rate of IPO-SOC43. ............................. 143
Figure 6. 9 - cCGH profiles of cells from ascitic fluid and IPO-SOC43 cell line ........................................ 144
Figure 6. 10 - Sanger sequencing histogram of TP53 exon 5 .................................................................. 147
Figure 6. 11 - Aggregation of IPO-SOC43 with and without ROCK Inhibitor in 3D culture system ........ 148
Figure 6. 12 - 3D Culture progression with measurement of aggregates area and growth curve of IPO-
SOC43 cells with ROCK Inhibitor ............................................................................................................. 149
Figure 6. 13 - Characterization of IPO-SOC43 cell line in 3D model........................................................ 150
Figure 6. 14 - Expression of biological markers relevant for the establishment of 3D cell culturing
models in IPO-SOC43 cell line .................................................................................................................. 150
xvi
TABLE INDEX
Table 1. 1 - TNM and FIGO classifications for Ovarian, Fallopian Tube and Peritoneal Cancer Staging
System ........................................................................................................................................................ 15
Table 1. 2 - Classes of histone deacetylases; localization in the cell, length, chromosomal localization
and function ............................................................................................................................................... 35
Table 2. 1 - Antibodies used for imunohistochemical study ..................................................................... 50
Table 2. 2 - Clinical and pathological characteristics of the EOC patients ................................................ 52
Table 2. 3 - Expression of HDACs in EOC commercial lines ....................................................................... 53
Table 2. 4 - Expression of HDACs in EOC samples and its association with the histological type ........... 54
Table 2. 5 - Association of HDACs expression and clinicopathological parameters in EOC ..................... 57
Table 2. 6 - Multivariate analysis of HDAC3, HDAC4c and phosphoHDAC4/5/7 expression for
histological type and metastasis ............................................................................................................... 59
Table 2. 7 - Expression of cell cycle markers in EOC commercial cell lines .............................................. 59
Table 2. 8 - Expression of cell cycle markers in EOC samples ................................................................... 60
Table 2. 9 - Expression of HDACs expression and cell cycle markers in EOC ............................................ 62
Table 3. 1 - Chemicals used in ovarian cancer cell lines ............................................................................ 76
Table 6. 1 - Antigens evaluated and antibodies used to characterize IPO-SOC43 cell line .................... 130
Table 6. 2 - Primers for PCR of the TP53 gene (Exons 4-9) ...................................................................... 133
Table 6. 3 - Description of cCGH chromosome alterations in IPO-SOC43 cell line ................................. 145

xvii

xviii
ACKNOWLEDGMENTS
This PhD thesis would not be possible without a large number of contributions,
and for this reason I would like to express my gratitude to my supervisors, Ana Félix,
for all the precious mentoring, guidance and motivation and to Jacinta Serpa for
guiding me in the field of molecular biology, teaching me professional attitude towards
designing, conducting and evaluating laboratory experiments. Both of them generously
shared their time and expertise with me, were always open to answer my questions
and discuss my ideas and were critical and supportive at the same time. I am deeply
indebted to them for helping me.
I am also thankful for all former and present members of the UIPM with a very
special thanks to Leonor Remédio, Francisco Caiado, Germana Domingues, Lídia Silva,
Sofia Gouveia and Filipa Coelho for all the good work environment, great friendship
and helpful discussions.
I would like to thank to the director José Cabeçadas, doctors and all colleagues of
the Pathology Department of IPOLFG, especially to Teresa Pereira, Sónia Araújo, Filipa
Areia, Cátia Teixeira, Arsénia Manhita and Filipa Antunes for creating a motivating and
pleasant working atmosphere. From IPOLFG, I also thank Carmo Martins for her
precious help with CGH and to António Guimarães for the valuable clinical data.
I would like to thank to Vitor Espírito Santo and Catarina Brito, from IBET for
sharing your knowledge of 3D cultures.
Last, but not least, I would like to thank my parents and my family for their
continuous support and encouragement. To my husband, for his patience and caring
attention during my study and to my sons Pedro and Tiago for the endless love and
kindness.

xix

xx
LIST OF PUBLICATIONS
The author declares that has designed and performed research, collected and
analyzed data, and wrote the text of the published paper, and the manuscripts in
preparation, which are part of this dissertation.
Published original paper:
Silva, F., Félix, A. & Serpa, J. Functional redundancy of the Notch pathway in
ovarian cancer cell lines. Oncol. Lett. 12, 2686–2691 (2016).
Published in proceedings (Poster):
Silva, F., Serpa, J., Domingues, G., Silva, G., Almeida, A., Félix, A. Cell death
induced by HDACS inhibitors in ovarian cancer cell lines (serous and clear cells
carcinomas) – role of NOTCH, TP53 and FN1. BMC Proceedings, 4(Suppl 2):P36 (2010).
Silva, F., Serpa, J., Fernandes, S., Dias, S., Félix, A. HDACS inhibitors effects in
Ovarian Clear Cell Carcinoma. SINAL, 6th National Meeting, April, UMinho (2012).
Silva, F., Fernandes, S., Félix, A., Serpa, J., Vorinostat Increases ARID1A splicing
variant expression which may regulate HNF1β and cell survival, in Ovarian Clear Cell
Carcinoma (CCC). International Journal of Gynecological Cancer, 23 (8) (2013)
Silva, F., Coelho, F., Fernandes, S., Félix, A., Serpa, J., Vorinostat induces HNF1β
expression and latency in ovarian clear cell carcinoma (OCCC) and resistance in ovarian
serous carcinoma (OSC), EACR-AACR-SIC, Anticancer Drug Action and Drug Resistance:
from Cancer Biology to the Clinic, (2015)

xxi

xxii
ABBREVIATIONS
ARID1A adenine thymine-rich interactive domain 1A gene
AKT akt serine/Threonine kinase
ATCC American Type Culture Collection
BAX BCL-2 associated X protein
BCL-2 B-cell lymphoma 2
BAD BCL-2 associated agonist of cell death
BRAF v-Raf murine sarcoma viral oncogene homolog B1
BRCA1 breast cancer 1 gene
BRCA2 breast cancer 2 gene
CA125 cancer antigen 125
CCNE1 cyclin E1
CDKN1A cyclin dependent kinase inhibitor 1A
CTNNB1 catenin beta 1
EOC epithelial ovarian cancer
ER estrogen receptor
FACS fluorescence-activated cell sorting
FBS fetal bovine serum
FIGO Féderation Internationale de Gynécologie et d’Obstétrique
FITC fluorescein isothiocyanate
FOXM1 forkhead box M1
GSH glutathione peroxidase
HAT histone acetyltransferases
HDAC histone deacetylases
HDACI histone deacetylases inhibitors
HES human hairy and enhancer of split
HEY hairy/enhancer of split related with YRPW motif
HER-2 human epidermal growth factor receptor 2
HPRT hypoxanthine-guanine phosphoribosyl transferase
HNF1β hepatocyte nuclear factor 1β
γ-H2AX gamma-H2A histone family member X
xxiii
LOH heterozygosity
MAPK mitogen-activated protein kinase
MLH1 mutL homolog 1
MSH2 mutS homolog 2
MSH6 mutS homolog 6
IHC immunohistochemistry
KRAS kirsten rat sarcoma viral oncogene homolog
MAPK mitogen-activated protein kinase
mTOR mammalian target of rapamycin
NICD notch intracellular domain
NF1 neurofibromin 1
PAX paired box 2
p16INK4A cyclin-dependent kinase inhibitor 2A
p21 cyclin-dependent kinase inhibitor 1A
p53 tumor protein/suppressor p53
PBS phosphate-buffered saline
PCR polymerase chain reaction
PFA paraformaldehyde
PIK3CA phosphatidylinositol-4,5-bisphosphate 3-kinase catalytic subunit alpha
PMS2 PMS1 homolog 2, mismatch repair endonuclease
PPP2R1A protein phosphatase 2, regulatory subunit A
PTEN phosphatase and tensin homolog
ROMA risk of ovarian malignancy algorithm
ROS reactive oxygen species
RB1 retinoblastoma transcriptional corepressor 1
RSF1 remodeling and spacing factor 1
SAHA suberoylanilide hydroxamic acid
TCGA The Cancer Genome Atlas
TMA tissue microarray
TP53 gene encoding tumor protein p53
WHO World Health Organization
WT1 wilm’s tumor 1 factor

CHAPTER 1


Chapter 1
2
INTRODUCTION
Cancer is a group of distinct diseases in which cells proliferate out of control and
invade other tissues. Cancer cells no longer respond to genes that regulate cell cycle,
function, differentiation and death. Tumor cell invasion of surrounding tissues and
distant organs is the main cause of morbidity and mortality for most cancer patients1.
The biological process by which normal cells are transformed into malignant cancer
cells has been the subject of a large research in the biomedical sciences for many
decades1. Cancer is the leading cause of mortality worldwide, being responsible for 8.2
million cancer related deaths in 20122.
1.1 Epithelial ovarian cancer (EOC)
1.1.1 Epidemiology and Risk factors
Epithelial ovarian cancer (EOC) is the most lethal gynecology malignancy3–5 and
the seventh most common in women worldwide. Nearly 240,000 women6 were
estimated to have been diagnosed with ovarian cancer in 2012 with incidence rates
varying across the world. Although ovarian cancer accounts for only 4% of all cancers
in women7, it has one of the highest death-to-incidence ratios, due to difficulties in
detection, diagnosis and therapy of the disease8. Like most cancers, the risk of ovarian
cancer rises with age: the median age of patients at diagnosis is 60 years, and the
average lifetime risk for women in developed countries is around one in 709,10.
Most ovarian carcinomas occur after menopause when the ovaries have little or
no physiological role. As a consequence of the absence of abnormal ovarian function
associated with major symptoms and the anatomical location (deep in the pelvis)
about 70% of the patients are diagnosed with advanced-stage (extra-ovarian) disease
and 5-years survival rates are between 20-40%11,12. Although most advanced stage
cancers respond to standard therapy, relapse occurs in over 70% of patients, with
progression associate with resistance to therapy and fatal disclosure13.
Chapter 1
3
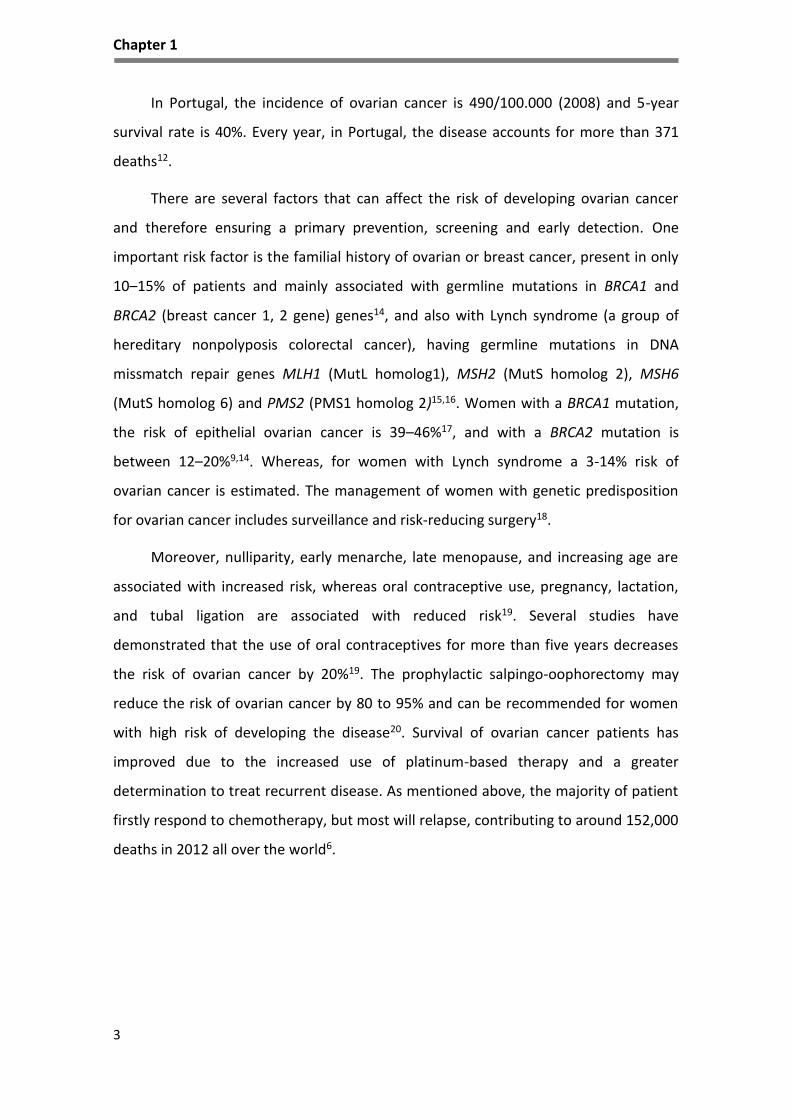
In Portugal, the incidence of ovarian cancer is 490/100.000 (2008) and 5-year
survival rate is 40%. Every year, in Portugal, the disease accounts for more than 371
deaths12.
There are several factors that can affect the risk of developing ovarian cancer
and therefore ensuring a primary prevention, screening and early detection. One
important risk factor is the familial history of ovarian or breast cancer, present in only
10–15% of patients and mainly associated with germline mutations in BRCA1 and
BRCA2 (breast cancer 1, 2 gene) genes14, and also with Lynch syndrome (a group of
hereditary nonpolyposis colorectal cancer), having germline mutations in DNA
missmatch repair genes MLH1 (MutL homolog1), MSH2 (MutS homolog 2), MSH6
(MutS homolog 6) and PMS2 (PMS1 homolog 2)15,16. Women with a BRCA1 mutation,
the risk of epithelial ovarian cancer is 39–46%17, and with a BRCA2 mutation is
between 12–20%9,14. Whereas, for women with Lynch syndrome a 3-14% risk of
ovarian cancer is estimated. The management of women with genetic predisposition
for ovarian cancer includes surveillance and risk-reducing surgery18.
Moreover, nulliparity, early menarche, late menopause, and increasing age are
associated with increased risk, whereas oral contraceptive use, pregnancy, lactation,
and tubal ligation are associated with reduced risk19. Several studies have
demonstrated that the use of oral contraceptives for more than five years decreases
the risk of ovarian cancer by 20%19. The prophylactic salpingo-oophorectomy may
reduce the risk of ovarian cancer by 80 to 95% and can be recommended for women
with high risk of developing the disease20. Survival of ovarian cancer patients has
improved due to the increased use of platinum-based therapy and a greater
determination to treat recurrent disease. As mentioned above, the majority of patient
firstly respond to chemotherapy, but most will relapse, contributing to around 152,000
deaths in 2012 all over the world6.

Chapter 1
4
1.1.2 Histological Types
Ovarian tumors mainly arise from three different cell types; epithelial, germ, and
sex cord stromal cells21 and several studies have contributed to confirm the
heterogeneous nature of EOC based on their clinicopathological and molecular
features and possible putative precursor lesions22–24. EOC represent 90% of ovarian
malignant tumors21 and is a very heterogeneous group of neoplasms that exhibit a
wide range of tumor morphology, clinical manifestations and underlying genetic
alterations25.
Current investigations support the general view that serous tumors develop, at
least in 50%, from the fallopian tube; endometrioid and clear cell tumors are
postulated to arise from endometrial tissue in the ovary (most probably by passing
through the fallopian tube) that results in endometriosis and tumors23,24.
According to the latest classification by World Health Organization2 in 2014 and
based on histopathology, immunohistochemistry, and molecular genetic analysis,
ovarian epithelial tumors are grouped into seven different types. Low grade tumors
include low grade serous carcinoma (LGSC<5%), endometrioid carcinomas (EC; 10%),
mucinous carcinomas (MC; 3%), and a subset of clear cell carcinomas (CCC; 10%)26–29.
These tumors develop slowly and in general are confined to the ovary30, genetically
stable, and each histological type has a distinct genetic profile27,29,30. In contrast, high
grade tumors progress rapidly and include high grade serous carcinoma (HGSC),
seromucinous tumors (probably), undifferentiated carcinoma and some clear cell
carcinomas28 (Figure 1.1). HGSC is the most prevalent type and it is characterized by a
very homogenous genetic profile characterized by tumor protein p53 (TP53) mutations
and exhibit widespread DNA copy number alterations27–31.
Chapter 1
5
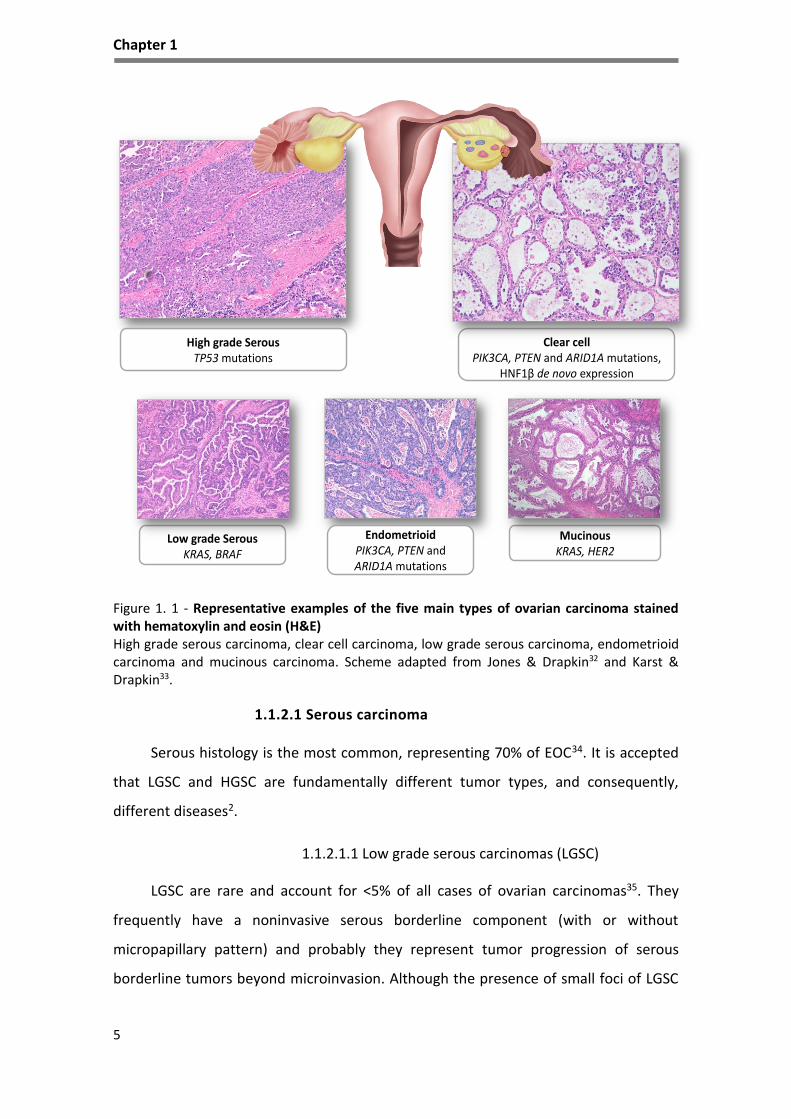
Figure 1. 1 - Representative examples of the five main types of ovarian carcinoma stained with hematoxylin and eosin (H&E) High grade serous carcinoma, clear cell carcinoma, low grade serous carcinoma, endometrioid carcinoma and mucinous carcinoma. Scheme adapted from Jones & Drapkin32 and Karst & Drapkin33.
1.1.2.1 Serous carcinoma
Serous histology is the most common, representing 70% of EOC34. It is accepted
that LGSC and HGSC are fundamentally different tumor types, and consequently,
different diseases2.
1.1.2.1.1 Low grade serous carcinomas (LGSC)
LGSC are rare and account for <5% of all cases of ovarian carcinomas35. They
frequently have a noninvasive serous borderline component (with or without
micropapillary pattern) and probably they represent tumor progression of serous
borderline tumors beyond microinvasion. Although the presence of small foci of LGSC
Clear cellPIK3CA, PTEN and ARID1A mutations,
HNF1β de novo expression
High grade SerousTP53 mutations
MucinousKRAS, HER2
EndometrioidPIK3CA, PTEN andARID1A mutations
Low grade SerousKRAS, BRAF

Chapter 1
6
in an ovarian borderline tumor is associated with a good prognosis, patients with
advanced stage disease fare less favorably. Typically, present as large masses that are
confined to one ovary (stage Ia), are indolent, and have good prognosis2,28. They show
a relative genetic stability and usually display a variety of somatic alterations that
include mutations in v-Raf murine sarcoma viral oncogene homolog B1 (BRAF) or
kirsten rat sarcoma viral oncogene homolog (KRAS) genes, in 33-50% and 27-36%36,
respectively.
Microscopically, LGSC has small papillae of tumor cells exhibiting uniform nuclei
within hyalinized stroma, which often contains psammoma bodies. Distinction of LGSC
from HGSC relies on cell atypia and mitotic activity. Ki-67 immunoreaction differs
between the two tumor types, being the median Ki-67 labeling index lower (2.5%) in
LGSC than in HGSC (22.4%)37. The most useful immunomarker is p53 as this tumor type
shows a wild type positivity in the nuclei in contrast with HGSC2.
1.1.2.1.2 High grade serous carcinomas (HGSC)
HGSC are aggressive tumors that are usually diagnosed at an advanced stage,
and although they frequently respond to surgery and platinum-based chemotherapy,
they eventually recur. Microscopically, HGSC show neoplastic cells displaying papillary
and solid growth with slit-like glandular lumens. The tumor cells are usually of
intermediate size, with spotted bizarre mononuclear giant cells exhibiting prominent
nucleoli26. In contrast to LGSC, these tumors show more than threefold variation in
nuclear size26,38.
In contrast to LGSCs, HGSCs are not associated with serous borderline tumors
and typically exhibit TP53 mutations and BRCA alterations39, and most of these tumors
show immunoexpression for p53, BRCA1, WT1 (Wilm’s tumor 1 factor), p16 and have
estrogen receptors (ER) in approximately two-thirds of HGSC cases40.
HGSC show considerable genetic instability, harbor mutations and show an
association of TP53 mutations with increased expression of gamma-H2A histone family
member X (-H2AX), a marker of DNA damage, expression of Ki-67, a proliferation
marker and also potential alterations in BRCA1 and BRCA2 genes. In addition,

Chapter 1
7
overexpression/amplification of HER2/neu, AKT (AKT serine/ threonine kinase) and loss
of heterozygosity (LOH) on chromosomes 7q and 9q are common4. Profiling of mRNA
and miRNA (micro RNA) of 489 Type II tumors, in particular HGSC, performed by The
Cancer Genome Atlas (TCGA)31 revealed that almost all samples comprised TP53
mutations (in almost 98% of the cases ) and significant recurring somatic mutations in
NF1 (neurofibromin 1), BRCA1, BRCA2, RB1 (RB transcriptional corepressor 1),
CDK1227–31 (cyclin dependent kinase 12), CCNE1 (cyclin E1), AKT2 (AKT serine/
threonine kinase 2), RSF1 (remodeling and spacing factor 1) and PIK3CA
(phosphatidylinositol-4,5-bisphosphate 3-kinase catalytic subunit alpha)31,41.
KRAS mutations are rare and BRAF mutations have not been described in HGSC36. In
addition, Notch3 and FoxM1 (forkhead box M1) were found to be involved in HGSC
pathophysiology. More recently, the results of the TCGA study were highlighted in
another genome-wide report42.
As a result of the chromosomal instability, HGSC are typically aneuploid, with
very complex karyotypes. The aCGH (array Comparative Genomic Hybridization)
findings of the TCGA study31 reveal gains/amplifications of 1q, 3q 6p 7q, 8q, 12p, 20p
and 20q; and losses of 4p, 4q, 5q, 6q, 8p, 9p, 9q, 11p, 11q ,13q, 14q, 15q, 16p, 16q,
17p, 17q, 18p, 18q, 19p, 19q and 22q some of them already reported in other
studies43. Other genetic alterations observed, suggest a co-operative effect, for
example, associations have been found between CCNE1 (cyclin E1) and 12p
amplification41, and between MYC (V-Myc Avian Myelocytomatosis viral oncogene
homolog) and 20q amplification by fluorescence in situ hybridization (FISH). Also,
positive associations were identified between gains on 19 and 20q, gain of 20q and
loss of X, and between the loss of several regions, particularly 17q.
1.1.2.2 Endometrioid carcinomas (EC)
After HGSC, EC and clear cell carcinomas (CCC) are the most frequent types of
EOC accounting for approximately 10-15% of all ovarian carcinomas23. The molecular
and genetic alterations that underlie the development of these tumors are beginning
to emerge. It has been recognized that endometriosis is the precursor lesion of EC and
Chapter 1
8
CCC and a direct transition from ovarian atypical endometriosis to EC or CCC, in 15%-
32% of cases44.
EC occur most frequently in women of perimenopausal age, and most of them
are found at an early stage45. These ovarian tumors are bilateral in 28% of cases and
are associated in 15%–20% of cases with a carcinoma of the endometrium45,46. In the
former presentation, both tumors are endometrioid in type in the majority of cases2.
Up to 42% of cases, evidences of bilateral ovarian or pelvic endometriosis is present.
Squamous differentiation inside the tumor occurs in 50% of cases45. Somatic mutations
in CTNNB1 (β-catenin) and PTEN (phosphatase and tensin homolog) genes are the
most common genetic alterations identified in ECs, being CTNNB1 mutations
associated with a favorable disease outcome47,48. Also PTEN is mutated in 20% of cases
and its inactivation results in the lack of inhibition of PI3K-AKT signaling pathway that
inhibits apoptosis and activates proliferation. The finding of LOH at 10q23 and
somatic PTEN mutations in endometriotic cysts, adjacent to ECs with similar genetic
alterations, provides additional evidence of the precursor role of endometriosis in
ovarian carcinogenesis47. An alternative mechanism for the activation of PI3K signaling
in EC is activating mutations of PIK3CA, which encodes the p110 catalytic subunit of
PI3K. EC is the most frequently encountered type in patients with hereditary Lynch
syndrome49. The reported frequency of microsatellite instability (MI) in ovarian ECs
ranges from 12.5% to 19%50,51.
Recent discovery of ARID1A mutations in ovarian EC as well as in adjacent
endometriosis, is considered a particular feature of these tumors52, although it appears
to be a late event in endometrial carcinoma53. EC have expression of vimentin,
cytokeratins (CK7, 97%; CK20, 13%), epithelial membrane antigens (EMA), estrogen
and progesterone receptors by immunohistochemical studies54.
1.1.2.3 Clear cell carcinomas (CCC)
CCC is a rare type known to be intrinsically chemoresistant and associate with
very poor prognosis in advanced stages55. Tumors are commonly unilateral. As EC, they
are also associated with endometriosis, and those tumors next to endometriotic
lesions seem to have a more favorable prognosis56. The diagnosis of CCC is based
Chapter 1
9
predominantly in the architectural findings: solid, tubule-cystic and papillary areas
mixed in varied proportions. Cytological features are characterized most commonly for
polygonal to flattened cells with pale or clear cytoplasm, which is attributed to the
accumulation of glycogen and lipids. Densely hyaline basement membrane material
expanding the cores of the papillae or deposit between cells is a common feature.
Mitoses are less frequent than in other types of EOC55.
Based on genome-wide mutational analysis, the most common mutations
identified in CCC include ARID1A mutation in nearly half of the CCC (46%-57%) and loss
of BAF250a expression (protein encoded by ARID1A)44. ARID1A gene has been
identified as a novel tumor suppressor44,57 and acts as a chromatin remodeling
modifier, which stimulates cell signaling that can lead to cell cycle arrest and cell death
in the event of DNA damage, consequently the dysfunction of ARID1A may result in
susceptibility to CCC carcinogenesis through a defect in the repair or replication of
damaged DNA58. A recent study indicated that the loss of ARID1A protein expression is
related to short disease-free survival and chemoresistance in CCC59.
Activating mutations of PIK3CA and deletion of PTEN, are found respectively in
about 50% and 20% of tumors47, supporting the role of an aberrant PI3K/PTEN
pathway in CCC60. In addition, the overexpression of Notch pathway elements has also
been reported in these tumors61,62. In contrast to various other human tumor types,
TP53 and Rb (retinoblastoma protein) mutations are rarely detected in CCC, but these
cell cycle regulatory proteins may be involved in the carcinogenesis of CCC through
inactivation by ARID1A58 for example. In CCC, no BRCA alterations, chromosomal
instability, nor complex karyotypes as seen in HGSC63 have been reported, however
epigenetic modulation of signaling pathways have been described64–66.
Molecular alterations in CCC are mainly unknown and this histological type
represent a distinct challenge with a unique and different histology, with de novo
expression of HNF1β (hepatocyte nuclear factor 1β transcription factor).
HNF1β is involved in the glycogen synthesis67 and regulates several specific
genes, including those encoding dipeptidyl peptidase IV (protein degradation),
osteopontin (bone remodeling), angiotensin converting enzyme 2 (ferritin induction,

Chapter 1
10
iron deposition, and antiapoptosis), annexin 4 (calcium ion binding, epithelial cell
differentiation), and UDP Glucuronosyltransferase 1 Family, Polypeptide A Complex
(UGT1A1) (detoxifycation)68. It is postulated that HNF1β plays an important role in the
pathogenesis and behavior of CCC69. Promoter hypomethylation of HNF1β, and active
transcription, was previously reported in CCC70,71. Moreover, recently, we showed the
role of HNF1 in the intrinsic chemoresistance exhibited by CCC72.
CCC tumor cells are usually positive for HNF1β (>90%) and are negative for ER
and WT1 in >95% of cases37,40. In addition to its presence in CCC, HNF1β is also
expressed in the majority of tumors with cytoplasmic clearing, including renal CCC,
endometrial CCC69 and ovarian and endometrial carcinomas of mixed histology.
1.1.2.4 Mucinous carcinomas (MC)
Mucinous tumors account, approximately, for 3% of EOC. The cells of MC
resemble cells of the gastric pylorus, or intestine45,46,73, showing gastrointestinal
differentiation in the majority of these tumors. Primary MC of the ovary are large,
unilateral and usually confined to the ovary, without ovarian surface involvement or
pseudomyxoma peritonei, while mucinous ovarian metastases are typically small (<10
cm) and bilateral. Malignant mucinous ovarian tumors are often heterogeneous,
showing the coexistence of benign-appearing, borderline, noninvasive carcinoma, and
invasive components. This morphology suggests a step-wise progression from benign
to borderline and from borderline to carcinoma74. The category of mucinous
borderline tumor with intraepithelial carcinoma is used for those tumors that lack
obvious stromal invasion but show unequivocally malignant areas75. Mucinous
borderline tumors with intraepithelial carcinoma have a very low risk of recurrence
(<5%)76.
The gene expression profile of MC differs from the HGSC, EC and
CCC77. KRAS mutations are frequent, (up to 75% of primary MC), and seems to be an
early tumorigenic event78. Using KRAS as a molecular marker, laser capture
microdissection studies have shown the identical KRAS mutation in MC and adjacent
mucinous cystadenomas and borderline tumors74 supports the morphological
continuum of tumor progression.

Chapter 1
11
1.1.2.5 Other types of ovarian carcinomas
Seromucinous carcinomas (SMC), Brenner carcinomas (BC) and
Undifferenciated carcinomas (UC)
Seromucinous carcinomas (SMC) are composed predominantly of serous and
endocervical-type mucinous epithelium. These tumors are quite uncommon and data
on the epidemiology is still insufficient2.
Brenner carcinomas (BC) are extremely rare but Brenner benign tumor accounts
for 5% of benign ovarian epithelial tumors2. BC histogenesis is not well characterized
nor the genetic and molecular events.
Another uncommon histological type is undifferentiated carcinomas (UC), usually
appear as solid masses with extensive necrosis, and a deficient mismatch repair
proteins have been found in almost half of the tumors2.
In summary, each histological type of EOC is associated with a distinct profile of
clinical, morphological, genetic and molecular alterations, which for the most common
low-grade tumors are shared with their respective precursor lesions (borderline
tumors and endometriosis) supporting their stepwise progression. In contrast, the high
grade tumors, aside from a very high frequency of TP53 mutations and molecular
alterations of BRCA1/2, are characterized by marked genetic instability.
1.1.3 Clinical presentation
Ovarian cancer is often described as a ‘silent killer’79 because the symptoms are
non-specific and common to other diseases. Symptoms such as abdominal discomfort,
bloating, gas, nausea, and urinary urgency, frequently lead to misdiagnosis80,81, and
contribute for the high percentage of cases that are diagnosed at an advanced stage.
In addition, there is no routine and reliable screening for ovarian cancer82, hence the
majority of women are diagnosed at advanced stage exhibiting extraovarian and
metastatic (mainly peritoneal) disease.

Chapter 1
12
Approximately 70% of women with ovarian cancer are diagnosed at stage III or IV
of the disease82. Ovarian cancer usually spreads to the opposite ovary/fallopian tube,
and the uterus, and then intraperitoneally. Distant metastases are rare, but may occur
in the liver, lungs, pleura, adrenal glands, and spleen76. The histological grade of
tumors can affect treatment and prognosis. Low grade tumors have a more favorable
prognosis than high grade tumors.
Cancer spread can greatly cause the accumulation of fluid in the abdomen, called
ascites, which is a common complication of ovarian cancer that can cause swelling,
fatigue and shortness of breath82.
CA125, the serum tumor marker carbohydrate antigen 125 also known as mucin
16 (MUC16) is a secreted and membrane-associated glycoprotein expressed by
coelomic and müllerian-derived epithelia, including the epithelium of the fallopian
tube, endometrium and endocervix83.
CA125 levels are low (< 35 U/mL) in the serum of healthy individuals, and CA125
elevation is commonly associated with HGSC, the most common histological type of
ovarian carcinoma83. CA125 can be used for monitoring disease recurrence84. Although
it is elevated in only 50-60% of ovarian cancer patients it can also be elevated in other
non-cancerous gynecological complications such as benign ovarian neoplasms,
endometriosis, pelvis inflammatory disease, liver disease or other malignant
conditions, including cancers of the pancreas, breast, lung and colon85. Nevertheless,
CA125 cannot be used as a unique parameter in the prediction of malignancy. Usually,
a combination of a patient's medical history, clinical examination results, imaging data
and tumor marker profile is used to clinically differentiate malignant ovarian masses
from their benign counterparts and perform a histological exam for diagnosis
confirmation. However, CA125 assay detects circulating MUC16, is one of the most
widely used cancer biomarkers for the follow-up of ovarian carcinoma.
Recently Ricardo et al.86 demonstrated that detection of aberrant cancer-
associated glycoforms (Tn, STn, and T) of MUC16 as well as MUC1 in circulation, in
ovarian cancer tissue using Proximity Ligation Assays (PLA), can improve the yield of
serum assays and they have the capacity to distinguish borderline and malignant
Chapter 1
13
serous tumors from benign lesions with a specificity of 100% and a sensitivity of 70-
80% on tissues. In fact, serous ovarian carcinomas selectively express Tn and STn
glycoforms of MUC16 and MUC1, and these glycomucin profiles are likely to serve as
more cancer-specific biomarkers than the mucins themselves. This study provides
strong support for the use of PLAs to detect aberrant glycoforms of mucins and
thereby improve cancer specificity of biomarker assays86.
The human epididymis secretory protein 4 (HE4) gene was found to be
overexpressed in ovarian cancer87 and is used as a potential serum biomarker. HE4
belongs to the family of whey acidic four-disulfide core (WFDC) proteins with
suspected trypsin inhibitor properties. HE4 was first determined in the epithelium of
the distal epididymis88.
Biomarker HE4 has very low expression in the epithelia of respiratory and female
reproductive tissues including ovary, but high secreted levels can be found in the
serum of ovarian cancer patients89 and also in ovarian cancer tissue88. Recently, Moore
at al.90,91 published a series of papers that used a combination of CA125, HE4 and
menopausal status to predict the presence of a malignant ovarian tumor. Originally,
nine potential biomarkers were evaluated, from which HE4 was the most effective in
detecting ovarian cancer. When CA125 was combined with HE4, the prediction rate
was higher, showing a sensitivity for detecting malignant disease of 76.4% at a
specificity of 95%90,92 in ovarian carcinoma vs endometriotic cysts. Measured values of
HE4 and CA125 can be combined in an algorithm called ROMA (Risk of Ovarian
Malignancy Algorithm), which additionally includes the menopausal status. Several
published studies91,92 show that ROMA helps in the triage of pre and postmenopausal
women suspected for ovarian cancer. This high accuracy helps to stratify patients into
low-and-high risk groups and therefore contributes to better diagnosis, treatment and
outcome.
Non-invasive screening tools have been studied to help screening this cancer,
such as transabdominal and transvaginal ultrasonography (TVS), since it is able to
estimate ovarian size, detects masses as small as 1 cm and distinguishes solid lesions
from cysts. Besides its important role in differentiating between benign and malignant

Chapter 1
14
adnexal masses93, the specificity of ultrasonography is not adequate for its use as a
single screening modality94.
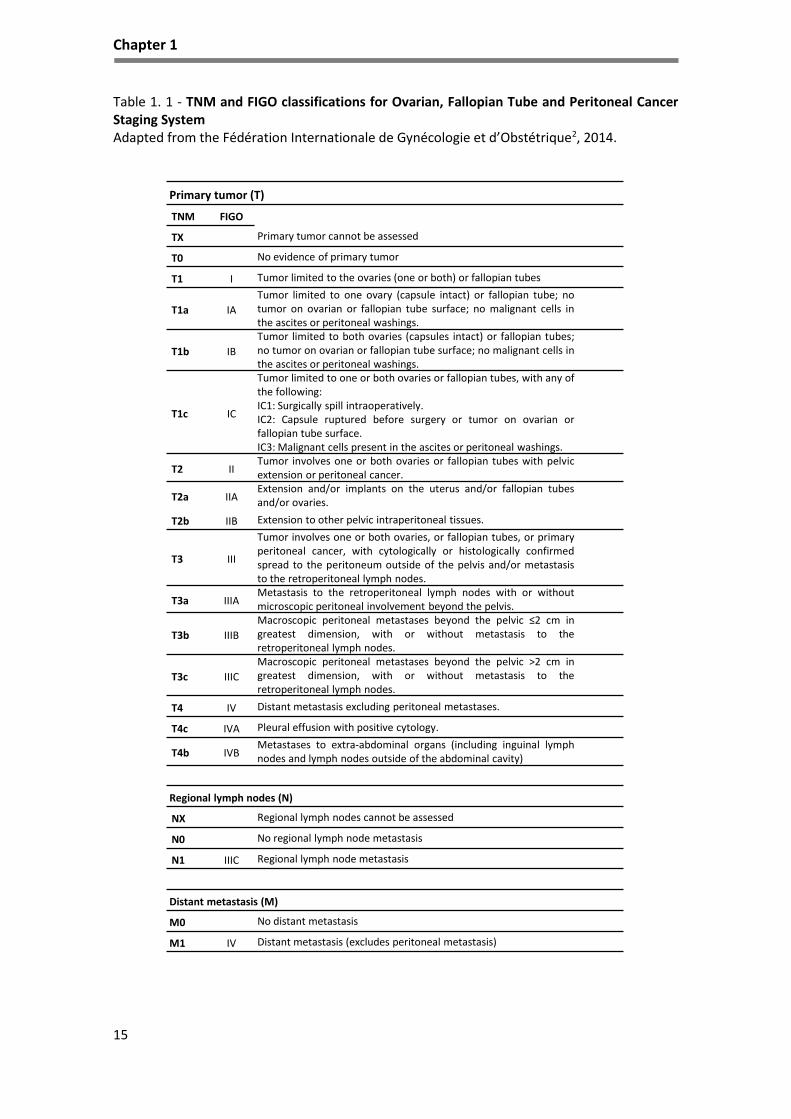
The majority of ovarian tumors are surgically staged to determine the presence
of extraovarian disease, classified according to the terms of the staging scheme (I to IV)
developed by the Fédération Internationale de Gynécologie et d’Obstétrique (FIGO)
and the classification system prognosis helps to define treatment (Table 1.1). Staging is
performed by examining histological sections of tissue samples and cytological
assessment of fluid samples95.
1.1.4 Treatment of ovarian cancer
Ovarian cancer is highly curable when it is confined to the ovaries, with an
expected 80–95% in 5-year survival73. Only about 20% of affected patients are found at
this stage, and the diagnosis is often made incidentally during the study of another
medical condition. Current therapies for advanced ovarian carcinomas are limited and
not curative and the search for new therapeutic agents in the treatment of the disease
and recurrence, have been disappointing22.
The standard treatment for ovarian cancer patients includes cytoreductive
surgery, during which adequate staging is performed by pathological examination of
ovarian and other tissues to define the histological nature of the tumor and its stage.
In patients diagnosed with early disease, surgery alone may be sufficient but in
advanced disease, debulking surgery followed by chemotherapy is recommended96.
Chemotherapy after surgery is referred to as ‘first-line’ treatment and involves a
combination of a platinum and taxane-based chemotherapy (usually six cycles of
carboplatin and paclitaxel) delivered intravenously (IV) or intraperitonealy (IP)97,98.
Patients with advanced ovarian cancer who aren’t initially able to undergo surgery due
to unressectable tumors can be treated with chemotherapy, being considered for
surgery (neoadjuvant treatment)9 and then followed by platinum-based combination
of chemotherapy, or not. Although initially the majority of patients become tumor
free, the disease will recur and inevitably progress under treatment99.
Chapter 1
15
Table 1. 1 - TNM and FIGO classifications for Ovarian, Fallopian Tube and Peritoneal Cancer Staging System Adapted from the Fédération Internationale de Gynécologie et d’Obstétrique2, 2014.
Primary tumor (T)
TNM FIGO
TX Primary tumor cannot be assessed
T0 No evidence of primary tumor
T1 I Tumor limited to the ovaries (one or both) or fallopian tubes
T1a IA
Tumor limited to one ovary (capsule intact) or fallopian tube; notumor on ovarian or fallopian tube surface; no malignant cells inthe ascites or peritoneal washings.
T1b IB
Tumor limited to both ovaries (capsules intact) or fallopian tubes;no tumor on ovarian or fallopian tube surface; no malignant cells inthe ascites or peritoneal washings.
T1c IC
Tumor limited to one or both ovaries or fallopian tubes, with any ofthe following:IC1: Surgically spill intraoperatively.IC2: Capsule ruptured before surgery or tumor on ovarian orfallopian tube surface.IC3: Malignant cells present in the ascites or peritoneal washings.
T2 IITumor involves one or both ovaries or fallopian tubes with pelvicextension or peritoneal cancer.
T2a IIAExtension and/or implants on the uterus and/or fallopian tubesand/or ovaries.
T2b IIB Extension to other pelvic intraperitoneal tissues.
T3 III
Tumor involves one or both ovaries, or fallopian tubes, or primaryperitoneal cancer, with cytologically or histologically confirmedspread to the peritoneum outside of the pelvis and/or metastasisto the retroperitoneal lymph nodes.
T3a IIIAMetastasis to the retroperitoneal lymph nodes with or withoutmicroscopic peritoneal involvement beyond the pelvis.
T3b IIIB
Macroscopic peritoneal metastases beyond the pelvic ≤2 cm ingreatest dimension, with or without metastasis to theretroperitoneal lymph nodes.
T3c IIIC
Macroscopic peritoneal metastases beyond the pelvic >2 cm ingreatest dimension, with or without metastasis to theretroperitoneal lymph nodes.
T4 IV Distant metastasis excluding peritoneal metastases.
T4c IVA Pleural effusion with positive cytology.
T4b IVBMetastases to extra-abdominal organs (including inguinal lymphnodes and lymph nodes outside of the abdominal cavity)
Regional lymph nodes (N)
NX Regional lymph nodes cannot be assessed
N0 No regional lymph node metastasis
N1 IIIC Regional lymph node metastasis
Distant metastasis (M)
M0 No distant metastasis
M1 IV Distant metastasis (excludes peritoneal metastasis)

Chapter 1
16
Similar to other malignancies, the management of ovarian cancer has evolved
from single agent to combination of chemotherapy agents. The most frequently used
combination as the first-line chemotherapy for ovarian cancer patients is the
combination of platinum and taxane drugs.
Two platinum compounds are most commonly used, cisplatin and carboplatin.
Cisplatin is one of the most potent antitumor agent known, displaying clinical activity
against a wide variety of solid tumors100,101. The toxic side effects associated with the
use of this drug was the motion for the development of the second-generation
platinum chemotherapeutic agent, carboplatin102,103.
Besides their chemical similarity, cisplatin and carboplatin operate by same
mechanisms: the formation of protein and DNA adducts (covalent bounds) and the
generation of reactive oxygen species (ROS). Labile ligands in the coordination sphere,
chloride for cisplatin and 1,1-cyclobutanedicarboxylate (CBDCA) for carboplatin, are
displaced by water or other biological nucleophiles, and the activated cis-
diammineplatinum(II) moiety bind to purine bases in nuclear DNA104. The resulting
platinum-DNA adducts, mainly 1,2-intrastrand cross-links, leads to death of cancer cells
through the induction of errors in DNA, transcription inhibition and subsequent
downstream effects105. Because cisplatin and carboplatin have the same NH3 non-
leaving group ligands, the resulting DNA adducts are identical106 and therefore the
drugs exhibit the same spectrum of activity107. Its cytotoxic mode of action is mediated
by its interaction with DNA to form DNA adducts, primarily intra-strand crosslink
adducts, which activate several signal transduction pathways, including those involving
ATR (serine/threonine-protein kinase ATR), p53, p73 and MAPK, ending with the
activation of apoptosis100.
Carboplatin, however, is significantly less toxic than cisplatin. The typical patient
dose for carboplatin is approximately ten times greater than cisplatin (400 mg/m2
versus 40 mg/m2), and the dose-limiting toxic side effect of carboplatin is
myelosuppression in contrast to nephrotoxicity for cisplatin102.
Taxanes are hydrophobic mitotic inhibitors and paclitaxel is one of the taxanes in
clinical use. Paclitaxel is highly protein bound, with large volumes of distribution and

Chapter 1
17
poor penetration into the central nervous system108 and is eliminated via hepatic
metabolism. Despite the initial effectiveness of the response to paclitaxel in most
cases patients in due course become resistant and relapse109. At a higher dose,
paclitaxel is known to suppress microtubule minus ends detachment from
centrosomes110–112. The taxanes can also induce apoptosis and have anti-angiogenic
properties113. In various studies it is showed as an effective anticancer agent against
lung, breast, ovarian, leukemia and liver cancer114.
Regarding the mechanism of action of taxanes, they bind to the β-subunit of
tubulin, resulting in the formation of stable, non-functional microtubule bundles and
thus interfering with mitosis, inducing a cell cycle arrest in G2 for paclitaxel and in S-
phase for docetaxel115. Recent studies showed that taxanes are also able to induce ROS
production in cancer cells, and hydrogen peroxide (H2O2) was found to be involved in
induced cancer cell death in vitro and in vivo116,117.
Tumor resistance to chemotherapy may be present at the beginning of
treatment, can develop during treatment, or become apparent on recurrence of
disease118. Patient response to chemotherapy for ovarian cancer is in fact
heterogeneous and there are no tools to aid the prediction of sensitivity or resistance
to chemotherapy, treatment stratification and current use in clinical setting119.
Resistance mechanisms that limit the extent of DNA damage associated with
chemotherapy include decrease of intracellular drug accumulation, increased
drug inactivation and increased DNA damage repair or inhibition of transmitted DNA
damage recognition100. Increased glutathione levels is also a mechanism of resistance,
since thiols are highly nucleophilic and besides being ROS scavengers they also react
with platinum derived drugs as carboplatin and cisplatin72.
ROS are naturally produced by cells through aerobic metabolism, and high levels
of ROS in the cells are associated with many diseases including cancer120. However,
under certain conditions, ROS increase proapoptotic molecules such as p53 and p38
MAP kinase121. ROS-sensitive signaling pathways are persistently elevated in many
types of cancers, where they participate in cell growth/proliferation, differentiation,
protein synthesis, glucose metabolism, cell survival and inflammation122. ROS can act

Chapter 1
18
as second messengers in cellular signaling123. H2O2 regulates protein activity through
reversible oxidation of its targets including protein tyrosine phosphatases, protein
tyrosine kinases, receptor tyrosine kinases and transcription factors122,123. The
formation of ROS upon chemotherapy depends on the concentration of
chemotherapeutic agents and the duration of exposure124. The efficiency of several
chemotherapeutic agents depends on the alteration of redox state through the
generation of ROS, inducing cell death125.
One main explanation on tumor cell resistance to paclitaxel is the overexpression
of P-glycoprotein (P-gp, MDR-1), which works as a drug efflux pump. However, clinical
utility of P-gp inhibitors are often ineffective or toxic at the doses required to
attenuate P-gp function126,127. Other possible mechanisms of resistance involve
alterations in the drug-binding affinity of the microtubules128, changes in tubulin
structure and cell cycle deregulation129. Thus, paclitaxel-resistant mechanisms are
complicated and still not entirely clear.
Summing up, ovarian cancer usually responds to chemotherapy, (the
combination of carboplatin and paclitaxel is the most used) but, in the majority of
cases the cancer recurs resulting in the death of eventually half of patients77 as a
consequence of the development of drug resistance99. Therapeutic resistance can arise
from tumor cells that are intrinsically resistant as well as those that have acquired
resistance during treatment130. To date, there are no reliable clinical factors that can
properly stratify patients for suitable chemotherapy strategies.
1.2 Molecular features of ovarian cancer
Alterations in cell cycle regulatory genes, mainly tumor suppressor genes and
proto-oncogenes induce an unrestrained growth of cells and serve as precursors of
immortality. Of the many regulators, tumor suppressor proteins play a pivotal role in
the cell cycle regulation process and are highly deregulated in ovarian carcinomas131.
Besides some cases integrated in hereditary cancer syndromes, most mutations seen
in EOC are somatic mutations affecting cells by interfering with several signaling
pathways and cell mechanisms.

Chapter 1
19
1.2.1 Pathways involved in ovarian cancer
1.2.1.1 Notch Signaling Pathway
Notch signaling pathway is an evolutionary conserved pathway that is required
for embryonic development, and in adult tissues acts in homeostasis132. Notch
signaling is a justacrine pathway that has been found to be deregulated in human
hematological malignancies and solid tumors133,134. It has multiple roles in cell fate
determination through regulation of proliferation, differentiation, survival and
apoptosis135,136. Notch receptors (Notch1-4) as well as their ligands Delta-like (Dll1, 3
and 4) and Serrate-like Jagged1 and 2137–140 are single-pass transmembrane proteins
with extracellular domains that consist of multiple epidermal growth factor (EGF)-like
repeats. The extent of EGF-like repeat fucosylation by the fucosyltransferases, such as
Fringe, determines the affinity strength between the receptors and their ligands. Notch
receptors are synthesized in the endoplasmic reticulum as an inactive single peptide
precursor141.
Notch signaling is initiated by the binding of Notch Delta/Jagged ligands to Notch
receptors (Figure 1.2). This interaction induces a first cleavage (S1) in the Notch
receptor by furin-like convertases producing an extracellular N-terminal fragment and
a transmembrane C-terminal fragment that also includes the Notch intracellular
domain (NICD). A second cleavage (S2) occurs catalyzed by a member of disintegrin
and metalloproteases (ADAM) family (ADAM17 or ADAM10), also known as the
metalloproteinase tumor necrosis factor-α-converting enzyme (TACE). The remaining
Notch fragment is then accessible to the presenilin-dependent γ-secretase protease
complex and this complex carries out the third and final cleavage (S3) of the Notch
protein135,142. This final cleavage event releases the active NICD into the cytoplasm and
after translocation into the nucleus, binds to ubiquitous transcription factor CSL
(CBF1/Suppressor of Hairless, and Longevity-Assurance Gene-1), and converts a large
co-repressor complex into a transcriptional activating complex. The complex contains
NICD, CSL, mastermind-like protein (MAML; a transcriptional coactivator), SKIP (Ski-
interacting protein as a CBF1 binding protein) and p300, and activates the transcription
of Notch target genes. The Notch target genes are transcription factors of the Hairy

Chapter 1
20
Enhancer of Split (HES) family proteins, HES related proteins (HEY)143 as well as cell
cycle regulators such as p21, cyclin D1 and 3144, c-myc145, and HER2146.
The Notch pathway has also been implicated as interacting with the EGFR/HER2
tyrosine kinase receptor family, as well as phosphatidylinositol 3-kinase/AKT/mTOR
signaling, two central growth pathways in the physiological and neoplastic setting147.
Although interaction of Notch signaling with other pathways has been a focus of
investigation, the exact mechanisms of this crosstalk remain largely unknown. It is
evident that the interaction of Notch signaling with other pathways highly depends on
the cellular context, and differs from one cellular microenvironment to another140.
Elements of the Notch pathway are altered in more than 20% of HGSC, mostly as
amplifications in the ligand Jagged 1 and 2 and Notch 331. Notch3 (mRNA and protein)
was found to be overexpressed especially in serous ovarian carcinomas compared with
the normal ovarian surface epithelium148 and correlation with aggressive tumors with
poor prognosis148,149 have been described.
Notch 3 was found to be active in some ovarian cancer cell lines, but according to
observations by Hopfer and colleagues150 there were no differences in the expression
of extracellular Notch3 between ovarian cancers and benign ovarian adenomas. Park
et al.151 demonstrated that Notch3 expression is associated with post chemotherapy
recurrence, probably as a result of upregulation of the ATP Binding Cassette Subfamily
B Member 1 (ABCB1) that acts as a pump of xenobiotics. Chemoresistance to platinum-
based therapy was also associated with Notch3 activation152. In ovarian cancer cell
lines Notch1 overexpression has also been shown to promote tumor cell
proliferation153,154.
Targeting the Notch pathway either with small molecule inhibitors primarily with
γ-secretase inhibitors (GSIs) or monoclonal antibodies (mAbs) to Notch ligands and
Notch receptors are currently in clinical development136.

Chapter 1
21
Figure 1. 2 - Ovarian cancer signaling pathways scheme
Scheme adapted from Yap, 2013; Longuespée et al., 2012 and Toss et al., 2013 155–157.
1.2.1.2 Mitogen-activated protein kinases (MAPK) pathway
MAPK/ERK pathway activation and subsequent interactions are highly regulated
events that become deregulated in cancer cells. The pathway begins with the
activation of Kirsten rat sarcoma oncoprotein (KRAS), which initiates a multistep
phosphorylation events that leads to the activation of RAF/MEK and MAPK pathways,
and in conjunction with mammalian target of rapamycin (mTOR), a target of the
protein AK strain thymoma (AKT) pathway, which ultimately regulate the transcription
of molecules that are involved in mitogenesis158–160 (Figure 1.2).
Cytoplasm
NotchWnt
β-catenin
EGF RTK
Notch 1-4
Nucleus
Frizzled
Extracellular
PI3K
FoxM1
Jag
/De
lta
NIC
D
ADAM/TACE
γ-secretase
CoA
MAML1CSL
HesHeyp21
MAML1CSL
Cyclin DC-Myc
β-catenin
RASRas
P
Raf
P
MEK
P
ERK
P
CoA
MAML1CSL
Oct4C-MycSox2
AKT
mTOR

Chapter 1
22
Point mutations in KRAS provide an advantage for the survival and progression of
tumors161–163. KRAS somatic mutations have been implicated in the genesis of LGSC,
inducing a mitogenic phenotype164.
Patients with ovarian cancer frequently present activation of the MAPK/ERK
pathway due to somatic mutations of KRAS or BRAF, which seem to occur early in
malignant transformation36. KRAS and BRAF mutations are found in respectively 27-
36% and 33-50% of LGSC. In contrast, a study conducted on 489 HGSC, TCGA31 showed
that in 45% of cases that contained altered PI3K/RAS signaling, less than 1% was due to
mutations and only 11% were due to amplifications. Also, BRAF was mutated in 0.5%
of HGSC cases. These mutations enhance kinase activity, becoming the mutated
protein independent of the activation of the tyrosine kinase receptor, and
hyperactivating the MAPK pathway during the initiation and progression of
tumorigenesis158.
1.2.1.3 PI3K/PTEN/AKT pathway
The PI3K pathway is activated through transmembrane tyrosine kinase receptors
(RTK). PI3K is a heterodimeric protein comprised of a regulatory subunit, p85, and a
catalytic subunit, p110165,166. The p110 catalytic subunits exit as several isoforms α, β, γ
and δ166. Recruitment of the PI3K complex to the inner surface of the plasma
membrane juxtaposes it with its substrate phosphatidylinositol-4,5 diphosphate (PIP2)
located in the inner lamina of the cell membrane. PIP2 is then phosphorylated by the
p110 subunit to form phosphatidylinositol-3,4,5 trisphosphate (PIP3). The conversion
of PIP3 to PIP2, and the subsequent inactivation of PI3K downstream signaling, is
facilitated by the tumor suppressor PTEN located on chromosome 10167 (Figure 1.2).
PTEN is a tumor suppressor gene, whose mutations promote the loss of function
of the protein and are present in many cancers, including in ovarian cancer4,160,168–171.
AKT activation is generally associated with processes of cell survival, growth, and
proliferation172. Cell survival is regulated by inhibitory phosphorylation of the forkhead
box O (FoxO) transcription factor family by AKT, and thus attenuation of their pro-

Chapter 1
23
apoptotic target gene Bim as well as by direct inactivation by phosphorylation of
BAD173.
Cell proliferation is regulated by activation of mTOR thereby promoting protein
synthesis174. mTOR promotes cell growth and proliferation in association with the
PI3K/AKT pathway166 through the phosphorylation of AKT at the serine residue 473 by
the mTOR complex 2 (mTORC2). The mTOR complex 1 (mTORC1) element raptor, and
the mTORC2 element rictor, differ from each other in composition by a few elements
that make up the respective complexes, accounting for the difference in resistance to
rapamycin175. mTORC1 promotes proliferation by the activation of molecules involved
in protein synthesis, mTORC2 promotes cell survival and proliferation through AKT
activation176.
Cell proliferation is stimulated via a number of mechanisms including inhibition
of the FoxO-mediated transcription of the cyclin-dependent kinase inhibitor p27Kip1177.
AKT also inhibits both p27Kip1 and p21 function by phosphorylation178 as well as by
regulating D-type cyclins179.
The FoxO factors function as downstream elements of the PI3K/AKT/PTEN
signaling pathway and are essential for cell proliferation, differentiation, DNA damage
repair and apoptosis180,181. Upon activation of the PI3K/AKT signaling pathway, FoxO
proteins undergo AKT-mediated phosphorylation. Under conditions of stress or in the
absence of growth or survival factors, the PI3K/AKT pathway is inhibited and FoxO3a
proteins translocate to the cell nucleus, where they execute their transcriptional
functions. By contrast, the dephosphorylation of activated FoxO3a induces cell cycle
arrest and apoptosis.
The cytostatic and cytotoxic effects of a variety of anti-cancer drugs182, such as
paclitaxel183,184 doxorubicin185, lapatinib186, gefitinib187, imatinib188,189, and cisplatin190,
are mediated through the activation of FoxO, particularly FoxO3a. The phosphorylation
of FoxO3a induces FoxM1 upregulation, which in turn promotes cell proliferation and
survival190,191.

Chapter 1
24
A number of studies have revealed FoxM1 to be a key cell cycle regulator in the
transition from G1 to S phase and in the progression to mitosis192–194 and have
demonstrated overexpression of the FoxM1 gene in human cancer cells and tissues,
including in ovarian cancer31,195. In the study by TCGA31, 87% of the cases studied
showed that elements of the FoxM1 pathway, such as baculoviral inhibitor of
apoptosis repeat-containing 5 (BIRC5/survivin), cyclin B1 (CCNB1), aurora kinase-B
(AURKB), cell division cycle 25 homolog B (CDC25B) and polo-like kinase 1 (PLK1) were
consistently overexpressed but not altered by DNA copy number changes31.
Inactivation of FoxO or overexpression of FoxM1 is associated with tumorigenesis and
cancer progression.
The integrated genomic analysis study of HGSC31 showed that at least 45% of the
cases contained alterations in the PI3K and RAS signaling pathways, whereas PTEN
deletions were found in 7%. PI3KCA amplifications (18%) and mutations (<1%), AKT
isoform amplifications AKT 1 and AKT 2 (3 and 6% respectively), were observed in
conjunction with KRAS amplification (11%)31. KRAS, independently, controls survival
through BRAF but it can also activate PI3K, that induces activation of AKT, and cell
cycle progression. Similarly, in the PI3K/AKT/mTOR signaling, a study by Kinross et
al.196 using a mouse model demonstrated that PTEN double deletions with PI3K
activation was necessary for HGSC and granulosa cell tumors development166.
Therefore, a single event does not appear to influence ovarian tumorigenesis but
multiple hits in the pathways that regulate growth, proliferation, and survival are
required for tumorigenesis and progression.
PI3K mutations in ovarian tumors are rare, but an increase in gene copy number
has been observed more frequently. The amplifications are more pronounced in HGSC
than LGSC tumors along with AKT phosphorylation contributing to survival, and
progression of the disease197,198.
Chapter 1
25
1.2.2 Genes involved in ovarian cancer
1.2.2.1 Tumor protein 53 (TP53)
The TP53 gene codifies a sui generis tumor suppressor protein whose normal
function is essential for cell normal physiology but when mutated p53 can exhibit
oncogenic properties. Normal p53 function is anti-cancer and oncogenic p53 function
is pro-cancer199. Hence, TP53 is a multifunctional tumor suppressor gene that is often
altered in ovarian and other cancers199,200, plays a major role in regulating the cellular
response to environmental and genotoxic stress, through cell cycle inhibition and
promotion of programmed cell death and senescence.
Mutation of the TP53 gene at the locus 17p13.1 is the most common single
genetic alteration in sporadic human EOC. The p53 protein contains four functional
domains – a transcriptional activation domain, a tetramerization domain and two DNA
binding domains. In addition to possessing transcriptional activating properties,
transcriptional repression has been described, although binding sites are less well
characterized201,202.
It has been estimated that the gene encoding p53 (TP53) is mutated in more
than 50% of human cancers203. It appears that the loss of p53 normal function, by
mutation or by other means, is highly advantageous and perhaps an absolute
requirement for some cancers progression. This gene interacts with a variety of
proteins involved in transcriptional regulation, DNA repair, cell cycle progression,
apoptosis, and proteosome-mediated protein degradation204. De Graeff et al.205
recently determined a prognostic value of p53 in ovarian cancer through a meta-
analysis of 62 previously published studies using a total of 9448 patients. The p53
status was analyzed by IHC or mutational analysis. Out of 62 studies, 25 reported an
association with poor survival while 4 were associated with improved survival. When
the meta-analysis was restricted to serous tumors only, there was a significant
association with poor prognosis205. Although, histotype heterogeneity and
chemotherapeutic treatment were not taken into account and the analysis showed
that the FIGO stage may influence the outcome predictive value of p53 and the
prognostic significance of p53 seems also to be more restricted to low stage tumors205.

Chapter 1
26
Some other studies suggested a correlation between p53 status and response to
platinum-based chemotherapy, while strong discrepancies are noticed in clinical
studies with paclitaxel-based treatment. These inconsistencies are likely due to
different antibodies utilized, chemotherapeutic regimen and heterogeneity of
histotypes, which render the interpretation of all these studies difficult206,207.
TP53 is a canonical exception to Knudson hypothesis208, since a single mutation
in one allele is enough to alter p53 tumor suppressor function, becoming
advantageous for tumor survival. The majority of TP53 mutations are missense
mutations that cause single residue changes, largely occurring in the DNA binding
domain209. Mutant p53 protein has the ability to form a tetramer with wild type p53,
acting as a dominant negative to repress normal physiological processes of p53,
possibly by inducing an inactive conformation of the DNA binding domain and reducing
the ability to transactivate/repress target genes210–212.
The relevance of the normal function of p53 in a cell is showed up by the p53
regulatory network, consisting of negative and positive feedback loops that modulate
down and up p53 expression and activity213. The negative feedback loop established by
p53 with MDM2 tightly controls both p53 and MDM2 levels in the cell. Tumor
suppressor p53 activates targets in the MDM2 gene to be transcribed, ultimately
causing production of the MDM2 protein, which then inhibits p53214,215. This negative
feedback loop is vital for controlling p53 activity to prevent detrimental pathogenic
effects of excessive p53 activity.
Although TP53 mutations have been detected in all histological types of EOC, a
number of studies have demonstrated higher frequencies of such mutations in HGSC.
Point mutations, missense mutations and truncations have been observed, resulting in
the overexpression of the p53 protein that has been detected in many of the
immunohistochemical studies performed216,217. The accumulation of mutated and
oncogenic p53 has been shown to affect the expression and interaction of the pro-
apoptotic BAX with the anti-apoptotic B-cell lymphoma 2 (BCL-2)218,219.
The expression of mutated p53 results in the accumulation of the altered protein
within the cell that has a negative effect on BAX, a transcriptional target of p53220. It

Chapter 1
27
seems that p53 alterations in HGSC reduce BAX expression allowing the progression of
solid tumors. However, immunohistochemistry studies in tumor tissue have not
provided a definitive conclusion of a positive correlation with p53 expression and
tumor prognosis and survival221,222. The expression of p53 vs BCL-2 and BCL-2 vs BAX
have been shown to have a strong association with tumor grade and histopathological
subtyping, factors that could be vital for identifying the specific epithelial ovarian
carcinoma for adjuvant or combined therapies223. What has been observed is that the
majority of ovarian tumors are initially very responsive to treatment but later become
chemoresistant. Possibly the treatment itself may cause the selection of few cells
within the tumor mass, harboring mutations in TP53 that, in addition to epigenetic
silencing of promoter regions of apoptotic favorable genes such as p16 or Rb, may
account for the relapse and progression of the tumor131.
As previous described, mutations in TP53 are a common event in ovarian
tumorigenesis, being particularly frequent in HGSC but are uncommon in CCC (10%)224.
This implies that other anti-apoptotic mechanisms are likely to be involved in the
development of CCC. HNF1β, a diagnosis marker for CCCs40, has been implicated in
mediating apoptotic escape in tumor cells225.
1.2.2.2 Hepatocyte nuclear factor 1β (HNF1β)
Hepatocyte nuclear factor 1β (HNF1β) was originally described as a novel
homeodomain-containing transcription factor isolated from a human liver library and
found to be essential during organogenesis of the liver, kidney, and pancreas226.
HNF1β gene (formerly known as TCF2) is located on 17q21.3, contains 9 exons227 and
its expression is often altered in cancer228. CCC are usually positive for HNF1β
(>90%)37,40. In addition, HNF1β is expressed in the majority of tumors with cytoplasmic
clearing, including renal CCC and endometrial CCC69.
HNF1β was found to be the most upregulated transcription factor in a gene
expression analysis of four ovarian CCC cell lines when compared to non-CCC cell
lines228. It was also subsequently reported to be positive in areas of endometriosis or
endometriotic epithelium in a study of ovarian CCC lending molecular support for the

Chapter 1
28
hypothesis that the concurrent endometriosis seen in CCC may be linked as a
precursor lesion67,229.
HNF1β is involved in the glycogen synthesis67 and is also expressed in mid-to-late
secretory and gestational endometrium (Arias-Stella reaction) and in atypical and
inflammatory endometriosis. Studies confirm the identification of HNF1β as a
susceptibility gene for CCC development and disclosed that promoter methylation
plays a role in the regulation of HNF1β expression229.
Immunohistochemistry (IHC) analysis for HNF1β protein expression comparing
CCC and HGSC in 1,149 ovarian tumors from the Ovarian Tumor Tissue Analysis
Consortium, and DNA-methylation analysis on 269 of these tumors, revealed that the
majority of CCC expressed the HNF1β protein, and were unmethylated at
the HNF1β promoter, whereas the majority of HGSC lacked HNF1β protein expression
and displayed frequent HNF1β promoter methylation228,229. This epigenetic
inactivation of HNF1β seen in ovarian HGSC has also been detected in colorectal,
gastric and pancreatic cancer cell lines70.
HNF1β promoter hypomethylation has recently been detected in additional clear
cell histology, including endometrial, cervical and renal clear cell cancers,
suggesting HNF1β expression and promoter hypomethylation to be a general
biomarker of cytoplasmic clearing69. HNF1β overexpression in immortalized
endometriosis epithelial cells (putative precursors of CCC) led to altered morphology
and multinucleation of cells228 while siRNA knock-down of HNF1β led to the induction
of apoptosis in CCC cells lines229.
1.2.2.3 Cyclins and Cyclin-dependent-Kinase inhibitors
The cyclin and cyclin dependent kinase (CDK) elements, activators and inhibitors
that have a major role in ovarian cancer are cyclin D1, p16INK4A, p27Kip1 and p21230–
232. Their regulation and function have been shown to be controlled in part by the
tumor suppressor gene TP53, which is predominantly mutated in HGSC230,232.
CDK activators and inhibitors are major co-regulatory proteins in the cell cycle
along with the p16, p53 and retinoblastoma (Rb)233, being p21 a direct transcriptional

Chapter 1
29
target of p53234. In the presence of wild-type (WT) p53, p21 induction is followed by
the inhibition of cyclin E/CDK2 preventing the G1-S transition, encouraging the
quiescent or apoptotic phenotype of cells235.
Although the roles of p21 and p27 have been discussed in many cancers, they
appear to have secondary roles in the etiology of ovarian cancer rather than in the
genesis236,237. Loss of function or accumulation of these proteins in ovarian cancers has
not been reported. In some cases, the absence or low expression of p21 in p53
expressing tumors appears to place patients at a higher risk for disease recurrence238.
Studies have also shown that high p21 expression correlates with early stage ovarian
tumors and that only high p27 expression was necessary for disease free survival239.
1.3 Epigenetics and ovarian cancer
Epigenetic mechanisms are essential for normal development and maintenance
of tissue-specific patterns of gene expression in mammals240. Epigenetics is defined as
a heritable change in gene expression without alteration of the primary DNA sequence.
So, disruption of epigenetic processes can lead to altered gene function and malignant
cellular transformation240,241. The current status of epigenomic research shows that
epigenetic modifications among cancer cells result in aberrant gene expression via
DNA methylation, histone modifications and post-transcriptional gene regulation by
microRNAs (miRNAs)242,243. These modifications are also associated with initiation and
progression of ovarian cancers241,244.
In the last years, the importance of biomedical research towards epigenetics has
increased, with the aim to discover the mechanisms that underlie the epigenetic
regulation of cell physiology. From these studies the reversibility of epigenetic
mechanisms showed promising targets to treat several diseases, through epigenetic
targeted therapy.
The structure of chromatin is complex, made up of DNA, histones, and non-
histones proteins245, these last two are primary targets of epigenetic regulation246.
Chromatin is made of repeating units of nucleosomes, which consist of 146 base pairs
of DNA wrapped around an octamer composed by 2 copies of four core histone
Chapter 1
30
proteins (H3, H4, H2A and H2B). This assembly is allowed by the negative charge of
DNA and the positive charge of histone tails247. The histone octomer plays an
important role in establishing interactions between the nucleosomes and within the
nucleosome particle itself248. The N-terminal tails of core histones are flexible and
unstructured, but the rest are predominantly globular and well structured. Depending
on the epigenetic modifications that occur in DNA and in histone tails, chromatin can
adopt different conformational changes that control the activation or repression of
gene transcription.
There are at least eight distinct types of histone post-translational modifications,
namely acetylation, methylation, phosphorylation, ubiquitylation, sumoylation, ADP
ribosylation, deamination and proline isomerization131. They can be viewed as a
regulatory code that resides in the pattern of post-translational modifications for
which the histone amino terminal tails are the target248. In this brief introduction we
will mentioned the two main modifications: DNA methylation and histone acetylation.
1.3.1 DNA methylation
DNA methylation is the most studied epigenetic modification with regard to
carcinogenesis, and has also been the major focus of pharmacological interventions in
clinical trials. In normal cells, the human genome is not methylated uniformly,
containing unmethylated segments interspersed with methylated regions. DNA
methylation occurs on the cytosine residues of CpG dinucleotides, CpG enriched
regions are so-called CpG islands that are usually regions greater than 200 bp in
length249, that have more than 50 percent of CG content250 and frequencies above
0.6% predominantly in the 5’ promoter regions of the genes251. Enzymes known as
DNA methyltransferases (DNMTs) catalyze the addition of a methyl group (CH3) to the
5’-carbon of cytosine in CpG-3’ (Figure 1.3)252.

Chapter 1
31
Figure 1. 3 – Cytosine metylation Chemical structure of cytosine base unmethylated and methylated.
The methylation of CpG islands in gene promoters has been correlated with gene
silencing, as it is an alternative pathway to the loss of tumor suppressor genes
function, due to the lack of gene expression253. The epigenetic silencing of tumor
suppressor genes has been associated with mechanisms such as uncontrolled cell
division, the ability to infiltrate surrounding tissues, metastasis, avoiding apoptosis or
sustaining angiogenesis, all of which are responsible for promoting tumor
development. In ovarian cancer, a large number of tumor suppressor genes have been
found to undergo promoter hypermethylation254.
BRCA1 gene, as previous mentioned is one of the most studied genes, due to its
role in inherited and sporadic forms of ovarian carcinomas255,256. It has been shown
that promoter hypermethylation is a cause for BRCA1 silencing257 and has been
reported in 15% of sporadic ovarian carcinomas255,258.
In a study comparing the methylation status of BRCA1 among tumor samples
obtained from patients with benign ovarian tumors, borderline tumors and
carcinomas, promoter methylation of BRCA1 was detected in 31% of carcinomas but in
none of the benign or borderline tumors259. Hypermethylation of BRCA1 was
significantly higher in serous carcinomas than in tumors of other histological type260.
Methylation of BRCA1, while frequent in sporadic ovarian cancer, has not been
reported in the hereditary type of the disease, nor in samples from women with a
germline BRCA1 mutation261,262.
cytosine 5’ methyl-cytosine
DNMT

Chapter 1
32
BRCA2 does not exhibit a similar methylation profile in ovarian cancer263.
According to Chan et al.264 methylated CpGs at the BRCA2 promoter were either
absent or at very low levels in tumor DNA compared to normal tissues264.
Tumor suppressor genes involved in DNA mismatch repair (MMR) have a distinct
carcinogenic mechanism in ovarian tumors. MMR is an endogenous molecular
mechanism that corrects replication errors that escape the proof reading system of
replicative DNA polymerases. In MMR-defective cells with methylation of promoters of
MMR genes, base-to-base mismatches and insertion/deletion loops, are left
uncorrected265. This results in increased spontaneous somatic mutations, being
particularly obvious in non-expressed sequences comprising multiple simple repeats
(microsatellites)266. Approximately 10% of ovarian cancers are related to this molecular
pathway267. Defective MMR is often a consequence of germline mutations in the
MLH1, MSH2, or, occasionally, MSH6 or PMS2 genes. Hypermethylation of the MLH1
gene accompanied by loss of the gene expression has been reported in 10–30% of
ovarian malignancies. This phenomenon is more frequently found in cases with
acquired resistance to platinum-based chemotherapy (56% )268,269. The methylation
frequency of MSH2 promoters has also been reported to be as high as 57% in ovarian
carcinomas, being higher in EC compared to other histological types268. Methylation
grade of MSH2 has been correlated with tumor grade and lymphatic metastasis.
Hypermethylation of tumor suppressor genes such as PTEN and p16INK4A have
been observed contributing to the loss of function of these proteins in EOCs260,270 and
the absence of these proteins contribute to deregulate pathways.
DNA methyltransferases inhibitors have been proposed to be a promising
strategy for epigenetic therapy in cancer treatment. The most commonly used DNMT
inhibitors in clinical setting are nucleoside analogues, including 5-aza-2’-deoxycytidine
(5-aza-dC)240,246. They are converted to deoxynucleotide triphosphates intracellularly
and may be incorporated into replicating DNA instead of cytosine.
These inhibitors act by different actions, namely the loss of DNA methylation
resulting in the re-expression of the tumor suppressor genes; the inhibition of tumor
cell growth or by inducing cancer cell death240,246.

Chapter 1
33
In ovarian cancer, the recurrence of malignancy or the resistance to current
therapies is one of the concerns in the treatment of these tumors. Epigenetic inhibitors
hold the promise for overcoming chemoresistance through restoration of drug
response genes and pathways246. Two clinical trials271,272 provided evidences that DNA
hypomethylation agents can reverse platinum resistance in ovarian cancer patients,
suggesting the clinical benefits of epigenetic drugs in the treatment of chemoresistant
or recurrent advanced cancer.
In summary, epigenetic alterations such as DNA methylation are involved in
ovarian cancer initiation and progression. Hypermethylation has been found to be
associated with the inactivation of almost every pathway involved in ovarian cancer
development, including DNA repair, cell cycle regulation and apoptosis.
1.3.2 Histone acetylation
Histone modifications can alter histone-DNA interactions and consequent
transcriptional activity due to changes in accessibility of the DNA to the transcriptional
machinery. Histone tails are positively charged due to lysine and arginine amino acids.
These positive charges allows the interaction and binding of the histone tails to the
negatively charged phosphate groups on the DNA backbone273.
Acetylation and deacetylation of histones play an important role in controlling
chromatin activity and consequently transcription in eukaryotic cells273. The
acetylation of histones and non-histone proteins is determined by the opposing
activities of histone deacetylases (HDACs) and histone acetyltransferases (HATs). The
balance between histone acetylation and deacetylation, mediated by HATs and HDACs,
respectively, is usually tightly regulated, but this balance is often disturbed in diseases
such as cancer273.
Acetylation neutralizes the positive charges on the histone by changing amines
into amides and decreasing the ability of the histones to bind to DNA. This decreased
binding allows chromatin expansion, and genetic transcription takes place.
On the contrary, histone deacetylases remove those acetyl groups, retrieving the
positive charge of histone tails and encouraging high-affinity binding between the

Chapter 1
34
histones and DNA backbone274. The increased histone and DNA binding condenses
chromatin structure and prevents transcription.
HDACs are a class of enzymes that remove acetyl groups (O=C-CH3) from an ε-N-
acetyl lysine amino acid on a histone, allowing the histones to wrap the DNA more
tightly. A total of eighteen human HDACs enzymes are classified into four main groups
depending on the homology of their catalytic domain245,275, their subcellular
localization and their enzymatic activity276.
Classes I, II, and IV require a zinc molecule as an essential cofactor in their active
site and are inhibited by Zn2+-binding HDAC inhibitors277. Class I, includes HDAC1,
HDAC2, HDAC3 and HDAC8. Class II, based on their sequence homology and domain
organization, can be further subdivided into subclass IIa enzymes (HDACs 4, 5, 7 and 9)
and subclass IIb enzymes (HDAC6 and HDAC10).
HDAC11 is the only member of the forth HDACs class, localized in the nucleus.
Besides sharing the homology with class I and class II HDACs278 and being a Zn2+-
dependent enzyme it does not have strong enough identity to be placed in either class.
Class I HDACs are localized within the nucleus and are the most abundant and
ubiquitously-expressed HDACs, whereas Class II localize between nucleus and
cytoplasm depending upon the phosphorylation status, and their expression is tissue-
specific (Table 1.2)279–282.
Unlike conventional HDACs, class III HDACs are composed of seven mammalian
sirtuins (SIRT1-7)283. They use nicotinamide adenine dinucleotide (NAD+) as a cofactor
instead of Zn2+, therefore; they are not inhibited by Zn2+-binding HDAC inhibitors. They
are localized in the nucleus (SIRT1, SIRT6, and SIRT7), mitochondria (SIRT2, SIRT4, and
SIRT5), and cytoplasm (SIRT2). The role of sirtuins in tumorigenesis is still controversial
because some SIRTs have dual roles as oncoproteins and as tumor suppressor
proteins284,285.

Chapter 1
35
Table 1. 2 - Classes of histone deacetylases; localization in the cell, length, chromosomal localization and function
Information retrieved from245,275276.
1.3.3 HDAC inhibitors
Epigenetic alterations, as described above, are involved in the repression of
tumor suppressor genes and promotion of tumorigenesis in ovarian cancers, thus
drugs with histone deacetylase inhibitory activity are an attractive therapeutic
approach286.
HDAC inhibitors (HDACI) are chemical compounds that inhibit HDAC enzymes
activity, leading to an increased acetylation of histones, and consequently to an
increased transcription activity and subsequently upregulation of specific genes
HDAC family
member
Cellular localization Length
(aa)
Chromosomal
localization
Physiological function
Class I Zn2+
dependentHDAC1 nucleus 483 1p34
Resistance to chemotherapy, proliferation, cell
survival
HDAC2 nucleus 488 6p21 Proliferation
HDAC3 nucleus/cytoplasm 423 5q31 Proliferation, cell survival
HDAC8 nucleus 377 Xq31 Proliferation
Class IIa Zn2+
dependent
HDAC4 nucleus/cytoplasm 1084 2q37 Angiogenesis, gluconeogenesis
HDAC5 nucleus/cytoplasm 1122 17q21 Differentiation
HDAC7 nucleus/cytoplasm 855 12q13 Differentiation
HDAC9 nucleus/cytoplasm 1011 7p15-21 Angiogenesis
Class IIb Zn2+
dependent
HDAC6 cytoplasm 1215 Xp11 Migration
HDAC10 cytoplasm 669 22q13 Migration
Class III
NAD+
dependent
SIRT1 nucleus 747 --------Differentiation, glucose metabolism, cell
survival
SIRT2nucleus/cytoplasm
mitochondria389 -------- Cell cycle control, lipid synthesis
SIRT3 nucleus 399 -------- ATP production, metabolism, apoptosis
SIRT4 mitochondria 314 -------- Insulin secretion, metabolism, apoptosis
SIRT5 mitochondria 310 -------- Urea cycle, metabolism, ATP regulation
SIRT6 nucleus 355 --------DNA repair, chromosome stability, metabolic
regulation
SIRT7 nucleus 400 -------- RNA pol I ,apoptosis transcription
Class IV Zn2+
dependentHDAC11 nucleus 347 3p25 DNA replication
_____ not identified

Chapter 1
36
involved in various cellular pathways including cell cycle, differentiation, DNA damage
and repair, redox signaling, and apoptosis276,279,287,288.
However, the complexity of the molecular network affected by the action of
HDACIs does not allow the design of molecular pathways that may be predictive of
therapeutic response. Hence, it remains unclear the molecular mechanisms underlying
the response to HDAC inhibitors in cancer patients.
HDACIs undergoing evaluation for the treatment of cancer can be divided into
four classes based on their chemical structure.
The classes include the short chain fatty acids (e.g., valproate and
phenylbutyrate) that inhibit class I/IIa; hydroxamic acid derivatives (e.g., vorinostat,
belinostat) that inhibit both class I and II enzymes; benzamides (e.g., entinostat,) that
selectively inhibit a subset of class I enzymes and cyclic tetrapeptides (e.g.,
romidepsin)245,275,289.
1.3.3.1 Mechanisms of action of HDACI
HDACI induce cell cycle arrest in both normal and transformed cells287 and kill
both proliferating and non-proliferating cells290. In vitro, the time of culture,
concentration and type of HDACI used affect the number of genes detected with
altered transcription in vitro. Short time points291,292 and low concentrations293 cause
fewer changes in gene transcription and predominantly induce G1 arrest, while
increased time of exposure in culture and concentration of HDACI induces several
changes in genes and induces both G1 and G2/M arrests294.
G1 and G2 arrests are largely associated with induction of cyclin-dependent
kinase (CDK) inhibitor p21, which blocks cyclin E/CDK2 complexes, leading to cell cycle
arrest and inhibiting differentiation294,295. HDACI-induced expression of p21 is
independent of p53 and correlates with an increase in the acetylation of histones
associated with p21 promoter region294,296. In cells cultured with HDACI, the increase
of CDK inhibitors and the decrease of cyclins may act together to account for the
reduced CDK activity, causing dephosphorylation of Rb protein, which blocks cell cycle
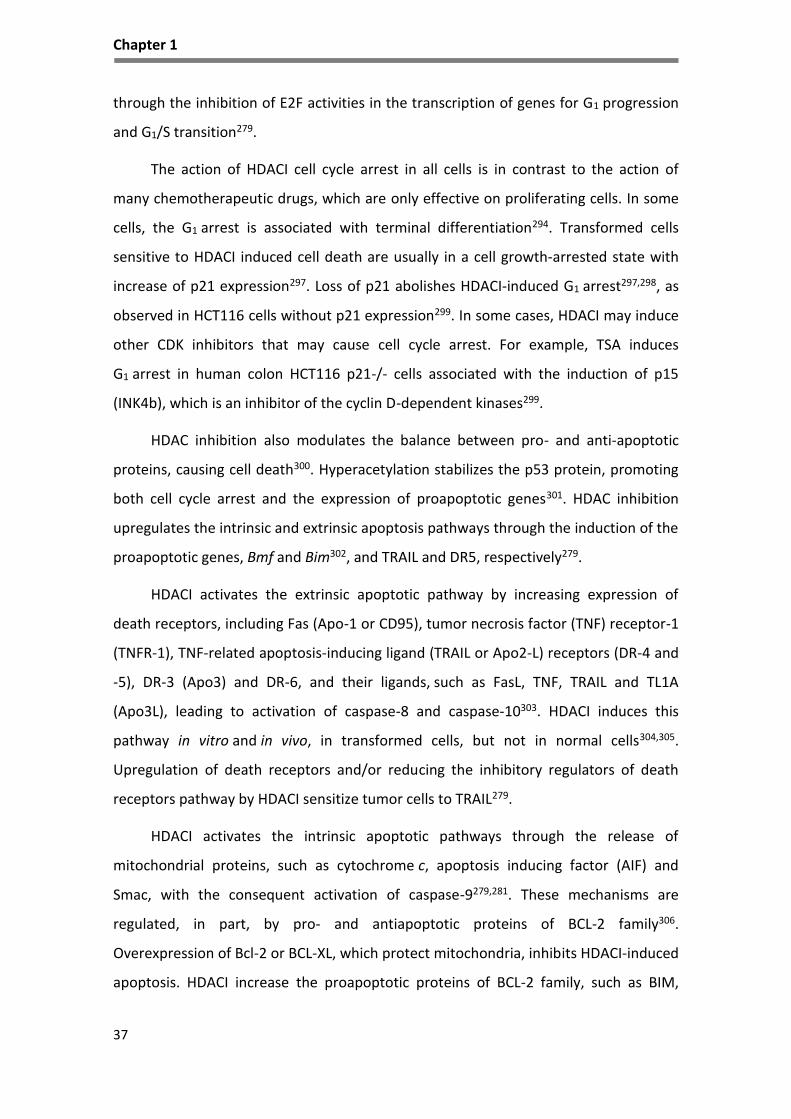
Chapter 1
37
through the inhibition of E2F activities in the transcription of genes for G1 progression
and G1/S transition279.
The action of HDACI cell cycle arrest in all cells is in contrast to the action of
many chemotherapeutic drugs, which are only effective on proliferating cells. In some
cells, the G1 arrest is associated with terminal differentiation294. Transformed cells
sensitive to HDACI induced cell death are usually in a cell growth-arrested state with
increase of p21 expression297. Loss of p21 abolishes HDACI-induced G1 arrest297,298, as
observed in HCT116 cells without p21 expression299. In some cases, HDACI may induce
other CDK inhibitors that may cause cell cycle arrest. For example, TSA induces
G1 arrest in human colon HCT116 p21-/- cells associated with the induction of p15
(INK4b), which is an inhibitor of the cyclin D-dependent kinases299.
HDAC inhibition also modulates the balance between pro- and anti-apoptotic
proteins, causing cell death300. Hyperacetylation stabilizes the p53 protein, promoting
both cell cycle arrest and the expression of proapoptotic genes301. HDAC inhibition
upregulates the intrinsic and extrinsic apoptosis pathways through the induction of the
proapoptotic genes, Bmf and Bim302, and TRAIL and DR5, respectively279.
HDACI activates the extrinsic apoptotic pathway by increasing expression of
death receptors, including Fas (Apo-1 or CD95), tumor necrosis factor (TNF) receptor-1
(TNFR-1), TNF-related apoptosis-inducing ligand (TRAIL or Apo2-L) receptors (DR-4 and
-5), DR-3 (Apo3) and DR-6, and their ligands, such as FasL, TNF, TRAIL and TL1A
(Apo3L), leading to activation of caspase-8 and caspase-10303. HDACI induces this
pathway in vitro and in vivo, in transformed cells, but not in normal cells304,305.
Upregulation of death receptors and/or reducing the inhibitory regulators of death
receptors pathway by HDACI sensitize tumor cells to TRAIL279.
HDACI activates the intrinsic apoptotic pathways through the release of
mitochondrial proteins, such as cytochrome c, apoptosis inducing factor (AIF) and
Smac, with the consequent activation of caspase-9279,281. These mechanisms are
regulated, in part, by pro- and antiapoptotic proteins of BCL-2 family306.
Overexpression of Bcl-2 or BCL-XL, which protect mitochondria, inhibits HDACI-induced
apoptosis. HDACI increase the proapoptotic proteins of BCL-2 family, such as BIM,

Chapter 1
38
BMF, BAX, BAK and BIK297,302 and decrease antiapoptotic proteins of Bcl-2 family, such
as Bcl-2, BCL-XL, BCL-w and MCL-1297,307. The mechanism of this effect is not
completely understood. It has been shown that vorinostat and TSA increase BIM
transcription by increasing the activity of E2F1302.
HDACI are also able to induce autophagy and at this process is expected to
originate cell death and senescence308.
The HDACI have shown synergistic or additive antitumor effects with a wide
range of antitumor reagents, including chemotherapeutic agents such as
antimetabolites 5-fluorodeoxyuridine and gemcitabine, antitubule agents paclitaxel
and docetaxel, topoisomerase (Topo) II inhibitors doxorubicin, epirubicin, etoposide309
and DNA crosslinking agent cisplatin279,281,307. The synergistic effects in vitro may
depend on the sequence of drug administration.
Butyric acid and vorinostat (suberoylanilide hydroxamic acid or SAHA), two
HDACIs will be further detailed. Vorinostat310, which was FDA approved in 2006 for the
treatment of cutaneous T-cell lymphoma has shown interesting results in in
vitro models of ovarian cancer311.
1.3.3.2 Butyric acid
Short chain fatty acids, in which butyrate (butyric acid) and valproate (valproic
acid) are included, are carboxylate compounds that induce hyperacetylation through
inhibition of HDAC, resulting in relaxation of chromatin, making DNA more accessible
to transcription factors.
Butyric acid is a product resulting from fibers degradation in colon by bacteria
and the natural synthesis and breakdown of longer chain fatty acid in vivo. But, in
addition of being a part of the metabolic fatty acid cycle312,313, butyric acid also
functions as HDACI of class I and II enzymes to control cell proliferation and apoptosis
in cancer cells314. Because cells are able to metabolize butyric acid, it is assumed that
butyric acid has a weak effect as HDACI.

Chapter 1
39
1.3.3.3 Vorinostat
Vorinostat is a small molecular weight (<300) linear hydroxamic acid compound
that inhibits the enzymatic activity of a subset of class I HDACs, (HDAC1, HDAC2 and
HDAC3) and the class II HDAC (HDAC6) at low nanomolar concentrations (half maximal
inhibitory concentration < 86 nM)245,281.
The molecular mechanisms of vorinostat-induced cell cycle arrest,
differentiation, apoptosis and autophagy are not fully understood but are believed to
be due to the inhibition of HDAC activity. Inhibition of HDAC activity by vorinostat
causes an increase in acetylation of all the four core nucleosomal histones245,281,
induces the subsequent opening of DNA chain and promotes the expression of anti-
proliferation and pro-apoptotic genes.
Many studies have found that the expression of approximately 5–10% genes is
altered following exposure to vorinostat245,275. The genes regulated by vorinostat are
dependent on the cell line under study and the study design (e.g, duration of
vorinostat exposure and dose of vorinostat).
Vorinostat also causes an increase in acetylation of other chromatin modifying
proteins, including members of the SWI/SNF family.
The exact molecular mechanisms how vorinostat induces apoptosis have yet to
be fully clarified. It appears to occur through the interference in the intrinsic apoptotic
pathway, characterized by the release of mitochondrial membrane proteins such as
cytochrome C and the subsequent activation of caspases275,315, but several studies
have demonstrated that both caspase-dependent and independent cell death275,308 can
occur.
Vorinostat may affect cancer growth independently of its direct action on tumor
cell proliferation and survival by regulating the expression of genes involved in tumor
angiogenesis316.
Vorinostat has demonstrated anti-tumor activity in a variety of in vivo rodent
tumor models whether administered by the IP, IV or oral route in carcinogen-induced
tumors317, xenograft tumor models318 and genetic mouse models319,320. Tumor growth
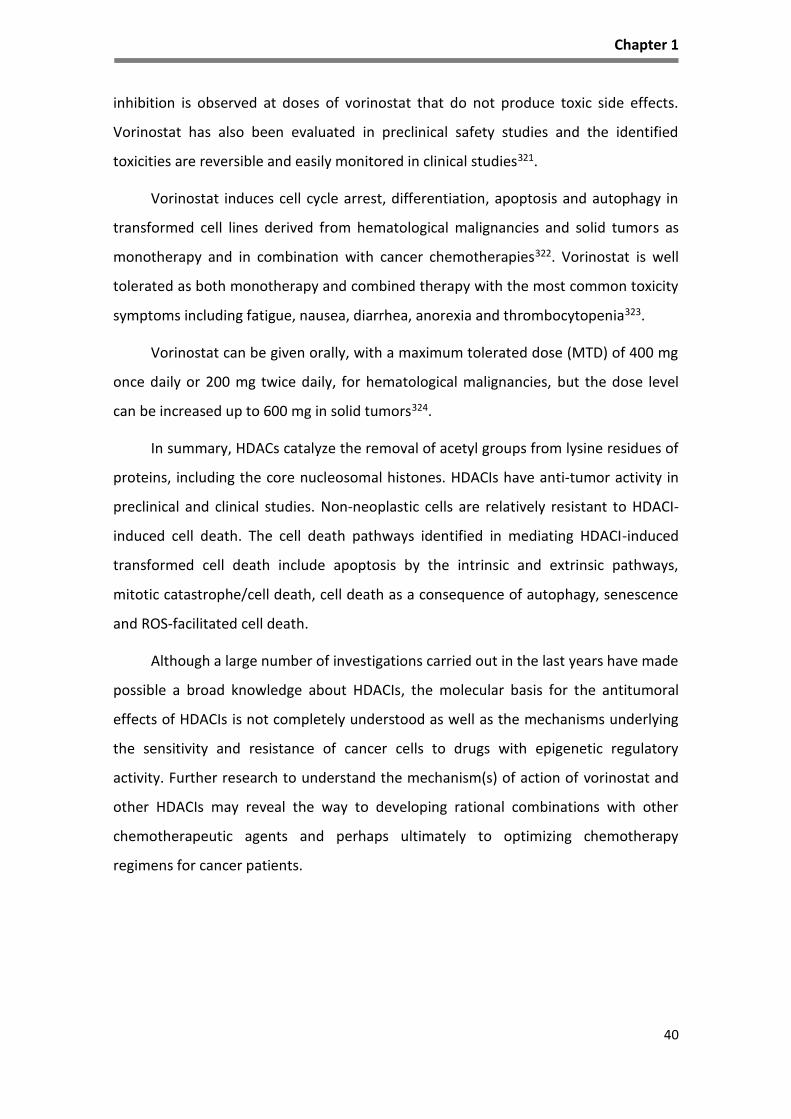
Chapter 1
40
inhibition is observed at doses of vorinostat that do not produce toxic side effects.
Vorinostat has also been evaluated in preclinical safety studies and the identified
toxicities are reversible and easily monitored in clinical studies321.
Vorinostat induces cell cycle arrest, differentiation, apoptosis and autophagy in
transformed cell lines derived from hematological malignancies and solid tumors as
monotherapy and in combination with cancer chemotherapies322. Vorinostat is well
tolerated as both monotherapy and combined therapy with the most common toxicity
symptoms including fatigue, nausea, diarrhea, anorexia and thrombocytopenia323.
Vorinostat can be given orally, with a maximum tolerated dose (MTD) of 400 mg
once daily or 200 mg twice daily, for hematological malignancies, but the dose level
can be increased up to 600 mg in solid tumors324.
In summary, HDACs catalyze the removal of acetyl groups from lysine residues of
proteins, including the core nucleosomal histones. HDACIs have anti-tumor activity in
preclinical and clinical studies. Non-neoplastic cells are relatively resistant to HDACI-
induced cell death. The cell death pathways identified in mediating HDACI-induced
transformed cell death include apoptosis by the intrinsic and extrinsic pathways,
mitotic catastrophe/cell death, cell death as a consequence of autophagy, senescence
and ROS-facilitated cell death.
Although a large number of investigations carried out in the last years have made
possible a broad knowledge about HDACIs, the molecular basis for the antitumoral
effects of HDACIs is not completely understood as well as the mechanisms underlying
the sensitivity and resistance of cancer cells to drugs with epigenetic regulatory
activity. Further research to understand the mechanism(s) of action of vorinostat and
other HDACIs may reveal the way to developing rational combinations with other
chemotherapeutic agents and perhaps ultimately to optimizing chemotherapy
regimens for cancer patients.

41

42
AIM AND THESIS OUTLINE
Epithelial ovarian cancer (EOC) is the most lethal gynecological malignancy
mainly due to late diagnosis, lack of specific therapy and resistance to conventional
chemotherapy, based on platinum salts and taxanes. Hence, the discovery of new
therapeutic strategies urges and the fact that histone deacetylases (HDACs) expression
is increased in ovarian cancer points out HDAC inhibitors (HDACIs) as an attractive
alternative.
The identification of ovarian cancer biomarkers that serve as indicators of cell
sensitivity for HDACs inhibitors will allow the design of a more effective therapy.
Furthermore, the understanding of the mechanisms underlying the action of drugs
involved in epigenetic regulation can give us guidelines for new and more specific
therapeutic strategies.
Our hypothesis is that HDACIs are useful drugs to treat ovarian cancer.
So, the main goal of this study was to disclose the mechanisms underlying the
effect of HDACIs, in ovarian cancer. In order to accomplish this, five specific aims were
addressed:
To evaluate HDACs expression profiles in order to support the use of HDACIs in
ovarian cancer (Chapter 2);
To access in vitro alterations in proliferation and cell death in EOC cell lines, due
to exposure to HDACIs (butyric acid and vorinostat) alone and in combination
with 5-aza-dC, a DNA methyltransferase inhibitor, and conventional
chemotherapy (carboplatin and paclitaxel) (Chapter 3);
To evaluate the role of HNF1β in cell cycle arrest and apoptosis in CCC upon
vorinostat exposure (Chapter 4);
To study the modulatory effect of vorinostat in Notch signaling pathway
(Chapter 5); and
To establish human primary ovarian carcinoma cell lines, to be used as a tool to
study EOC (Chapter 6).

43
The expression of HDACs was evaluated in EOC tissues samples. The effects of
HDACI in ovarian cancer were evaluated in vitro by analyzing the general effects of
HDACIs (butyric acid and vorinostat) alone and in combination with a DNA
methyltransferase inhibitor, 5-aza-deoxycytidine (5-aza-dC), and with conventional
therapy (carboplatin and paclitaxel) in cell behavior. In depth it was also addressed the
effect of vorinostat, in cell cycle and apoptosis and in the expression of key genes in
ovarian cancer such as HNF1β and Notch elements. Considering the importance of cell
lines in cancer research, we also established a human ovarian cancer cell line of HGSC.
This thesis outline is organized in seven sections. In the 1st chapter there is a
general introduction presenting all subjects and theoretical concepts concerning the
thesis theme. The following sections include the results obtained in this PhD project
(Chapter 2-6). Each chapter contains an abstract, a short introduction, methods,
results and discussion. In the final chapter (chapter 7) the main conclusions enclosing
all chapters are summarized and integrated, highlighting the major achievements that
will contribute to improve the knowledge in ovarian cancer oncobiology.

44
CHAPTER 2
Protein expression profile of histone deacetylases (HDAC) 1, 2,
3, 4, 6 and PhosphoHDAC4/5/7 in ovarian cancer
Manuscript in preparation

Chapter 2
45
Abstract
In cancer, histone acetylation was recognized has being involved in carcinogenesis and
histone deacetylases (HDACs) play an important role in chromatin remodeling, gene
repression, cell cycle progression, differentiation and therapy.
The present study aimed to investigate the expression profile of histone deacetylases
(HDAC), Class I (HDAC1, 2, 3) and class II (HDAC4, 6 and phosphoHDAC4/5/7) in ovarian cancer,
in order to support the evaluation of HDACIs in ovarian cancer. HDACs expression was
analyzed by immunohistochemistry on tissue microarrays (TMA) from 64 patients with ovarian
cancer. HDACs expression was evaluated and correlated with clinicopathological parameters
and cell cycle markers.
Our results report that expression profile of HDACs were significantly associated with
histological types of ovarian cancer. By immunohistochemistry, we found a high expression of
HDAC1, 2, 3, 4, 6 and phosphoHDAC4/5/7 that was significantly associated with HGSC. The
most expressed HDACs in CCC were HDAC1, 2 and 6.
HDAC3 was associated with stage and metastasis, HDAC4c and pHDAC4/5/7 were
associated with metastasis in EOC. Kaplan-Meier curves showed that HDACs expression was
not associated with survival.
Regarding the correlation with the cell cycle markers, we found that in HGSC HDAC1
expression was statistically associated with p21 expression, and HDAC3, HDAC4c and
pHDAC4/5/7 were associated with p53 expression.
In addition, our results show that HDAC2, 3, 4 and phosphoHDAC4/5/7 were
differentially expressed in HGSC and CCC.
In conclusion, the panel of HDACs expressed in HGSC and CCC supports the use of
HDACIs as an alternative to treat ovarian cancer.
Keywords: HDACs, ovarian cancer, TMA, immunohistochemistry, HGSC, CCC.

Chapter 2
46
Introduction
Epigenetic alterations including modifications of the acetylation status of
histones in the development of human cancer have been recognized246,325. In the last
years, several studies have highlighted the role of histone deacetylases (HDACs) in
tumor progression and invasion and their potential use as therapeutic targets for
cancer therapy and prognostic factors are recently emerging326.
HDACs are regulators of gene expression by allowing the histones to wrap the
DNA more tightly274. Histone acetylation is generally associated with increased
transcription, while deacetylated histones are often associated with gene repression.
Through these mechanisms, HDACs act as regulators of cell growth, differentiation and
apoptotic programs and may favor neoplastic growth by allowing the aberrant
transcription of key genes327.
A total of eighteen human HDACs enzymes, classified in four main groups
depending on the homology of their catalytic domain245,275, their subcellular
localization and their enzymatic activities276 have been characterized in the literature
and in Table 1.2, in Chapter 1.
Class I HDACs has been the most systematically investigated group with respect
to function and relevance for tumor formation. In general, class I HDACs (HDACs 1-3
and 8) are primarily located in the nucleus and are associated with transcriptional
repressors and cofactors, although there might be exceptions such as HDAC3, which
are reported to be also located in the cytoplasm328. Class II HDACs (HDACs 4-7, 9 and
10) are large proteins that shuttle between the cytoplasm and the nucleus depending
upon the phosphorylation status279,282,287.
In the last years, the expression of HDACs and its prognostic value has been
analyzed in different kinds of human cancers329–331. HDAC expression seems to be
associated with cell proliferation, angiogenesis, migration and invasion in cancer329.
Based on these effects of HDAC new and different therapies were developed332,333. In
vitro and in vivo assays showed that HDAC inhibition can limit growth of cancer cells
and the differential expression of the various HDACs suggests that these enzymes play

Chapter 2
47
unique roles in different cell types and tumors. At the present, HDACI in research and
clinical use target class I and class II HDACs.
In 2006, the HDAC inhibitor suberoylanilide hydroxamic acid–vorinosat (SAHA)
was the first HDACI to be approved for cutaneous T-cell lymphoma334 therapy. In the
last decade, different HDACI have being investigated in different types of cancers335–
337. These drugs have been more intensively studied in cancer types with poor
prognosis.
Epithelial ovarian cancers (EOC) are the leading cause of death in gynecological
malignancies3–5 and the high mortality is mainly due to advanced disease at
diagnosis5,13,338 and the lack of specific therapy. It is not clear which HDACs are active
in these cancers and there is scarce information in the current literature about the
expression profile of HDACs in ovarian carcinomas325,339.
Our aim in this study was to evaluate expression profile of HDAC in human
samples of ovarian carcinomas by immunohistochemistry and to find its potential
relationship with tumor histology, clinical behavior and regulation of cell cycle proteins
(p21, p16, p53 and cyclin D1). We also aimed to evaluate if its expression could help in
the selection of HDACI.
Material and Methods
Patients and tissue samples
Representative cases of high grade serous ovarian carcinoma (HGSC) and clear
cell carcinomas (CCC) were retrieved from the archives of the Department of
Pathology of the Instituto Português de Oncologia de Lisboa de Francisco Gentil
(IPOLFG). Only tumors treated with primary surgery were selected. All cases were
reevaluated to confirm the histopathological diagnosis and 49 cases of HGSC and 15
cases of CCC were selected to construct a tissue microarray with 64 tumor samples of
ovarian carcinoma and 2 commercial cell lines of ovarian carcinoma: OVCAR3 (a cell
line derived from a HGSC) and ES2 (a derived cell line from a clear cell carcinoma).

Chapter 2
48
The study protocol was approved by the Ethics Committee of IPOLFG (reference
number UC-938/2013) and approved by NOVA Medical School University Ethics
Committee (reference number 01/2015).
Cell lines
Clear cell carcinoma (CCC) cell line ES2 (CRL-1978) and high grade serous
carcinoma (HGSC) cell line OVCAR3 (HTB-161) were obtained from American Type
Culture Collection (Manassas, VA, USA). The cells were incubated at 37°C in a
humidified atmosphere containing 5% CO2 in McCoy’s 5A Modified Medium (Sigma-
Aldrich, St. Louis, MO, USA) supplemented with 10% fetal bovine serum (FBS, S 0615,
InvitrogenTM, Thermo Fisher Scientific, Inc., Waltham, MA, USA) and 1% antibiotic-
antimycotic (AA) (InvitrogenTM; Thermo Fisher Scientific, Inc., Waltham, MA, USA). The
cells were cultured to 80-100% confluence prior to detachment by incubation with 1X
0.05% trypsin-EDTA (InvitrogenTM; Thermo Fisher Scientific, Inc.) at room temperature.
Cells lines were collected and cytoblock was performed (according to manufacturer’s
instructions).
Tissue Microarray (TMA)
Representative hematoxylin and eosin (H&E) stained slides of ovarian cancer
cases were selected for tissue microarray construction and three cores of each case
were collected. Four cores from each commercial cell line cytoblocks were included.
Briefly, tissue cylinders with a diameter of 1.4 mm were punched from tumor
areas of each donor tissue block and brought into a recipient paraffin block (tissue
microarray–TMA), using a manual Tissue Puncher/Arrayer (Beecher Instruments, Silver
Spring, MD, USA). Sections with normal (ovary, fallopian tube, tonsil, kidney) and
cancer tissues (breast cancer, prostate cancer, mantle cell lymphoma) known to be
positive for the different antibodies were used as positive controls. As negative
controls, adjacent sections were processed as described above except that they were
incubated without the primary antibody.

Chapter 2
49
Immunohistochemistry
TMA sections (4m) were cut for immunohistochemical analysis and sections
were deparaffinized in xylene and dehydrated through graded concentrations of
ethanol. Antigen retrieval was performed by PT Link (Dako), with target retrieval
solution high pH, for 20 min at 95ºC. Formalin-fixed paraffin sections were incubated
for 1h at room temperature with the following antibodies described in Table 2.1:
mouse anti-HDAC1, mouse anti- HDAC2, rabbit anti-HDAC6, mouse anti-p21, mouse
anti-p53, anti-CINTec p16, rabbit anti-cyclin D1 and were visualized by EnVision/HRP
rabbit/mouse (ChemMate Envision Kit, Dako, K5007, USA). The visualization signal was
developed with 3,3’-diaminobenzidine (DAB) solution, and all the slides were
counterstained with Mayer’s hematoxylin.
Immunohistochemical staining of sections of TMA for HDAC3, HDAC4 and
phosphoHDAC 4/5/7 was performed using the Ventana Ultra BenchMark Automatic
staining platform (Ventana Medical Systems, Tuscon, Az, USA). The slides were
automatically deparaffinized and rehydrated using an EZ Prep solution. Antigen
retrieval was achieved with ULTRA CC1 solution for 92 min of incubation. Sections
were then incubated in primary antibody for 20 min for both mouse anti-HDAC3 and
rabbit phosphoHDAC4/5/7. For the antibody rabbit anti-HDAC4, antigen retrieval was
achieved with ULTRA CC1 for 40 min and incubated for 12 min. For antibodies p53, p16
and cyclinD1, antigen retrieval was achieved with ULTRA CC1 for 30 min and incubated
for 20 min. The Benchmark platform uses a polymer detection system called OptiView
to stain the antigen site brown. The sections were counterstained using Mayer´s
Hematoxylin for staining contrast. Slides were then removed from the automated
system, dry, covered, and analyzed by light microscopy.
Evaluation of Immunohistochemistry
The immunohistochemical evaluation was done by a pathologist and analyzed
the nuclear and cytoplasmic expression of HDAC1, 2 and 3 (negative or positive) and
the nuclear, cytoplasmic and/or membrane expression of HDAC4, 6 and
phosphoHDAC4/5/7. A total of 64 cases of EOC and the two cell lines for HDACs with
expression data were included in the final analysis.
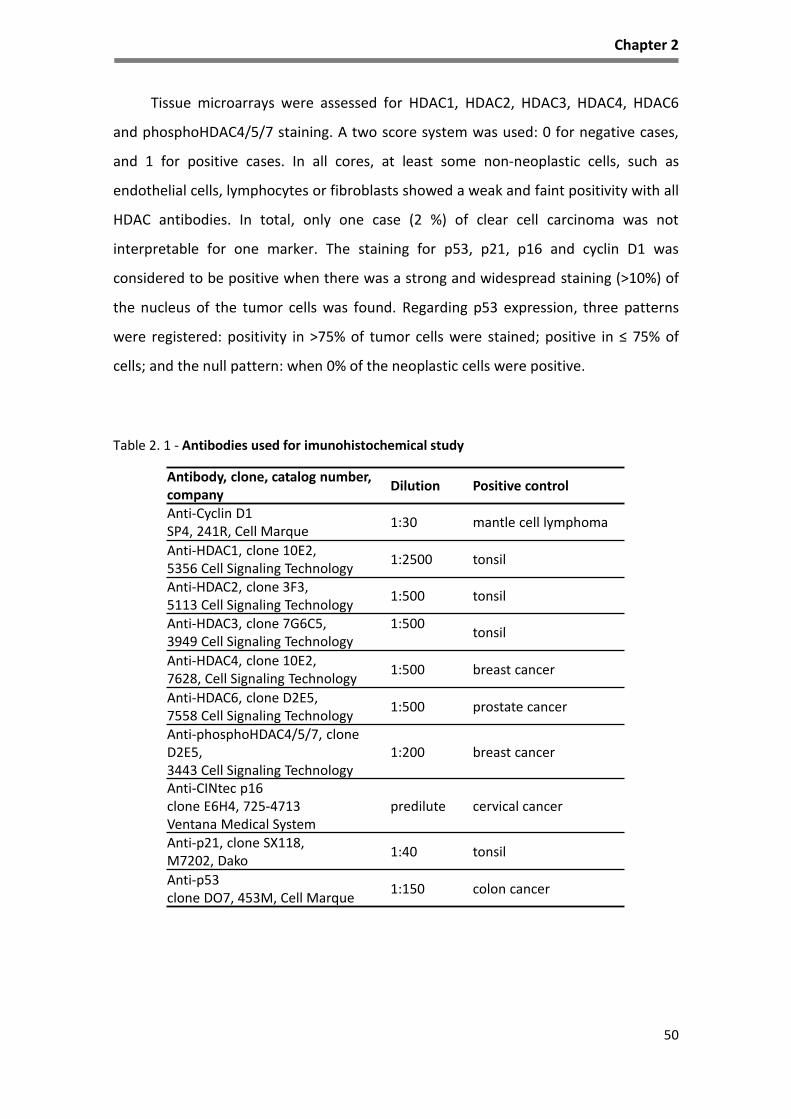
Chapter 2
50
Tissue microarrays were assessed for HDAC1, HDAC2, HDAC3, HDAC4, HDAC6
and phosphoHDAC4/5/7 staining. A two score system was used: 0 for negative cases,
and 1 for positive cases. In all cores, at least some non-neoplastic cells, such as
endothelial cells, lymphocytes or fibroblasts showed a weak and faint positivity with all
HDAC antibodies. In total, only one case (2 %) of clear cell carcinoma was not
interpretable for one marker. The staining for p53, p21, p16 and cyclin D1 was
considered to be positive when there was a strong and widespread staining (>10%) of
the nucleus of the tumor cells was found. Regarding p53 expression, three patterns
were registered: positivity in >75% of tumor cells were stained; positive in ≤ 75% of
cells; and the null pattern: when 0% of the neoplastic cells were positive.
Table 2. 1 - Antibodies used for imunohistochemical study
Antibody, clone, catalog number,company
Dilution Positive control
Anti-Cyclin D1SP4, 241R, Cell Marque
1:30 mantle cell lymphoma
Anti-HDAC1, clone 10E2,5356 Cell Signaling Technology
1:2500 tonsil
Anti-HDAC2, clone 3F3,5113 Cell Signaling Technology
1:500 tonsil
Anti-HDAC3, clone 7G6C5,3949 Cell Signaling Technology
1:500tonsil
Anti-HDAC4, clone 10E2,7628, Cell Signaling Technology
1:500 breast cancer
Anti-HDAC6, clone D2E5,7558 Cell Signaling Technology
1:500 prostate cancer
Anti-phosphoHDAC4/5/7, clone D2E5,3443 Cell Signaling Technology
1:200 breast cancer
Anti-CINtec p16clone E6H4, 725-4713 Ventana Medical System
predilute cervical cancer
Anti-p21, clone SX118,M7202, Dako
1:40 tonsil
Anti-p53clone DO7, 453M, Cell Marque
1:150 colon cancer

Chapter 2
51
Statistical evaluation
For statistical analysis, IBM SPSS, version 21 (IBM Inc., Armonk, USA) was used.
Associations between HDACs expression and clinical and pathological parameters were
assessed by contingency tables and Fisher´s exact test to evaluate the distribution and
the association of HDAC expression across tumors and by generalized linear models.
Chi-square test was used to assess the associations of HDACs proteins expression with
clinicopathological variables and cell cycle proteins.
Univariate survival analysis was performed by the generation of Kaplan-Meier
curves, and differences between groups were compared by the log-rank test.
Multivariable survival analysis was performed using the Cox proportional hazards
model. A p-value of 0.05 or less was considered statistically significant. Results were
presented as hazard ratio (HR) and 95% confidence interval (CI).
Clinical and pathological characteristics
The main clinicopathological characteristics of ovarian cancer patients are
presented in Table 2.2.
The median age of patients diagnosed as HGSC was 62 years old (range 35 and
82). Tumors stage was done using FIGO classification and 12% (6) of carcinomas were
classified at stage I, 23% (11) were at stage II and the remaining 65% (32) patients were
at stage III (table 2.2). The follow-up period was defined as the time interval between
the surgery and last medical appointment or death. The median follow-up time was 58
months (range, 1 to 167 months). All cases were treated with adjuvant chemotherapy
but two cases. Recurrences were diagnosed in all but 2 patients, 31 (63%) were local
recurrences and metastases were found in 96% of patients (47/49). At the end of the
follow up a total of 37 patients died (37/49, 88 %) of disease progression, 3 patients
were lost for follow up, 4 died from other causes and only 5 (12%) patients remain
alive of which 2 were alive without disease and 3 patients were alive with disease.
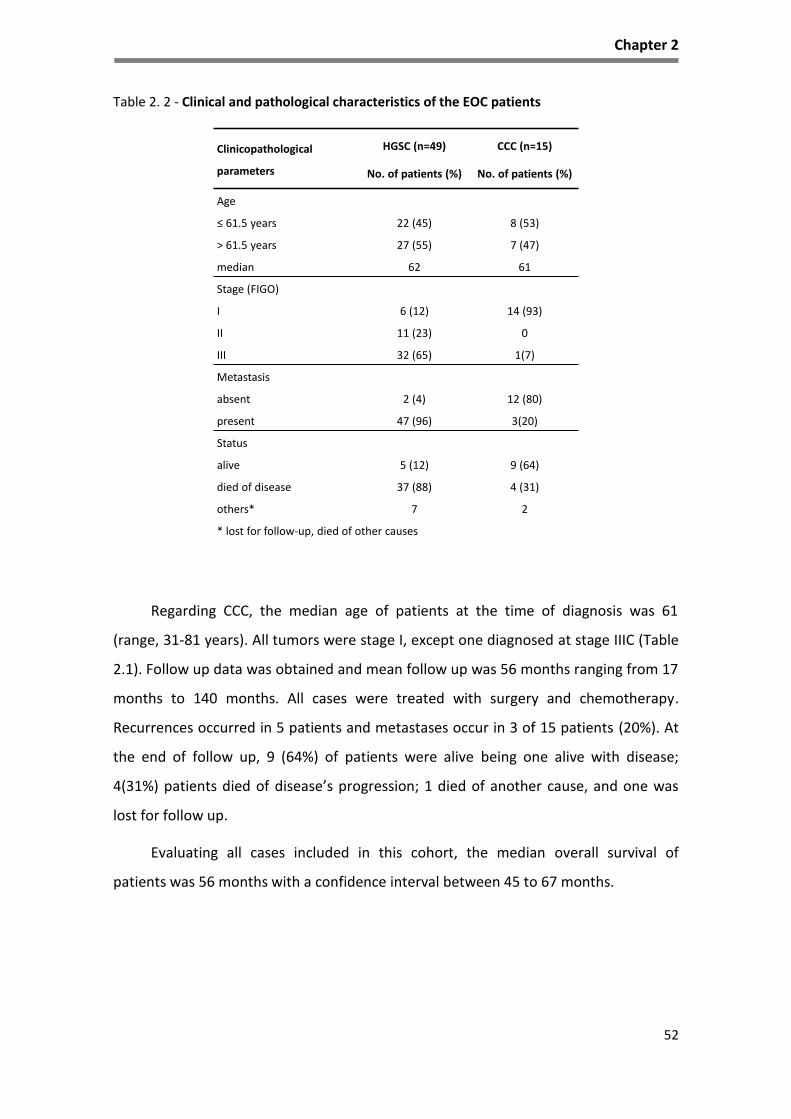
Chapter 2
52
Table 2. 2 - Clinical and pathological characteristics of the EOC patients
Regarding CCC, the median age of patients at the time of diagnosis was 61
(range, 31-81 years). All tumors were stage I, except one diagnosed at stage IIIC (Table
2.1). Follow up data was obtained and mean follow up was 56 months ranging from 17
months to 140 months. All cases were treated with surgery and chemotherapy.
Recurrences occurred in 5 patients and metastases occur in 3 of 15 patients (20%). At
the end of follow up, 9 (64%) of patients were alive being one alive with disease;
4(31%) patients died of disease’s progression; 1 died of another cause, and one was
lost for follow up.
Evaluating all cases included in this cohort, the median overall survival of
patients was 56 months with a confidence interval between 45 to 67 months.
Clinicopathological
parameters
HGSC (n=49)
No. of patients (%)
CCC (n=15)
No. of patients (%)
Age
≤ 61.5 years 22 (45) 8 (53)
> 61.5 years 27 (55) 7 (47)
median 62 61
Stage (FIGO)
I 6 (12) 14 (93)
II 11 (23) 0
III 32 (65) 1(7)
Metastasis
absent 2 (4) 12 (80)
present 47 (96) 3(20)
Status
alive 5 (12) 9 (64)
died of disease 37 (88) 4 (31)
others* 7 2
* lost for follow-up, died of other causes

Chapter 2
53
Results
HDACs expression in EOC
Immunostains were evaluated in all tissue cores of the TMA that included
controls (normal and cancer tissues), tumor cases and cores from the commercial cell
lines. HDAC1, HDAC2 staining was only present in the nucleus of cells. Regarding
HDAC3, a nuclear staining was seen except in three cases diagnosed as HGSC, whereas
HDAC3 had also a faint cytoplasmic expression in tumor cells. In all the previous TMA
core samples, HDAC4 was expressed in the cytoplasm and in the membrane and
phosphoHDAC4/5/7 and HDAC6 expression were present only in the cytoplasm.
As regard to commercial cell lines HDAC1, 2, 3 and 6 was expressed in the
nucleus of OVCAR3 cells (high grade serous carcinoma cell line) and ES2 (clear cell
carcinoma cell line). Both cell lines cells did not exhibit HDAC4 or phosphoHDAC4/5/7
staining, although rare ES2 cells exhibited phosphoHDAC4/5/7.
Regarding the results of HDACs in the ovarian carcinoma’s samples, most cores
showed an intermediate or high expression of the analyzed enzymes. The results of
HDACs expression were registered in Figures 2.1., 2.2 and in Tables 2.3 to 2.6.
Table 2. 3 - Expression of HDACs in EOC commercial lines
Cell lines HDAC1 HDAC2 HDAC3 HDAC4m HDAC4c HDAC6 pHDAC4/5/7
OVCAR3 1 1 1 0 0 1 0ES2 1 1 1 0 0 1 rare0= negative; 1=positive; HDAC4m: membrane; HDAC4c: cytoplasm; pHDAC4/5/7: phosphoHDAC4/5/7

Chapter 2
54
Table 2. 4 - Expression of HDACs in EOC samples and its association with the histological type
Figure 2. 1- Representative pattern of HDACs protein expression in HGSC in tissue microarray (TMA) sections. Hematoxylin (H&E) and immunohistochemical stains for HDACs in TMA sections of HGSC. A, B- H&E; C, D- HDAC1; E, F- HDAC2; G, H- HDAC3; I, J- HDAC4; K, L- HDAC6; M, N- pHDAC4/5/7. Two magnifications (200x and 400x) are presented for each antibody.
HDACsHGSC CCC Total
patientspositive % 95% CI positive % 95% CI p-value
HDCA1 38 78 0.641-0.869 15 100 0.796-1.000 64 0.0540
HDAC2 49 100 0.927-1.000 12 80 0.548-0.929 64 0.0109
HDAC3 44 90 0.782-0.955 5 33 0.151-0.582 64 0.0001
HDAC4m 27 55 0.413-0.681 3 21 0.704-0.451 63 0.0349
HDAC4c 44 90 0.782-0.955 3 21 0.704-0.451 63 0.0001
HDAC6 41 84 0.709-0.914 13 87 0.621-0.962 64 1.000
phosphoHDAC4/5/7 45 92 0.808-0.967 6 43 0.198-0.642 63 0.0003
HDAC4m: membrane; HDAC4c: cytoplasm
C D
A B
E F
G H I J
K L M N

Chapter 2
55
In HGSC cases, a very high expression of HDACs was found (Table 2.4). HGSC
expressed high levels of class I HDAC: 78% (38/49) for HDAC1; 100% (49/49) for HDAC2
and 90% (44/49) for HDAC3. Regarding class II HDACs, HDAC4 expression in HGSC cases
in the cytoplasm was more frequent than in the membrane, 90% (44/49) vs 55%
(27/49), respectively. Cytoplasmic expression of HDAC6 and phosphoHDAC4/5/7 was
also found in this tumor type in 84% (41/64) and 92% (45/49), respectively.
Figure 2. 2 - Representative pattern of HDACs protein expression in CCC in tissue microarray (TMA) sections Hematoxylin (H&E) and immunohistochemical stains for HDACs in TMA sections of HGSC. A, B- H&E; C, D- HDAC1; E, F- HDAC2; G, H- HDAC3; I, J- HDAC4; K, L- HDAC6; M, N- pHDAC4/5/7. Two magnifications (200x and 400x) are presented for each antibody.
C D
A B
E F
G H I J
K L M N

Chapter 2
56
In CCC cases (Table 2.4), HDAC1, 2 and 6 were strikingly expressed, 100%
(15/15), 80% (12/15) and 87% (13/15), respectively. However, HDAC3 expression was
moderate, being only present in 33% (5/15) of cases, and HDAC4 even lower in the
membrane and in the cytoplasm, only 21% (3/15) of cases expressed.
PhosphoHDAC4/5/7 expression was observed in 43% (6/15) of cases.
The different expression of the HDACs and the tumor type were significant
regarding HDAC2, HDAC3, HDAC4 and phosphoHDAC4/5/7 immunodetection, being
more expressed in HGSC than in CCC. HDAC2 was present in all HGSC and only present
in 80% of CCC being this difference significant with a p=0.0109 (CI=0.548-1.000).
Nuclear HDAC3 expression was higher in HGSC compared to CCC, being this difference
also significant (p<0.0001). Both membrane (p=0.0349) and cytoplasmic (p<0.0001)
HDAC4 expression were associated with HGSC cases. PhosphoHDAC4/5/7 expression
was also significantly associated (p=0.0003) with HGSC type as reported in Table 2.4.
HDACs expression and clinicopathological parameters in EOC
We analyzed the expression profile of HDACs and the clinicopathological data in
separate groups for histological type and the all EOC.
In univariate analysis of all cases of EOC the expression of some of these
enzymes was correlated with the clinicopathological parameters as reported in Table
2.5.
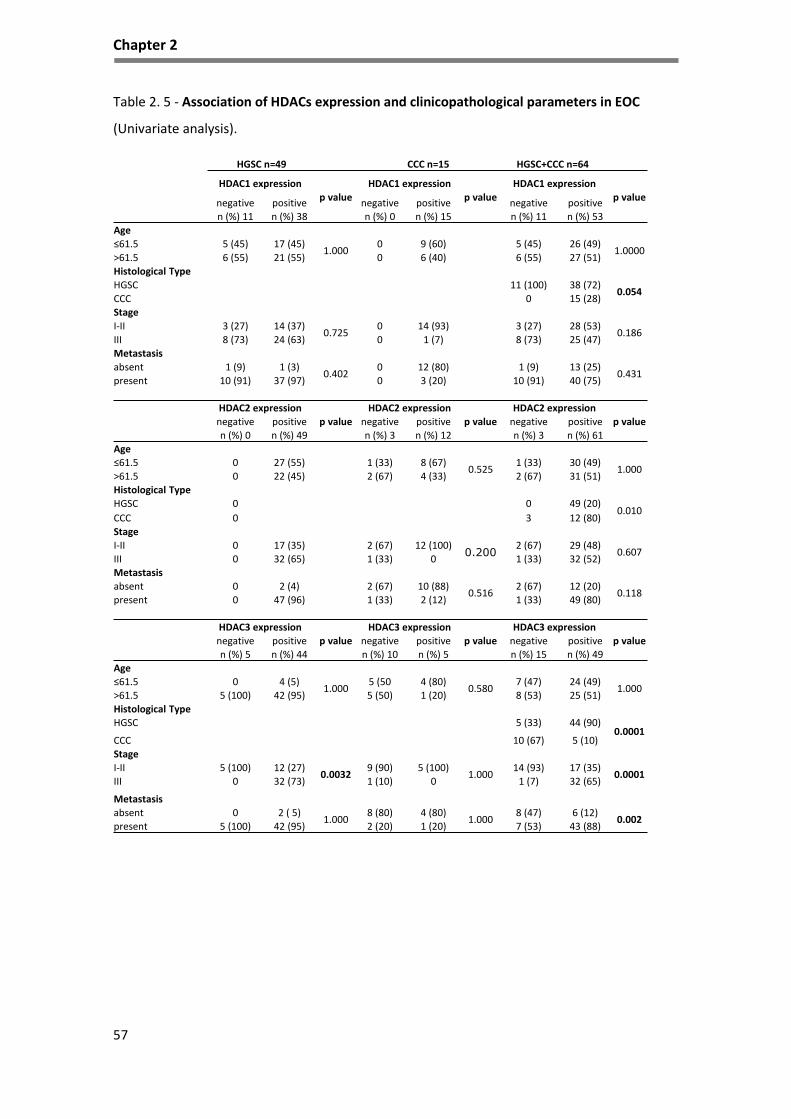
Chapter 2
57
Table 2. 5 - Association of HDACs expression and clinicopathological parameters in EOC
(Univariate analysis).
HGSC n=49 CCC n=15 HGSC+CCC n=64
HDAC1 expression
p value
HDAC1 expression
p value
HDAC1 expression
p valuenegative positive negative positive negative positive
n (%) 11 n (%) 38 n (%) 0 n (%) 15 n (%) 11 n (%) 53
Age
≤61.5 5 (45) 17 (45)1.000
0 9 (60) 5 (45) 26 (49)1.0000
>61.5 6 (55) 21 (55) 0 6 (40) 6 (55) 27 (51)
Histological Type
HGSC 11 (100) 38 (72)0.054
CCC 0 15 (28)
Stage
I-II 3 (27) 14 (37)0.725
0 14 (93) 3 (27) 28 (53)0.186
III 8 (73) 24 (63) 0 1 (7) 8 (73) 25 (47)
Metastasis
absent 1 (9) 1 (3)0.402
0 12 (80) 1 (9) 13 (25)0.431
present 10 (91) 37 (97) 0 3 (20) 10 (91) 40 (75)
HDAC2 expression
p value
HDAC2 expression
p value
HDAC2 expression
p valuenegative positive negative positive negative positive
n (%) 0 n (%) 49 n (%) 3 n (%) 12 n (%) 3 n (%) 61
Age
≤61.5 0 27 (55) 1 (33) 8 (67)0.525
1 (33) 30 (49)1.000
>61.5 0 22 (45) 2 (67) 4 (33) 2 (67) 31 (51)
Histological Type
HGSC 0 0 49 (20)0.010
CCC 0 3 12 (80)
Stage
I-II 0 17 (35) 2 (67) 12 (100)0.200
2 (67) 29 (48)0.607
III 0 32 (65) 1 (33) 0 1 (33) 32 (52)
Metastasis
absent 0 2 (4) 2 (67) 10 (88)0.516
2 (67) 12 (20)0.118
present 0 47 (96) 1 (33) 2 (12) 1 (33) 49 (80)
HDAC3 expression
p value
HDAC3 expression
p value
HDAC3 expression
p valuenegative positive negative positive negative positive
n (%) 5 n (%) 44 n (%) 10 n (%) 5 n (%) 15 n (%) 49
Age
≤61.5 0 4 (5)1.000
5 (50 4 (80)0.580
7 (47) 24 (49)1.000
>61.5 5 (100) 42 (95) 5 (50) 1 (20) 8 (53) 25 (51)
Histological Type
HGSC 5 (33) 44 (90)0.0001
CCC 10 (67) 5 (10)
Stage
I-II 5 (100) 12 (27)0.0032
9 (90) 5 (100)1.000
14 (93) 17 (35)0.0001
III 0 32 (73) 1 (10) 0 1 (7) 32 (65)
Metastasis
absent 0 2 ( 5)1.000
8 (80) 4 (80)1.000
8 (47) 6 (12)0.002
present 5 (100) 42 (95) 2 (20) 1 (20) 7 (53) 43 (88)

Chapter 2
58
HGSC n=49 CCC n=15 HGSC+CCC n=64
HDAC4c expression
p valueHDAC4c expression
p valueHDAC4c expression
p valuenegative positive negative positive negative positiven (%) 5 n (%) 44 n (%) 12 n (%) 3 n (%) 16 n (%) 47
Age
≤61.5 4 (40) 18 (41)0.160
5 (45) 2 (67)0.209
9 (44) 21 (45)0.564
>61.5 1 (20) 26 (59) 6 (55) 1 (33) 7 (56) 26 (55)Histological Type
HGSC 5 (31) 44 (94)0.0001
CCC 11 (69) 7 (6)
Stage
I-II 1 (20) 16 (36)0.646
10 (91) 3 (100)1.000
11 (69) 19 (40)0.081
III 4 (80) 28 (64) 1 (9) 0 5 (31) 28 (60)
Metastasis
absent 1 (20) 1 (2)0.196
10 10.093
11 (69) 2 (4)0.0001
present 4 (80) 43 (98) 1 2 5 (31) 45 (96)
HDAC4m expression
p value
HDAC4m expression
p value
HDAC4m expression
p valuenegative positive negative positive negative positive
n (%) 22 n (%) 27 n (%) 11 n (%) 3 n (%) 33 n (%) 30
Age
≤61.5 9 (40) 13 (48)0.774
5 (45) 2 (67)1.000
15 (45) 15 (50)0.803
>61.5 13 (59) 14 (52) 6 (55) 1 (33) 18 (55) 15 (50)
Histological Type
HGSC 22 (67) 27 (90)0.034
CCC 11 (33) 3 (10)
Stage
I-II 10 (45) 7 (26)0.228
10 (91) 3 (100)1.000
20 (39) 10 (33)0.044
III 12 (55) 20 (74) 1 (9) 0 13 (61) 20 (67)
Metastasis
absent 0 2 (7)0.495
9 (82) 2 (67)1.000
9 (27) 4 (13)0.221
present 22 (100) 25 (93) 2 (18) 1 (33) 24 (73) 26 (87)
HDAC6 expression
p value
HDAC6 expression
p value
HDAC6 expression
p valuenegative positive negative positive negative positive
n (%) 8 n (%) 41 n (%) 2 n (%) 13 n (%) 10 n (%) 54
Age
≤61.5 5 (62) 17 (41)0.440
0 9 (69)0.143
5 (50) 26 (48)1.000
>61.5 3 (38) 24 (59) 2 (100) 4 (31) 5 (50) 28 (52)
Histological Type
HGSC 8 (80) 41 (76)1.000
CCC 2 (20) 13 (24)
StageI-II 1 (12) 16 (39)
0.2332 (100) 12 (92)
1.0003 (30) 28 (52)
0.305III 7 (88) 25 (61) 0 1 (8) 7 (70) 26 (48)
Metastasis
absent 0 2 (5)1.000
2 (100) 10 (77)1.000
2 (20) 12 (22)1.000
present 8 (100) 39 (95) 0 3 (23) 8 (80) 42 (78)
pHDAC expression
p value
pHDAC expression
p value
pHDAC6expression
p valuenegative positive negative positive negative positiven (%) 4 n (%) 45 n (%) 8 n (%) 6 n (%) 12 n (%) 51
Age
≤61.5 3 (75) 19 (42)0.314
5 (63) 3 (50)1.000
8 (67) 22 (43)0.202
>61.5 1 (25) 26 (58) 3 (37) 3 (50) 4 (33) 29 (57)Histological Type
HGSC 4 (33) 45 (88)0.0001
CCC 8 (67) 6 (12)
Stage
I-II 1 (25) 16 (36)1.000
7 (88) 6 (100)1.000
8 (67) 22 (43)0.202
III 3 (75) 29 (64) 1 (12) 0 4 (33) 29 (57)
Metastasis
absent 1 (25) 1 (2)0.471
6 (75) 5 (83)1.000
7 (58) 6 (12)0.001
present 3 (75) 44 (98) 2 (25) 1 (17) 5 (42) 45 (88)

Chapter 2
59
In summary, HDAC3 expression was associated with stage (p=0.001), being
present in high stage HGSC at presentation (p=0.002) and HDAC3, HDAC4c and
phosphoHDAC4/5/7 expression was associated with the presence of metastasis
(p=0.002), (p=0.001) and (p=0.001), respectively. No prognostic value of HDACs in
overall survival (OS) was found using Kaplan-Meier method and log-rank test.
Subsequently, we performed multivariate analysis and the results indicated that
there is a trend of association between the histological type and metastasis and in our
cohort the histological type is an independent factor.
Table 2. 6 - Multivariate analysis of HDAC3, HDAC4c and phosphoHDAC4/5/7 expression for histological type and metastasis
HDACs expression and cell cycle markers in EOC
The results of the immunohistochemical study of cell cycle markers performed on
commercial cell line and EOC samples are registered in figure 2.3 and table 2.7 and 2.8.
Concerning the EOC cell lines, OVCAR3 expressed p53 and cyclin D1, and no
expression for p16 and p21 was observed. ES2 exhibited p16, p53, Cyclin D1, however
p21 was not present.
Table 2. 7 - Expression of cell cycle markers in EOC commercial cell lines
Parameters HDAC3 HDAC4c pHDAC4
OR 95% CI p value OR 95% CI p value OR 95% CI p value
Histological type (HGSC vs CCC) 0.045 0.004-0.494 0.011 0.149 0.19-1.148 0.68 0.112 0.013-0.956 0.045
Metastasis (absent vs present) 0.738 0.63-8.633 0.809 14.465 1.7-121.6 0.14 2.046 0.232-18.04 0.519
HDAC4c: cytoplasm, pHDAC4/5/7: phosphoHDACs/5/7, OR, odds ratio; CI, confidence interval
Cell lines p16 p21 p53 Cyclin D1
OVCAR3 0 0 1* 1
ES2 1 0 1* 1
0= negative; 1=positive; 1*= overexpressed
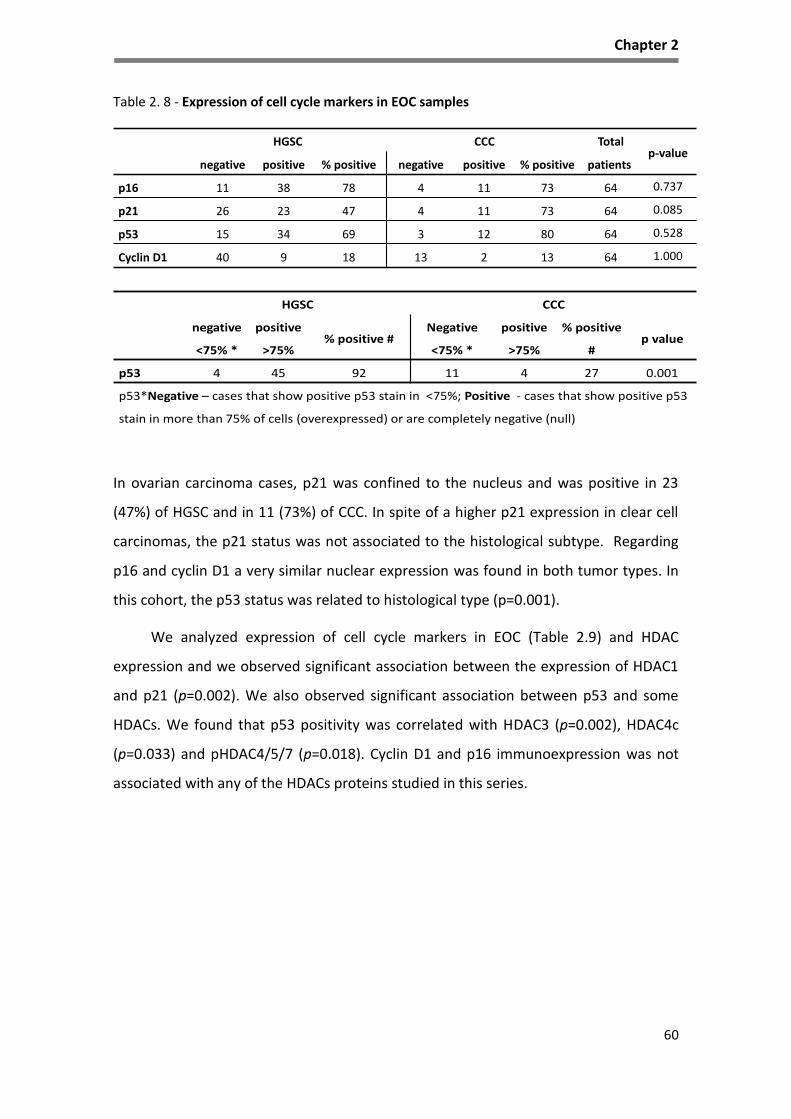
Chapter 2
60
Table 2. 8 - Expression of cell cycle markers in EOC samples
In ovarian carcinoma cases, p21 was confined to the nucleus and was positive in 23
(47%) of HGSC and in 11 (73%) of CCC. In spite of a higher p21 expression in clear cell
carcinomas, the p21 status was not associated to the histological subtype. Regarding
p16 and cyclin D1 a very similar nuclear expression was found in both tumor types. In
this cohort, the p53 status was related to histological type (p=0.001).
We analyzed expression of cell cycle markers in EOC (Table 2.9) and HDAC
expression and we observed significant association between the expression of HDAC1
and p21 (p=0.002). We also observed significant association between p53 and some
HDACs. We found that p53 positivity was correlated with HDAC3 (p=0.002), HDAC4c
(p=0.033) and pHDAC4/5/7 (p=0.018). Cyclin D1 and p16 immunoexpression was not
associated with any of the HDACs proteins studied in this series.
HGSC CCC Total
patientsp-value
negative positive % positive negative positive % positive
p16 11 38 78 4 11 73 64 0.737
p21 26 23 47 4 11 73 64 0.085
p53 15 34 69 3 12 80 64 0.528
Cyclin D1 40 9 18 13 2 13 64 1.000
HGSC CCC
negative
<75% *
positive
>75%% positive #
Negative
<75% *
positive
>75%
% positive
#p value
p53 4 45 92 11 4 27 0.001
p53*Negative – cases that show positive p53 stain in <75%; Positive - cases that show positive p53
stain in more than 75% of cells (overexpressed) or are completely negative (null)

Chapter 2
61
Figure 2. 3 - Representative examples of immunostaining for p16, p21, p53 and cyclin D1 in different histological types of ovarian cancer Immunohistochemical stains for the cell cycle markers were performed in TMA sections. HGSC samples: A- p16, B- p21, C- p53, D- cyclinD1; CCC: E- p16, F- p21, G- p53, H- cyclinD1.
Figure 3
C D
A B
E F
G H

Chapter 2
62
Table 2. 9 - Expression of HDACs expression and cell cycle markers in EOC
Cell cycle markers
HGSC n=49 CCC n=15 HGSC+CCC n=64
HDAC1 expression
p value
HDAC1 expression
p value
HDAC1 expression
p valuenegative positive negative positive negative positive
n (%) 11 n (%) 38 n (%) 0 n (%) 15 n (%) 11 n (%) 53
p16 expression
negative 3 (27) 8 (21)0.692
0 4 (27) 3 (27) 12 (23)0.710
positive 8 (73) 30 (79) 0 11 (73) 8 (73) 41 (77)
p21 expression
negative 10 (91) 16 (42)0.006
0 4 (27) 10 (91) 20 (38)0.002
positive 1 (9) 22 (58) 0 11 (73) 1 (9) 33 (62)
p53 expression
overexpressed/null 9 (82) 36 (95)0.214
0 5 (37) 9 (82) 41 (77)1.000
“wild type” 2 (18) 2 (5) 0 10 (67) 2 (18) 12 (23)
Cyclin D1 expression
negative 10 (91) 30 (79)0.662
0 13 (87) 10 (91) 43 (81)0.672
positive 1 (9) 8 (21) 0 2 (13) 1 (9) 10 (19)
HDAC2 expression
p value
HDAC2 expression
p value
HDAC2 expression
p valuenegative positive negative positive negative positive
n (% ) 0 n (%) 49 n (%) 3 n (%) 12 n (%) 3 n (%) 61
p16 expression
negative 0 11(22) 1 (33) 3 (25)1.000
1 (33) 14 (23)0.558
positive 0 38 (78) 2 (67) 9 (75) 2 (67) 47 (77)
p21 expression
negative 0 26 (53) 1 (33) 3 (25)1.000
1(33) 29 (48)1.000
positive 0 23 (47) 2 (67) 9 (75) 2(67) 32 (52)
p53 expression
overexpressed/null 0 45 (92) 1 (33) 4 (33)1.000
1(33) 49 (80)0.118
“wild type” 0 4 (8) 2 (67) 8 (67) 2(67) 12 (20)
Cyclin D1 expression
negative 0 40 (82) 3 (100) 10 (83)1.000
3 (100) 50 (82)1.000
positive 0 9 (18) 0 2 (17) 0 11 (18)
HDAC3 expression
p value
HDAC3 expression
p value
HDAC3 expression
p valuenegative positive negative positive negative positive
n (% ) 5 n (%) 44 n (%) 10 n (%) 5 n (%) 15 n (%) 49
p16 expression
negative 2 (40) 9 (20)0.311
3 (30) 1 (20)1.000
5 (33) 10 (20)0.315
positive 3 (60) 35 (80) 7 (70) 4 (80) 10 (67) 39 (80)
p21 expression
negative 3 (60) 23 (52)1.000
4 (40) 0 (27)0.231
7 (47) 23 (47)1.000
positive 2 (40) 21 (48) 6 (60) 5 (73) 8 (53) 26 (53)
p53 expression
overexpressed/null 4 (80) 41 (93)0.359
3 (30) 2 (40)1.000
7 (47) 43 (88)0.002
“wild type” 1 (20) 3 (7) 7 (70) 3 (60) 8 (53) 6 (12)
Cyclin D1 expression
negative 4 (80) 36 (82)1.000
10 (100) 3 (60)0.095
14 (93) 39 (80)0.434
positive 1 (20) 8 (18) 0 2 (40) 1 (7) 10 (20)

Chapter 2
63
Cell cycle markers
HGSC n=49 CCC n=15 HGSC+CCC n=64
HDAC4c expression
p value
HDAC4c expression
p value
HDAC4c expression
p valuenegative positive negative positive negative positive
n (%) 5 n (%) 44 n (%) 11 n (%) 3 n (%) 16 n (%) 47
p16 expression
negative 0 11 (25)0.574
4 (36) 00.505
4 (25) 11 (23)1.000
positive 5 (100) 33 (75) 7 (64) 3 (100) 12 (75) 36 (77)
p21 expression
negative 4 (80) 22 (50)0.353
2 (18) 1 (33)1.000
6 (62) 23 (49)0.564
positive 1 (20) 22 (50) 9 (82) 2 (67) 10 (38) 24 (51)
p53 expression
overexpressed/null 5 (100) 40 (91)1.000
4 (36) 00.505
9 (56) 40 (85)0.033
“wild type” 0 4 (9) 7 (64) 3 (100) 7 (44) 7 (15)
Cyclin D1 expression
negative 4 (80) 36 (82)1.000
9 (82) 3 (100)1.000
13 (81) 39 (83)1.000
positive 1 (20) 8 (18) 2 (18) 0 3 (19) 8 (17)
HDAC4m expression
p value
HDAC4m expression
p value
HDAC4m expression
p valuenegative positive negative positive negative positive
n (%) 22 n (%) 27 n (%) 11 n (%) 3 n (%) 33 n (%) 30
p16 expression
negative 5 (23) 6 (22)1.000
4 (36) 00.505
9 (73) 6 (20)0.564
positive 17 (77) 21 (78) 7 (64) 3 (100) 24 (27) 24 (80)
p21 expression
negative 11 (50) 15 (56)0.778
2 (18) 1 (67)1.000
13 (39) 16 (53)0.317
positive 11 (50) 12 (44) 9 (82) 2 (33) 20 (61) 14 (47)
p53 expression
overexpressed/null 20 (90) 25 (93)1.000
4 (36) 00.505
24 (73) 25 (83)0.373
“wild type” 2 (9) 2 (7) 7 (64) 3 (100) 9 (27) 5 (17)
Cyclin D1 expression
negative 16 (73) 24 (89)0.266
9 (92) 3 (100)1.000
25 (76) 27 (90)0.189
positive 6 (27) 3 (11) 2 (18) 0 8 (24) 3 (10)
HDAC6 expression
p value
HDAC6 expression
p value
HDAC6 expression
p valuenegative positive negative positivenegative positive
n (% )8 n (%) 41 n (%) 2 n (%) 13 n (%) 10 n (%) 54
p16 expression
negative 2 (25) 9 (22)1.000
2 (100) 2 (15)0.057
4 (40) 11 (20)0.226
positive 6 (75) 32 (78) 0 11 (85) 6 (60) 43 (80)
p21 expression
negative 4 (50) 22 (54)1.000
0 (40) 4 (31)1.000
4 (40) 26 (48)0.738
positive 4 (50) 19 (46) 2 (60) 9 (69) 6 (60) 28 (52)
p53 expression
overexpressed/null 7 (86) 38 (93)0.522
2 (100) 3 (23)0.095
9 (90) 41 (76)0.437
“wild type” 1 (12) 3 (7) 0 10 (77) 1 (10) 13 (24)
Cyclin D1 expression
negative 8 (100) 32 (78)0.322
2 (100) 11 (85)1.000
10 (100) 43 (80)0.188
positive 0 8 (22) 0 2 (15) 0 11 (20)
pHDAC4/5/7 expression
p value
pHDAC4/5/7 expression
p value
pHDAC64/5/7 expression
p valuenegative positive negative positive negative positive
n (% ) 4 n (%) 45 n (%) 8 n (%) 6 n (%) 12 n (%) 51
p16 expression
negative 2 (50) 9 (20)0.214
3 (37) 1 (17)0.580
5 (42) 10 (20)0.137
positive 2 (50) 36 (80) 5 (63) 5 (83) 7 (58) 41 (80)
p21 expression
negative 2 (50) 24 (53)1.000
3 (37) 00.209
5 (42) 24 (47)1.000
positive 2 (50) 21 (47) 5 (63) 6 (100) 7 (58) 27 (53)
p53 expression
overexpressed/null 4 (100) 41 (91)1.000
2 (25) 2 (33)1.000
6 (50) 43 (84)0.018
“wild type” 0 4 (9) 6 (75) 4 (67) 6 (50) 8 (16)
Cyclin D1 expression
negative 4 (100) 36 (80)1.000
8 (100) 4 (67)0.165
12 (100) 40 (78)0.104
positive 0 9 (20) 0 2 (33) 0 11 (22)

Chapter 2
64
Discussion
Ovarian carcinomas correspond to several different clinical and histological
entities that are treated with the same therapeutic approach with very modest
success340. Recently, genetic and molecular characterization of these entities,
reinforced its individuality and the need to find more adequate therapeutics for each
entity34,37.
Over the 10 last years, HDACs have been reported to be involved in many human
malignancies, including ovarian carcinomas325,341 and their expression has been
associated with clinicopathological parameters such as patients’ survival and disease
prognosis. The assessment of HDACs immunodetection profile and the biological and
clinical significance of these markers in ovarian carcinomas remains scarce.
In the view of above considerations, the present study assessed the expression
of class I and II HDACs in ovarian carcinomas, pursued to find their association with
clinicopathological parameters and with the expression of cell cycle proteins. Also, to
contribute for HDAC immuno-profile that might establishes a rational for the use of
HDAC inhibitors in ovarian cancer.
Class I HDACs are mostly localized within the nucleus due to the lack of a nuclear
export signal whereas class II HDACs shuttle between nucleus and cytoplasm in
response to certain cellular signals339.
In our panel of tumors, we observed a high expression of all HDACs in those
cellular locations. All types of class I HDACs studied, HDAC1, 2 and 3, where present in
the majority of HGSC and CCC cases. This result is in accordance with Hayashi et al.325
that described an increased stepwise nuclear expression of HDAC1, HDAC2 and HDAC3
proteins from benign, borderline and malignant ovarian tumors.
In the analysis of our results, we observed a lower HDAC1 expression in HGSC
(78%) than in CCC (100%), and a higher HDAC2 in HGSC (100%) than in CCC. These two
HDACs have an opposite expression, being the HDAC2 significantly associated with the
histological type (p=0.0109). The biological meaning of the different expression can be
related with the biological redundancy of HDAC1 and 2. It is known that HDAC1 and
Chapter 2
65
HDAC2 form homo-and heterodimers between each other342,343, which allows them to
act together or separately from each other, so HDAC1 in the absence of HDAC2 is still
able to interact with Co-REST and Sin3a (this is also true vice versa), demonstrating
that the integrity of known HDAC containing corepressor complexes Co-REST and Sin3a
is not affected in the absence of one of these two enzymes. In fact, no association was
found regarding these two HDACs and the clinical parameters evaluated.
HDAC3 protein expression in these two tumor type of ovarian carcinomas differs
relevantly from the other two Class I HDACs proteins. The immunoexpression of
HDAC3 in our set of CCC was low in comparison to previous reports325,339. HDAC3 in
our series was highly express in the majority of HGSC (90%) and was seldom found in
CCC (33%), being this difference statistically significant (p<0.0001). The low expression
of HDAC3 in CCC might underlie different regulatory mechanisms of the three proteins
in this tumor entity or might be dependent on the stage of disease. Hayashi et al.325
found, in their series of cases of EOC, a correlation between HDAC3 expression on CCC
and stage IV disease. In our series, all, but one case, were diagnosed at stage I and this
might be the explanation for the lower expression of HDAC3 that we observed in our
cohort of CCC. It is plausible that HDAC3 is associated with the biological
aggressiveness. Although, we did not found an association between HDAC3 expression
in CCC and stage or prognosis, in all the cohort of EOC cases, and in the HGSC group,
HDAC3 was more frequently associated with advanced clinical stage (p=0.0001) and
(p=0.0023), and presence of metastases (p=0.002) in EOC patients. Hayashi et al. also
described the importance of HDAC3 expression for ovarian cancer cell migration325.
Again, our cohort of CCC cases cannot be use to address this as only one case were at
advance stage at presentation.
The study of the role of HDACs in cancer has been mainly focused on the
potential contribution of members of the class I HDACs subfamily. However, in recent
year’s class II HDACs have started to be linked to several types of cancer344–346. Class II
HDACs are regulated in part by shuttling the protein between the nucleus and
cytoplasm. Cytoplasmic location of class II facilitates gene activation by removing
HDACs from their target genes248.

Chapter 2
66
The HDAC4 nuclear localization seems to be important in cancer as HDAC
inhibitors block its entrance to the nucleus347. In our series, we only found HDAC4 in
the cytoplasm and/or in the cell membrane and was predominantly expressed in
HGSC. Both membrane (p=0.0349) and cytoplasmic (p<0.0001) HDAC4 expression were
associated with HGSC cases in comparison with CCC. The phosphorylation of HDAC4
generates binding sites for the 14-3-3 protein, an HDAC chaperon, and promotes its
export from the nucleus to the cytoplasm347. This protein has been also found highly
expressed in some cancers such as esophageal carcinoma348 and breast cancer in
comparison with others like renal, bladder and colorectal cancer346. HDAC4 has also
been described in the cytoplasm of pancreatic adenocarcinoma349. In that series of
pancreatic adenocarcinomas, the high cytoplasmic HDAC4 expression was associated
with absence of metastasis. This is in contrast to our findings in ovarian carcinomas,
where the HDAC4c was associated with the presence of metastasis (p=0.001). And also
in contrast to Shen et al.350 findings, that also reported that EOC at stage III/IV had
higher HDAC4 expression when compared to initial stages. It might be relevant to
mention that this HDAC is missing in both cell lines by immunohistochemical
evaluation.
In our series of ovarian carcinomas phosphoHDAC4/5/7 expression was
significantly associated with HGSC in comparison to CCC (p=0.003), corroborating the
previous findings about HDAC4. The biological significant of this phospho-proteins is
not clear in cancer but multiple cell stimuli, including VEGF-induced angiogenesis in
endothelial cells, B cell and T cell activation, and differentiation of myoblasts into
muscle fiber248 are known to induce phosphorylation of highly conserved HDAC4
Ser632, HDAC5 Ser498 and HDAC7 Ser486 residues by CAMK and PKD kinases248.
Among the HDACs family members, HDAC6 is overexpressed in many
cancers351 and has been implicated in cell migration and invasion345,352,353. HDAC6 is a
cytoplasmic resident protein, that deacetylates tubulin and alter microtubule
stability354. Tubulin deacetylation is required for disposal of misfolded proteins in
aggresomes355. During the last decade, HDAC6 has emerged as a master regulator of
the cellular protective response to cytotoxic accumulation of toxic bioproducts351,356.
High levels of HDAC6 expression have been associated with tumorigenesis357,358.

Chapter 2
67
Importantly, there are small molecule inhibitors for HDAC6 currently being tested in
advanced clinical trials for other tumor types (myeloma and lymphoid malignancies)359.
Although high levels of HDAC6 in HGSC (84%) and CCC (87%) were found, no
associations with the histological type of EOC, nor with clinicopathological features
were observed. Nevertheless, it might be interesting to explore the molecular
mechanisms of this therapeutic approach in these tumor types.
Because data from in vitro studies suggest a link between HDACs and cell cycle,
we also aimed to verify the potential association to cell cycle markers in EOC325,360.
HDAC1 and 2 act in concert to promote the G1-to-S progression329. And it has been
observed that HDAC1 deacetylates p53 and modulates its effect on cell growth and
apoptosis, and also mediates repression of p21 by deacetylating histones in the p21
promoter region, resulting in inhibition of p21 gene expression329. The p21 gene is the
primary mediator of p53-induced cell cycle arrest, and cells lacking functional p53
express only low levels of p21.
In our set of cases, by immunohistochemistry we observed that the majority of
HGSC cases express high HDAC1 and p21. These apparently unexpected result can be
explain by other mechanisms of regulation of the expression of p21, independent of
p53, as for example the hyperacetylation of histones 3 and 4327,361. Lagger et al.362
suggest that interactions of p53 and HDACs, likely result in p53 deacetylation, thereby
reducing its transcriptional activity and increasing its ubiquitination and degradation
rate.
Recently, researchers reported that combination of HDACIs and anticancer
agents, including conventional chemotherapeutic drugs, had synergistic effects279. In
addition, HDAC3 has been associated with chemoresistance to etoposide363 and to
paclitaxel in melanoma cells364. Furthermore, it has been reported that HDAC
inhibitors increased the efficacy of chemotherapy and that administering agents in
sequence is important for ovarian cancer treatment311.
The present study corroborates previous findings that showed that elevated
HDACs expression were associated with clinicopathological parameters such as
histopathological stage and presence of metastases, which are considered crucial for

Chapter 2
68
ovarian carcinoma patient’s management and prognosis. These findings provided
evidence for a potential role of HDACs in the biological mechanisms of ovarian
malignant disease. The potential implication of HDACs in ovarian carcinomas, point out
the necessity for further studies in order to clarify the potential role of the molecules
and their possible use in the established therapeutic regimens of this types of
malignancy.
The elevated expression levels of HDAC1, 2 and 6 in ovarian carcinomas may
reinforce the therapeutic utility of HDAC targeting in ovarian cancer, taking into
consideration of HDACIs effect in cell proliferation and apoptosis. In this context, the
cdk inhibitor p21 was shown to be the most commonly induced gene in various ovarian
cancer cell lines by several HDACIs296, because deacetylation of histones represses the
transcription of these tumor suppressor genes.
Our study presents issues of strength and limitations in particular, it might be
underpowered because of it is a small cohort and because it is not yet known if
immunohistochemistry is useful to determine if HDAC protein expression as assessed
by immunohistochemistry is a predictor of treatment response with HDACIs, Clearly,
additional studies are needed to clarify this point. Although high rates of HDAC
expression have been found to be prognostic markers in other tumor entities, in this
cohort no survival value of these markers could be demonstrated but this study is
useful to emphasize the difference between tumor types and the expression profile of
HDACs.
In conclusion, we demonstrated that the class I and II HDACs enzymes are highly
expressed in HGSC and CCC and it is correlated with ovarian histological type. Although
HDAC expression was not correlated with patient survival, the expression patterns of
HDACs could hypothetically be important to predict the response of EOC patients to
epigenetic therapies alone or in combination with conventional chemotherapy.
Moreover, our results support the use of HDACIs as therapeutic agents to treat
ovarian cancer.

69

70
CHAPTER 3
The in vitro effect of epigenetics regulatory drugs, isolated and
combined with conventional chemotherapy, in epithelial
ovarian cancer (EOC)
Manuscript in preparation
Abstract in proceddings:
Silva, F., Serpa, J., Domingues, G., Silva, G., Almeida, A., Félix, A. Cell death
induced by HDACS inhibitors in ovarian cancer cell lines (serous and clear cells
carcinomas) – role of NOTCH, TP53 and FN1. BMC Proceedings 2010, 4(Suppl 2):P36
Silva, F., Serpa, J., Fernandes, S., Dias, S., Félix, A. HDACS inhibitors effects in
Ovarian Clear Cell Carcinoma. SINAL 2012, 6th National Meeting, April, UMinho.
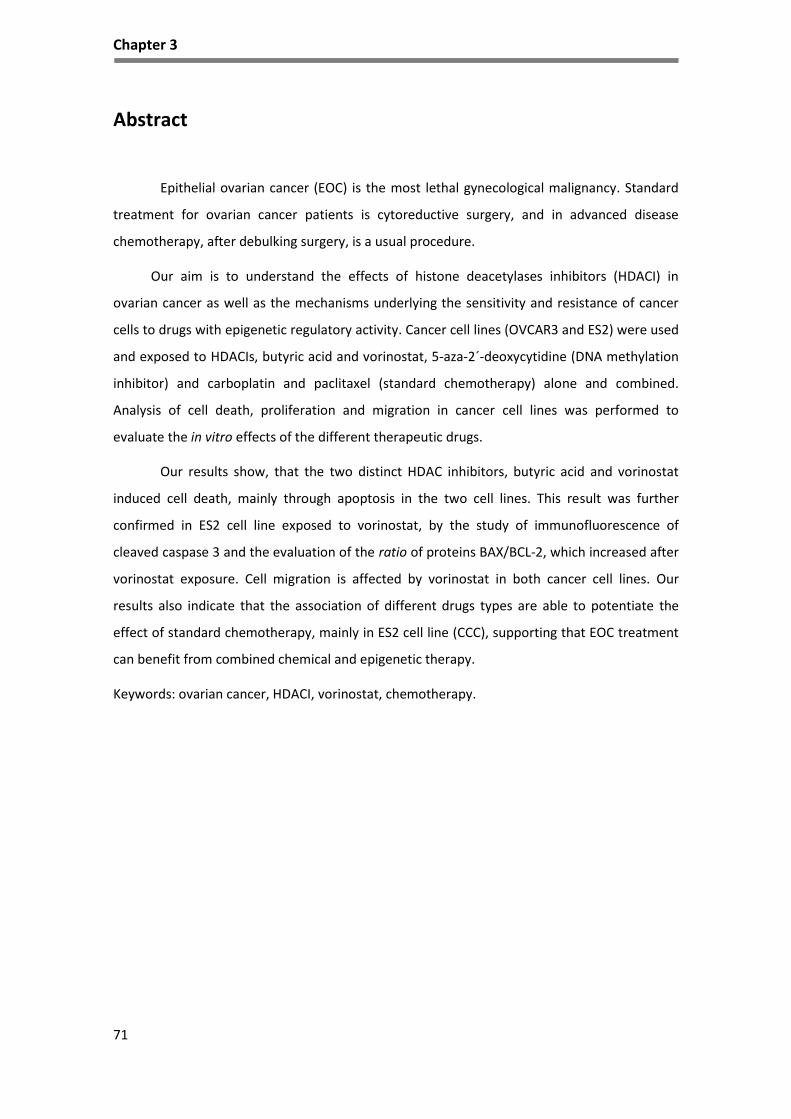
Chapter 3
71
Abstract
Epithelial ovarian cancer (EOC) is the most lethal gynecological malignancy. Standard
treatment for ovarian cancer patients is cytoreductive surgery, and in advanced disease
chemotherapy, after debulking surgery, is a usual procedure.
Our aim is to understand the effects of histone deacetylases inhibitors (HDACI) in
ovarian cancer as well as the mechanisms underlying the sensitivity and resistance of cancer
cells to drugs with epigenetic regulatory activity. Cancer cell lines (OVCAR3 and ES2) were used
and exposed to HDACIs, butyric acid and vorinostat, 5-aza-2´-deoxycytidine (DNA methylation
inhibitor) and carboplatin and paclitaxel (standard chemotherapy) alone and combined.
Analysis of cell death, proliferation and migration in cancer cell lines was performed to
evaluate the in vitro effects of the different therapeutic drugs.
Our results show, that the two distinct HDAC inhibitors, butyric acid and vorinostat
induced cell death, mainly through apoptosis in the two cell lines. This result was further
confirmed in ES2 cell line exposed to vorinostat, by the study of immunofluorescence of
cleaved caspase 3 and the evaluation of the ratio of proteins BAX/BCL-2, which increased after
vorinostat exposure. Cell migration is affected by vorinostat in both cancer cell lines. Our
results also indicate that the association of different drugs types are able to potentiate the
effect of standard chemotherapy, mainly in ES2 cell line (CCC), supporting that EOC treatment
can benefit from combined chemical and epigenetic therapy.
Keywords: ovarian cancer, HDACI, vorinostat, chemotherapy.

Chapter 3
72
Introduction
Epithelial ovarian cancer (EOC) is the most lethal gynecological malignancy3–5.
Nearly 70% of patients present at advanced stage of ovarian cancer and the 5-year
overall survival (OS) rates are around 20%11. The standard treatment for ovarian
cancer patients includes cytoreductive surgery, during which adequate staging
evaluation is performed, by pathological examination of ovarian and other abdominal
tissues to define the nature of the tumor and its stage. In patients diagnosed with early
cancer disease, surgery alone, or with adjuvant chemotherapy is usually sufficient, but
in advanced disease, debulking surgery followed by chemotherapy is mandatory96.
Current therapies for advanced ovarian cancer are limited and not curative and
the search for new therapeutic agents to treat the primary disease and recurrences,
have been disappointing22. New procedures of treatment based upon the knowledge
of the mechanisms of carcinogenesis and new therapeutic targets are needed242.
Recently, two new drugs have been introduced into the clinical practice as examples
for the ‘‘proof-of-concept’’ approach to target cancers: Olaparib and Bevacizumab.
Olaparib, a Poly (ADP-ribose) polymerase (PARP) inhibitor was approved for
patients365 with inherent or acquired defects in DNA and Bevacizumab, a humanized
monoclonal antibody that targets all isoforms of vascular endothelial growth factor
(i.e. VEGF-A, VEGF-B, VEGF-C, VEGF-D, VEGF-E). Unfortunately, although promising
results were expected, till present these two agents are not routinely used as first- or
second-line treatment of EOCs366.
A different approach can be developed targeting epigenetic changes, as they are
crucial for the development and progression of cancer, including in EOC. Significant
progress has been made to understand how various epigenetic changes such as DNA
methylation, histone modification, miRNA expression and other modulators of
chromatin structure, affect gene expression.
Histone acetyltransferases (HAT) and histone deacetylases (HDACs) are
multifunctional enzymes that modify the acetylation status of both histone and
nonhistone proteins, affecting a broad range of cellular processes (e.g., cell cycle,
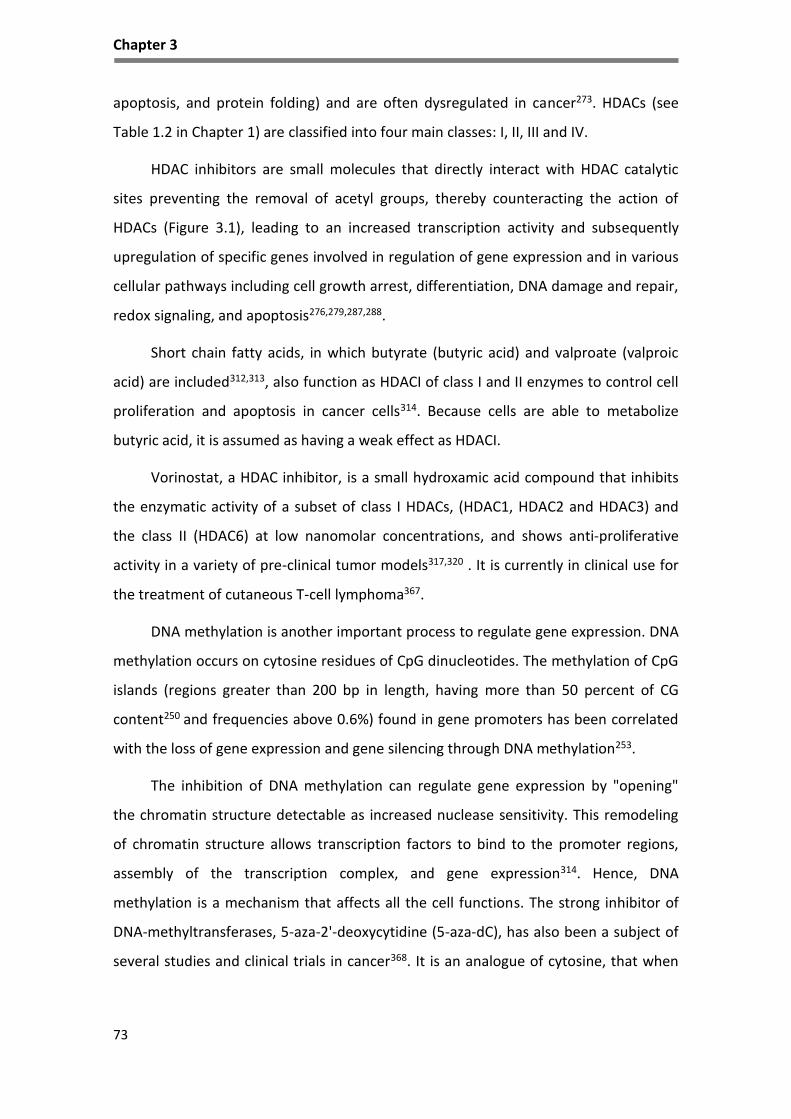
Chapter 3
73
apoptosis, and protein folding) and are often dysregulated in cancer273. HDACs (see
Table 1.2 in Chapter 1) are classified into four main classes: I, II, III and IV.
HDAC inhibitors are small molecules that directly interact with HDAC catalytic
sites preventing the removal of acetyl groups, thereby counteracting the action of
HDACs (Figure 3.1), leading to an increased transcription activity and subsequently
upregulation of specific genes involved in regulation of gene expression and in various
cellular pathways including cell growth arrest, differentiation, DNA damage and repair,
redox signaling, and apoptosis276,279,287,288.
Short chain fatty acids, in which butyrate (butyric acid) and valproate (valproic
acid) are included312,313, also function as HDACI of class I and II enzymes to control cell
proliferation and apoptosis in cancer cells314. Because cells are able to metabolize
butyric acid, it is assumed as having a weak effect as HDACI.
Vorinostat, a HDAC inhibitor, is a small hydroxamic acid compound that inhibits
the enzymatic activity of a subset of class I HDACs, (HDAC1, HDAC2 and HDAC3) and
the class II (HDAC6) at low nanomolar concentrations, and shows anti-proliferative
activity in a variety of pre-clinical tumor models317,320 . It is currently in clinical use for
the treatment of cutaneous T-cell lymphoma367.
DNA methylation is another important process to regulate gene expression. DNA
methylation occurs on cytosine residues of CpG dinucleotides. The methylation of CpG
islands (regions greater than 200 bp in length, having more than 50 percent of CG
content250 and frequencies above 0.6%) found in gene promoters has been correlated
with the loss of gene expression and gene silencing through DNA methylation253.
The inhibition of DNA methylation can regulate gene expression by "opening"
the chromatin structure detectable as increased nuclease sensitivity. This remodeling
of chromatin structure allows transcription factors to bind to the promoter regions,
assembly of the transcription complex, and gene expression314. Hence, DNA
methylation is a mechanism that affects all the cell functions. The strong inhibitor of
DNA-methyltransferases, 5-aza-2'-deoxycytidine (5-aza-dC), has also been a subject of
several studies and clinical trials in cancer368. It is an analogue of cytosine, that when

Chapter 3
74
incorporated into DNA, irreversibly binds the methyltransferase enzymes as they
attempt to methylate the cytosine analogue368.
Figure 3. 1 - Mechanism of action of HDAC inhibitors (HDACI) Acetylation of histone proteins is catalyzed by the action of HATs and is reversed by the action of HDACs. The tight coiling of DNA results from the deacetylation of histones that inhibits the transcription of important tumor suppressor genes (up). With histone deacetylases (HDACs) inhibited, high levels of acetylated histones cause DNA relaxation, allowing tumor suppressor genes to be accessible for transcription (down).
Our aim is to contribute to the study of the effects of HDACI in ovarian cancer
cell lines as well as to disclose the mechanisms underlying the sensitivity and
resistance of cancer cells to drugs with epigenetic regulatory activity. In this study we
performed a set of experiments to evaluate the effect of HDACI and DNA methylation
inhibitor alone or combined with conventional therapeutic agents in ovarian cancer
cell lines.
HATHDAC
AA A
A
Compact chromatin
Transcriptionrepressed
HDACclass of enzymes that remove acetyl groups (O=C-CH3) allowing
the histones to wrap the DNA more tightly.
HATHDAC
HDAC inhibitor
A A
A
A
A
Relaxed chromatin
A
A
AAA
IncreasedTranscription
A
AAAAA
HDACs inhibitors

Chapter 3
75
Material and Methods
Cell lines and cell culture conditions
Clear cell carcinoma (CCC) cell line ES2 (CRL-1978) and high grade serous
carcinoma (HGSC) cell line OVCAR3 (HTB-161) were obtained from American Type
Culture Collection (Manassas, VA, USA). The cells were incubated at 37°C in a
humidified atmosphere containing 5% CO2 in McCoy’s 5A Modified Medium (Sigma-
Aldrich, St. Louis, MO, USA) supplemented with 10% fetal bovine serum (FBS, S 0615,
InvitrogenTM, Thermo Fisher Scientific, Inc., Waltham, MA, USA) and 1% antibiotic-
antimycotic (AA) (InvitrogenTM; Thermo Fisher Scientific, Inc., Waltham, MA, USA). The
cells were cultured to 80-100% confluence prior to detachment by incubation with 1X
0.05% trypsin-EDTA (InvitrogenTM; Thermo Fisher Scientific, Inc.) at room temperature.
For the various assays, cell number was determined using a Bürker counting
chamber. Prior to any experiment, cells were synchronized under starvation (culture
medium without FBS), overnight at 37°C and 5% CO2. Preliminary assays were made to
establish the concentrations of butyric acid, vorinostat and 5-aza-2´-deoxycytidine (5-
aza-dC) based in literature. Cell lines ES2 and OVCAR3 cells were seeded onto 24 plates
at a density of 1x10⁴, cultured with and without butyric acid, vorinostat and 5-aza-dC.
Chemicals and Reagents
Specifications on butyric acid, vorinostat, 5-aza-dC, paclitaxel (PTX) and
carboplatin (CBP) are presented in Table 3.1. Vorinostat was dissolved in DMSO to
produce a 50 mM stock solution and stored at -20°C. Paclitaxel and carboplatin were
dissolved in sodium chloride and stored at room temperature and 4°C, respectively. All
solutions were dilute in complete tissue culture medium immediately prior to use in an
experiment.

Chapter 3
76
Table 3. 1 - Chemicals used in ovarian cancer cell lines
Flow Cytometry analysis of cell death
Cells were collected, followed by centrifugation at 1200 rpm for 2 min, at
designated times (0, 6, 18, 30 and 72h). The cell pellet was incubated with 1 µl annexin
V- fluorescein isothiocyanate (FITC BD-Pharmigen) and 1 µl propidium iodide (PI) (50
µg/mL, Sigma-Aldrich, St. Louis, MO, USA) in 100 µl annexin V binding buffer 1X (10
mM HEPES (pH 7.4), 0.14M sodium chloride (NaCl), 2.5 mM calcium chloride (CaCl2) at
room temperature and in the dark for 15 min. After incubation, samples were rinsed
with 0.1% (w/v) BSA (A9647, Sigma) in PBS 1X and centrifuged again at 1200 rpm for 2
min. Cells were suspended in 200 µl of annexin V binding buffer 1X.
Acquisition was performed in a FACScalibur flow cytometer (Becton Dickinson). A
total of 10,000 cells per sample were acquired and data were analyzed with FlowJo
software (http://www.flowjo.com/).
Immunofluorescence
Cells were cultured on glass slides with a 0.2% gelatin coating, until 80% of
confluence and then fixed in 2% paraformaldehyde for 15 minutes at 4⁰C. Blocking was
performed with 0.1% (w/v) BSA in PBS 1X for 1 h at room temperature, and incubated
with rabbit polyclonal anti-cleaved caspase 3 (catalog no. 9661S, Asp175, Cell
Signaling) antibody, overnight at 4°C (diluted in 0.1% (w/v) BSA in PBS 1X, 1:100). Cells
were incubated with secondary antibody for 2 h, at room temperature. Secondary
Chemicals Catalog no Supplier Dilution
Butyric acid B10 350-0 Sigma-Aldrich 1mM
Vorinostat CAS 149647-78-9Cayman Chemical, Ann
Arbor, MI, USA5μM
5-Aza-2´-
deoxycytidine A3656 Sigma-Aldrich 5μM
Paclitaxel Paclitaxel Kabi 6mg/ml, L
AD0049Fresenius Kabi Pharma 10μg/ml
CarboplatinCarboplatin Hikma
10mg/ml, L 21LD0033Hikma Pharmaceuticals 10μg/ml
Chapter 3
77
antibody used was Alexa Fluor®488 anti-rabbit (A-11008, Invitrogen). The slides were
mounted in VECTASHIELD media with DAPI (4'-6-diamidino-2-phenylindole) (H-1200,
Vector Labs) and examined by standard fluorescence microscopy using an Axio
Imager.Z1 microscope (Zeiss). Images were acquired with AxioVision software and
processed with ImageJ software (imagej.nih.gov/ij/version 1.44p).
Cell growth curves
Cells were seeded at a cell density of 1x10⁴ cells / well in a 12-well plate. Cell
counting was determined by microscopy using the trypan blue exclusion method in a
Bürker counting chamber at regular time intervals (0, 6, 18 and 30h). Each time point
counting was performed in triplicate and growth curves were plotted. Prior to the
experiment, cells were synchronized under starvation (culture medium without FBS)
for eight hours at 37 °C and 5% CO2.
Wound-healing assay
For wound-healing assay, cell lines were previously treated with 5µg/mL of
Mitomycin-C (Sigma) an anti-proliferative agent, for 3 hours at 37°C 5% CO2. A pipette
tip was used to scratch a single wound in cells monolayer. Vorinostat (5μM) was added
to medium and the plate was incubated at 5% CO2 at 37°C. PBS 1X was used to
washout the cell debris three times. The wound closure was monitored by
photography when the scrape wound was introduced (0h) and at designated times
after wounding (6, 18 and 30h).
Western blotting
Total protein extracts were obtained after cell lysis in Radio-Immunoprecipitation
Assay (RIPA) lysis buffer (20mM/L Tris (pH 7.5), 150 mM/L NaCl, 5 mM/L KCl and 1%
Triton X-100) previously supplemented with protease and phosphatase inhibitors to
the cell pellet (Complete, Mini, EDTA-free Protease Inhibitor Cocktail Tablet (catalog
no. 11836170001, Roche), 1 mM Orthovanadate (Na3VO4) (450243, Sigma) and 1 mM
Sodium fluoride (NaF) (catalog no. 201154, Sigma). Whole protein lysates were
quantified using standard Bradford protein assay, subsequently 100 µg protein

Chapter 3
78
samples were then separated by electrophoresis in a 15% sodium dodecyl sulfate
polyacrylamide gel (SDS-PAGE) and transferred to PVDF membranes (Bio-Rad).
For protein immunodetection, membranes were incubated with the specific
primary antibodies: rabbit polyclonal anti-BCL2 (1:1000, catalog no. SAB4300340,
Sigma-Aldrich); rabbit polyclonal anti-BAX (1:100; catalog no.HPA027878, Sigma-
Aldrich) and mouse anti-β-actin (1:5000; catalog no., A5441, Sigma), overnight at 4°C,
followed by incubation with peroxidase (HRP)-conjugated secondary antibodies (anti-
mouse; catalog no. 31430, Thermo Scientific and anti-rabbit; catalog no. 31460,
Thermo Scientific).
The peroxidase activity was detected by ECL method. Digital images were
obtained in ChemiDoc XRS System (Bio-Rad) with Image Lab Software
(imagej.nih.gov/ij/). Protein detection was quantified by digital analyses of the protein
bands intensity that were normalized to β-actin, using ImageJ Software
(http://rsbweb.nih.gov/ij/).
Reverse transcription-quantitative polymerase chain reaction (qPCR)
Total RNA was isolated from cells cultured with HDACI (butyric acid and
vorinostat) or without HDACI (control condition), using RNeasy Mini Extraction Kit
(catalog no., 74104, Qiagen, Inc., Valencia, CA, USA), according to manufacturer’s
protocol. cDNA synthesis was performed with 1 µg of total RNA, using random
hexamers (catalog no. 11034731001; Roche Diagnostics, Indianapolis, IN, USA) and
SuperScript IITM (200 U; catalog no. 18064-014, InvitrogenTM, Thermo Fisher Scientific,
Inc.), according to the manufacturer’s protocol. The PCR amplifications conditions
were as follows: 95°C for 2 min, 95°C for 10 min followed by 45 cycles of 95°C for 15
seconds, 60°C for 60 seconds. qPCR was performed using an ABI PRISM 7900HT
Sequence Detection System (Applied Biosystems®; Thermo Fisher Scientific, Inc.) with
Power SYBR Green PCR Master Mix (catalog no. 4367659, Applied Biosystems®,
Thermo Fisher Scientific, Inc).
The primers sequences used were as follows: BECLIN-1
GGCTGAGAGACTGGATCAGG (forward), CTTCAGCTTATCCAGCTGCG (reverse), ATG-7
CGTCATTGCTGCAAGCAAGAG (forward), GATGAGCCCAGGAGGTCAG (reverse), BAD
Chapter 3
79
AGGGAGGGCTGACCCAGAT (forward), GGCGGAAAACCCAAAACTTC (reverse), BCL-2
ATGTGTGTGGAGAGCGTCAACC (forward), TGAGCAGAGTCTTCAGAGACAGCC (reverse).
Data were analyzed in SDS 2.4.1 software (Applied Biosystems; Thermo Fisher
Scientific, Inc.) and the relative expression of each gene was quantified
by relative quantification (RQ) study module (∆∆Ct)369 using hypoxanthine
phosphorribosyltransferase gene (HPRT) as an endogenous reference gene.
Statistical analysis
Statistical analysis was performed using Student’s t-test with GraphPad Prism
software (GraphPad Software, Inc., La Jolla, CA, USA, version 5.03). P<0.05 was
considered to indicate a statistically significant difference.
Results
Vorinostat induces cell death in ES2 and OVCAR3 cells, mainly through apoptosis
ES2 cells exposed to HDACI and 5-aza-dC, revealed increased levels of apoptosis
at different timepoints in comparison to control condition (untreated cells) (Figure
3.2A). Butyric acid increased apoptosis in ES2 cells but in combination with 5-aza-dC
apoptotic levels decreased (except for 18h). In contrast, vorinostat and 5-aza-dC
showed a cumulative effect at 6, 30 and 72h of exposure and this was not observed for
butyric acid and 5-aza-dC association.
Regarding necrosis, ES2 cells exposed to vorinostat showed increased levels in all
conditions comparing to control at 30 and 72h of exposure (Figure 3.2B). A cumulative
effect with the combination of HDACIs and 5-aza-dC was observed for butyric acid at
18, 30 and 72h, whereas for vorinostat it was observed only at 30h of exposure.
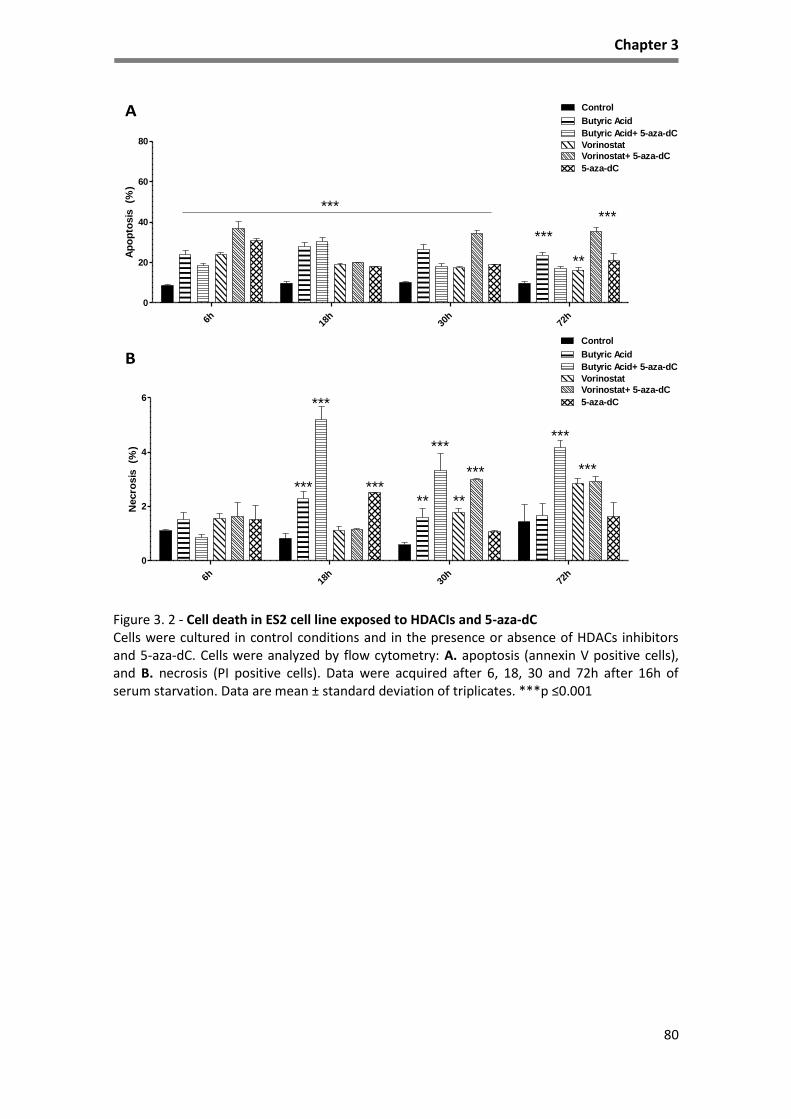
Chapter 3
80
Figure 3. 2 - Cell death in ES2 cell line exposed to HDACIs and 5-aza-dC Cells were cultured in control conditions and in the presence or absence of HDACs inhibitors and 5-aza-dC. Cells were analyzed by flow cytometry: A. apoptosis (annexin V positive cells), and B. necrosis (PI positive cells). Data were acquired after 6, 18, 30 and 72h after 16h of serum starvation. Data are mean ± standard deviation of triplicates. ***p ≤0.001
A
B
6h 18h
30h
72h
0
20
40
60
80
Control
Butyric Acid
Butyric Acid+ 5-aza-dC
Vorinostat
Vorinostat+ 5-aza-dC
******
***
**
5-aza-dC
Ap
op
tosis
(%
)
6h 18h
30h
72h
0
2
4
6
Control
Butyric Acid
Butyric Acid+ 5-aza-dC
Vorinostat
Vorinostat+ 5-aza-dC
***
***
**
5-aza-dC
***
******
**
******
Necro
sis
(%
)

Chapter 3
81
Figure 3. 3 - Cell death in OVCAR3 cell line exposed to HDACIs and 5-aza-dC Cells were cultured in control conditions and in the presence or absence of HDACs inhibitors and 5-aza-dC. Cells were analyzed by flow cytometry: A. apoptosis (annexin V positive cells), and B. necrosis (PI positive cells). Data were acquired after 6, 18, 30 and 72h, after 16h of serum starvation. Data are mean ± standard deviation of triplicates. ***p ≤0.001
Regarding, the effects of HDACIs and 5-aza-dC in OVCAR3 cells, at different
timepoints, we observed that only cells exposed to vorinostat alone and in
combination with 5-aza-dC showed a high percentage of apoptosis at 30h when
compared to control (Figure 3.3A). At 6h, apoptosis levels were decreased when
compared to control cells but it was significant only upon the exposure to vorinostat
and 5-aza-dC. The following timepoints also indicate a decrease of apoptosis when
cells were exposed to 5-aza-dC at 18h, and at 30h and 72h. A decrease in apoptosis
was also verified when cells were exposed to butyric acid and 5-aza-dC.
A
B
6h 18h
30h
72h
0
20
40
60
80
Control
Butyric Acid
Butyric Acid+ 5-aza-dC
Vorinostat
Vorinostat+ 5-aza-dC
*** 5-aza-dC
*******
**
Ap
op
tosis
(%
)
6h 18h
30h
72h
0.0
0.5
1.0
1.5
2.0
3
4
5
6
Control
Butyric Acid
Butyric Acid+ 5-aza-dC
Vorinostat
Vorinostat+ 5-aza-dC
5-aza-dC
Necro
sis
(%
)
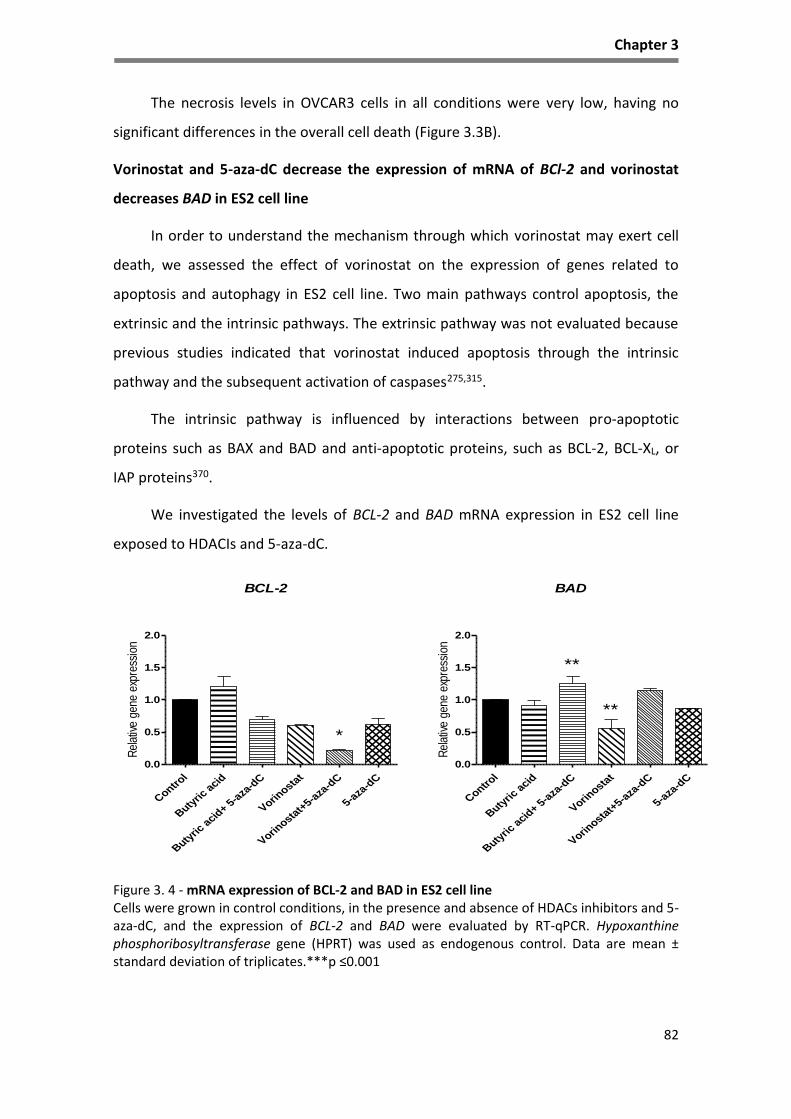
Chapter 3
82
The necrosis levels in OVCAR3 cells in all conditions were very low, having no
significant differences in the overall cell death (Figure 3.3B).
Vorinostat and 5-aza-dC decrease the expression of mRNA of BCl-2 and vorinostat
decreases BAD in ES2 cell line
In order to understand the mechanism through which vorinostat may exert cell
death, we assessed the effect of vorinostat on the expression of genes related to
apoptosis and autophagy in ES2 cell line. Two main pathways control apoptosis, the
extrinsic and the intrinsic pathways. The extrinsic pathway was not evaluated because
previous studies indicated that vorinostat induced apoptosis through the intrinsic
pathway and the subsequent activation of caspases275,315.
The intrinsic pathway is influenced by interactions between pro-apoptotic
proteins such as BAX and BAD and anti-apoptotic proteins, such as BCL-2, BCL-XL, or
IAP proteins370.
We investigated the levels of BCL-2 and BAD mRNA expression in ES2 cell line
exposed to HDACIs and 5-aza-dC.
Figure 3. 4 - mRNA expression of BCL-2 and BAD in ES2 cell line Cells were grown in control conditions, in the presence and absence of HDACs inhibitors and 5-aza-dC, and the expression of BCL-2 and BAD were evaluated by RT-qPCR. Hypoxanthine phosphoribosyltransferase gene (HPRT) was used as endogenous control. Data are mean ± standard deviation of triplicates.***p ≤0.001
Control
Butyric
acid
Butyric
acid
+ 5-a
za-d
C
Vorinosta
t
Vorinosta
t+5-a
za-d
C
5-aza
-dC
0.0
0.5
1.0
1.5
2.0
*
BCL-2
Rel
ativ
e ge
ne e
xpre
ssio
n
Control
Butyric
acid
Butyric
acid
+ 5-a
za-d
C
Vorinosta
t
Vorinosta
t+5-a
za-d
C
5-aza
-dC
0.0
0.5
1.0
1.5
2.0
**
BAD
**
Rel
ativ
e ge
ne e
xpre
ssio
n
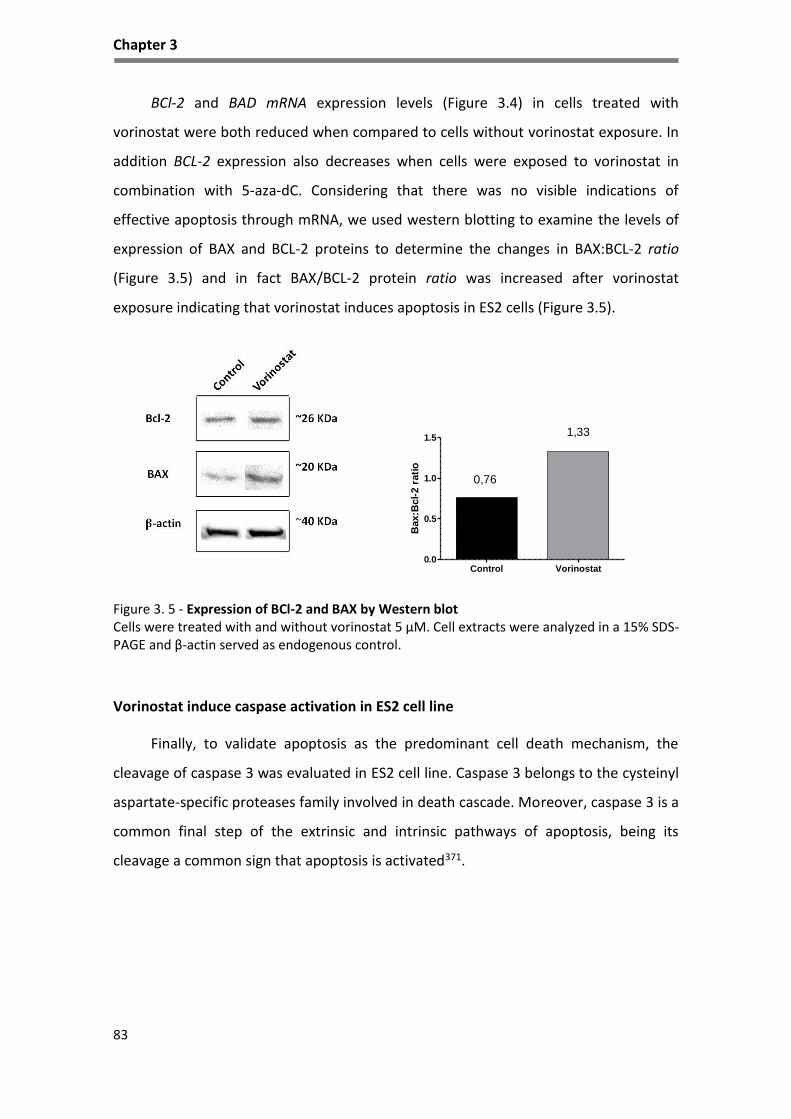
Chapter 3
83
BCl-2 and BAD mRNA expression levels (Figure 3.4) in cells treated with
vorinostat were both reduced when compared to cells without vorinostat exposure. In
addition BCL-2 expression also decreases when cells were exposed to vorinostat in
combination with 5-aza-dC. Considering that there was no visible indications of
effective apoptosis through mRNA, we used western blotting to examine the levels of
expression of BAX and BCL-2 proteins to determine the changes in BAX:BCL-2 ratio
(Figure 3.5) and in fact BAX/BCL-2 protein ratio was increased after vorinostat
exposure indicating that vorinostat induces apoptosis in ES2 cells (Figure 3.5).
Control Vorinostat
0.0
0.5
1.0
1.5
0,76
1,33
Bax:B
cl-
2 r
ati
o
Figure 3. 5 - Expression of BCl-2 and BAX by Western blot Cells were treated with and without vorinostat 5 μM. Cell extracts were analyzed in a 15% SDS-PAGE and β-actin served as endogenous control.
Vorinostat induce caspase activation in ES2 cell line
Finally, to validate apoptosis as the predominant cell death mechanism, the
cleavage of caspase 3 was evaluated in ES2 cell line. Caspase 3 belongs to the cysteinyl
aspartate-specific proteases family involved in death cascade. Moreover, caspase 3 is a
common final step of the extrinsic and intrinsic pathways of apoptosis, being its
cleavage a common sign that apoptosis is activated371.

Chapter 3
84
Figure 3. 6 - Expression of cleaved caspase 3 by immunofluorescence in EOC cell lines Representative staining for cleaved caspase 3 (green) in ovarian cancer cells, grown in control conditions and in the presence of HDACs inhibitors exposure. The nuclei are stained with DAPI (blue).
Caspase 3 activation, evaluated by immunofluorescence staining for cleaved
caspase 3, was induced by both HDACs inhibitors, being vorinostat more effective than
butyric acid in caspase 3 cleavage when compared to control (Figure 3.6). Also,
vorinostat induced higher expression of cleaved caspase 3 in ES2 cell line when
compared to OVCAR3 cell line. This evaluation confirms that apoptosis occurs in
ovarian cancer upon exposure to HDACI (butyric acid and vorinostat).
Vorinostat increases the expression of autophagy genes in ES2 cell line
Because autophagy besides being a survival mechanism, can promote cell death
due to its extensive duration; the expression of autophagy genes BECLIN-1 and ATG-7
was evaluated in cells treated with HDACI.
Control Butyric Acid Vorinostat
ES2
OVCAR3

Chapter 3
85
Figure 3. 7 - mRNA expression of BECLIN-1 and ATG-7 in ES2 cell line Cells were grown in control conditions, in the presence and absence of HDACIs and 5-aza-dC and the expression of ATG7 and BECLIN-1 were evaluated by RT-qPCR. Hypoxanthine phosphoribosyltransferase gene (HPRT) was used as endogenous control. Data are mean ± standard deviation of triplicates.***p ≤0.001
As shown in Figure 3.7, vorinostat induces the expression of BECLIN-1, required
for the initiation of autophagy and ATG-7, which is necessary for the formation of
autophagosomes. These transcripts are both upregulated in ES2 cells treated with
vorinostat when compared with untreated cells (control). BECLIN-1 expression is
downregulated with butyric acid and there is no difference in these markers in cells
treated with 5-aza-dC during the whole duration of treatment.
Effects of vorinostat and chemotherapy in ovarian cancer cell lines
Combined therapy with platinum agents (carboplatin or cisplatin) and taxane
(paclitaxel) are used as standard postoperative chemotherapy for the majority of
EOC372. Recently, some therapeutic approaches and clinical trials proposed the use of
epigenetic regulatory drugs with standard chemotherapy373,374. So, we also studied the
combinatory effects of vorinostat, 5-Aza-dC and conventional chemotherapy
(carboplatin-CBP and paclitaxel-PTX) in EOC cells lines.
Control
Butyric
acid
Butyric
acid
+5-aza
-dC
Vorinosta
t
Vorinosta
t+5-a
za-d
C
5-aza
-dC
0.0
0.5
1.0
1.5
2.0
***
*
ATG-7
Rel
ativ
e ge
ne e
xpre
ssio
n
Control
Butyric
acid
Butyric
acid
+ 5-a
za-d
C
Vorinosta
t
Vorinosta
t+5-a
za-d
C
5-aza
-dC
0.0
0.5
1.0
1.5
2.0
**
BECLIN-1
**
**
Rel
ativ
e ge
ne e
xpre
ssio
n
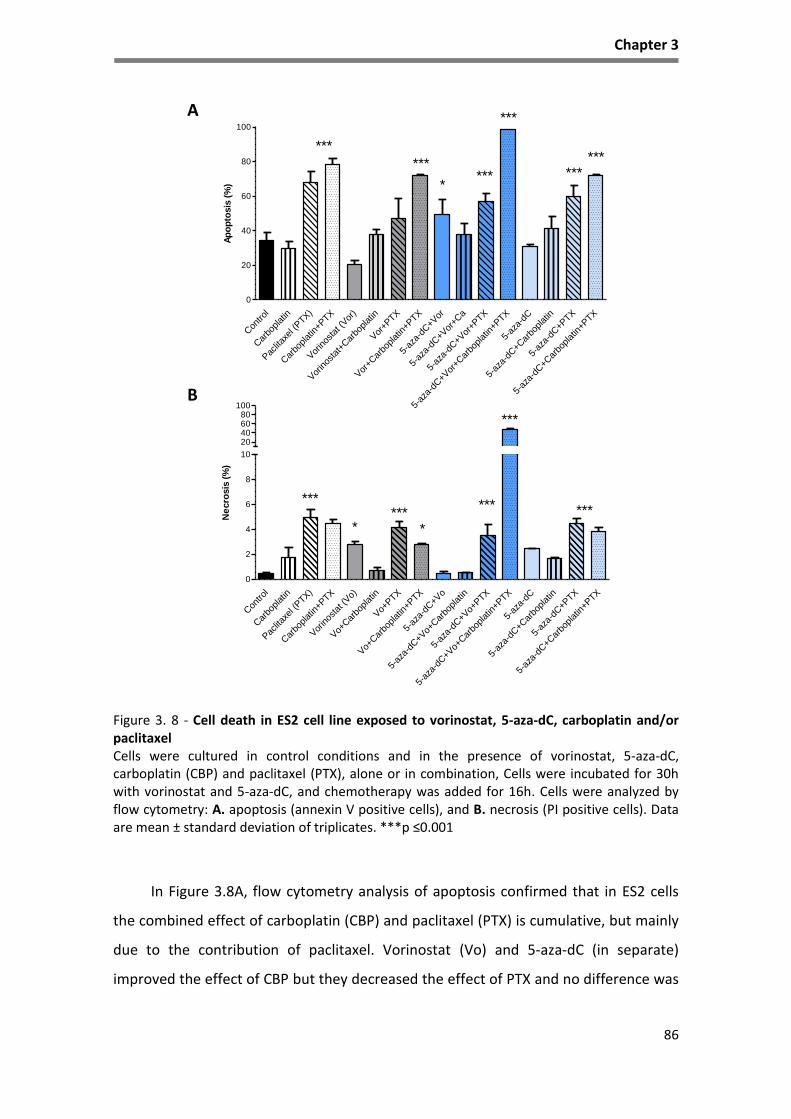
Chapter 3
86
Figure 3. 8 - Cell death in ES2 cell line exposed to vorinostat, 5-aza-dC, carboplatin and/or paclitaxel Cells were cultured in control conditions and in the presence of vorinostat, 5-aza-dC, carboplatin (CBP) and paclitaxel (PTX), alone or in combination, Cells were incubated for 30h with vorinostat and 5-aza-dC, and chemotherapy was added for 16h. Cells were analyzed by flow cytometry: A. apoptosis (annexin V positive cells), and B. necrosis (PI positive cells). Data are mean ± standard deviation of triplicates. ***p ≤0.001
In Figure 3.8A, flow cytometry analysis of apoptosis confirmed that in ES2 cells
the combined effect of carboplatin (CBP) and paclitaxel (PTX) is cumulative, but mainly
due to the contribution of paclitaxel. Vorinostat (Vo) and 5-aza-dC (in separate)
improved the effect of CBP but they decreased the effect of PTX and no difference was
A
B
Con
trol
Car
boplat
in
Pac
litax
el (P
TX)
Car
boplat
in+PTX
Vor
inos
tat (
Vor
)
Vor
inos
tat+
Car
boplat
in
Vor
+PTX
Vor
+Car
boplat
in+P
TX
5-az
a-dC
+Vor
5-az
a-dC
+Vor
+Ca
5-az
a-dC
+Vor
+PTX
5-az
a-dC
+Vor
+Car
boplat
in+P
TX
5-az
a-dC
5-az
a-dC
+Car
boplat
in
5-az
a-dC
+PTX
5-az
a-dC
+Car
boplat
in+P
TX
0
20
40
60
80
100
***
***
******
*
******
Ap
op
tosis
(%
)
Con
trol
Car
boplat
in
Pac
litax
el (P
TX)
Car
boplat
in+PTX
Vor
inos
tat (
Vo)
Vo+
Car
boplat
in
Vo+
PTX
Vo+
Car
boplat
in+P
TX
5-az
a-dC
+Vo
5-az
a-dC
+Vo+
Car
boplat
in
5-az
a-dC
+Vo+
PTX
5-az
a-dC
+Vo+
Car
boplat
in+P
TX
5-az
a-dC
5-az
a-dC
+Car
boplat
in
5-az
a-dC
+PTX
5-az
a-dC
+Car
boplat
in+P
TX
0
2
4
6
8
10
20406080
100
***
*** ******
**
***
Ne
cro
sis
(%
)
A
BB
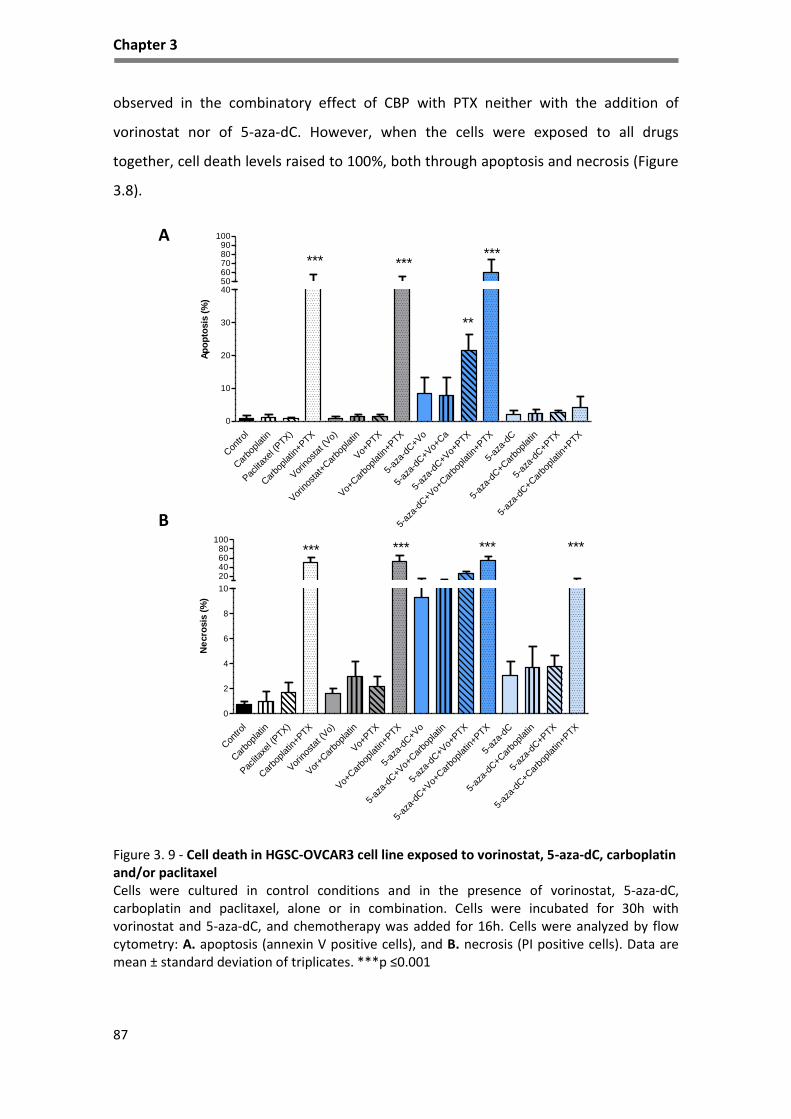
Chapter 3
87
observed in the combinatory effect of CBP with PTX neither with the addition of
vorinostat nor of 5-aza-dC. However, when the cells were exposed to all drugs
together, cell death levels raised to 100%, both through apoptosis and necrosis (Figure
3.8).
Figure 3. 9 - Cell death in HGSC-OVCAR3 cell line exposed to vorinostat, 5-aza-dC, carboplatin and/or paclitaxel Cells were cultured in control conditions and in the presence of vorinostat, 5-aza-dC, carboplatin and paclitaxel, alone or in combination. Cells were incubated for 30h with vorinostat and 5-aza-dC, and chemotherapy was added for 16h. Cells were analyzed by flow cytometry: A. apoptosis (annexin V positive cells), and B. necrosis (PI positive cells). Data are mean ± standard deviation of triplicates. ***p ≤0.001
A
B
Con
trol
Car
boplat
in
Pac
litax
el (P
TX)
Car
boplat
in+PTX
Vor
inos
tat (
Vo)
Vor
inos
tat+
Car
boplat
in
Vo+
PTX
Vo+
Car
boplat
in+P
TX
5-az
a-dC
+Vo
5-az
a-dC
+Vo+
Ca
5-az
a-dC
+Vo+
PTX
5-az
a-dC
+Vo+
Car
boplat
in+P
TX
5-az
a-dC
5-az
a-dC
+Car
boplat
in
5-az
a-dC
+PTX
5-az
a-dC
+Car
boplat
in+P
TX
0
10
20
30
405060708090
100
****** ***
**
Ap
op
tosis
(%
)
Con
trol
Car
boplat
in
Pac
litax
el (P
TX)
Car
boplat
in+PTX
Vor
inos
tat (
Vo)
Vor
+Car
boplat
in
Vo+
PTX
Vo+
Car
boplat
in+P
TX
5-az
a-dC
+Vo
5-az
a-dC
+Vo+
Car
boplat
in
5-az
a-dC
+Vo+
PTX
5-az
a-dC
+Vo+
Car
boplat
in+P
TX
5-az
a-dC
5-az
a-dC
+Car
boplat
in
5-az
a-dC
+PTX
5-az
a-dC
+Car
boplat
in+P
TX
0
2
4
6
8
10
20406080
100****** *** ***
Ne
cro
sis
(%
)

Chapter 3
88
In Figure 3.9A, flow cytometry analysis of apoptosis and necrosis of OVCAR3 cells
showed that the higher levels of cell death was associated with the combination of 5-
aza-dC together with vorinostat when combined with the chemotherapeutic drugs
alone or in combination, increased significantly the levels of apoptosis and necrosis
(Figure 3.9B). Whereas 5-aza-dC without vorinostat did not alter the levels of apoptosis
alone or in combination with CBP and/or PTX, so it seems that 5-aza-dC also
potentiates the action of vorinostat.
HDACIs inhibit cell proliferation in ES2 (CCC) cell line
To investigate the effect of HDACs inhibitors and 5-aza-dC in cell proliferation,
curves were done aiming to evaluate in vitro proliferation of the cells in the presence
and absence of HDACIs and 5-aza-dC. Trypan blue exclusion assay was conducted to
measure cell proliferation at 0, 6, 18 and 30 hours after seeding (Figure 3.10A and B).
Figure 3. 10 - Cell proliferation curve for ES2 and OVCAR3 cells exposed to HDACIs and 5-aza-dC Cells were grown in control conditions and in the presence and absence of HDACIs with and without 5-aza-dC. A. ES2 cell line and B. OVCAR3 cell line. Data were acquired at 0, 6, 18 and 30 hours after 16h of serum starvation and are mean ± standard deviation of three cell counts.
As shown in Figure 3.10A, the proliferation curve for ES2 cells treated with HDACI
showed a decrease of proliferation rate; mainly in those cells under the exposure to
vorinostat. In ES2 cells, the exposure to butyric acid, alone or in combination with 5-
aza-dC showed high proliferation, similar to the proliferation rate when cells are
exposed only to 5-aza-dC. However, when cells are exposed to vorinostat a decreased
0
10
20
30
40
50
60
70
80
Ø 6h 18h 30h
Ce
lls (
x10
4 /m
L)
Time (hours)
A
0
10
20
30
40
50
60
70
80
Ø 6h 18h 30h
Control
Butyric Acid
Butyric Acid+5-aza-dC
Vorinostat 5μM
Vorinostat+5-aza-dC
5-aza-dC
Time (hours)
B
B

Chapter 3
89
of proliferation is verified even when there is a combined exposure with 5-aza-dC.
Indeed, in this particular cell line, we verified that cells exposed in combined HDACI
and 5-aza-dC have higher proliferation rate than when cells are exposed only to one.
In Figure 3.10B, the proliferation curve for OVCAR3 cells showed no differences
in proliferation rate in all conditions. However, cells exposed to 5-aza-dC exhibit a
tendency (but not significant) to proliferate more in comparison to control condition.
Vorinostat affects migration capacity mainly OVCAR3 cells
To test the effect of vorinostat on cell migration, wound healing assay was
performed.
Figure 3. 11 - Wound healing assay in ES2 cells and OVCAR3 cells exposed to vorinostat. Mitomycin-C treated cells were grown in control conditions, with or without vorinostat. Wounds were made on monolayers of cells grown to 100% confluence. Effect of vorinostat on wound healing assays in A. ES2 cells and in B. OVCAR cells. Wound closure was photographed when the scratch wound was introduced (t=0 hours) and after 6h, 18h and 30h. Results presented here are representative of triplicate independent samples. Phase microscopy (original magnification: 200x).
0h 6h 18h 30h
Co
ntr
ol
Vo
rin
ost
at
A
0h 6h 18h 30h
Co
ntr
ol
Vo
rin
ost
at
B

Chapter 3
90
As shown in Figure 3.11A, the wound healing assay showed that vorinostat
inhibits cell migration in ES2 cell line after 6h. Despite the wound is almost completely
closed at 30h in control and in vorinostat exposed cells, the cell density in control
conditions is higher. Concerning OVCAR3 cell line (Figure 3.11B), the wound healing
assay showed that vorinostat inhibits cell migration as seen at 18 and 30h after
wounding.
Discussion
In clinical setting for the last 30 years, few improvements were done regarding
treatment of ovarian cancer, being surgery and adjuvant chemotherapy the standard
care in ovarian cancer patients. Many clinical trials have been testing different drugs
and combined therapeutic schemes in advanced or recurrent disease, however, none
of them proved to be better than the association of carboplatin and paclitaxel to
increase overall survival and disease free survival375. Meanwhile, new therapeutic
approaches, such as anti-VEGF and anti-PARP strategies376,377 for treatment of ovarian
cancer where found to be very useful in some clinical contexts.
As HDACs are overexpressed in cancer and represent a group of enzymes
responsible for modifications of histones, conditioning epigenetic regulation, thus their
action has been targeted in preclinical, clinical trials322,378 and clinical settings334,379,380.
HDACIs, appeared has promising drugs in the last decade as anticancer agents332. They
are known to restore the expression of silenced tumor suppressor genes in cancer cells
through their ability to block histone deacetylation.
HDACI have multiple actions in cells related to their ability of modulating gene
expression, such as inducing programmed cell death in cancer cells through not very
well understood mechanisms381. Other responses to these agents in cancer include cell
cycle arrest, cell differentiation, autophagy and apoptosis, whereas normal cells are
less affected318. HDACIs are currently in clinical use in the treatment of cutaneous T-
cell lymphoma alone and in combination with other anticancer therapies382. In vitro
vorinostat anti-tumor activity has been reported in several hematological and solid
malignancies, including leukemia, mantle cell lymphoma, hepatocellular carcinoma,

Chapter 3
91
pancreatic carcinoma, breast cancer, prostate cancer, colon cancer and ovarian
cancer335,372,383,384.
Our results allow us to confirm previous results in ovarian cancer cell lines
regarding HDACIs335,360. We found that two distinct HDACIs, butyric acid and
vorinostat, are able to induce cell death in ovarian cancer cell lines. Cell death is mainly
through apoptosis, upon HDACIs exposure335,360 as it was confirmed in our study in ES2
cell line, by the immunodetection of cleaved caspase 3 and the protein BAX/BCL-2
ratio, which increased after vorinostat exposure as Takai et al.360 described. The same
effect was reported in hematological malignancies320.
Moreover, in ES2 cell line, we also study autophagy genes (BECLIN-1 and ATG-7)
and observed that the levels of these genes were increased with exposure to
vorinostat. The results are in agreement with recent studies, that have demonstrated
that tumor resistance to anticancer therapies can be overlapped through upregulation
of autophagy in different tumor cell lines385.
The potential role of autophagy in the therapeutic response to anticancer agents
has been controversial, as opposing results were obtained from different cancer cell
lines, suggesting that autophagy may function as a stress response, helping to promote
cell survival or demonstrating that increased autophagy leads to apoptosis385.
According to Wirawan et al.371 in hematological cell lines, vorinostat induces
autophagy that can change from a pro-apoptotic signal to a pro-survival function
through acquired resistance. Autophagy is characterized by massive degradation of
cellular contents, including essential organelles such as mitochondria, by means of
complicated intracellular membrane/vesicle reorganization and lysosomal activity371.
It has been purpose that autophagy allows the cell to survive in unfavorable
conditions. It have been suggested, for example, that removal of apoptotic effectors
(caspase 8), in the presence of which autophagy does not occur386, by degradation of
aggregated proteins and damage organelles, restores metabolic homeostasis by
recycling metabolites and prevents ROS accumulation387. In fact, the increased levels
of autophagy effectors observed with exposure to vorinostat in ES2 cancer cell line
may function in this cell line as a mechanism of survival, because apoptosis and

Chapter 3
92
autophagy regulators BECLIN-1 e ATG-7 are increased by vorinostat ( Figure 3.2 and
3.7).
Concerning cell proliferation, our results indicate that exposure to HDACIs have
different outcomes regarding the two cell lines. ES2 cell line showed a decrease of the
proliferation rate mainly in cells exposed to vorinostat, but this effect was not
observed in HGSC cell line (OVCAR3). Regarding the response to other drugs and their
association (figure 3.10), we also obtained different results in these cell lines, being the
most relevant the increased proliferation rate of ES2 cell line, when exposed to 5-aza
dC or to the combination of HDACIs and 5-aza-dC. This results allow us to postulate
that hypomethylation seems to be an important inducer of cell proliferation in this cell
line, not rescued by HDACIs.
The cell line OVCAR3 behaves differently after the exposure to HDACIs and 5-aza-
dC. The proliferation rate is similar in all conditions indicating that these cells are not
affected by those agents. However, previous studies report that ovarian cancer cell
lines treated with methylation inhibitor, as decitabine, produced synergistic inhibition
of cell proliferation by apoptosis and cell cycle arrest388.
Cell migration can be seen as a marker of cancer cells aggressive phenotype,
since the ability of a cancer cell to invade the surrounding tissues and spread is
determinant for disease progression and metastasis389,390. Our study on cell migration
under HDACIs influence, demonstrated that vorinostat can diminished cell migration
confirming previous reports335 using other ovarian cancer cell lines. It is important to
mention that this effect was not evident in ES2 cell line as it was in OVCAR3. This
underline another difference on vorinostat effect between these two cell lines. We are
convinced that proliferation might not influence the results of wound healing assay
because cells were previously exposed to mitomycin C, an inhibitor of proliferation.
Previous studies have evaluated the action of vorinostat in ovarian cancer cell
lines, and they have found that vorinostat suppress proliferation, migration and
invasion in ovarian cancer cells, including cisplatin-resistant or highly-invasive ovarian
cancer cells, by promoting histone acetylation335. Sonnemann et al.391 also report that
vorinostat activated caspase-3 in a concentration-dependent fashion in ovarian cancer

Chapter 3
93
cell lines and in patient-derived ovarian cancer cells. However, no previous report
showed differences between different histological types of ovarian cancer. We would
like to emphasize that our results may be relevant and highlight the need of studying
different cell lines to fully understand the modulating effects of this type of drug and
its use may not be applied to all histological types of ovarian cancer.
Nevertheless, it is very important to remind that our results demonstrate that
drugs commonly used in chemotherapy (carboplatin and paclitaxel) are still the most
effective treatment to induce cell death, at least when applied in combination
(carboplatin plus paclitaxel).
Finally, the most interesting results is however the demonstration, in vitro, that
vorinostat and 5-aza-dC are able to potentiate the effect of these chemotherapeutic
drugs, since the acquisition of therapy resistance is an important clinical problem130.
Importantly, this effect of the drug association was more evident in ES2 cell line,
supporting that CCC treatment can benefit from combined cytostatic, cytotoxic and
epigenetic therapy. This particular histological type is recognized as being intrinsically
resistant to platinum salt-based therapies and new therapeutic approaches are
urgently need72,392.
Our results are in agreement with other studies72,393. showing that ES2 cells are
resistant to carboplatin induced cell death72. Resistance mechanisms that limit the
extent of DNA damage associated with chemotherapy include decreased intracellular
drug accumulation, increased drug inactivation, and increased DNA damage repair100.
Increased glutathione (GSH) levels, a ROS scavenger are also a mechanism of
resistance72, since GSH reacts with carboplatin avoiding its contact with cell proteins
and DNA and consequently decreasing carboplatin cytotoxic ability. According to
Lopes-Coelho et al.72, ES2 cells expressed more GSH, which synthesis is regulated by
HNF1β, the key gene in CCC, and the abrogation of GSH synthesis increases ES2
sensitivity to carboplatin. Once carboplatin by itself does not induce cell death in ES2
cell line. This supports the use of epigenetic regulation in the treatment of this
histological type.

Chapter 3
94
Regarding OVCAR3 cells, we were able to document the benefit over the
combination of carboplatin plus paclitaxel only if we submitted the cells in a tetra-
combination, joining carboplatin plus paclitaxel with vorinostat plus 5-aza-dC. Our
results are in agreement to other studies that have reported that a combination of 5-
aza-dC or paclitaxel with vorinostat inhibited ovarian cancer growth while inducing
apoptosis, cell cycle arrest and autophagy394,395.
HDACI potentiate platinum effect in cancer cells, possibly mediated by
increasing platinum adduct formation, facilitated by the open of DNA configuration,
induced by HDAC inhibition396,397 as well as by acetylation of other proteins such as
transcription factors and tumor suppressor proteins. The synergy between HDACI,
platinum agents and paclitaxel was also visible in HGSC cell lines, as reported in other
studies311,391. But this effect was not observed in ES2 cells as previously discuss and it is
another evidence of the heterogeneous nature of ovarian carcinomas.
Hence, ovarian cancer usually responds to chemotherapy but, in the majority of
cases the cancer recurs resulting in the death of eventually half of patients77 as a
consequence of the development of drug resistance99. To date, there are no reliable
clinical factors that can properly stratify patients for suitable chemotherapy strategies.
Upon cancer relapse, the only currently available treatment option is further
chemotherapy.
So, in vitro, the conjunction between conventional chemotherapy and epigenetic
modulators can be a more effective therapeutic approach in EOC, and recent clinical
studies report that combination of chemotherapeutic agents with vorinostat activity in
relapsed platinum-sensitive ovarian cancer is more effective. We emphasize in our
study the difference between cell lines of different histological types. It is important
that studies consider that ovarian cancer is a heterogeneous entity and diverse
histological types can respond differently to proposed therapies. Studies focusing on
the histological type of ovarian cancer have never been made in previous approaches,
which is a real limitation since each histological type constitute a molecular and clinical
entity.

95
96
CHAPTER 4
HNF1β acetylation a possible path for Vorinostat impairment of
ovarian clear cell carcinoma (CCC)
Manuscript in preparation

Chapter 4
97
Abstract
Ovarian clear cell carcinoma (CCC) is an unique clinical, histopathological and molecular
entity within ovarian cancer, having HNF1β as a pivotal pro-survival gene. Moreover, the extra-
ovarian stage at the time of diagnosis and the resistance to conventional therapy accounts for
the very poor prognosis of CCC.
Studies supporting the role of histone deacetylases (HDACs) in cancer progression,
pointed out the use of HDAC inhibitors (HDACIs) as a promising therapeutic strategy.
The present study aimed to evaluate the effect of the HDACI vorinostat at the functional
and at the molecular level in CCC cells.
Our results showed that vorinostat induced increased levels of HNF1β and at the same
time cell cycle arrest and apoptosis in ES2 cells. This effect on HNF1β is associated with
elevation on the acetylation load of HNF1β.
This study confirms that epigenetic modulation affects not only the conformation of
chromatin and gene expression, but also it may alter the function and the turnover of proteins
other than histones.
Keywords: clear cell carcinoma (CCC), vorinostat, HNF1β.
Chapter 4
98
Introduction
Clinical, histopathological and genetic features prove that ovarian clear cell
carcinoma (CCC) is a distinct entity within epithelial ovarian cancer (EOC)398,399. In most
cases, CCC is associated with ovarian endometriosis72,399. Hepatocyte nuclear factor 1β
(HNF1β) overexpression is a biological mark of CCC400,401 and its considered to be
responsible for cell survival, proliferation and chemoresistance72,402. As no mutations in
HNF1β gene have been described to date in CCC, its overexpression in this tumor is
thought to be probably under epigenetic control72,399. Resistance to standard
treatment based in platinum salts and taxanes accounts for the very poor prognoses of
advanced and recurrent CCC398. Hence, the discovery of therapeutic alternatives urges,
target histone deacetylases (HDACs) seem to be a suitable and effective approach to
treat cancer.
HDACs are often overexpressed in cancer and they induce chromatin
compression and consequently gene silencing. Furthermore, their action is pointed out
to be responsible for the silencing of tumor suppressor genes along cancer
development403–406, and the use of HDAC inhibitors (HDACIs) raised as new effective
drugs. Previous studies show that HDACI action on the re-expression of certain
silenced genes can result in cellular changes, including cell cycle arrest407, DNA repair
and damage assessment408, and apoptosis407,409–411. This effect was mainly due to the
restored expression of certain tumor suppressor genes supporting its use in cancer
therapy. However, in most types of cancer the results of HDACIs application and trials
fell short of expectations. Furthermore, most of the molecular mechanisms underlying
the HDACIs failure remain not completely understood.
In the present paper we intended to depict how vorinostat, an HDACI, interferes
with HNF1β expression and cellular behavior in CCC and its potential use in this tumor
type. In order to achieve this, we evaluated the effect of vorinostat in two cancer cell
lines representing ovarian serous carcinoma (HGSC), the most prevalent type of
ovarian cancer, and CCC.
Chapter 4
99
Material and Methods
Cell lines and cell culture
Cell lines from CCC, ES2 ovarian clear cell carcinoma (CRL-1978, ATCC) and HGSC,
OVCAR3 ovarian serous carcinoma (HTB-161, ATCC) were obtained from American
Type Culture Collection (ATCC). Cells were cultured in Dulbecco's modified Eagle's
medium (DMEM) 1X (41965-039, Invitrogen) containing 4.5 g/L of D-glucose and 0.58
g/L of L-glutamine. Medium was supplemented with 10% Fetal Bovine Serum (FBS)
(FBS, S 0615, Invitrogen, Thermo Fisher Scientific, Inc.) and 1% antibiotic-antimycotic
(AA) (InvitrogenTM; Thermo Fisher Scientific, Inc.) at 37°C in a humidified atmosphere
containing 5% CO2 environment. Cells were grown to 75 - 100% optical confluence
before they were detached by incubation with 1X 0.05% trypsin-EDTA (25300-054,
InvitrogenTM; Thermo Fisher Scientific, Inc.) at room temperature, and splited. The cell
number was determined using a Bürker counting chamber. Prior to any experiment,
cells were synchronized under starvation (FBS free culture medium), overnight at 37°C
and 5% CO2.
Cells were cultured with and without vorinostat at 5μM (suberoylanilide
hydroxamic acid, Merck). For long time exposure, ES2 and OVCAR3 were stepwise
exposed to vorinostat, first during 30 days, then vorinostat was removed for 20 days,
which allows cells to proliferate again, and finally the cells were again exposed to
vorinostat for more 20 days.
Flow cytometry analysis of total cell death (apoptosis and necrosis)
Cells were detached with trypsin, washed twice with cold PBS, and double
stained with Annexin V- fluorescein isothiocyanate (FITC) (556420, BD-Pharmigen) and
propidium iodide (PI) (P4864, Sigma-Aldrich) in Annexin-binding buffer, followed by
analysis on FACSCalibur flow cytometer (Becton-Dickinson). All experiments were
performed in triplicates. Data were analyzed using FlowJo software
(http://www.flowjo.com/).

Chapter 4
100
Flow cytometry analysis of cell cycle
Cells were collected, washed twice with cold PBS and fixed in 70% ethanol
(100983, Merck) at 4°C. Cells were centrifuged at 1500 rpm for 5 min and then stained
with 100 µl of 50 µg/ml of propidium iodide (PI) and incubated at 37°C for 40 min.
Analysis was performed immediately after staining using FACSCalibur flow cytometer
(Becton-Dickinson). All experiments were performed in triplicates. Data were analyzed
using FlowJo software (http://www.flowjo.com/).
Reverse transcription-quantitative polymerase chain reaction (qPCR)
Ribonucleic acid (RNA) from ES2 and OVCAR3 was extracted using RNeasy Mini
Extraction kit (74104, Qiagen, Inc.) according to the manufacturer’s protocol. RNA
concentration was determined by measuring the absorbance at 260 nm in a Nanodrop
2000 (Thermo Scientific). Reverse transcription polymerase chain reaction (RT-PCR)
was performed with 1μg RNA and reversely-transcribed by SuperScript II Reverse
Transcriptase (18080-44, 200 U; InvitrogenTM, Thermo Fisher Scientific, Inc.), according
to the manufacturer’s protocol, in a T3000 thermocycler (Biometra). The PCR
amplifications conditions were as follows: 95°C for 2 min, 95°C for 10 min followed by
45 cycles of 95°C for 15 seconds, 60°C for 60 seconds. qPCR was performed using an
ABI PRISM 7900HT Sequence Detection System (Applied Biosystems®; Thermo Fisher
Scientific, Inc.) with Power SYBR Green PCR Master Mix (4367659, Applied
Biosystems®, Thermo Fisher Scientific, Inc).
The primers sequences used were as follows: HNF1β CCGACAATTCAACCAGACAG
(forward), CAGAGCAGGCATCATCGGAC (reverse), p21 GAGACTCTCAGGGTCGAAAACG
(forward), ATTAGGGCTTCCTCTTGGAGAAG (reverse). Data were analyzed in SDS 2.4.1
software (Applied Biosystems; Thermo Fisher Scientific, Inc.) and the relative
expression of each gene was quantified by relative quantification (RQ) study
module (∆∆Ct)369 using hypoxanthine phosphoribosyltransferase gene (HPRT) as an
endogenous reference gene.

Chapter 4
101
Automated Sanger sequencing analysis
Mutational analysis of TP53 was detected by polymerase chain reaction (PCR) for
exon 7, followed by automated sequencing. PCR amplification was performed using
specific primers (Forward: CCTCATCTTGGGCCTGTGTTA, Reverse: TGGAAGAAATCGGTA
AGAGGTG) and DNA fragments with expected size were purified using Exonuclease I
(20 U/µL) (EN0582, ThermoFisher)/FastAP Thermo-sensitive Alkaline Phosphatase (1
U/µL) (EF0651, ThermoFisher), according to the manufacturer’s protocol. Sequencing
reactions were performed using BigDye® Terminator v3.1 Cycle Sequencing kit,
(catalog no. 4337456, Applied Biosystems) in a T3000 thermocycler (Biometra).
Purification was executed with AutoSeq G-50 dye terminator removal kit (catalog no.
27-5340-02, GE Healthcare Life Sciences) according to manufacturer´s instruction and
then evaluated in an ABI Prism™ 310 Genetic Analyzer (Applied Biosystems).
Western blotting
Total protein extracts were obtained after cell lysis in Radio-Immunoprecipitation
Assay (RIPA) lysis buffer (20mM/L Tris (pH 7.5), 150 mM/L NaCl, 5 mM/L KCl and 1%
Triton X-100) previously supplemented with protease and phosphatase inhibitors to
the cell pellet (Complete, Mini, EDTA-free Protease Inhibitor Cocktail Tablet (catalog
no. 11836170001, Roche), 1 mM Orthovanadate (Na3VO4) (450243, Sigma) and 1 mM
Sodium fluoride (NaF) (catalog no. 201154, Sigma). Whole protein lysates were
quantified using standard Bradford protein assay, subsequently 100 µg protein
samples were then separated by electrophoresis in a 15% sodium dodecyl sulfate
polyacrylamide gel (SDS-
For protein immunodetection, membranes were incubated with the specific
primary antibodies: mouse monoclonal anti-p21 (1:1000; catalog no. 701151, Life
technologies); mouse monoclonal anti-p53 (1:1000; catalog no. 453M-9, Sigma
Aldrich); rabbit polyclonal anti-HNF1β (1:500; catalog no. HPA002083, Sigma-Aldrich);
rabbit polyclonal anti-BCL-2 (1:1000; catalog no. SAB4300340, Sigma-Aldrich); rabbit
polyclonal anti-BAX (1:100; catalog no. HPA027878, Sigma-Aldrich); rabbit polyclonal
anti-acetyl-lysine (1:500; catalog no. AB3879, Millipore) and mouse monoclonal anti-β-
actin (1:5000; catalog no., A5441, Sigma-Aldrich) and incubated overnight at 4°C,

Chapter 4
102
followed by incubation with peroxidase (HRP)-conjugated secondary antibodies (anti-
mouse; catalog no. 31430, Thermo Scientific and anti-rabbit; catalog no. 31460,
Thermo Scientific).
The peroxidase activity was detected by ECL method. Digital images were
obtained in ChemiDoc XRS System (Bio-Rad) with Image Lab Software
(imagej.nih.gov/ij/). Protein detection was quantified by digital analyses of the protein
bands intensity that were normalized to β-actin, and acetylation of HNF1β was
quantified using total levels of HNF1β, by using ImageJ Software
(http://rsbweb.nih.gov/ij/).
Immunoprecipitation
To obtained total protein extracts cells pellets were lysed using phosphate buffer
(0.1M, pH 7) with 1% Triton X-100 (catalog no. T8787, Sigma) and protease and
phosphatase inhibitors (Complete, Mini, EDTA-free Protease Inhibitor Cocktail Tablet
(catalog no. 11836170001, Roche), 1 mM Orthovanadate (Na3VO4) (catalog no.
450243, Sigma) and 1 mM Sodium fluoride (NaF) (catalog no. 201154, Sigma)) followed
by sonication (2 cycles of 10sec, 50% amplitude). Lysed cell pellets were incubated
with anti-HNF1β (HPA002083, Sigma-Aldrich), overnight (ON) at 4°C followed by
another incubation ON at 4°C with protein G-sapharose (51347800-EM, GE
Healthcare). Samples (total protein extracts, anti-HNF1β and protein G-Sapharose)
were then centrifuged and the pellet obtained ressuspended in glycine (0.1M) to
obtain purified HNF1β and other proteins bound to HNF1β. HNF1β protein
immunodetection were performed using western blotting (described above).
Immunofluorescence
Cells were cultured on glass slides coated with a 0.2% gelatin coating, until 80%
of confluence and then fixed in 2% paraformaldehyde for 15 minutes at 4⁰C. Blocking
was performed with 0.2% (w/v) BSA in PBS 1X for 1 h at room temperature, and
incubated with primary antibody overnight (diluted 1:100 in 0.2% (w/v) BSA in PBS 1X).
The primary antibody was anti-HNF1β (HPA002083, Sigma-Aldrich). After PBS 1x
washing, samples were incubated with secondary antibody (Alexa Fluor® 488 anti-
rabbit, Invitrogen) for 2 h, at room temperature. The slides were mounted in

Chapter 4
103
VECTASHIELD media with DAPI (4'-6-diamidino-2-phenylindole) (Vector Labs) and
examined by standard fluorescence microscopy using a Nikon Instruments Eclipse Ti-S
Inverted Microscope (Hamamatsu digital camera C10600 ORCA-R2). Images were
acquired and processed with NIS-Elements AR-3.2.
Statistical analysis
Data were analyzed using unpaired two-tailed student’s test and one-way/two-
way ANOVA with GraphPad Prim statistical software (San Diego, USA). A value of
p<0.05 was considered statistically significant.
Results
Vorinostat effect in cancer cell proliferation, cell cycle status of EOC
The evaluation of the effect exerted by vorinostat on the proliferation rate and
cell cycle status showed that ES2 cells proliferate at a lower rate in the presence of
vorinostat which is consistent with the G0-G1 cell cycle arrest observed after 30h of
exposure to vorinostat (Figure 4.1A and B). OVCAR3 cells showed no alterations in
growth curve and in cell cycle status due to vorinostat exposure (Figure 4.1A and B).
Accordingly, the expression of p21, which is a cyclin dependent kinase (CDK) inhibitor
and a canonical HDACI gene target412,413 is increased in ES2 cells exposed to vorinostat
(Figure 4.1C).
Upon a long term exposure to vorinostat, ES2 cells exhibit again a G0/G1 cell
cycle arrest, which is reversed by the removal of vorinostat (Figure 4.2A). The levels of
p21 mRNA were in agreement with the observed dynamics of cell cycle activity (Figure
4.2B). In contrast, the OVCAR3 cells have no significant changes in cell cycle status
after the long term vorinostat exposure as we observed in the 30h exposure (Figure
4.2A and 4.1B).

Chapter 4
104
Figure 4. 1 - Vorinostat affects cell proliferation of clear cell carcinoma (ES2) but not of serous carcinoma (OVCAR3) A. Vorinostat exposure induces a significant decrease in cell proliferation, in ES2 cell line; B. ES2 cells exposed to vorinostat show cell cycle arrest in G1-G0, at 30h, and C. In ES2 vorinostat also increases the levels of p21 in ES2 but not in OVCAR3.
ES2 OVCAR3
Contr
ol 6h
Vo 6
h
Contr
ol 18h
Vo 1
8h
Contr
ol 30h
Vo 3
0h
0
50
100G1-G0
S
G2-M
Pe
rce
nta
ge
of
ce
lls
(%
)
Cont
rol 6
h
Vo 6
h
Cont
rol 1
8h
Vo 1
8h
Cont
rol 3
0h
Vo 3
0h
0
50
100G1-G0
S
G2-MP
erc
en
tag
e o
f c
ell
s (
%)
B
ES2 OVCAR3
Con
trol
6h
Vo
6h
Con
trol
18h
Vo
18h
Con
trol
30h
Vo
30h
0
50
100G1-G0
S
G2-MP
erc
en
tag
e o
f c
ell
s (
%)
Con
trol
6h
Vo
6h
Con
trol
18h
Vo
18h
Con
trol
30h
Vo
30h
0
50
100G1-G0
S
G2-M
Pe
rc
en
tag
e o
f c
ell
s (
%)
Con
trol
6h
Vo
6h
Con
trol
18h
Vo
18h
Con
trol
30h
Vo
30h
0
50
100G1-G0
S
G2-M
Pe
rc
en
tag
e o
f c
ell
s (
%)
A
-actin
p21
Control Vorinostat
ES2 OVCAR3
Control Vorinostat
C
Ø 6 h 18 h 30 h
0
20
40
60
80 Control
Vo
Cells (
x10
4/m
L)
Ø 6 h 18 h 30 h
0
20
40
60
80Control
Vorinostat
Cells (
x10
4/m
L)
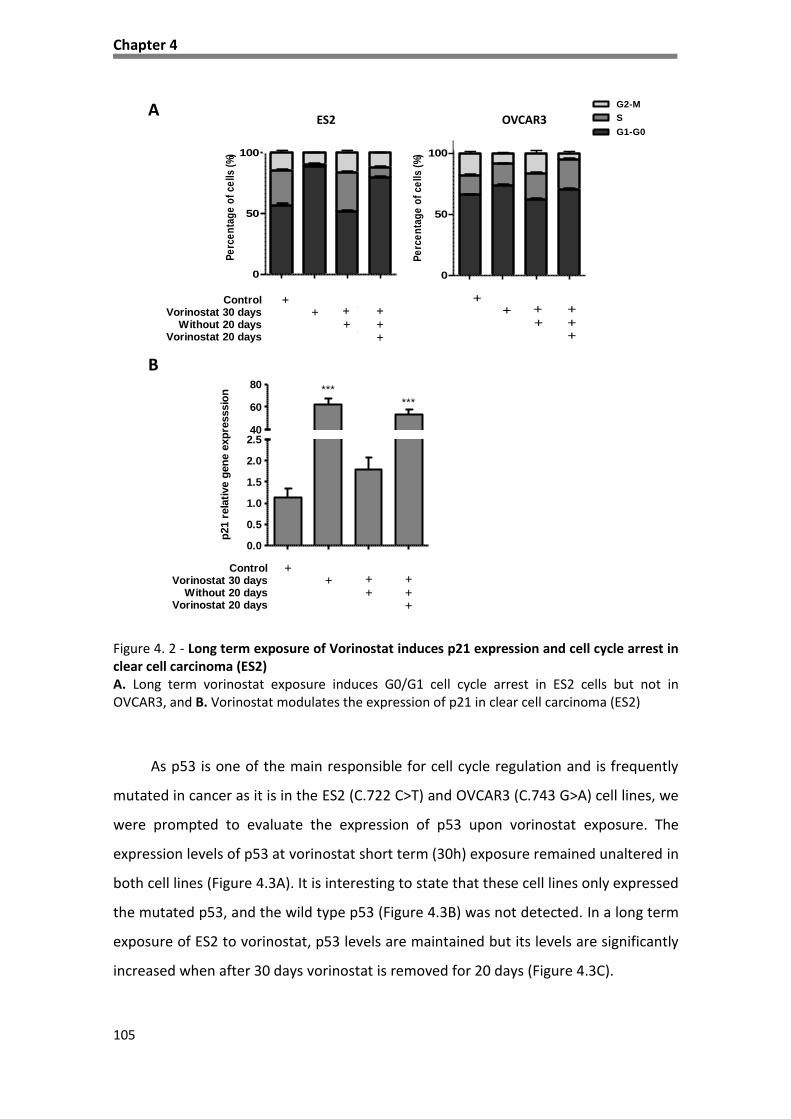
Chapter 4
105
Figure 4. 2 - Long term exposure of Vorinostat induces p21 expression and cell cycle arrest in clear cell carcinoma (ES2) A. Long term vorinostat exposure induces G0/G1 cell cycle arrest in ES2 cells but not in OVCAR3, and B. Vorinostat modulates the expression of p21 in clear cell carcinoma (ES2)
As p53 is one of the main responsible for cell cycle regulation and is frequently
mutated in cancer as it is in the ES2 (C.722 C>T) and OVCAR3 (C.743 G>A) cell lines, we
were prompted to evaluate the expression of p53 upon vorinostat exposure. The
expression levels of p53 at vorinostat short term (30h) exposure remained unaltered in
both cell lines (Figure 4.3A). It is interesting to state that these cell lines only expressed
the mutated p53, and the wild type p53 (Figure 4.3B) was not detected. In a long term
exposure of ES2 to vorinostat, p53 levels are maintained but its levels are significantly
increased when after 30 days vorinostat is removed for 20 days (Figure 4.3C).
0.0
0.5
1.0
1.5
2.0
2.540
60
80 ***
***
ControlVorinostat 30 days
Without 20 daysVorinostat 20 days
++
++
+++
p21
rela
tive
gene
exp
ress
sion
0.0
0.5
1.0
1.5
2.0
2.540
60
80 ***
***
ControlVorinostat 30 days
Without 20 daysVorinostat 20 days
++
++
+++
p21 r
ela
tive g
en
e e
xp
resssio
n
A
B
0.0
0.5
1.0
1.5
2.0
2.540
60
80 ***
***
ControlVorinostat 30 days
Without 20 daysVorinostat 20 days
++
++
+++
p21 r
ela
tive g
en
e e
xp
resssio
n
0
50
100G1-G0
S
G2-M
Pe
rce
nta
ge
of
ce
lls
(%
)
0
50
100G1-G0
S
G2-M
Pe
rce
nta
ge
of
ce
lls
(%
)
ES2 OVCAR3
Contr
ol 6h
Vo 6h
Contr
ol 18h
Vo 18h
Contr
ol 30h
Vo 30h
0
50
100G1-G0
S
G2-M
Pe
rce
nta
ge
of
ce
lls
(%
)
Contr
ol 6h
Vo 6h
Contr
ol 18h
Vo 18h
Contr
ol 30h
Vo 30h
0
50
100G1-G0
S
G2-M
Pe
rce
nta
ge
of
ce
lls
(%
)
Contr
ol 6h
Vo 6h
Contr
ol 18h
Vo 18h
Contr
ol 30h
Vo 30h
0
50
100G1-G0
S
G2-M
Pe
rce
nta
ge
of
ce
lls
(%
)
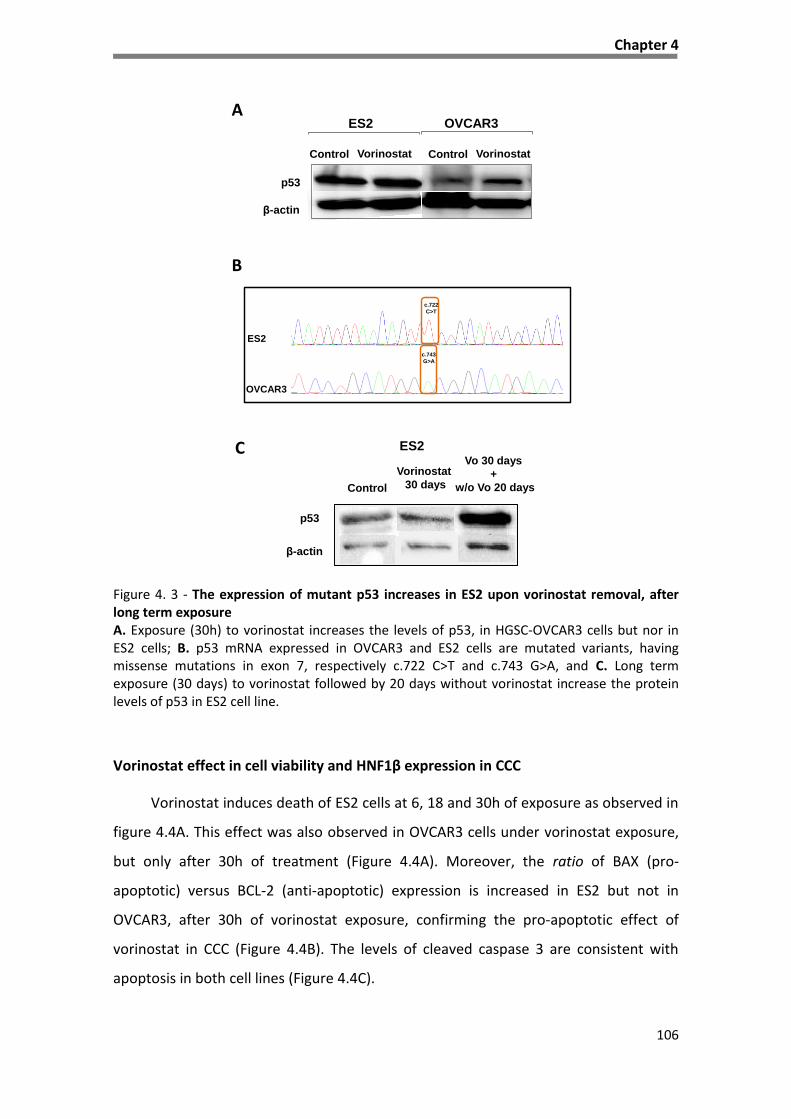
Chapter 4
106
Figure 4. 3 - The expression of mutant p53 increases in ES2 upon vorinostat removal, after long term exposure A. Exposure (30h) to vorinostat increases the levels of p53, in HGSC-OVCAR3 cells but nor in ES2 cells; B. p53 mRNA expressed in OVCAR3 and ES2 cells are mutated variants, having missense mutations in exon 7, respectively c.722 C>T and c.743 G>A, and C. Long term exposure (30 days) to vorinostat followed by 20 days without vorinostat increase the protein levels of p53 in ES2 cell line.
Vorinostat effect in cell viability and HNF1β expression in CCC
Vorinostat induces death of ES2 cells at 6, 18 and 30h of exposure as observed in
figure 4.4A. This effect was also observed in OVCAR3 cells under vorinostat exposure,
but only after 30h of treatment (Figure 4.4A). Moreover, the ratio of BAX (pro-
apoptotic) versus BCL-2 (anti-apoptotic) expression is increased in ES2 but not in
OVCAR3, after 30h of vorinostat exposure, confirming the pro-apoptotic effect of
vorinostat in CCC (Figure 4.4B). The levels of cleaved caspase 3 are consistent with
apoptosis in both cell lines (Figure 4.4C).
Control Vorinostat Control Vorinostat
p53
β-actin
ES2 OVCAR3A
p53
β-actin
Control
Vorinostat
30 days
Vo 30 days
+
w/o Vo 20 days
C
B
ES2
OVCAR3
c.743
G>A
c.722
C>T
ES2
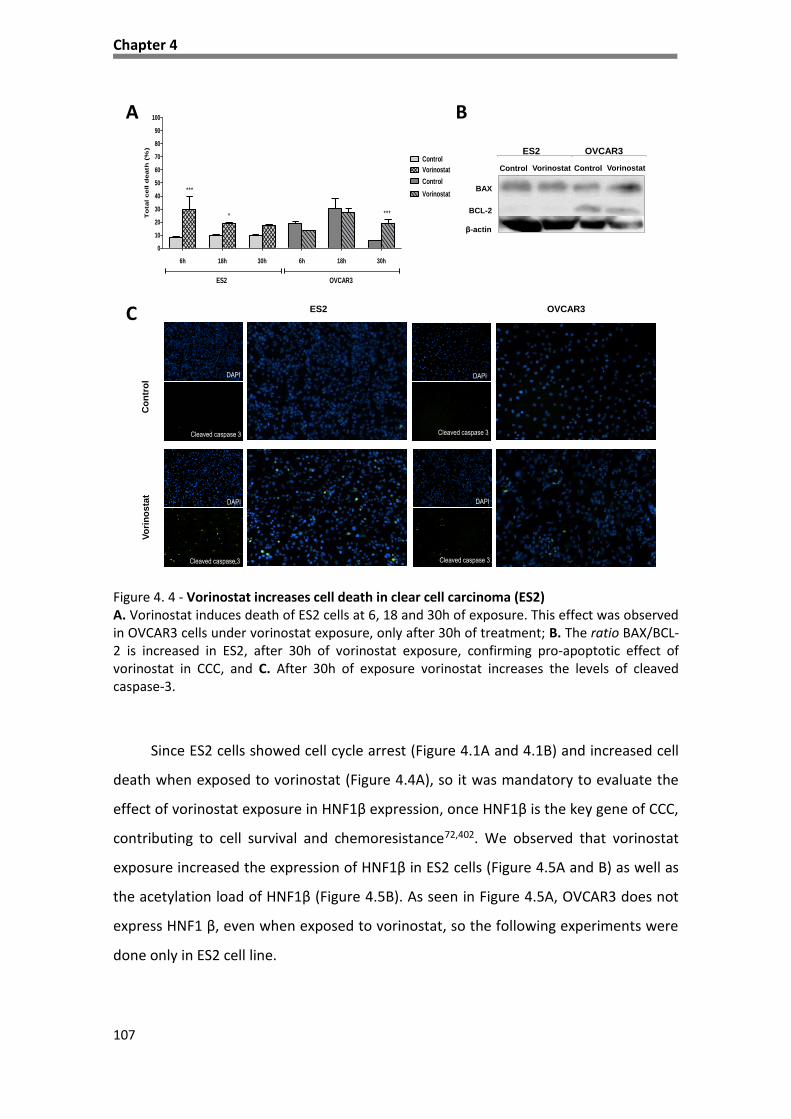
Chapter 4
107
Figure 4. 4 - Vorinostat increases cell death in clear cell carcinoma (ES2) A. Vorinostat induces death of ES2 cells at 6, 18 and 30h of exposure. This effect was observed in OVCAR3 cells under vorinostat exposure, only after 30h of treatment; B. The ratio BAX/BCL-2 is increased in ES2, after 30h of vorinostat exposure, confirming pro-apoptotic effect of vorinostat in CCC, and C. After 30h of exposure vorinostat increases the levels of cleaved caspase-3.
Since ES2 cells showed cell cycle arrest (Figure 4.1A and 4.1B) and increased cell
death when exposed to vorinostat (Figure 4.4A), so it was mandatory to evaluate the
effect of vorinostat exposure in HNF1β expression, once HNF1β is the key gene of CCC,
contributing to cell survival and chemoresistance72,402. We observed that vorinostat
exposure increased the expression of HNF1β in ES2 cells (Figure 4.5A and B) as well as
the acetylation load of HNF1β (Figure 4.5B). As seen in Figure 4.5A, OVCAR3 does not
express HNF1 β, even when exposed to vorinostat, so the following experiments were
done only in ES2 cell line.
A B
6h 18h 30h 6h 18h 30h
0
10
20
30
40
50
60
70
80
90
100
Control
Vorinostat
Control
Vorinostat
ES2 OVCAR3
***
* ***To
tal cell d
eath
(%
)
Control Vorinostat
BAX
BCL-2
β-actin
ES2 OVCAR3
Control Vorinostat
C
Co
ntr
ol
Vo
rin
os
tat
OVCAR3ES2
Cleaved caspase 3
DAPI
DAPI
DAPI
DAPI
Cleaved caspase 3 Cleaved caspase 3
Cleaved caspase 3

Chapter 4
108
Interestingly, the levels of HNF1β mRNA also increase in vorinostat long term
exposure of ES2 cells (Figure 4.5C).
Figure 4. 5 - Vorinostat exposure increase the levels of HNF1β in clear cell carcinoma (ES2), both in short and long term exposure A. In ES2, vorinostat increases the levels of HNF1β; B. Vorinostat increases the protein levels of HNF1β and its acetylation (in lysine residues), and C. Long term exposure to vorinostat increases the expression of HNF1β.
B
HNF1β
Acetyl-lysine
Control Vorinostat
C
A
Vo
rin
os
tat
Co
ntr
ol
OVCAR3ES2
ES2
0.0
0.5
1.0
1.5
2.0
2.5
3.0
3.5
4.0 ***
***
**
ControlVorinostat 30 days
Without 20 daysVorinosat 20 days
++
++
+++
HN
F1
rela
tive g
en
e e
xp
resssio
n

Chapter 4
109
Discussion
As mentioned, CCC in advanced stages is characterized by a poor prognosis due
to intrinsic resistance to conventional therapy72. Therefore, the discovery of new
therapeutic alternatives is of absolute importance.
The emergence of HDACIs as therapeutic agents opened up novel perspectives
for the treatment of cancer and particularly in ovarian cancer. In this work, we were
able to document that vorinostat has different effects in ovarian cancer cell lines, CCC
and HGSC. This result could be anticipated as these cancer cell lines derived from two
different entities both in clinical and molecular terms.
Overall, it is known that vorinostat induces cell cycle arrest and apoptosis in EOC
as described in other cancer contexts upon exposure to HDACIs315,320,412. Furthermore,
the cell cycle arrest in G0/G1 phases is supported on the molecular level by the
increased expression of p21, an inhibitor of cyclin dependent kinases (CDK)414,415, thus
not allowing the advance of cells throughout the cell cycle.
The p53 mutant variants present in the cell lines (CCC-ES2; C.722 C>T and HGSC-
OVCAR3; C.743 G>A) used in this study were already described and these variants
interfere with the p53 DNA binding capacity416,417. Gene CDKN1A (p21), is a main p53
target gene and the fact that p21 is increased in cells exposed to vorinostat, probably
means that p53 is activating its transcription. The mutations in exon 7 of p53 codifies
p53 variants that are protected from degradation, having an increased half-life time
and accumulating in the cell416,417. As a tumor suppressor gene, it was expected a loss
of function in mutant p53, however its special condition is well known and mutated
p53 variants are characterized by oncogenic gain of function that can be patent for
instance in its action as a dominant negative abrogating normal p53 function in the
tetramer, or by interacting with new partners being able to regulate the expression of
a new setting of genes that are favorable to cancer development and progression418.
The dramatically increased levels of p53 in ES2 cells that are cultured free of
vorinostat after a long term exposure to vorinostat can indicate that p53 p.S241F
mutated variant (codified by C.722 C>T) plays a role in the survival of vorinostat

Chapter 4
110
resistant cells at least in this cancer cell line. As p21 gene is also described to be a
target of p73, a transcription factor belonging to p53 family that can overcome p53
function in cells with a mutated p53419, it might be a possible explanation for p21
elevated levels.
Interference of HNF1β in cell cycle was already describe by Shigetomi et al.402
where they demonstrate the involvement of HNF1β in cell cycle of ovarian CCC lines
using HNF1β knockdown cell lines. The study suggested that drug resistance of CCC cell
lines may be caused by sustained activation of the G2 checkpoint, through HNF1β
overexpression. Asides from studying checkpoint kinase 1(CHK1), important in G2
checkpoint, no others proteins were investigated402.
As demonstrated by our immunofluorescence experiments the HGSC cell line,
OVCAR3 does not express HNF1β and therefore this type of carcinoma cannot help to
explain the mechanism that cells use to survive through HNF1β action.
The most important aspect of this work was the finding of HNF1β acetylation
induced by vorinostat. This finding can underly a mechanism of modulation/abrogation
of HNF1β function, which is an advance in the understanding of the CCC biology. Since
HNF1β has a pro-survival activity, this work showed that its acetylation can be a route
of HDACIs action in CCC cells, affecting cell proliferation and viability.
Again, it became evident in this study that the action of HDACIs, although initially
designed to affect the acetylation level of histones and therefore the conformation of
chromatin; also affects the function of other proteins, which play crucial roles in cell
function, since HDACs also deacetylate other proteins than histones. The HDACIs
contribute for the overall increased levels of acetylation, interfering with proteins
function420 and the turnover of proteins, not only histones, by affecting the labeling of
proteins to be degraded, similar to what it is described for p53421–423. Acetylation can
interfere with the proteosomic degradation of ubiquitinated proteins. So far, HNF1β is
not described as being regulated by ubiquitination (http://www.ncbi.nlm.nih.gov/
ieb/research/acembly/av.cgi?db=human&term=HNF1B&submit=Go) but it may explain
our results, since (Figure 5B) phosphorylation and ubiquitination are the same

Chapter 4
111
mechanisms of regulation of p53 activity and degradation with which acetylation
interferes421–424.
Hence, this work also opens new perspectives for studies to be further
developed in order to better understand the function of HNF1β, especially in the
context of cancer, since HNF1β is consistently de novo expressed or overexpressed in
CCC from different organs such as ovary, pancreas, kidney and liver399,425–427.
Unfortunately, clinical trials testing HDACIs, that have been proven inconclusive,
due to toxic effects, or have classified HDACIs as not suitable therapeutic agents for
the treatment of EOC; were essentially carried out in EOC with no identification of the
tumor histological type324,374,428–430. This practically prevented the adjustment and use
of HDACIs to treat CCC which is undoubtedly the histological type of EOC that requires
a more urgent effective therapeutic action and bears molecular trait that seems to be
more susceptible to this therapy.
In light of our study, HDACIs are a group of drugs that could be a therapeutic
alternative to the CCC. Possibly, its use also requires new strategies to deliver these
drugs in a way to reduce the toxic effects already observed in clinical trials, since the
structural changes are not indicated as they are inhibitors of the catalytic center of
HDACs, and the toxic effects are adverse effects related to their specific function.

112
CHAPTER 5
Functional redundancy of the Notch pathway in ovarian cancer
cell lines
Work presented in this chapter corresponds to the following publication:
Silva, F., Félix, A. & Serpa, J. Functional redundancy of the Notch pathway
in ovarian cancer cell lines. Oncol. Lett. 12, 2686–2691 (2016).

Chapter 5
113
Abstract
Epithelial ovarian cancer is the most lethal gynecologic malignancy, despite advances in
treatment. The most common histological type, high grade serous carcinoma (HGSC) is usually
diagnosed at an advanced stage, and although this type of tumors frequently respond to
surgery and platinum-based chemotherapy, they usually recur. Ovarian clear cell carcinoma
(CCC) is an unusual histological type, which is known to be intrinsically chemoresistant and is
associated with poor prognosis in advanced stages.
In recent years, genetic alterations and epigenetic modulation of signaling pathways
have been reported in HGSC and CCC, including the overexpression of Notch pathway
elements and histone deacetylases. Histone deacetylase inhibitors (HDACIs), including
vorinostat (suberoylanilide hydroxamic acid), alter the transcription of genes involved in cell
growth, survival and apoptosis, and have become an attractive therapeutic approach.
However, no previous work has addressed the effect of HDACIs, and in particular vorinostat,
on Notch signaling in ovarian cancer.
Therefore, the present study aimed to investigate the modulation of the Notch pathway
by vorinostat in ovarian cancer. Using immunofluorescence and quantitative polymerase chain
reaction, the present results revealed that vorinostat activated the Notch pathway in CCC and
HGSC cell lines, through different Notch ligands. In CCC, the activation of Notch pathway
appeared to occur through Delta-like (Dll) ligands 1, 2 and 3, whereas in HGSC Dll1 and Jagged
1 and 2 ligands were involved. The activation of Notch pathway by vorinostat, in CCC and HGSC
cell lines, culminated in the increased expression of the same downstream transcription
factors, hairy enhancer of split (Hes1) 1 and 5, and Hes-related proteins 1 and 2.
In conclusion, vorinostat modulates the expression of several downstream targets of the
Notch pathway and independent Notch receptors and ligands that are expressed in HGSC and
CCC. This upregulation of the Notch pathway may explain why vorinostat therapy fails in
ovarian carcinoma treatment, as shown in certain clinical trials.
Keywords: ovarian cancer, Notch pathway, vorinostat

Chapter 5
114
Introduction
Epithelial ovarian cancer (EOC) is the most lethal and the seventh most common
gynecologic malignancy in women worldwide3,4. EOC represents 90% of ovarian
malignant tumors21 and it is an extremely heterogeneous group of neoplasms that
exhibit a wide range of tumor morphology, clinical manifestations and underlying
genetic alterations25.
The most common histological type, high grade ovarian serous carcinoma
(HGSC), is characterized by tumor protein 53 (TP53) mutations and breast cancer 1 and
2 dysfunction31. This type of tumor is aggressive and usually diagnosed at an advanced
stage, and although HGSC frequently responds to surgery and platinum-based
chemotherapy, it usually recurs55.
Ovarian clear cell carcinoma (CCC) is a more unusual histotype of EOC, which is
known to be intrinsically chemoresistant and is associated with poor prognosis in
advanced stages55. Molecular alterations of CCC are not well known, presenting a
challenge to treat this type of tumors. However, CCC is characterized by a unique
histology, de novo expression of hepatocyte nuclear factor 1β transcription factor and
somatic mutations of AT-rich interaction domain 1A gene, and loss of its
expression61,62.
In previous years, other genetic alterations and epigenetic modulation of
signaling pathways have been reported in HGSC and CCC64, including the
overexpression of Notch pathway elements and histone deacetylases (HDAC)339. The
Notch pathway has multiple roles in cell fate determination, since it regulates cell
proliferation, differentiation, survival and apoptosis135,136. This signaling pathway is
deregulated in human hematological malignancies and solid tumors133,134, and it is also
implicated in angiogenesis431,432. Notch signaling is a juxtacrine pathway composed by
Notch receptors (Notch1-4) and two classes of ligands, Delta-like (Dll) 1, 3 and 4 and
serrate-like Jagged1 and Jagged2137–140.
Notch signaling is initiated by the binding of Delta/Jagged ligands to Notch
receptors. Through several proteolytic cleavages, the Notch intracellular domain
Chapter 5
115
(NICD) is released and activates the transcription of target genes, hairy enhancer of
split (Hes) family proteins, Hes-related proteins (Hey)143 as well as cell cycle regulators,
including p21135, cyclin D1 and 3144, c-myc145 and human epidermal growth factor 2146.
Epigenetic alterations are also involved in the repression of tumor suppressor
genes and promotion of tumorigenesis in ovarian cancers, and HDAC inhibitor (HDACI)
drugs are an attractive therapeutic approach286. HDACIs inhibit cancer cell growth in
vitro and in vivo, revert oncogene-transformed cell morphology, induce apoptosis, and
enhance cell differentiation279.
Vorinostat (suberoylanilide hydroxamic acid) is a HDACI310 that was FDA
approved in 2006 for the treatment of cutaneous T-cell lymphoma, and it has
demonstrated interesting results in in vitro models of ovarian cancer311. However, to
the best of our knowledge, there has been no previous study addressing the effect of
HDACIs, and in particular of vorinostat, on Notch signaling on ovarian cancer.
Therefore, the aim of the present study was to investigate the modulation of the
Notch pathway by vorinostat in ovarian cancer cell lines.
Material and Methods
Cell lines and cell culture conditions
CCC-ES2 (CRL-1978) and HGSC-OVCAR3 (HTB-161) cell lines were obtained from
American Type Culture Collection (Manassas, VA, USA). The cells were incubated at
37°C in a humidified atmosphere containing 5% CO2 in McCoy’s 5A Modified Medium
(Sigma-Aldrich, St. Louis, MO, USA), supplemented with 10% fetal bovine serum (FBS, S
0615, Invitrogen) and 1% antibiotic-antimycotic (AA) (InvitrogenTM; Thermo Fisher
Scientific, Inc., Waltham, MA, USA). The cells were cultured to 80-100% confluence
prior to detachment by incubation with 1X 0.05% trypsin-EDTA (InvitrogenTM; Thermo
Fisher Scientific, Inc.) at room temperature. For the various assays, cell number was
determined using a Bürker counting chamber. Vorinostat (catalog no. CAS 149647-78-
9; Cayman Chemical, Ann Arbor, MI, USA) was used at 5 µM to treat cells.

Chapter 5
116
Immunofluorescence
Procedure already described in Chapter 3.
The primary antibodies were as follows: rabbit polyclonal anti-human Notch1
extracellular (catalog no., ABS90, EMD Millipore, Billerica, MA, USA), rabbit
monoclonal anti-Notch1 cleaved (catalog no. 1744, Cell Signaling, Inc., Danvers, MA,
USA), rabbit polyclonal anti-Notch2, cleaved (catalog no., 07-1234, EMD Millipore) and
rabbit polyclonal anti-Notch4 (catalog no., N5163; Sigma-Aldrich). The cells were
incubated with Alexa Fluor® 488 goat anti-rabbit secondary antibody (catalog no., A-
11008; InvitrogenTM, Thermo Fisher Scientific, Inc.) for 2 h at room temperature. The
slides were mounted in VECTASHIELD Anti-fade Mounting Medium with DAPI (catalog
no., H-1200; Vector Laboratories, Inc., Burlingame, CA, USA) and examined by standard
fluorescence microscopy using an Axio Imager microscope (Zeiss GmbH, Jena,
Germany). Images were acquired with AxioVision software (version 4.5; Zeiss, GmbH)
and processed with ImageJ software (version 1.44p; imagej.nih.gov/ij/).
Reverse transcription-quantitative polymerase chain reaction (qPCR).
Total RNA was isolated from cells cultured in complete McCoy’s with or without
(control condition) vorinostat, using RNeasy Mini Extraction Kit (catalog no., 74104,
Qiagen, Inc., Valencia, CA, USA), according to the manufacture’s protocol. Procedure
already described in Chapter 3.
The primers sequences used were as follows: Notch1:
TGGCGGGAAGTGTGAAGCGG (forward), GTGCGAGGCACGGGTTGGG (reverse), Notch2:
CCATATGCTTCAGCCGGGATAC (forward), GTCTCACATTTCTGCCCTGTG (reverse),
Notch3: CTGCAAGGACCGAGTCAATGG (forward), CGTCCACGTTGCGAT CACAC (reverse),
Nocth4: CCACCTTTCACCTCTGCCTC (forward), ACCTCACAG TCTGGGCCTAT (reverse),
Dll1: ATGCCTTCGGCCACTTCAC (forward), CACATCCAGGCAGGCAGAT (reverse),
Dll3:GAACCCGTGTGCCAATGGAG (forward), GTAGGCAGAGTAGGGTCTG (reverse),
Jagged1: CGGCTTTGCCATGTGCTT (forward), TCTTCCTCCATCCCTCTGTCA (reverse),
Jagged2: GTCGTCATCCCCTTCCAGTTC (forward), CTCATTCGGGGTGGTATCGTT (reverse),
Hey1: GAAGTTGCGCGTTATCTGAG (forward), GTTGAGATGCGAAACCAGTC (reverse),
Hey2: TCGCCTCTCCACAATTCAG (forward), TGAATCCGCATGGGCAAACG (reverse), Hes1:

Chapter 5
117
CGGAGGTGCTTCACTGTCAT (forward), ACGACACCGGATAAACCAAA (reverse), Hes5:
GAGAAAAACC GACTGCGGAAG (forward), GACAGCCATCTCCAGGATGTC (reverse), Hes6:
GAAGTGCTGGAGCTGACGG (forward), CGAGCAGATGGTTCAGGAGC (reverse). All
samples were run in triplicate. Data were analyzed in SDS 2.4.1 software (Applied
Biosystems; Thermo Fisher Scientific, Inc.) and the relative expression of each gene
was quantified by comparative quantification cycle (Cq) method (∆∆Ct)369 using
hypoxanthine phosphoribosyltransferase gene (HPRT) as an endogenous reference
gene.
Statistical analysis
Statistical analysis was performed using Student’s t-test with GraphPad Prism
software (version 5.03; GraphPad Software, Inc., La Jolla, CA, USA). P<0.05 was
considered to indicate a statistically significant difference.
Results
Effects of vorinostat treatment on Notch signaling in ovarian cancer cells
In order to investigate the effect of HDACI vorinostat on the Notch signaling
pathway, ES2 and OVCAR3 cell lines were exposed to vorinostat for various periods of
time. The results demonstrated that vorinostat exposed ES2 cells express increased
levels of Notch 2 (P<0.010), 3 and 4 (P<0.001) mRNAs, whereas Notch1 expression
remained unchanged (Figure 5.1A). Increased levels of Notch1 NICD in control and
vorinostat exposed cells was observed using immunofluorescence. In Fig. 5.1B,
immunofluorescence revealed that vorinostat exposure increased Notch2 and 4
protein expression but not extracellular Notch1.
Concerning Notch ligands in ES2 cells, vorinostat induced an increased
expression of Dll1, Dll3 and Dll4 (P<0.001), whereas Jagged1 and 2 levels remained the
same compared to control cells (Figure 5.1C). The significant increase in mRNA levels
of Notch downstream genes Hes1 (P<0.010), Hes5 (P<0.001), Hey1 (P<0.01), and Hey2
(P<0.05), in cells exposed to vorinostat, confirmed the activation of Notch pathway in
this cell line (Figure 5.1D).

Chapter 5
118
Figure 5.1 – Vorinostat increases the expression of mRNA of Notch receptors, Delta/Jagged ligands and Hey/Hes downstream target genes
6h 18h 30h 6h 18h 30h 6h 18h 30h 6h 18h 30h
0
2
4
6
8
10
20
40
60
Notch1
******
**
Notch3Notch2 Notch4
**
***
***
***
***
Re
lati
ve g
en
e e
xpre
ssio
n
Control
Vorinostat
Co
ntr
ol
Vo
rin
osta
t
Notch1
NICD
Notch1
extracellular
A
B Notch2 Notch4
6h 18h 30h 6h 18h 30h 6h 18h 30h
0
2
4
6
8
10
20
40
60
Hes1
***
**
***
**
Hes5 Hes6
**
**
Rela
tiv
e g
en
e e
xp
ressio
n
6h 18h 30h 6h 18h 30h
0
2
4
6
8
10
20
40
60
Hey1
***
*
**
Hey2
**
Rela
tiv
e g
en
e e
xp
ressio
n
Control
Vorinostat
6h 18h 30h 6h 18h 30h 6h 18h 30h 6h 18h 30h 6h 18h 30h
0
2
4
6
8
10
20
40
60
***
***
DLL1
**
***
DLL3 DLL4 Jagged1 Jagged2
***
***
Rela
tiv
e g
en
e e
xp
ressio
n
C
D
Jagged2
Jagged1
Control Vorinostat

Chapter 5
119
Cells were grown in the absence and presence of vorinostat (5µM) and experimental conditions included exposures of 6, 18 and 30 hours, after starvation, with medium supplemented with 1% FBS; A. Notch receptors expression levels in ES2 cells. RQ-PCR showed that Notch2, Notch3 and Notch4 mRNAs are increased by vorinostat exposure, whereas Notch1 was not differentially expressed; B. Representative staining of Notch receptors by immunofluorescence. It was observed an increase of Notch2 and Notch4 protein after exposure to vorinostat (magnification 200x). Nuclei are stained with DAPI (blue), Notch receptors FITC (green); C. Notch ligands expression levels in ES2 cell line. RQ-PCR indicates that Dll1, Dll3, Dll4 mRNA expression levels in cells treated with vorinostat are higher than in cells without vorinostat. Jagged1 and Jagged2 mRNA expression levels were not significantly different; D. Notch downstream targets genes expression levels. RQ-PCR showed that Hes1, Hes5, Hey1 and Hey2 mRNA expression levels in cells treated with vorinostat are higher than in cells without vorinostat. Hes6 has similar expression in all conditions. The RQ-PCR was normalized to Hypoxanthine phosphoribosyltransferase gene (HPRT). Data are mean ± standard deviation of triplicates *p<0.05; **p<0.01; ***p ≤0.001.
In OVCAR3 cells, vorinostat also significantly increased Notch2, Notch3 and
Notch4 (P<0.010), and slightly decreased Notch1 mRNA levels (Figure 5.2A). Protein
expression of Notch2 and 4 was also higher in cells exposed to vorinostat; however,
extracellular and NICD of Notch1 levels were not increased (Figure 5.2B). For Notch
ligands, it was observed that there was a significant increase in Dll1 (P<0.001), Jagged1
and Jagged2 (P<0.001), mRNA levels in OVCAR3 cells exposed to vorinostat (Figure
5.2C), whereas Dll3 and 4 mRNA expression was not increased. Regarding Notch
downstream targets, it was observed that vorinostat statistically increased Hey1, Hey2
(p<0.001), Hes1 (p<0.05), and Hes5 (p<0.001), mRNA levels compared with control
cells (Figure 5.2D); however, Hes6 levels were not increased.
Overall, the present results revealed that vorinostat activated Notch pathway in
CCC and HGSC cell lines; however, this activation was through a different expression
panel of Notch ligands in the two cell lines. In CCC, the activation of Notch pathway
appears to occur through Dll1, Dll2 and Dll3, whereas in HGSC Dll1 and Jagged 1 and 2
ligands families appear to be involved. Nevertheless, the present results revealed that
the activation of Notch pathway by vorinostat, in CCC and HGSC cell lines, culminated
in the increased expression of the same downstream targets, Hey1, Hey2, Hes1 and
Hes5.

Chapter 5
120
Figure 5. 2 – Vorinostat increases the mRNA expression of Notch receptors, ligands and downstream targets in ovarian serous carcinoma OVCAR3 cell line
Control
Vorinostat
Co
ntr
ol
Vo
rin
os
tat
Notch1
NICD
Notch1
extracellular
A
B Notch2 Notch4
6h 18h 30h 6h 18h 30h 6h 18h 30h 6h 18h 30h 6h 18h 30h
0
2
4
6
8
10
20
40
60
******
DLL1 Jagged1 Jagged2
**
**
DLL3 DLL4
***
***
Rela
tiv
e g
en
e e
xp
ressio
n
6h 18h 30h 6h 18h 30h 6h 18h 30h
0
2
4
6
8
10
20
40
60
Hes1
***
Hes5 Hes6
***
**
Rela
tiv
e g
en
e e
xp
ressio
n
6h 18h 30h 6h 18h 30h
0
2
4
6
8
10
20
40
60
***
***
Hey1 Hey2
Rela
tiv
e g
en
e e
xp
ressio
n
Control
Vorinostat
Jagged1
Control Vorinostat
Jagged2
C
D
6h 18h 30h 6h 18h 30h 6h 18h 30h 6h 18h 30h
0
2
4
6
8
10
20
40
60
Notch1
***
***
***
*
Notch2 Notch3 Notch4
*
*
Rela
tiv
e g
en
e e
xp
ressio
n

Chapter 5
121
The cells were grown in the absence and presence of vorinostat (5µM) for 6, 18 and 30 hours following starvation, with medium supplemented with 1% fetal bovine serum; A. Notch receptors expression levels in OVCAR3 cells. RQ-PCR indicated that Notch2, Notch3 and Notch4 mRNAs were increased following vorinostat exposure; B. Representative staining of Notch receptors by immunofluorescence. Vorinostat slightly increases the protein expression of Notch receptors 2 and 4, and decreased Notch1 expression following exposure to vorinostat (magnification 200x). Nuclei are stained with DAPI (blue), Notch receptors FITC (green); C. Notch ligands expression levels in OVCAR3 cell line. RQ-PCR showed that Dll1, Jagged1 and Jagged2 mRNA expression levels in cells treated with vorinostat are higher than in cells without vorinostat. Dll3 and Dell4 mRNA expression levels were not differentially express; D. Notch downstream targets genes expression levels. RQ-PCR showed that Hes1, Hes5, Hey1 and Hey2 mRNA expression levels in cells treated with vorinostat are higher than in cells without vorinostat. Hes6 mRNA expression levels were not affected by vorinostat. The RQ-PCR was normalized to Hypoxanthine phosphoribosyltransferase gene (HPRT). Data are mean ± standard deviation of triplicates *p<0.05; **p<0.01; ***p ≤0.001.
Discussion
The Notch signaling pathway is an important cell signaling system that is
activated in various types of cancer, including ovarian carcinomas31,152,433. Notch1
overexpression has been demonstrated in several studies to promote ovarian cancer
cell proliferation150,153,434 and this is primarily associated with increased levels of
Notch1 NICD150. In the literature, Notch3 has also been demonstrated to be active in
certain ovarian cancer cell lines and its overexpression was described in 20% of
HGSC148,151. In addition, Notch3 was revealed to increase following tumor
chemotherapy, and its overexpression is associated with tumor aggressiveness and
poor prognosis of patients151. The present study aimed to investigate the effect of
vorinostat, an HDAC inhibitor, on Notch signaling pathway in ovarian cancer cells. For
this purpose, the present study used cell lines from two different histological types of
EOC: HGSC, the most prevalent and aggressive EOC type; and CCC, which is a rare type
of EOC that is highly resistant to chemotherapy435.
No significant alteration in Notch1 mRNA levels following vorinostat exposure
was identified in the two different ovarian cancer cell lines; however, high levels of
cleaved Notch1 were detected in CCC cell line (ES2). In addition, Notch3 was
demonstrated to be upregulated following vorinostat exposure in the two cell lines.
Furthermore, the present study revealed that vorinostat activates the Notch pathway

Chapter 5
122
through specific Notch ligands in CCC and HGSC cell lines; Dll1, 3 and 4 are activated in
CCC, while Dll1 and Jagged1 and 2 are activated in HGSC. The present results are
supported by a previous study that demonstrated altered Notch signaling in HGSC, due
to increased expression of Jagged1 and 2 ligands31,149.
The Hes and Hey gene families are the best characterized canonical Notch target
genes, and the activation of Notch signaling upregulates their transcription436,
therefore Hes and Hey mRNA expression may be considered as markers for Notch
activation. The present study demonstrated that Hes and Hey Notch target genes are
overexpressed in EOC cells following exposure to vorinostat. The present data reveals
that vorinostat induces the overexpression of Hes and Hey Notch target genes in EOC
cells, due to Notch signaling activation. In addition, the redundancy of Notch, Delta
and Jagged elements expressed in EOC cell lines was shown (Figure 3). Hence, no
matter which panel of receptors or ligands is expressed on the cell membrane, the
downstream target genes are always expressed in the presence of vorinostat. This
upregulation can aid our understanding of the mechanism underlying the failure of
vorinostat therapy in ovarian carcinoma.
In conclusion, the present findings illustrate the redundancy of Notch pathway in
ovarian cancer, and suggest that disruption of histone acetylation may not be a useful
therapeutic strategy in these carcinomas.

Chapter 5
123
Figure 5. 3 - Schematic representation of Notch pathway in ovarian cancer A. clear cell carcinoma ES2 and B. serous carcinoma OVCAR3 cells following exposure to vorinostat. NICD, Notch intracellular domain; CSL, Suppressor of Hairless; CoR, repressor; CoA, coactivator; MAML, mastermind-like proteins; Hes, hairy enhancer of split; Hey-related proteins.
ES2A
OVCAR3B

124
CHAPTER 6
Establishment and Characterization of a novel ovarian high
grade serous carcinoma cell line - IPO-SOC43
Manuscript in preparation

Chapter 6
125
Abstract
Epithelial ovarian cancer (EOC) is an aggressive and lethal malignancy and novel EOC cell
lines with detailed characterization are needed, to provide researchers helpful resources of
diverse EOC to study biological processes and cancer experimental therapy.
The IPO-SOC43 cell line was established from the ascitic fluid of a patient with a
diagnosis of high grade serous carcinoma (HGSC) of the ovary, previously treated with
neoadjuvant chemotherapy. The cell immortalization was achieved as 2D cell culture and
growth performed as 2D and 3D cell cultures. The morphological and molecular
characterization of immortalized cells was done by immunocytochemistry, flow cytometry, cell
proliferation and chromosomal Comparative Genomic Hybridization (cCGH).
Characterization studies confirmed that IPO-SOC43 cell line is of EOC origin and
maintains morphological and molecular features of the primary tumor. cCGH analysis showed
a complex profile with gains and losses of specific DNA regions in both primary ascitic fluid and
cell line IPO-SOC43. The cell line was successfully grown in a 3D system which allows its future
application in more complex assays than those performed in 2D models. IPO-SOC43 is available
for public research and we hope it can contribute to enrich the in vitro models addressing EOC
heterogeneity, being useful to investigate EOC and to develop new therapeutic modalities.
Keywords: high grade serous carcinoma (HGSC), cell line, 2D and 3D culture models, ovarian
cancer.
Chapter 6
126
Introduction
Cell lines provide a powerful model to clinical and basic research. In vitro models
are suitable to study the molecular mechanisms underlying chemoresistance and
cancer recurrence, being very helpful to clinical research, as the use of in vitro studies
uncovered molecular pathways driving progression and metastatic spread of
tumors437,438.
As the development for precision medicine needs to account for tumor and
microenvironment heterogeneity, the detailed characterization of in vitro models,
representing the different histological and molecular types of ovarian cancer, is
essential to accurate preclinical testing. There are at least 100 publicly available
ovarian cancer cell lines but their origin and molecular characteristics are largely
undescribed439.
We described a new human high grade serous carcinoma (HGSC) cell line that
represents the vast majority of ovarian carcinoma73. This tumor type is clinically
aggressive, tumor relapse is frequent and most patients ultimately die due to the
failure of current therapeutic regimes73.
In this study, we presented the characteristics of immortalized cultured cells in
two-dimensional (2D) monolayer culture and three-dimensional (3D) cell culture
system, focusing on cell culture conditions, cell proliferation and the expression profile
of biomarkers.
Material and Methods
Establishment of a primary cell line of ovarian carcinoma and culture conditions
In our study, 130 ovarian tumor samples and 30 ascitic fluid were collected and
cultivated for primary cell culture. Tumor samples were diagnosed as serous (90), clear
cell (3), endometrioid (33) and mucinous (4) ovarian carcinomas and ascites from
patients with ovarian carcinoma (30).

Chapter 6
127
A successful primary cell culture was established from the ascitic fluid obtained
from a caucasian female patient diagnosed with ovarian carcinoma, at Instituto
Português de Oncologia Francisco Gentil de Lisboa. The ascitic fluid was collected for
therapeutic reasons and to cell culture, under patient’s formal consent.
Clinical details were recorded and sample was assigned with a reference number
to retain anonymity accordingly with the institutional approval for the research
project, by our institutional Ethical Committee (UIC-772). This cell line was named IPO-
SOC43.
Ascite-derived cells were isolated by centrifugation (1200 rpm, 2 minutes), and
cells were stained with Giemsa for assessing the morphology of cells. Cells were also
collected and suspended in culture medium, Dulbecco’s Modified Eagle Medium
(catalog no. 41965-039, InvitrogenTM Life Technologies), supplemented with 1%
Antibiotic-Antimycotic (catalog no. 15240062, InvitrogenTM Life Technologies) and 10%
FBS (catalog no. S0615, InvitrogenTM Life Technologies) and placed directly into culture
with little manipulation at 37°C in an incubator with humidified atmosphere containing
5% CO2. Adherent cells were observed after 48h and once cultures reach 80-90%
confluency, cells were detached. At each passage, cells were washed with PBS,
trypsinized with 0.05% trypsin-ethylenediamine-tetraacetic acid (EDTA) and
maintained in culture. Cell counting of viable cells was performed using trypan blue
exclusion method as described below. Immortalization occurred spontaneously after
six months in continuous culture. The established cell line is maintained in culture in a
2D model for more than 100 passages. Cells, periodically, were collected and stored.
The ability of cells to survive and proliferate in low serum conditions was
assessed by plating cells in T25 cm2 flasks in DMEM supplemented with 1% FBS and
cultured for 20 days. The medium was changed every three days. The experiments
were performed in duplicate.
In summary, IPO-SOC43 was established from ascitic fluid of a patient diagnosed
with HGSC (9 months after initial diagnosis) that was confirmed by histology.
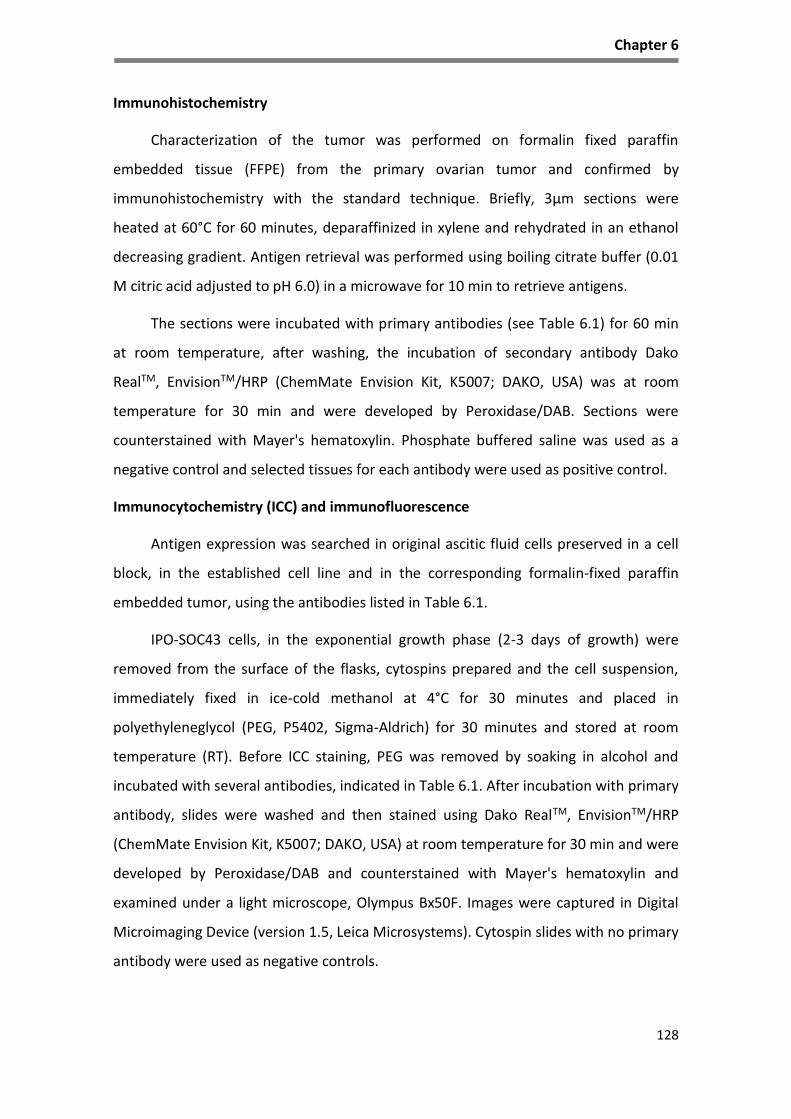
Chapter 6
128
Immunohistochemistry
Characterization of the tumor was performed on formalin fixed paraffin
embedded tissue (FFPE) from the primary ovarian tumor and confirmed by
immunohistochemistry with the standard technique. Briefly, 3μm sections were
heated at 60°C for 60 minutes, deparaffinized in xylene and rehydrated in an ethanol
decreasing gradient. Antigen retrieval was performed using boiling citrate buffer (0.01
M citric acid adjusted to pH 6.0) in a microwave for 10 min to retrieve antigens.
The sections were incubated with primary antibodies (see Table 6.1) for 60 min
at room temperature, after washing, the incubation of secondary antibody Dako
RealTM, EnvisionTM/HRP (ChemMate Envision Kit, K5007; DAKO, USA) was at room
temperature for 30 min and were developed by Peroxidase/DAB. Sections were
counterstained with Mayer's hematoxylin. Phosphate buffered saline was used as a
negative control and selected tissues for each antibody were used as positive control.
Immunocytochemistry (ICC) and immunofluorescence
Antigen expression was searched in original ascitic fluid cells preserved in a cell
block, in the established cell line and in the corresponding formalin-fixed paraffin
embedded tumor, using the antibodies listed in Table 6.1.
IPO-SOC43 cells, in the exponential growth phase (2-3 days of growth) were
removed from the surface of the flasks, cytospins prepared and the cell suspension,
immediately fixed in ice-cold methanol at 4°C for 30 minutes and placed in
polyethyleneglycol (PEG, P5402, Sigma-Aldrich) for 30 minutes and stored at room
temperature (RT). Before ICC staining, PEG was removed by soaking in alcohol and
incubated with several antibodies, indicated in Table 6.1. After incubation with primary
antibody, slides were washed and then stained using Dako RealTM, EnvisionTM/HRP
(ChemMate Envision Kit, K5007; DAKO, USA) at room temperature for 30 min and were
developed by Peroxidase/DAB and counterstained with Mayer's hematoxylin and
examined under a light microscope, Olympus Bx50F. Images were captured in Digital
Microimaging Device (version 1.5, Leica Microsystems). Cytospin slides with no primary
antibody were used as negative controls.

Chapter 6
129
For immunofluorescence of the 2D cultures, permeabilization of cells was
performed by incubation with 0.1% Triton X-100 for 10 min. Sections were blocked for
30 min with 0.2% FSG (fish skin gelatin). Appropriate amount of primary antibody was
diluted in blocking solution and incubated for 2h at room temperature. Secondary
antibody was diluted in 0.125% FSG and incubated for 1h at room temperature (Table
6.1). Sections were mounted with ProLong containing DAPI (Life Technologies).
Samples were visualized using a fluorescence microscope (DMI6000 Leica
Microsystems GmBH, Wetzlar, Germany).
For 3D cultures of IPO-SOC43 cells, aggregates in suspension were dehydrated
using 30% sucrose solution overnight. The sucrose solution was removed and the
samples were transferred in Tissue Teck OCTTM (Sakura Finetek Europe B.V.,
Zoeterwoude, Netherlands) and stored at -80°C until cryosectioning in a cryostat
(Cryostat I, Leica, Wetslar, Germany) to achieve sections of 10 µm thickness was
performed. Immunofluorescence staining was then performed and visualized as
indicated above for the 2D cultures.
Flow cytometry
Cells were collected to form a single cell suspension and washed in ice-cold
phosphate buffered saline (PBS1X). Approximately, 1×10⁶ cells were resuspended in
100 μl of ice cold PBS/BSA 0,1% (bovine serum albumin, Sigma) and primary
antibodies, anti-pan cytokeratin-FITC (catalog no. ab52460, Abcam) and anti-human
vimentin-APC (catalog no. IC2105A, R&D systems) were added and incubated for
60 minutes at 4°C in dark. At the end, cells labeled for the respective antigens were
washed twice, centrifuged at 1200 rpm for 5 minutes, resuspended in 500 μl of
PBS/BSA 0,1% and kept on ice until analysis. Appropriate controls have been used
(unstained cells). Acquisition was performed in a FACScalibur (Becton Dickinson). Data
were analyzed with FlowJo (http://flowjo.com/ version 1.44) software.
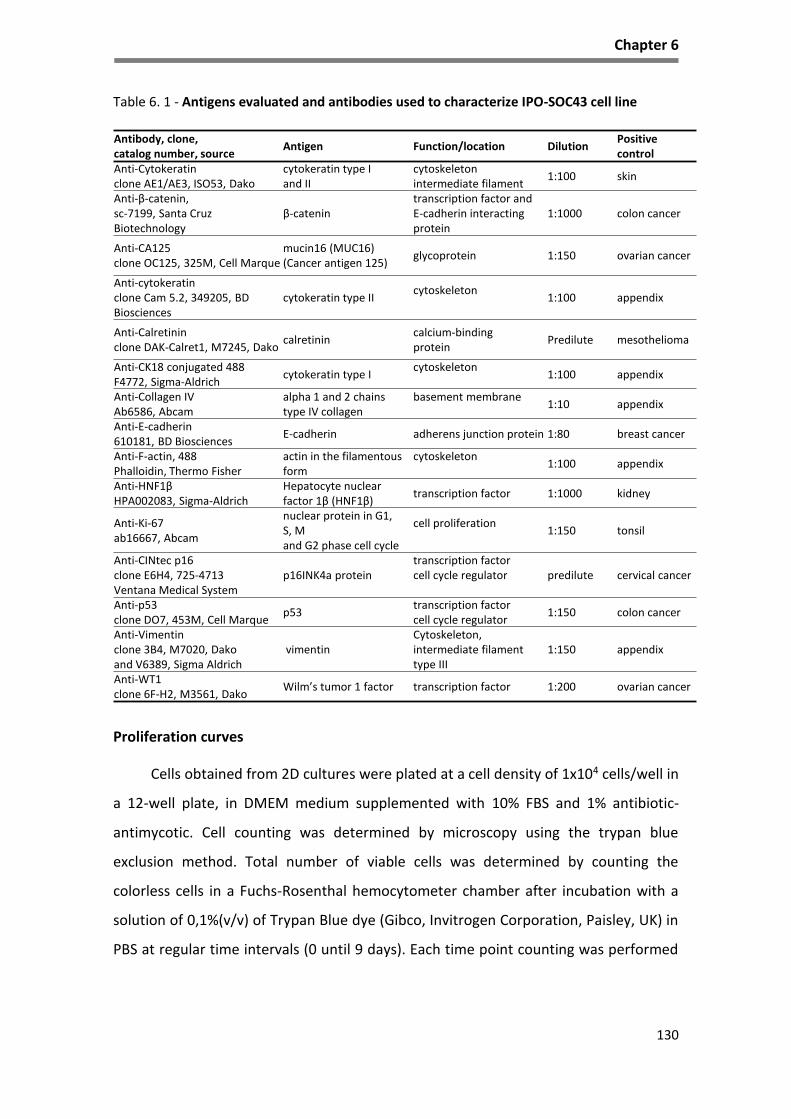
Chapter 6
130
Table 6. 1 - Antigens evaluated and antibodies used to characterize IPO-SOC43 cell line
Proliferation curves
Cells obtained from 2D cultures were plated at a cell density of 1x10⁴ cells/well in
a 12-well plate, in DMEM medium supplemented with 10% FBS and 1% antibiotic-
antimycotic. Cell counting was determined by microscopy using the trypan blue
exclusion method. Total number of viable cells was determined by counting the
colorless cells in a Fuchs-Rosenthal hemocytometer chamber after incubation with a
solution of 0,1%(v/v) of Trypan Blue dye (Gibco, Invitrogen Corporation, Paisley, UK) in
PBS at regular time intervals (0 until 9 days). Each time point counting was performed
Antibody, clone, catalog number, source
Antigen Function/location DilutionPositive control
Anti-Cytokeratinclone AE1/AE3, ISO53, Dako
cytokeratin type I and II
cytoskeletonintermediate filament
1:100 skin
Anti-β-catenin, sc-7199, Santa Cruz Biotechnology
β-catenintranscription factor and E-cadherin interacting protein
1:1000 colon cancer
Anti-CA125 clone OC125, 325M, Cell Marque
mucin16 (MUC16)(Cancer antigen 125)
glycoprotein 1:150 ovarian cancer
Anti-cytokeratinclone Cam 5.2, 349205, BD Biosciences
cytokeratin type IIcytoskeleton
1:100 appendix
Anti-Calretininclone DAK-Calret1, M7245, Dako
calretinincalcium-binding protein
Predilute mesothelioma
Anti-CK18 conjugated 488F4772, Sigma-Aldrich
cytokeratin type Icytoskeleton
1:100 appendix
Anti-Collagen IVAb6586, Abcam
alpha 1 and 2 chainstype IV collagen
basement membrane1:10 appendix
Anti-E-cadherin610181, BD Biosciences
E-cadherin adherens junction protein 1:80 breast cancer
Anti-F-actin, 488Phalloidin, Thermo Fisher
actin in the filamentous form
cytoskeleton1:100 appendix
Anti-HNF1βHPA002083, Sigma-Aldrich
Hepatocyte nuclear factor 1β (HNF1β)
transcription factor 1:1000 kidney
Anti-Ki-67ab16667, Abcam
nuclear protein in G1, S, M and G2 phase cell cycle
cell proliferation1:150 tonsil
Anti-CINtec p16clone E6H4, 725-4713 Ventana Medical System
p16INK4a proteintranscription factorcell cycle regulator predilute cervical cancer
Anti-p53clone DO7, 453M, Cell Marque
p53transcription factorcell cycle regulator
1:150 colon cancer
Anti-Vimentinclone 3B4, M7020, Dakoand V6389, Sigma Aldrich
vimentinCytoskeleton, intermediate filament type III
1:150 appendix
Anti-WT1clone 6F-H2, M3561, Dako
Wilm’s tumor 1 factor transcription factor 1:200 ovarian cancer

Chapter 6
131
in triplicate and proliferation curves were plotted and doubling time was calculated
according to the following formula:
doubling time = duration* log (2)_______________
Log (final concentration)-log (initial concentration)
The crystal violet method was also used to determine the cell number. Cells were
centrifuged for 5 min and then lysed using lysis solution (1% Triton X-100 in 0.1M citric
acid), overnight at 37°C. Total cell number was determined after incubation with 0.1%
(v/v) crystal violet in lysis solution. Nuclei density was assed using a Fuchs-Rosenthal
hemocytometer and a microscope with phase contrast (DM IRB, Leica, Germany).
Wound healing assay
Cells were plated onto 12-well plates in DMEM medium supplemented of 10%
FBS, and allowed to form a confluent monolayer. The cells were previously treated
with 5µg/mL Mitomycin-C (Sigma), an antiproliferative agent, for 3 hours at 37°C in 5%
CO2. The monolayer was then scratched in a straight line with a pipette tip. Dethatched
cells were removed by washing with PBS1X. Images of closure of the wound were
captured at 0, 24, 48 and 72h after scratching.
Chromosomal Comparative genomic hybridization (cCGH)
Genomic DNA isolated from the ascitic fluid and derived cell line was done using
DNA Purification Protocol for 1-2 Million Cells (Citogene® DNA isolation kit) according
to manufacturer’s protocol. cCGH technique was carried out according the method of
the Kallioniemi et al.440 adapted as previously described by Roque et al.441.
For image analysis a Zeiss epifluorescence microscope linked to a Cytovision CGH
software program (Cytovision version 7.4, Leica Biosystems, Richmond, USA) was used.
For both ascitic cells DNA and derived cell line DNA, at least, 15 metaphases were
acquired for the establishment of the cCGH profile. The green (test DNA) to red
(reference DNA) fluorescence ratio along the length of the chromosomes was
calculated. This high resolution cCGH version uses dynamic standard reference
intervals based in the systematic variation seen in normal samples. When the dynamic
standard reference intervals do not overlap the confidence limits, the software
interprets as either a loss (red) or a gain (green) in the test DNA. Heterochromatic
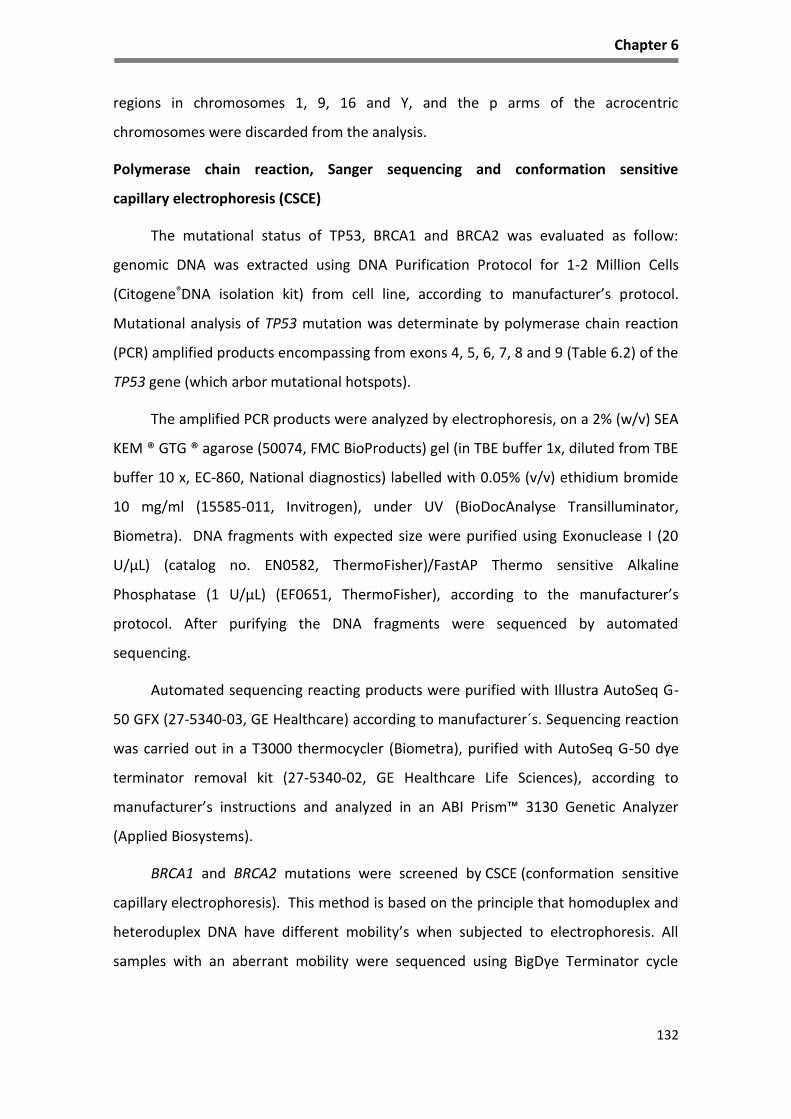
Chapter 6
132
regions in chromosomes 1, 9, 16 and Y, and the p arms of the acrocentric
chromosomes were discarded from the analysis.
Polymerase chain reaction, Sanger sequencing and conformation sensitive
capillary electrophoresis (CSCE)
The mutational status of TP53, BRCA1 and BRCA2 was evaluated as follow:
genomic DNA was extracted using DNA Purification Protocol for 1-2 Million Cells
(Citogene®DNA isolation kit) from cell line, according to manufacturer’s protocol.
Mutational analysis of TP53 mutation was determinate by polymerase chain reaction
(PCR) amplified products encompassing from exons 4, 5, 6, 7, 8 and 9 (Table 6.2) of the
TP53 gene (which arbor mutational hotspots).
The amplified PCR products were analyzed by electrophoresis, on a 2% (w/v) SEA
KEM ® GTG ® agarose (50074, FMC BioProducts) gel (in TBE buffer 1x, diluted from TBE
buffer 10 x, EC-860, National diagnostics) labelled with 0.05% (v/v) ethidium bromide
10 mg/ml (15585-011, Invitrogen), under UV (BioDocAnalyse Transilluminator,
Biometra). DNA fragments with expected size were purified using Exonuclease I (20
U/µL) (catalog no. EN0582, ThermoFisher)/FastAP Thermo sensitive Alkaline
Phosphatase (1 U/µL) (EF0651, ThermoFisher), according to the manufacturer’s
protocol. After purifying the DNA fragments were sequenced by automated
sequencing.
Automated sequencing reacting products were purified with Illustra AutoSeq G-
50 GFX (27-5340-03, GE Healthcare) according to manufacturer´s. Sequencing reaction
was carried out in a T3000 thermocycler (Biometra), purified with AutoSeq G-50 dye
terminator removal kit (27-5340-02, GE Healthcare Life Sciences), according to
manufacturer’s instructions and analyzed in an ABI Prism™ 3130 Genetic Analyzer
(Applied Biosystems).
BRCA1 and BRCA2 mutations were screened by CSCE (conformation sensitive
capillary electrophoresis). This method is based on the principle that homoduplex and
heteroduplex DNA have different mobility’s when subjected to electrophoresis. All
samples with an aberrant mobility were sequenced using BigDye Terminator cycle

Chapter 6
133
sequencing kit v1.1 and DNA sequencing reactions were carried out on ABI Prism™
3130 Genetic Analyzer (Applied Biosystems).
BRCA1 and BRCA2 large rearrangements were determined by Multiplex Ligation-
dependent Probe Amplification (MLPA) assay according to manufacturer's protocol.
Amplification products were analyzed ABI Prism™ 3130 Genetic Analyzer (Applied
Biosystems) using the GeneMapper software (Applied Biosystems) and data analysis
was performed using Coffalyser software (MRC-Holland).
Table 6. 2 - Primers for PCR of the TP53 gene (Exons 4-9)
Generation of 3D tumor cell spheroids in stirred-tank culture systems
Single cell suspensions of IPO-SOC43 cells (0.2 x 10⁶ cell/mL) were inoculated in
125 mL of culture media in stirred-tank vessels with flat centered cap and angled side
arms (Corning® Life Sciences) and cultured on a magnetic stirrer in an incubator at
37°C with humidified atmosphere containing 5% CO2. Stirring rates of either 40 rpm or
60 rpm were tested. The culture media was the same used in the 2D cultures or
supplemented with 10 µM of ROCK (Rho-associated coiled coil forming protein)
inhibitor (highly potent, cell-permeable, and selective for ROCK I and II). Cultures were
maintained for, at least, 72 hours.
Exon Primer Oligonucleotide sequence
4 forward gacctggtcctctgactgct
4 reverse caggcattgaagtctcatgg
5 forward cgtgttccagttgctttatctg
5 reverse gccagacctaagagcaatcagt
6 forward ctcagatagcgatggtgagcag
6 reverse cttaacccctcctcccagagac
7 forward cctcatcttgggcctgtgtta
7 reverse tggaagaaatcggtaagaggtg
8-9 forward ccttactgcctcttgcttctc
8-9 reverse cattttgagtgttagactggaaactt

Chapter 6
134
Cell membrane integrity assay
Cell viability was evaluated using fluorescein diacetate (FDA; Sigma–Aldrich, Steinheim,
Germany), an intracellular esterase substrate, at 10 μg/mL in PBS to label live cells, and
TO-PRO-3 iodide (Invitrogen) at 1 μM in PBS to identify dead cells. Cultures were
incubated for 5 min at RT with the fluorescent probes and then analyzed using a
fluorescence microscope (DMI6000 Leica Microsystems GmBH, Wetzlar, Germany).
Spheroid morphometry
Aggregates were imaged in a fluorescence microscope (DMI6000, Leica
Microsystems GmbH, Wetzlar, Germany). Ferret Diameter and the area of the
aggregates were determined adjusting the threshold and applying the respective
algorithm of FIJI open source software (Rasband, WS, ImageJ, U. S. National Institutes
of Health, Bethesda, MD, USA, http://imagej.nih.gov/ij/, 1997–2012). In order to
classify spheroid shape ‘Shape Parameters’ function of FIJI was used. The “solidity”
function can be used as a measure of roughness of the spheroid surface and provides
information about the regularity of the aggregate. A spheroid was considered as
regular for solidity values higher than 0.9 on a scale from 0 to 1442.
PicoGreen Assay
Total cell quantification of DNA was assessed in samples collected from 3D
cultures and washed once with PBS. The pellet was resuspended in milliQ water,
frozen in liquid N2 and stored at -80°C until analysis. DsDNA quantification using
Quant-iT™ PicoGreen® dsDNA Assay Kit (Life Technologies) was performed according
to manufacturer’s protocol. Briefly, samples were thawed and subsequently sonicated
for 30 min. Appropriate dilutions of samples and dsDNA standard were prepared in
Tris-EDTA buffer. Addition of Quant-iT™ PicoGreen® and incubation for 5 min was
followed measurement of fluorescence (excitation 480 nm; emission 520 nm; Infinite
200 Pro NanoQuant, Life Science).

Chapter 6
135
Results
Establishment of a primary culture
A successful primary cell culture was established from the ascitic fluid obtained
from a caucasian female patient with 73 years old, diagnosed with ovarian high grade
serous carcinoma, stage IIB (FIGO) with irressectable disease accordingly to imaging
studies at Instituto Português de Oncologia Francisco Gentil de Lisboa. The patient
underwent neoadjuvant standard chemotherapy (3 cycles), followed by surgery and
was submitted to 3 more cycles. In the follow-up, 3 months after finishing
chemotherapy, ascitic fluid was collected for therapeutic reasons and for cell culture,
under patient’s formal consent. The ascitic fluid was observed in cytospins and cell
morphology assessed by Giemsa staining (Figure 6.1). Many cellular types were
observed but malignant epithelial cells were predominant. These cells were present in
large cell aggregates or isolated cells surrounded by inflammatory and mesothelial
cells. Malignant cells expressed anti-cytokeratin type I and II (clone AE1/AE3) and
CA125; vimentin was seldom positive in few malignant cells.
Establishment of the histological type of ovarian carcinoma
Residual tumor found in the ovary allowed the confirmation of the histotype as HGSC.
Tumors cells aggregates show epithelial marker (cytokeratin), recognized by the
antibody Cam 5.2. Mucin 16 (MUC16) recognized by anti-cancer antigen 125 (CA125)
was observed in tumor cells (apical cell membrane). The cells showed strong nuclear
staining for p53 and p16 protein and tumor cells aggregates were negative for WT1
and vimentin (VIM). Some tumor cells exhibit expression for calretinin (CALRET).
Tumor tissue was negative for anti-HNF1β (Figure 6.2).

Chapter 6
136
Figure 6. 1 – Morphological characterization of cells from ascitic fluid Cells were collected by cytospins. Smears of cells stained with Giemsa show aggregates and isolated cells with irregular size, abundant cytoplasm and large nuclei, confirming the presence of malignant cells; Immunocytochemical characterization of cells was done using cytokeratin (CK) AE1/AE3 (neoplastic cells are positive); Vimentin (neoplastic cells are predominately negative, macrophages and mesothelial cells were positive) and CA125 (neoplastic cells were positive), 100x.
VIM
GIEMSA
CA125
CK type I and II

Chapter 6
137
Figure 6. 2 - Characterization of the primary ovarian carcinoma of the patient from whose ascitic fluid IPO-SOC43 was established Formalin fixed paraffin-embedded sections of patient tumor ovarian high grade serous carcinoma submitted to surgery and neoadjuvant chemotherapy (after 3rd cycle) stained with hematoxylin and eosin (H&E) and immunohistochemical staining. Tumor cells show positive expression of epithelial marker Cam 5.2 (CK type II). Apical cell membrane staining for CA125 in tumor cells. Cells exhibited nuclear positive expression for p53, p16 and WT1. Tumor cells were negative with vimentin (VIM), calretinin (CALRET) and HNF1β, 100x.
Expression of cell markers in IPO-SOC43 cell line
After spontaneous immortalization, cell line was characterized by a panel of
markers in order to confirm its nature by flow cytometry and immunohistochemistry.
Cytokeratin (epithelial cell marker) and vimentin (mesenchymal cell marker)
expression were evaluated. The epithelial origin of the cell line, IPO-SOC43 was
confirmed by flow cytometry, showing a high expression for cytokeratin (85% of cells)
and low expression of vimentin (Figure 6.3).
HE
WT1
HNF1β
CA125
p53
CK type II
p16
CALRETVIM

Chapter 6
138
Figure 6. 3 - Detection of cytokeratins and vimentin in IPO-SOC43 cell line by flow cytometry Cells were positive to, A. anti-pan cytokeratin-FITC, and negative to B. anti-human vimentin-APC.
The epithelial nature of IPO-SOC43 cells was also confirmed by
immunocytochemical analysis through positive expression of anti-cytokeratins type I
and II (clone Cam 5.2 and AE1/AE3). Cells also show positive expression for vimentin
and calretinin (Figure 6.4).
Expression of biological markers relevant in ovarian cancer
To further characterize this cell line we evaluated other biological markers such
as the expression of cell cycle regulators and cell surface receptors relevant in ovarian
carcinogenesis.
We observed that the majority of cells exhibit nuclear staining for p53, nuclear
and cytoplasmic staining for p16INK4a protein, a cyclin-dependent kinase-4 (CDK4)
inhibitor that is expressed in a limited range of normal tissues and tumors such as
HGSC443. Cells exhibited nuclear expression of the Wilm’s tumor 1 (WT1) protein and
anti-cancer antigen 125 (Figure 6.4). The IPO-SOC43 cells were negative for HNF1β
(data not showed in Figure 6.4).
RED: BlankBLUE: CK+
RED: BlankBLUE: Vim+
A B
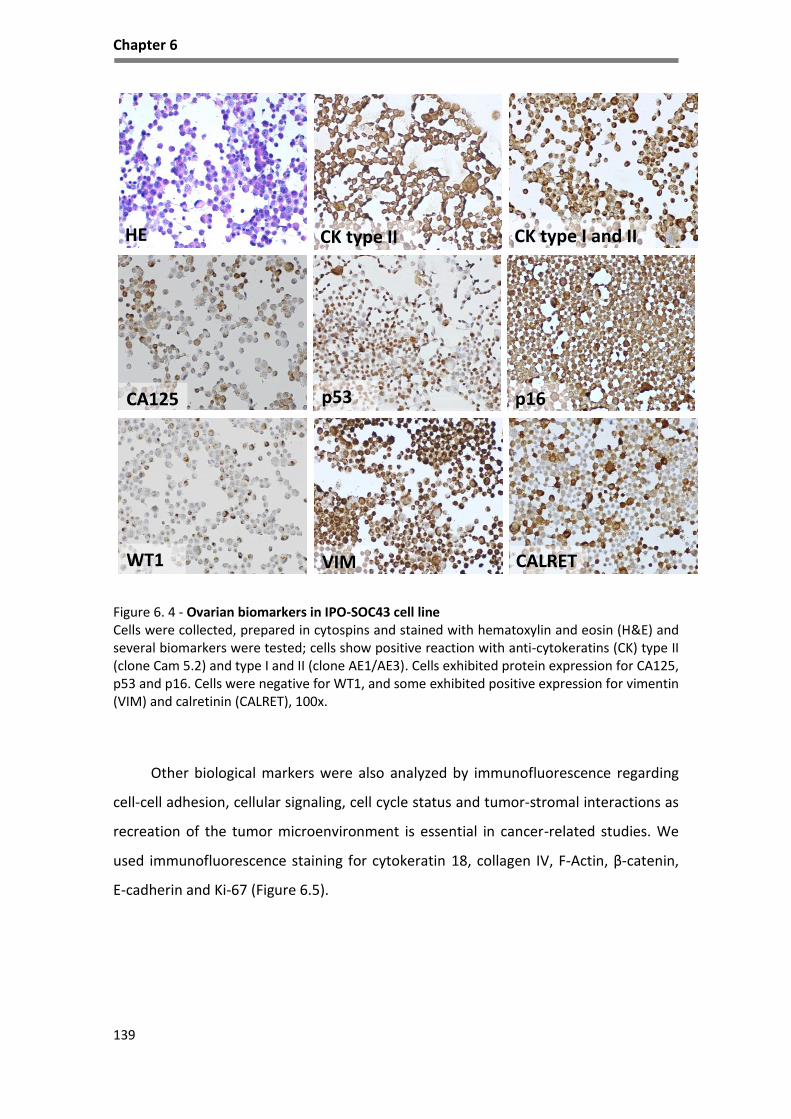
Chapter 6
139
Figure 6. 4 - Ovarian biomarkers in IPO-SOC43 cell line Cells were collected, prepared in cytospins and stained with hematoxylin and eosin (H&E) and several biomarkers were tested; cells show positive reaction with anti-cytokeratins (CK) type II (clone Cam 5.2) and type I and II (clone AE1/AE3). Cells exhibited protein expression for CA125, p53 and p16. Cells were negative for WT1, and some exhibited positive expression for vimentin (VIM) and calretinin (CALRET), 100x.
Other biological markers were also analyzed by immunofluorescence regarding
cell-cell adhesion, cellular signaling, cell cycle status and tumor-stromal interactions as
recreation of the tumor microenvironment is essential in cancer-related studies. We
used immunofluorescence staining for cytokeratin 18, collagen IV, F-Actin, β-catenin,
E-cadherin and Ki-67 (Figure 6.5).
HE
WT1
CK type I and II
CA125 p53
CK type II
VIM
p16
CALRET
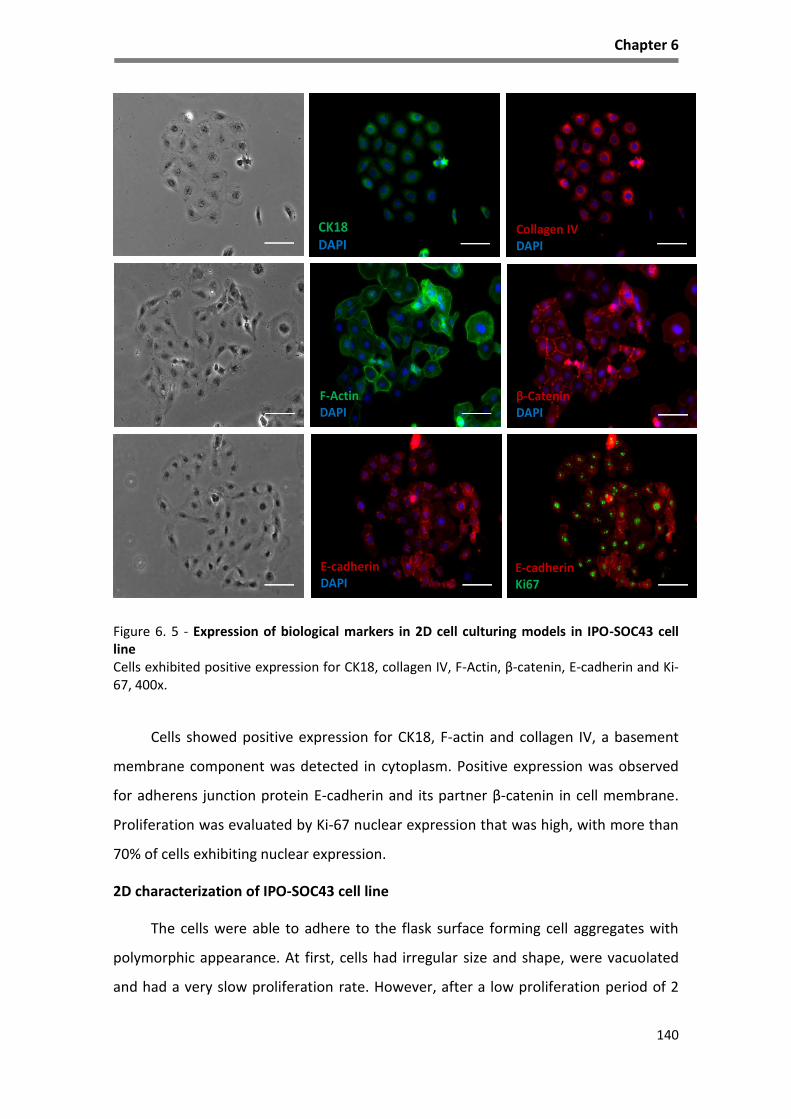
Chapter 6
140
Figure 6. 5 - Expression of biological markers in 2D cell culturing models in IPO-SOC43 cell line Cells exhibited positive expression for CK18, collagen IV, F-Actin, β-catenin, E-cadherin and Ki-67, 400x.
Cells showed positive expression for CK18, F-actin and collagen IV, a basement
membrane component was detected in cytoplasm. Positive expression was observed
for adherens junction protein E-cadherin and its partner β-catenin in cell membrane.
Proliferation was evaluated by Ki-67 nuclear expression that was high, with more than
70% of cells exhibiting nuclear expression.
2D characterization of IPO-SOC43 cell line
The cells were able to adhere to the flask surface forming cell aggregates with
polymorphic appearance. At first, cells had irregular size and shape, were vacuolated
and had a very slow proliferation rate. However, after a low proliferation period of 2
F-ActinDAPI
β-CateninDAPI
CK18DAPI
Collagen IVDAPI
E-cadherinDAPI
E-cadherinKi67

Chapter 6
141
months, outgrowths developed and a monolayer of epithelial cells with a pavement-
like arrangement was established (Figure 6.6). At this time, cells were polygonal in
shape and showed atypical nuclear features such as clusters of chromatin, thickened
and convoluted nuclear membrane, and large nucleoli. Some multinucleated giant cells
were also seen in cell culture.
These cells are growing without interruption for more than 40 months and with
more than 100 serial passages, exhibiting a continuous, permanent and stable
proliferation rate. This cell line can be maintained in DMEM only with 1% of FBS
(Figure 6.6A).
Figure 6. 6 - Characterization of IPO-SOC43 cell line in 2D model The cell line presents cobblestone morphology or a pavement-like arrangement characteristic of epithelial cells in a confluent monolayer (cells with polygonal shape). A. Representative morphology of IPO-SOC43 cells in DMEM culture medium with 1% FBS, phase contrast microscopy, 100x. B. Representative morphological appearance of IPO-SOC43 cell line at passage 40, phase contrast microscopy, 100x; C. Representative morphology of IPO-SOC43 cells at passage 80, phase contrast microscopy, 100x and 200x.
C
A B

Chapter 6
142
Proliferation rate of IPO-SOC43 cell line
The proliferative characteristics of the cell line were assessed (Figure 6.7) and the
cell line exhibited a slow proliferation rate and a doubling time (37,3 hours) with a
proliferation rate of 1,86% in the initial 72 hours (3 days). Continuous growth (more
than 100 passages), led us to believe that IPO-SOC43 cell line behaves as an
immortalized cell line.
Figure 6. 7 - Proliferation curve of IPO-SOC43 cell line A. Cell counting was determined by microscopy using the trypan blue exclusion method, and in B. nuclei counting was determined by crystal violet staining, at regular time intervals (1 to 9 days).
Migration properties of IPO-SOC43 cell line
The wound healing assay is a simple and reproducible method of measuring cell
migration444. Scratch assays showed that the cell line have a low migration ability,
taking 72h to close the wound area (Figure 6.8).
BA
0 2 4 6 8 100
2100 5
4100 5
6100 5
8100 5
Time [Days]
Nu
mb
er
of
Cells
0 2 4 6 8 100
2100 5
4100 5
6100 5
8100 5
Time [Days]
Nu
mb
er
of
Cells

Chapter 6
143
Figure 6. 8 - Wound healing assay to determine the migration rate of IPO-SOC43. Representative images of wound-healing assays performed in IPO-SOC43 cell. Cells were plated onto a 12 well dish and treated with mitomycin-C. Wounds were generated and cells migrate filling the wound after 72h. Pictures were taken at 0 h, 24h, 48h and 72h after the scratch was performed (bright field microscopy), 100x.
Clonal selection was observed in IPO-SOC43 cells by cCGH
For the establishment of the genomic profile by cCGH analysis was performed in
the DNA extracted from the original ascitic fluid cells and subsequently in the
corresponding cell line, at passage twenty (p20, Figure 6.9B) and forty-two (p42, Figure
6.9C) after its initial establishment. We also tried to perform cCGH analysis with DNA
extracted from paraffin sections of the primary tumor but the quality of the DNA was
insufficient.
0 h 24 h
48 h 72 h

Chapter 6
144
cCGH profiles showed gain and losses of chromosome regions as shown in Figure
6.9 and chromosome alterations are described in Table 6.3.
Figure 6. 9 - cCGH profiles of cells from ascitic fluid and IPO-SOC43 cell line A. Cells from ascitic fluid; B. IPO-SOC43 cell line p20; C. and p42; Red lines indicate loss and green lines indicate gain of chromosomal regions.
Amplification of chromosome 19
Amplification of chromosome 19
Amplification of chromosome 19
B
C
A

Chapter 6
145
As shown in Table 6.3 and Figure 6.9, tumor cells from ascitic fluid showed a
complex genomic profile by cCGH with several gains, including amplifications, and
losses of chromosome regions. The cell line cCGH profile was quite similar exhibiting
most of the alterations present in the original ascetic fluid but also showing some de
novo alterations.
Table 6. 3 - Description of cCGH chromosome alterations in IPO-SOC43 cell line
The cells from the ascetic fluid present alterations in TP53 gene, namely deletion
of the region where TP53 gene is located, verified by cCGH (Figure 6.9).
Gain of entire chromosomes/partial gains of
chromosome regions
Loss of entire chromosomes/partial
losses of chromosome regions
Cells from
ascitic fluid
20/
1p34.3-q23, 1q31-q32.1, 1q32.3-q44, p25-
p11.2, 3p12-q29, 4q28.q35, 5p15.3-p13,
7p22-q34, 8p21-q24.3 with amplification
8q11.2-q23, 11p14-p11.2, 12p12-p11.2,
13q21-q31, 14q11.2-q13, 17q24-q25,
18p11.3-p11.2, 18q12, 19p13.3-q13.2 with
amplification 19q12-q13.1
9, 15, 16, X/
3p24-p14, 4p16-q28, 5q11.2-q31,
6p22-p12, 11p15, 11q22-q25,
13q32-q34, 17p13-q21, 18q21.3-
q23, 19q13.3-q13.4, 22q11.2-q13.
Cells passage
twenty (p20)
7, 12, 20/
1p36.3-q23, 1q32-q44, 2p25-q13, 2q21.1,
2q24-q32, 3p12-q29, 4q28.q35, 5p15.3,
8q11.2-q24.3, 11q13-q14, 13q21-q31,
14q11.2-q21, 17q22-q25, 18p11.3,
19p13.3-q13.2 with amplification of
19q13.1.
9, 15, X/
1q25-q31, 3p23-p21, 4p16-q27,
5q11.2-q31.1, 6q21-q26, 8p23-p12,
10q11.2-q26, 11q23.3-q25, 13q32-
q34, 17p12-q21.3, 22q12-q13.
Cells passage
forty-two (p42)
20/
1p36.1-p31, 1q22-q23, 1q41-q42, 2p25-
p21, 3q13.1-q29, 4q28.q35, 5p15.3-p13,
5q32, 7p22-q31, 9q22-q31, 10p13-p12,
14q11.2-q13, 17q22, 19p13.1-q13.1 with
amplification of 19q13.1, Xq21.3-q25
15, 18/
1q31.1, 3p26-p13, 4p16-q27,
5q11.2-q22, 6p21.3-p12, 7q35-q36,
8p23-p12, 9p24-p13, 17p13-q21.1,
19q13.3, 22q12-q13, Xp22.3-q21.3,
Xq25-q28

Chapter 6
146
Other alterations, also frequently found in ovarian cancer and also reported in
TGCA31, such as 1p36.3, 8q11.2 and 14q11.2 were observed in IPO-SOC43 cell line. The
acquisition of changes not seen in the in the original ascitic fluid cells, possibly led to its
spontaneous immortalization.
cCGH analysis of the cells from passage twenty showed gains of chromosome 7,
12 and 20 and partial gains on several chromosomes as reported in Table 6.3. The IPO-
SOC43 cell line presented a total loss of chromosomes 9, 15 and X.
We also found that 19q 13.1 was amplified, this feature is maintained
throughout all cell line passages and was reported in other studies445,446.
In the passage 42, IPO-SOC43 showed gain of chromosome 20 and partial gains
of 1p36.1-p31, 1q22-q23, 1q41-q42, 2p25-p21, 3q13.1-q29, 4q28.q35, 5p15.3-p13,
5q32, 7p22-q31, 9q22-q31, 10p13-p12, 14q11.2-q13, 17q22, 19p13.1-q13.1, Xq21.3-
q25 and again amplification of 19q13.1 (Figure 6.9). Loss of chromosome 15 and 18
was observed, at this passage, and the cell line also maintained partial losses of some
chromosome regions. cCGH analysis revealed that IPO-SOC43 cells at passage 42
contained more genetic changes than the original tumor cells from ascitic fluid,
however these data are consistent with the acquisition of genetic change with cell line
passage and clonal evolution.
Mutational status of TP53, BRCA1 and BRCA2 of IPO-SOC43 cell line
In order to further characterize the cell line, mutation analyses of TP53 and
BRCA1 and BRCA2 were performed. As mentioned above, IPO-SOC43 cell line has the
deletion of the region where TP53 is located in the short arm of chromosome 17,
detected by cCGH and indicating the loss of one allele (Figure 6.9). By automate
Sanger sequencing a missense mutation in exon 5, codon 172 (p.V172F; GTT>TTT,
c.514G>T) was detected in the other allele, with the substitution of Valin (Val) to
phenylalanine (Phe), also identified in the hemizygotic histogram in Figure 6.10. This
c.514G>T mutation in TP53 is associated with an advantage for tumor growth in a
variety of neoplasms and it might have an pathophysiological effect, as reported in
V80 COSMIC database (http://cancer.sanger.ac.uk/cosmic/mutation)447–452. Thus IPO-
SOC43 cells do not have wild type p53 protein.
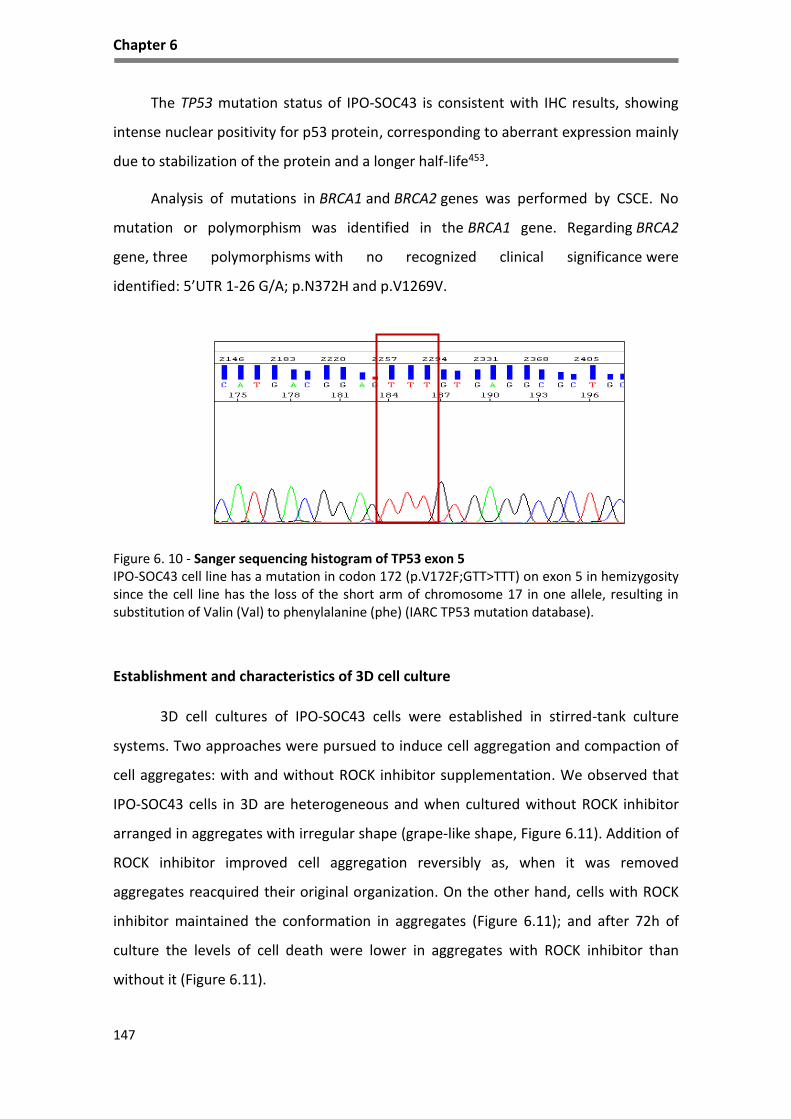
Chapter 6
147
The TP53 mutation status of IPO-SOC43 is consistent with IHC results, showing
intense nuclear positivity for p53 protein, corresponding to aberrant expression mainly
due to stabilization of the protein and a longer half-life453.
Analysis of mutations in BRCA1 and BRCA2 genes was performed by CSCE. No
mutation or polymorphism was identified in the BRCA1 gene. Regarding BRCA2
gene, three polymorphisms with no recognized clinical significance were
identified: 5’UTR 1-26 G/A; p.N372H and p.V1269V.
Figure 6. 10 - Sanger sequencing histogram of TP53 exon 5 IPO-SOC43 cell line has a mutation in codon 172 (p.V172F;GTT>TTT) on exon 5 in hemizygosity since the cell line has the loss of the short arm of chromosome 17 in one allele, resulting in substitution of Valin (Val) to phenylalanine (phe) (IARC TP53 mutation database).
Establishment and characteristics of 3D cell culture
3D cell cultures of IPO-SOC43 cells were established in stirred-tank culture
systems. Two approaches were pursued to induce cell aggregation and compaction of
cell aggregates: with and without ROCK inhibitor supplementation. We observed that
IPO-SOC43 cells in 3D are heterogeneous and when cultured without ROCK inhibitor
arranged in aggregates with irregular shape (grape-like shape, Figure 6.11). Addition of
ROCK inhibitor improved cell aggregation reversibly as, when it was removed
aggregates reacquired their original organization. On the other hand, cells with ROCK
inhibitor maintained the conformation in aggregates (Figure 6.11); and after 72h of
culture the levels of cell death were lower in aggregates with ROCK inhibitor than
without it (Figure 6.11).
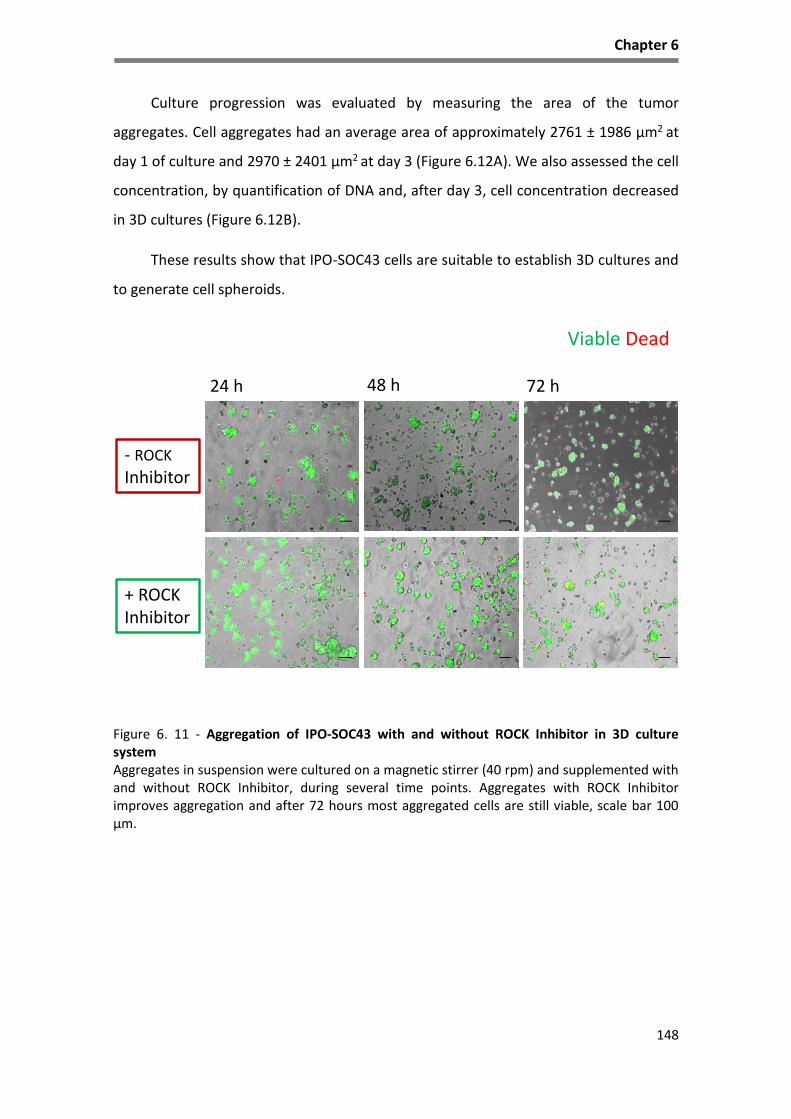
Chapter 6
148
Culture progression was evaluated by measuring the area of the tumor
aggregates. Cell aggregates had an average area of approximately 2761 ± 1986 µm2 at
day 1 of culture and 2970 ± 2401 µm2 at day 3 (Figure 6.12A). We also assessed the cell
concentration, by quantification of DNA and, after day 3, cell concentration decreased
in 3D cultures (Figure 6.12B).
These results show that IPO-SOC43 cells are suitable to establish 3D cultures and
to generate cell spheroids.
Figure 6. 11 - Aggregation of IPO-SOC43 with and without ROCK Inhibitor in 3D culture system Aggregates in suspension were cultured on a magnetic stirrer (40 rpm) and supplemented with and without ROCK Inhibitor, during several time points. Aggregates with ROCK Inhibitor improves aggregation and after 72 hours most aggregated cells are still viable, scale bar 100 µm.
+ ROCK Inhibitor
24 h 48 h 72 h
- ROCK
Inhibitor
Viable Dead

Chapter 6
149
Figure 6. 12 - 3D Culture progression with measurement of aggregates area and growth curve of IPO-SOC43 cells with ROCK Inhibitor A. IPO-SOC43 aggregates area and B. growth curve, determined by PicoGreen analysis. Values are mean±SD. Area increased with culture time, but growth tends to be lower.
Regarding the imunoprofile of IPO-SOC43 cultured in 3D, cells express a similar
profile as in 2D cell culture (Figure 6.13). Cells are positive for anti-cytokeratin type II
(clone Cam 5.2), and CA125. Cells exhibit positive expression with p53 and are negative
for WT1 as in 2D model and some cells express vimentin. IPO-SOC43 in 3D culture
maintains the same biological markers (Figure 6.14) as cultured in 2D (Figure 6.5).
In 3D configuration, IPO-SOC43 cells exhibited loose aggregates. Cells continue to
produce cytokeratin 18 and collagen IV. Cells exhibited β-catenin, mainly in the
cytoplasm, and fewer cells exhibited positive expression for E-cadherin, with a more
peripheral distribution in cell aggregates. Proliferation activity is maintained has seen
by Ki67 positive staining (Figure 6.14).
A B
0
1100 5
2100 5
3100 5
24 48 72
Time [Hours]
Cell c
on
cen
trati
on
[cell m
L-1
]
2761 ± 1986 µm2
2649± 1922 µm2
2970 ± 2401 µm2
24 46 720
5.0103
1.0104
1.5104
2.0104
Time [Hours]
Are
a [
µm
2]

Chapter 6
150
Figure 6. 13 - Characterization of IPO-SOC43 cell line in 3D model Cryosections of 3D aggregates stained with hematoxylin and eosin (HE) and immunohistochemical staining panel. Cells show positive expression for cytokeratin (CK) type II (clone CAM 5.2), vimentin and p53. Cells were negative for WT1 and had positive expression for CA125, 400x.
Figure 6. 14 - Expression of biological markers relevant for the establishment of 3D cell culturing models in IPO-SOC43 cell line Cryosections of 3D aggregates show positive expression for CK18, collagen IV and β-catenin. Only few cells show positive expression for vimentin, E-cadherin and Ki-67, 400x.
HE
WT1
CA125
p53
CK type II
VIM
CK18DAPI
Collagen IVDAPI
VimentinDAPI
β CateninDAPI
E-cadherinDAPI
Ki67DAPI

Chapter 6
151
Discussion
In this paper we characterized a new EOC cell line, IPO-SOC43 (Instituto
Português de Oncologia - High Grade Serous Ovarian Carcinoma 43), established in our
laboratory that can used as an important experimental tool in cancer research of EOC.
Cancer cell lines, besides their well-known limitations, are still useful in vitro
models to study molecular mechanisms underlying cancer biology, chemoresistance
and tumor recurrence, providing that they are well characterized454. There are many
benefits in using primary cell cultures with little or no laboratory-induced
transformation as the behavior of these cells reflects better the original tumor cells.
Our cell line was established from a patient (73 years old) receiving neoadjuvant
chemotherapy treatment for advanced HGSC, not manageable by surgery up front.
Ovarian cancer is recognized as a disease with distinct molecular backgrounds28 and
not a single clinical entity. Seventy percent of EOC are HGSC, making this tumor type
an important research focus455. Although considerable progress has been made in
cancer research, the survival rate of ovarian cancer has not improved over the past
several decades7, demonstrating the urgent need for understanding the mechanisms
underlying the development of ovarian cancer.
In this study a detailed characterization of this cell line was done in order to
establish the similarities and differences between the cell line and the original ascitic
fluid456.
The evaluation of the morphological features and immunohistochemistry
confirm that the IPO-SOC43 cell line resembles the original cells from the ascitic fluid
cells and also from the patient’s ovarian primary tumor. The 2D model cell line
expresses ovarian carcinoma markers and its epithelial origin has been confirmed by
immunohistochemistry and immunofluorescence. Although a positive expression of
vimentin was observed using techniques of immunocytochemistry, the result of flow
cytometry indicates that the cell line does not express vimentin. We believe that the
process of fixation of the cells can interfere with the antibody vimentin and this may
explain the positive results by immunocytochemistry457.

Chapter 6
152
Dynamical chromosomal gains and losses in the cell line support the evidence of
clonal selection. The cCGH profile of passage 42 of cell line showed less variability of
numerical alterations apparently due to clonal adaptation to in vitro conditions and
hopefully the stabilization of the cell line. Nevertheless, IPO-SOC43 cultured cells
showed gains and losses similar to the parental cells as well as additional chromosomal
alterations in clones compared with the parental cells suggesting that IPO-SOC43 cell
line was undergoing clonal selection.
It is suggested that certain genetic alterations that emerge in a cancer cells
confer a selective advantage over the others, and cancer progression results from the
expansion of clone(s) that collectively acquires the following characteristics: self-
sufficiency in growth signals, evasion to apoptosis, sustained angiogenesis, limitless
replicate potential and capacity of tumor invasion and metastasis458.
Through cCGH we verified that the cell line has the deletion of the region where
TP53 is located in the short arm of chromosome 17 and IPO-SOC43 cells contains a
missense mutation in TP53 in exon 5, codon 172 (p.V172F;GTT>TTT, c.514G>T. This
c.514G>T mutation is associated with an advantage for tumor growth in a variety of
neoplasms and it might have an pathophysiological effect, as reported in V80 COSMIC
database (http://cancer.sanger.ac.uk/cosmic/mutation)447–452. Thus IPO-SOC43 cells do
not have wild type p53 protein.
IPO-SOC43 cell line harbors alterations in chromosome 19, specifically gain of
chromosome regions 19p13.1-19q13.2 with amplification at 19q13.1, that has been
reported as a frequent cytogenetic change observed in ovarian carcinomas by other
studies338,445,459. We believe that our cell line may has become immortalized through
these alterations as reported for other cell lines338,445,459.
The study of the cCGH of our cell line revealed several other cytogenetic
alterations that were already described as highly frequent in HGSC by Kim et al.456,
such as the gain of 1p36, Xq21 and loss of 8p23. The same authors claimed that gains
of 5p15 and 14q11, and loss of 22q12, which we also find in IPO-SOC43 are associated
to chemoresistant disease.

Chapter 6
153
Finally, IPO-SOC43 cell line does not present BRCA1 mutations although in BRCA2
three polymorphisms were identified: 5’UTR 1-26 G/A; p.N372H and p.V1269V. These
alterations are not associated with clinical significance.
In summary, the genetic main characteristics of this cell line match the “classical
features” described by Cancer Genome Atlas Research Network (TGCA)31 such as
alterations in DNA regions copy number and TP53 mutation (reported in 96% of cases).
3D cultures of tumor cell lines are considered to be better models than 2D for
evaluation of tumor characteristics. For this reason we started by establishing a 3D
culture of IPO-SOC43 and compared to the characteristics of neoplastic cells cultured
in 2D culture. IPO-SOC43 cells in 2D were able to produce adhesion molecules such as
E-cadherin and β-catenin; and extracellular matrix macromolecules as collagen IV.
Their epithelial origin was proved by cytokeratin 18 positivity and expression of F-actin
very similar with original tumor. Our cell line persists in 3D, in irregular and loose
aggregates, and maintains the phenotypical features of the original tumor. This allow
us to explore the advantages of the use of stirred-tank culture systems for 3D cultures
in process scale-up over the standard two-dimensional (2D) static culture460; and by
reproducing better the effects of the tissue microenvironment, including cell
morphology, polarity and junctions.
In both models, we observed a similar proliferation activity (by Ki-67). In our 3D
model, expression of adhesion molecules such as E-cadherin or extracellular matrix as
collagen IV, indicates that cell aggregates maintained cell–cell interactions and
expression of ECM components. We hope to use this 3D culture system in more
complex assays, and to provide better and more complete answers regarding
neoplastic cells and their microenvironment460.
In conclusion, we describe the characteristic of an established cell line, IPO-
SOC43, isolated from ascitic fluid of HGSC patient using different techniques and
approaches (morphology, phenotype, genetic) and confirm its use as a stable cell line
suitable to investigate on HGSC of ovary, fallopian tube and peritoneum.

154
CHAPTER 7

155

Chapter 7
156
General Discussion
Epithelial ovarian cancer (EOC) is a heterogeneous disease composed by
different histological types with distinctive patient outcomes3–5. EOC diagnosed while
still limited to the ovaries, allow that 90% of patients can be cured with conventional
surgery but cure rates decrease substantially after tumor dissemination to the pelvic
organs or beyond the peritoneal cavity2,26.
The standard chemotherapy procedure involving cytotoxic drugs has been
established and optimized for ovarian cancer treatment (such as the combination of
taxane and platinum); however, the overall cure rate has remained between 20-40%
for the last 30 years4,461–463. Therefore, these therapeutic options are not effective,
leading to therapy resistance and metastasis.
We focus our study in the most common histological type, high grade serous
carcinoma (HGSC), usually diagnosed at an advanced stage, and although these tumors
frequently respond to surgery and platinum-based chemotherapy, they usually recur55;
and in ovarian clear cell carcinoma (CCC), less frequent histological type, known to be
intrinsically chemoresistant and associated with poor prognosis in advanced stages55.
New approaches are needed and epigenetic therapies raise as a possible route.
Histone deacetylases (HDACs) are responsible for many functions, they regulate
the acetylation of a variety of histone and nonhistone proteins, controlling the
regulation of transcription and function of genes involved in cell cycle control,
proliferation, survival/cell death, DNA repair, differentiation and therapy274,325,326.
Hence, HDACs expression is frequently altered in hematologic and solid tumor
malignancies329–331,334 and they can represent ideal targets for new therapeutic
strategies.
In the perspective of better understanding the role of HDACs in ovarian
carcinoma, we evaluated the expression profile of HDACs in our ovarian series, using
immunohistochemistry (IHC). Although many studies have been carried out to
elucidate the role of these enzymes in the context of ovarian cancer, their expression
profile is still very ambiguous325 464 339.
Chapter 7
157
We evaluated the expression by immunohistochemistry of class I enzymes,
HDAC1, 2, 3, and class II enzymes, HDAC4, 6 and phosphoHDAC4/5/7 in HGSC and CCC.
The results in both EOC types, revealed that HDACs were significantly associated with
the histological type of ovarian cancer. In HGSC, it was verified a high expression of
HDAC1, 2, 3, 4, 6 and pHDAC4/5/7. Regarding evaluation of clinical parameters and cell
cycle markers only HDAC1 expression was associated with p21 expression and HDAC3
was associated with disease stage at presentation in HGSC.
In CCC, high expression of HDAC1 and 2 was verified, whereas HDAC3 expression
was only present in 30% of cases. Also the low expression of HDAC4 (in only 21% of
cases) seems to be characteristic of this tumor type. In this cohort no other HDAC
expression was associated with any of the analyzed molecular and clinical parameters.
As mentioned above, other studies report the expression of these enzymes in
ovarian cancer, however, this is the first time the difference of HDACs expression
profile between different histological types of ovarian carcinomas is highlighted.
However, since we show that HDACs are expressed in EOC at higher levels than
in normal tissue counterparts, independently of which the enzyme is, we consider that
HDACIs can be a putative therapeutic strategy for ovarian carcinoma.
Assuming that the expression profiles of HDACs were different between
histological types we observed that HDACs are linked to the expression of cell cycle
molecules as reported by other studies296,299,325,421,465. However, further investigation is
required to clarify which of the identified biomarkers or whether they will ultimately
be useful in the diagnosis and monitoring of patients with ovarian carcinomas.
Hence, we evaluated the effects of HDACI in proliferation and cell death in EOC
cell lines with exposure to HDACI, DNA methyltransferases inhibitors (5-aza-dC) and
conventional chemotherapy (carboplatin and paclitaxel). Our results report that HDAC
inhibitors, butyric acid and vorinostat, induced cell death, mainly through apoptosis in
ES2 cell line, confirmed by immunofluorescence of cleaved caspase 3 and the ratio of
protein BAX/BCL-2 which increases after vorinostat exposure. Also, vorinostat and 5-
aza-dC were able to potentiate the effect of chemotherapeutic drugs mainly in ES2 cell
line (CCC), supporting that CCC treatment can benefit from combined chemical and

Chapter 7
158
epigenetics directed therapy. Whereas in HGSC we verified that only tetra-
combination of HDACIs, 5-aza-dC, carboplatin and paclitaxel would be profitable to
induce cell death.
In this work it was interesting to note that vorinostat has differential effects
between CCC and HGSC as it would be expected since they are different entities in
clinical and molecular terms. Regrettably, clinical trials have been proven inconclusive
or have classified HDACIs as not suitable therapeutic agents for the treatment of EOC,
mainly due to toxic effects. Unfortunately, we cannot make a point on histological type
response between our in vitro results and the literature on clinical assays, since the
clinical trials were labeled as being carried out in EOC with no identification of the
tumor histological type324,374,428–430.
Further studies are needed to understand how and why the different cancer cell
types respond to HDACIs differently and the mechanistic basis underlying resistance as
well as the secondary and adverse effects in patients, in order to develop more
effective and harmless HDACIs.
As mentioned above, CCC is an unique clinical, pathological and molecular entity
within ovarian cancer, having HNF1β as a key pro-survival gene400,401, being considered
as responsible for cell survival, proliferation and chemoresistance72,402. So, we
evaluated the effect of HDACI in HNF1β expression and CCC cells viability and the
results showed that the increased levels of HNF1β by vorinostat induced cell cycle
arrest and apoptosis in CCC cells. The increased expression of p21 supports the
evidence observed of the cell cycle arrest in G0/G1 phases414,415. In our work we
proved that increased levels of HNF1β by vorinostat is associated with cell cycle arrest
and apoptosis in CCC cells. This observation was deeply related with increased
acetylation load of HNF1β. The increased acetylation levels related to HDACIs exposure
was already described for other proteins that are not histones, for example the tumor
suppressor p53421–424, although it is a completely new concept in HNF1β that we are
currently experimentally depicting. However, since HNF1β has a pro-survival activity,
this work showed that its acetylation can be a route of HDACIs action in CCC cells,
altering its function in a way of decreasing cell proliferation and viability. Again it

Chapter 7
159
becomes evident that the action of HDACIs, although initially they have been designed
to affect the acetylation level of histones, also affects the function of other proteins
which play crucial roles in cell function420 421–423.
Together, our study provided new evidences of HNF1β role in CCC. Further
studies are needed in order to unravel the function of HNF1β, especially in the context
of cancer, since HNF1β is consistently de novo expressed or overexpressed in CCC from
different organs such as ovarian, pancreas, kidney and liver399,425–427.
At the light of our findings we can raise two more questions: 1) What is the role
of HNF1β in tumor progression?, and 2) Would an acetylation of HNF1β-target therapy
be efficient in clear cell carcinomas?
According to TGCA31, genetic alterations and epigenetic modulation of signaling
pathways have been reported in EOC, including the overexpression of Notch pathway
elements and histone deacetylases. However, no previous work has addressed the
effect of HDACIs, and in particular vorinostat, on Notch signaling in ovarian cancer.
In this PhD thesis we aimed to investigate the modulation of the Notch pathway
by vorinostat, since it was already knew the involvement of Notch pathway in ovarian
cancer biology148,152,153,310,466. With our study we revealed that vorinostat activated the
Notch pathway in both CCC and HGSC cell lines, through different Notch elements. In
CCC, the activation of Notch pathway appeared to occur through Delta-like (Dll) ligands
1, 2 and 3, whereas in HGSC Dll1 and Jagged 1 and 2 ligands were involved. Also, our
results ensure the activation of Notch pathway in EOC cells by vorinostat because it
induces the overexpression of Hes and Hey Notch target genes. Moreover, it was
shown the redundancy of Notch, Delta and Jagged elements expressed in EOC cell
lines; thus, whatever is the panel of receptor or ligands expressed on the cell
membrane, the downstream target genes were always expressed in the presence of
vorinostat. This upregulation can shed a light on the mechanism underlying the failure
of vorinostat therapy in some ovarian carcinoma subsets, as shown on clinical
trials372,379,380. Again, the fact that the published clinical trials do not present the
results considering the histological type of tumor limits the confrontation of our results
with the literature.

Chapter 7
160
The final aim of this study was to establish and characterize a human cell line.
We described a HGSC cell line (IPO-SOC43) immortalized without any induced
transformation, which represents the most frequently occurring histopathological
subtype of ovarian carcinomas, the HGSC.
The cell line is maintained in 2D and 3D model exhibiting protein expression
profile similar to the primary tumor. The expression of adhesion molecules indicating
that the established cells closely mimic the natural environment found in vivo,
resembling the primary tumor.
The cell line arbors some classical features described by TGCA31, such as
alterations in DNA copy number, TP53 mutation and BRCA2 mutation. The IPO-SOC43
cell line established is a suitable model to investigate the molecular mechanisms
underlying the progression, treatment, resistance and recurrence of HGSC. We hope
this new cell line can contribute to enlarge the panel of cell lines uncovering ovarian
cancer heterogeneity, however, considering in vitro models and the development of
cell technology some questions remain to be answered: Do 3D models have an
advantage on 2D models, giving a more real picture of an ovarian cancer?, and Can 3D
models be useful tools to predict sensitivity to therapy, allowing an accurate screening
of drugs to be used individually in each patient- precision medicine?
Conclusions
In this study, our results confirmed previous reports that HDACs are expressed in
ovarian cancer, involved in tumor progression and cancer metastasis and the
epigenetic changes found could potentially serve as biomarkers for disease
progression. The research of class I and II of HDACs expression profiles evidenced their
association with different histological types of ovarian cancer. Moreover, we
demonstrated that HDACIs inhibit cell proliferation and induced cell death in ovarian
clear cell carcinoma (CCC) and in high grade serous carcinoma (HGSC), especially in
combined therapy with 5-aza-dC, carboplatin and/or paclitaxel. Our data specified
some of the putative mechanisms for apoptosis induced by HDACIs. Also, we reported
in CCC, that acetylation of HNF1β can be a way of modulating its function, turning its
Chapter 7
161
action from pro-survival to anti-survival upon exposure to vorinostat or other HDACI.
So, the description of HNF1β acetylation can constitute a mechanism of
modulation/abrogation of HNF1β pro-survival function in CCC, which can contribute
for the design of a new CCC therapy.
Furthermore, we reported that vorinostat modulates the expression of
downstream targets of the Notch pathway whatever is the panel of Notch receptor or
ligands expressed in EOC cell lines. Hence, the downstream target genes are always
expressed in the presence of vorinostat. This regulation may explain the mechanism
underlying the failure of vorinostat therapy in ovarian carcinoma, but our results did
not show a route to impair Notch pathway in ovarian cancer by using HDACIs.
In the course of this work, we demonstrated the successful establishment of a
cell line of HGSC, cultured in 2D and 3D, without lab immortalization, which can be a
new tool to study ovarian cancer biology. So far, due to the high heterogeneity of EOC
the existing models have been insufficient to accurately mimic all disease cases. This
new cell line will contribute to enrich the current panel of cell lines available for
scientific and clinical use. Moreover, in vitro models, transient/perishable or
stable/immortalized, will be for sure the most suitable tools to select more efficient
drugs and predict chemoresistance allowing an increasingly individualized medicine, in
which cells of a patient can be manipulated in vitro to select a more beneficial
therapeutic program.
In conclusion, our findings reinforced the putative efficiency of HDACs in a
combined therapy to treat ovarian cancer and we believe this thesis work contributes
with new molecular insights on how HDACIs disturbs the biological functioning of these
two different histological types of ovarian cancer (CCC and HGSC) and opens new
directions for research and therapeutic intervention and precision medicine.
Chapter 7
162
Future Perspectives
In the last decade, the surgical approach and the standardization of
chemotherapeutic modalities have slightly improved survival of epithelial ovarian
cancer (EOC) patients, however EOC still has a poor prognosis. Since the histological
types of EOC corresponds to different diseases, future developments in the
understanding of these diseases and treatment should focus on histology and its
specific molecular alterations.
Based on the fact that histone deacetylases (HDACs) expression is increased in
EOC, the research presented in this thesis contributes with some inputs to disclose the
molecular mechanisms underlying the action of histone deacetylases inhibitors
(HDACIs) in EOC. We reported that the expression profile of HDAC, class I (HDAC1, 2, 3)
and class II (HDAC4, 6 and phosphoHDAC4/5/7) in ovarian cancer is intimately
associated with the histological type. Considering this, in the future it would be
interesting to perform in vitro knockdown studies aiming the relevance of each HDAC
in the different histological types of EOC, to disclose their real role as epigenetic
biomarkers.
This thesis open up for a wide range of further investigation to explore the role
of HDACs in cancer cells pathophysiology that might have an impact on cancer therapy.
Clear cell carcinoma (CCC) is by far the most interesting and challenging EOC biological
model.
Regarding the HNF1β in CCC, we showed that Vorinostat induces both the
increased of HNF1β levels and its acetylation load concomitantly with a decreased cell
survival. This evidence is new since high levels of HNF1β are correlated to increased
cell survival. So, the meaning of HNF1β acetylation must be clarified in order to know
the role of HDACs and/or other deacetylases in the modulation of HNF1β function as
well as their relevance in CCC biology. Moreover, our group have shown recently that
HNF1β regulates the production of glutathione (GSH) which constitutes a mechanism
of resistance to carboplatin. Hence, HNF1β is still a very interesting gene/protein which
function deserves to be depicted in cancer, not only in EOC but also in other
malignancies presenting its overexpression or de novo expression. The partnership

Chapter 7
163
established by HNF1β and other molecular elements, such as p53 and BAF250a
(encoded by ARID1A) is for sure a challenge.
In our study it was not possible to include TP53 wild type CCC cell lines but it
would be interesting to evaluate how the function of HNF1β is affected (abrogated or
potentiated) by p53. Since HNF1β is a pro-survival gene in CCC and TP53 mutation is
uncommon in CCC, we believe the modulation of the action of HNF1β will be rather
different than in TP53 mutated CCC cell lines.
ARID1A is a gene that codifies BAF250a protein that belongs to a chromatin
remodeling complex and has recently been pointed out as a marker for CCC. In our
cohort we saw a perfect match between HNF1β and BAF250 expression and their
interaction remain unknown in CCC biology. Disclosing their relationship we can go
forth into a relevant step to understand CCC unique biological behavior.
The redundancy of epigenetic modulation of Notch pathway elements by
Vorinostat in EOC was also shown, indicating that Notch pathway is really central in
EOC carcinogenesis and progression and this fundamented by the way their elements
are able to overcome each other functions and sustain the expression of downstream
targets. In this point, it would be interesting to find a way other than through HDACS
to effectively disturb Notch pathway in EOC.
The results in vitro proved that there is benefits of combined therapy, using
drugs with action of epigenetic modulation and conventional therapy. Future analyses
of both primary and relapse tumors from the same patient would be an ideal way to
study chemotherapy resistance in EOC as well as new combined therapeutic regimes.
However, since secondary surgery is rarely performed, ascitic fluid which is collected
for a palliative purpose can be a good alternative to collect cancer cells, as we have
shown with the establishment of a primary cell line from a HGSC patient. Additionally,
ex vivo transient experiments using tumor explants can be an useful approach to be
optimized in order to serve as a screening platform to analyze individualized responses
of patients to therapy.
164
REFERENCES
1. Seyfried, T. N. & Shelton, L. M. Cancer as a metabolic disease. Nutr. Metab. (Lond). 7, 7 (2010).
2. Who. World cancer factsheet. World Heal. Organ. 2012, 4 (2014).
3. Reinhardt, M. J. Gynecologic tumors. Recent Results Cancer Res. 170, 141–50 (2008).
4. Bast, R. C., Hennessy, B. & Mills, G. B. The biology of ovarian cancer: new opportunities for translation. Nat. Rev. Cancer 9, 415–28 (2009).
5. Jayson, G. C., Kohn, E. C., Kitchener, H. C. & Ledermann, J. A. Ovarian cancer. The Lancet 384, (2014).
6. Ferlay, J. et al. Cancer incidence and mortality patterns in Europe: Estimates for 40 countries in 2012. Eur. J. Cancer 49, 1374–1403 (2013).
7. Bray, F., Ren, J.-S. S., Masuyer, E. & Ferlay, J. Global estimates of cancer prevalence for 27 sites in the adult population in 2008. Int. J. Cancer 132, 1133–1145 (2013).
8. Hough, C. D. et al. Large-scale serial analysis of gene expression reveals genes differentially expressed in ovarian cancer. Cancer Res. 60, 6281–7 (2000).
9. Hennessy, B. T., Coleman, R. L. & Markman, M. Ovarian cancer. Lancet 374, 1371–82 (2009).
10. Mungenast, F. & Thalhammer, T. Estrogen Biosynthesis and Action in Ovarian Cancer. Front. Endocrinol. (Lausanne). 5, 1–12 (2014).
11. Siegel, R., Naishadham, D. & Jemal, A. Cancer statistics, 2012. CA. Cancer J. Clin. 62, 10–29 (2012).
12. ROR-Centro, I. P. de O. de C. F. G.-E. Registo Oncológico Nacional 2008. (2014).
13. Liu, C.-M. Cancer of the ovary. N. Engl. J. Med. 352, 1268-9-9 (2005).
14. Risch, H. A. et al. Population BRCA1 and BRCA2 mutation frequencies and cancer penetrances: a kin-cohort study in Ontario, Canada. J. Natl. Cancer Inst. 98, 1694–706 (2006).
15. Aysal, A. et al. Ovarian Endometrioid Adenocarcinoma. Am. J. Surg. Pathol. 36, 163–172 (2012).
16. de Pauw, A. et al. [Hereditary forms of ovarian cancer]. Bull. Cancer 99, 453–62 (2012).
17. Couch, F. J., Nathanson, K. L. & Offit, K. Two decades after BRCA: setting paradigms in personalized cancer care and prevention. Science 343, 1466–70 (2014).
18. Koornstra, J. J. et al. Management of extracolonic tumours in patients with Lynch syndrome. Lancet. Oncol. 10, 400–8 (2009).
19. Beral, V., Doll, R., Hermon, C., Peto, R. & Reeves, G. Ovarian cancer and oral contraceptives: collaborative reanalysis of data from 45 epidemiological studies including 23,257 women with ovarian cancer and 87,303 controls. Lancet 371, 303–14 (2008).

165
20. Gadducci, A., Biglia, N., Cosio, S., Sismondi, P. & Genazzani, A. R. Gynaecologic challenging issues in the management of BRCA mutation carriers: oral contraceptives, prophylactic salpingo-oophorectomy and hormone replacement therapy. Gynecol. Endocrinol. 26, 568–577 (2010).
21. Siegel, R., Naishadham, D. & Jemal, A. Cancer statistics, 2013. CA. Cancer J. Clin. 63, 11–30 (2013).
22. Kurman, R. J. & Shih, I.-M. Pathogenesis of ovarian cancer: lessons from morphology and molecular biology and their clinical implications. Int. J. Gynecol. Pathol. 27, 151–60 (2008).
23. Kurman, R. J. & Shih, I.-M. Molecular pathogenesis and extraovarian origin of epithelial ovarian cancer--shifting the paradigm. Hum. Pathol. 42, 918–31 (2011).
24. Kurman, R. J. & Shih, I.-M. The Dualistic Model of Ovarian Carcinogenesis Revisited, Revised, and Expanded. (2016). doi:10.1016/j.ajpath.2015.11.011
25. Smolle, E. et al. Targeting signaling pathways in epithelial ovarian cancer. Int. J. Mol. Sci. 14, 9536–55 (2013).
26. Prat, J. Ovarian carcinomas: five distinct diseases with different origins, genetic alterations, and clinicopathological features. Virchows Arch. 460, 237–49 (2012).
27. Cho, K. R. & Shih, I.-M. Ovarian cancer. Annu. Rev. Pathol. 4, 287–313 (2009).
28. Shih, I.-M. & Kurman, R. J. Ovarian Tumorigenesis. Am. J. Pathol. 164, 1511–1518 (2004).
29. Landen, C. N., Birrer, M. J. & Sood, A. K. Early Events in the Pathogenesis of Epithelial Ovarian Cancer. J. Clin. Oncol. 26, 995–1005 (2008).
30. Kurman, R. J. & Shih, I.-M. The origin and pathogenesis of epithelial ovarian cancer: a proposed unifying theory. Am. J. Surg. Pathol. 34, 433–43 (2010).
31. Cancer Genome Atlas Research Network. Integrated genomic analyses of ovarian carcinoma. Nature 474, 609–15 (2011).
32. Jones, P. M. & Drapkin, R. Modeling High-Grade Serous Carcinoma: How Converging Insights into Pathogenesis and Genetics are Driving Better Experimental Platforms. Front. Oncol. 3, 217 (2013).
33. Karst, A. M. & Drapkin, R. Ovarian Cancer Pathogenesis: A Model in Evolution. J. Oncol. 2010, 1–13 (2010).
34. WG., M. Morphological subtypes of ovarian carcinoma: a review with emphasis on new developments and pathogenesis. Pathology (2011).
35. Gershenson, D. M. et al. Clinical behavior of stage II-IV low-grade serous carcinoma of the ovary. Obstet. Gynecol. 108, 361–8 (2006).
36. Burotto, M., Chiou, V. L., Lee, J.-M. & Kohn, E. C. The MAPK pathway across different malignancies: a new perspective. Cancer 120, 3446–56 (2014).
37. Köbel, M. et al. Ovarian carcinoma subtypes are different diseases: implications for biomarker studies. PLoS Med. 5, e232 (2008).
38. Malpica, A. et al. Grading ovarian serous carcinoma using a two-tier system. Am. J. Surg. Pathol. 28, 496–504 (2004).

166
39. Singer, G. et al. Patterns of p53 mutations separate ovarian serous borderline tumors and low- and high-grade carcinomas and provide support for a new model of ovarian carcinogenesis: a mutational analysis with immunohistochemical correlation. Am. J. Surg. Pathol. 29, 218–24 (2005).
40. Köbel, M. et al. A limited panel of immunomarkers can reliably distinguish between clear cell and high-grade serous carcinoma of the ovary. Am. J. Surg. Pathol. 33, 14–21 (2009).
41. Nakayama, K. et al. Amplicon profiles in ovarian serous carcinomas. Int. J. Cancer 120, 2613–7 (2007).
42. Patch, A.-M. et al. Whole–genome characterization of chemoresistant ovarian cancer. Nature 521, 489–494 (2015).
43. Bayani, J. et al. Parallel analysis of sporadic primary ovarian carcinomas by spectral karyotyping, comparative genomic hybridization, and expression microarrays. Cancer Res. 62, 3466–76 (2002).
44. Wiegand, K. C. et al. ARID1A mutations in endometriosis-associated ovarian carcinomas. N. Engl. J. Med. 363, 1532–43 (2010).
45. Prat, J. Pathology of the Ovary. (2004).
46. Lee, K., Tavassoli, F., Prat, J. & Dietel, M. Surface epithelial-stromal tumours. World Heal. Organ. … (2003).
47. Sato, N. et al. Loss of heterozygosity on 10q23.3 and mutation of the tumor suppressor gene PTEN in benign endometrial cyst of the ovary: possible sequence progression from benign endometrial cyst to endometrioid carcinoma and clear cell carcinoma of the ovary. Cancer Res. 60, 7052–6 (2000).
48. Palacios, J. & Gamallo, C. Mutations in the {beta}-Catenin Gene (CTNNB1) in Endometrioid Ovarian Carcinomas. Cancer Res. 58, 1344–1347 (1998).
49. Lu, K. H. & Daniels, M. Endometrial and ovarian cancer in women with Lynch syndrome: update in screening and prevention. Fam. Cancer 12, 273–277 (2013).
50. Gras, E. et al. Microsatellite instability, MLH-1 promoter hypermethylation, and frameshift mutations at coding mononucleotide repeat microsatellites in ovarian tumors. Cancer 92, 2829–36 (2001).
51. Moreno-Bueno, G. et al. beta-Catenin expression pattern, beta-catenin gene mutations, and microsatellite instability in endometrioid ovarian carcinomas and synchronous endometrial carcinomas. Diagn. Mol. Pathol. 10, 116–22 (2001).
52. Wiegand, K. C. et al. Loss of BAF250a (ARID1A) is frequent in high-grade endometrial carcinomas. J. Pathol. 224, 328–33 (2011).
53. Yamamoto, S., Tsuda, H., Takano, M., Tamai, S. & Matsubara, O. Loss of ARID1A protein expression occurs as an early event in ovarian clear-cell carcinoma development and frequently coexists with PIK3CA mutations. Mod. Pathol. an Off. J. United States Can. Acad. Pathol. Inc 25, 615–24 (2012).
54. Prat, J. New insights into ovarian cancer pathology. Ann. Oncol. 23, (2012).
55. del Carmen, M. G., Birrer, M. & Schorge, J. O. Clear cell carcinoma of the ovary: a review of the literature. Gynecol. Oncol. 126, 481–90 (2012).

167
56. Sugiyama, T. et al. Clinical characteristics of clear cell carcinoma of the ovary: a distinct histologic type with poor prognosis and resistance to platinum-based chemotherapy. Cancer 88, 2584–9 (2000).
57. Jones, S. Frequent Mutations of Chromatin Remodeling Gene ARID1A in Ovarian. Biochemistry 228, 228–231 (2010).
58. Shigetomi, H. et al. The role of components of the chromatin modification machinery in carcinogenesis of clear cell carcinoma of the ovary (Review). Oncol. Lett. 2, 591–597 (2011).
59. Katagiri, A. et al. Loss of ARID1A expression is related to shorter progression-free survival and chemoresistance in ovarian clear cell carcinoma. Mod. Pathol. an Off. J. United States Can. Acad. Pathol. Inc 25, 282–8 (2012).
60. Campbell, I. G. et al. Mutation of the PIK3CA gene in ovarian and breast cancer. Cancer Res. 64, 7678–81 (2004).
61. Guan, B., Wang, T.-L. & Shih, I.-M. ARID1A, a factor that promotes formation of SWI/SNF-mediated chromatin remodeling, is a tumor suppressor in gynecologic cancers. Cancer Res. 71, 6718–27 (2011).
62. Ayhan, A. et al. Loss of ARID1A expression is an early molecular event in tumor progression from ovarian endometriotic cyst to clear cell and endometrioid carcinoma. Int. J. Gynecol. Cancer 22, 1310–5 (2012).
63. Press, J. Z. et al. Ovarian carcinomas with genetic and epigenetic BRCA1 loss have distinct molecular abnormalities. BMC Cancer 8, 17 (2008).
64. Kotsopoulos, I. C. et al. Serous ovarian cancer signaling pathways. Int. J. Gynecol. Cancer 24, 410–7 (2014).
65. Banerjee, S. & Kaye, S. B. New strategies in the treatment of ovarian cancer: current clinical perspectives and future potential. Clin. Cancer Res. 19, 961–8 (2013).
66. Yamaguchi, K. et al. Epigenetic determinants of ovarian clear cell carcinoma biology. Int. J. cancer 135, 585–97 (2014).
67. Kato, N., Sasou, S. & Motoyama, T. Expression of hepatocyte nuclear factor-1beta (HNF-1beta) in clear cell tumors and endometriosis of the ovary. Mod. Pathol. 19, 83–9 (2006).
68. Kobayashi, H. et al. The role of hepatocyte nuclear factor-1beta in the pathogenesis of clear cell carcinoma of the ovary. Int. J. Gynecol. Cancer 19, 471–9 (2009).
69. Cuff, J. et al. Integrative bioinformatics links HNF1B with clear cell carcinoma and tumor-associated thrombosis. PLoS One 8, e74562 (2013).
70. Terasawa, K. et al. Epigenetic inactivation of TCF2 in ovarian cancer and various cancer cell lines. Br. J. Cancer 94, 914–21 (2006).
71. Kato, N., Tamura, G. & Motoyama, T. Hypomethylation of hepatocyte nuclear factor-1beta (HNF-1beta) CpG island in clear cell carcinoma of the ovary. Virchows Arch. 452, 175–80 (2008).
72. Lopes-Coelho, F. et al. HNF1β drives glutathione (GSH) synthesis underlying intrinsic carboplatin resistance of ovarian clear cell carcinoma (OCCC). Tumor Biol. 37, 4813–4829 (2016).

168
73. Kurman, R. J., International Agency for Research on Cancer. & World Health Organization. WHO classification of tumours of female reproductive organs. (International Agency for Research on Cancer, 2014).
74. Rodríguez, I. M. & Prat, J. Mucinous tumors of the ovary: a clinicopathologic analysis of 75 borderline tumors (of intestinal type) and carcinomas. Am. J. Surg. Pathol. 26, 139–52 (2002).
75. Lee, K. R. & Scully, R. E. Mucinous tumors of the ovary: a clinicopathologic study of 196 borderline tumors (of intestinal type) and carcinomas, including an evaluation of 11 cases with ‘pseudomyxoma peritonei’. Am. J. Surg. Pathol. 24, 1447–64 (2000).
76. Silverberg, S. G. et al. Borderline ovarian tumors: key points and workshop summary. Hum. Pathol. 35, 910–7 (2004).
77. Heinzelmann-Schwarz, V. A. et al. A distinct molecular profile associated with mucinous epithelial ovarian cancer. Br. J. Cancer 94, 904–913 (2006).
78. Cuatrecasas, M., Villanueva, A., Matias-Guiu, X. & Prat, J. K-ras mutations in mucinous ovarian tumors: a clinicopathologic and molecular study of 95 cases. Cancer 79, 1581–6 (1997).
79. Twombly, R. Cancer Killer May Be ‘Silent’ No More. JNCI J. Natl. Cancer Inst. 99, 1359–1361 (2007).
80. Winter, W. E. et al. Prognostic Factors for Stage III Epithelial Ovarian Cancer: A Gynecologic Oncology Group Study. J. Clin. Oncol. 25, 3621–3627 (2007).
81. Smith, L. H. et al. Ovarian cancer: Can we make the clinical diagnosis earlier? Cancer 104, 1398–1407 (2005).
82. Roett, M. A. & Evans, P. Ovarian Cancer : An Overview. 80, (2009).
83. Høgdall, E. V. S. et al. CA125 expression pattern, prognosis and correlation with serum CA125 in ovarian tumor patients. From The Danish ‘MALOVA’ Ovarian Cancer Study. Gynecol. Oncol. 104, 508–15 (2007).
84. Badgwell, D. & Bast, R. C. Early detection of ovarian cancer. Dis. Markers 23, 397–410 (2007).
85. Barakat, R., Berchuck, A., Markman, M. & Randall, M. E. Principles and Practice of Gynecologic Oncology. (Lippincott Williams & Wilkins, 2013).
86. Ricardo, S. et al. Detection of glyco-mucin profiles improves specificity of MUC16 and MUC1 biomarkers in ovarian serous tumours. Mol. Oncol. 9, 503–12 (2015).
87. Schummer, M. et al. Comparative hybridization of an array of 21,500 ovarian cDNAs for the discovery of genes overexpressed in ovarian carcinomas. Gene 238, 375–85 (1999).
88. Drapkin, R. et al. Human epididymis protein 4 (HE4) is a secreted glycoprotein that is overexpressed by serous and endometrioid ovarian carcinomas. Cancer Res. 65, 2162–9 (2005).
89. Hellström, I. et al. The HE4 (WFDC2) protein is a biomarker for ovarian carcinoma. Cancer Res. 63, 3695–700 (2003).
90. Moore, R. G. et al. The use of multiple novel tumor biomarkers for the detection of ovarian carcinoma in patients with a pelvic mass. Gynecol. Oncol. 108, 402–8 (2008).

169
91. Moore, R. G. et al. A novel multiple marker bioassay utilizing HE4 and CA125 for the prediction of ovarian cancer in patients with a pelvic mass. Gynecol. Oncol. 112, 40–46 (2009).
92. Huhtinen, K. et al. Serum HE4 concentration differentiates malignant ovarian tumours from ovarian endometriotic cysts. Br. J. Cancer 100, 1315–9 (2009).
93. Van Holsbeke, C. et al. Ultrasound methods to distinguish between malignant and benign adnexal masses in the hands of examiners with different levels of experience. Ultrasound Obstet. Gynecol. 34, 454–61 (2009).
94. Lacey, J. V. et al. Ovarian Cancer Screening in Women With a Family History of Breast or Ovarian Cancer. Obstet. Gynecol. 108, 1176–1184 (2006).
95. Robboy, S. J. Robboy’s Pathology of the Female Reproductive Tract. (Elsevier Health Sciences, 2009).
96. Gubbels, J. A., Claussen, N., Kapur, A. K., Connor, J. P. & Patankar, M. S. The detection, treatment, and biology of epithelial ovarian cancer. J. Ovarian Res. 3, 8 (2010).
97. Ozols, R. F. Phase III Trial of Carboplatin and Paclitaxel Compared With Cisplatin and Paclitaxel in Patients With Optimally Resected Stage III Ovarian Cancer: A Gynecologic Oncology Group Study. J. Clin. Oncol. 21, 3194–3200 (2003).
98. Armstrong, D. K. et al. Intraperitoneal cisplatin and paclitaxel in ovarian cancer. N. Engl. J. Med. 354, 34–43 (2006).
99. Le Page, C., Huntsman, D. G., Provencher, D. M. & Mes-Masson, A.-M. Predictive and Prognostic Protein Biomarkers in Epithelial Ovarian Cancer: Recommendation for Future Studies. Cancers (Basel). 2, 913–954 (2010).
100. Siddik, Z. H. Cisplatin: mode of cytotoxic action and molecular basis of resistance. Oncogene 22, 7265–79 (2003).
101. Kelland, L. The resurgence of platinum-based cancer chemotherapy. Nat. Rev. Cancer 7, 573–84 (2007).
102. van der Vijgh, W. J. Clinical pharmacokinetics of carboplatin. Clin. Pharmacokinet. 21, 242–61 (1991).
103. Boulikas, T. & Vougiouka, M. Cisplatin and platinum drugs at the molecular level. (Review). Oncol. Rep. 10, 1663–82
104. Jamieson, E. R. & Lippard, S. J. Structure, Recognition, and Processing of Cisplatin-DNA Adducts. Chem. Rev. 99, 2467–98 (1999).
105. Todd, R. C. & Lippard, S. J. Inhibition of transcription by platinum antitumor compounds. Metallomics 1, 280–91 (2009).
106. Knox, R. J., Friedlos, F., Lydall, D. A. & Roberts, J. J. Mechanism of cytotoxicity of anticancer platinum drugs: evidence that cis-diamminedichloroplatinum(II) and cis-diammine-(1,1-cyclobutanedicarboxylato)platinum(II) differ only in the kinetics of their interaction with DNA. Cancer Res. 46, 1972–9 (1986).
107. Rixe, O. et al. Oxaliplatin, tetraplatin, cisplatin, and carboplatin: spectrum of activity in drug-resistant cell lines and in the cell lines of the National Cancer Institute’s Anticancer Drug Screen panel. Biochem. Pharmacol. 52, 1855–65 (1996).
108. Gligorov, J. & Lotz, J. P. Preclinical pharmacology of the taxanes: implications of the differences. Oncologist 9 Suppl 2, 3–8 (2004).

170
109. Cragg, G. M. Paclitaxel (Taxol): a success story with valuable lessons for natural product drug discovery and development. Med. Res. Rev. 18, 315–31 (1998).
110. Bharadwaj, R. & Yu, H. The spindle checkpoint, aneuploidy, and cancer. Oncogene 23, 2016–27 (2004).
111. Brito, D. A., Yang, Z. & Rieder, C. L. Microtubules do not promote mitotic slippage when the spindle assembly checkpoint cannot be satisfied. J. Cell Biol. 182, 623–629 (2008).
112. Ganguly, A., Yang, H. & Cabral, F. Paclitaxel-dependent cell lines reveal a novel drug activity. Mol. Cancer Ther. 9, 2914–23 (2010).
113. Zhou, J. & Giannakakou, P. Targeting Microtubules for Cancer Chemotherapy. Curr. Med. Chem. Agents 5, 65–71 (2005).
114. Yasuda, M. et al. [Dose finding study of paclitaxel and carboplatin for ovarian cancer (JKTB)]. Gan To Kagaku Ryoho. 28, 493–8 (2001).
115. Dumontet, C. & Jordan, M. A. Microtubule-binding agents: a dynamic field of cancer therapeutics. Nat. Rev. Drug Discov. 9, 790–803 (2010).
116. Alexandre, J. et al. Accumulation of hydrogen peroxide is an early and crucial step for paclitaxel-induced cancer cell death both in vitro and in vivo. Int. J. Cancer 119, 41–8 (2006).
117. Ramanathan, B. Resistance to Paclitaxel Is Proportional to Cellular Total Antioxidant Capacity. Cancer Res. 65, 8455–8460 (2005).
118. Di Nicolantonio, F. et al. Cancer cell adaptation to chemotherapy. BMC Cancer 5, 78 (2005).
119. Lloyd, K. L. et al. Prediction of resistance to chemotherapy in ovarian cancer: a systematic review. BMC Cancer 15, 117 (2015).
120. Xia, C. et al. Reactive oxygen species regulate angiogenesis and tumor growth through vascular endothelial growth factor. Cancer Res. 67, 10823–30 (2007).
121. Lee, J. M. Inhibition of p53-dependent apoptosis by the KIT tyrosine kinase: regulation of mitochondrial permeability transition and reactive oxygen species generation. Oncogene 17, 1653–62 (1998).
122. Storz, P. Reactive oxygen species in tumor progression. Front. Biosci. 10, 1881–96 (2005).
123. Rhee, S. G., Bae, Y. S., Lee, S.-R. & Kwon, J. Hydrogen Peroxide: A Key Messenger That Modulates Protein Phosphorylation Through Cysteine Oxidation. Sci. Signal. 2000, pe1-pe1 (2000).
124. Brozovic, A., Ambriović-Ristov, A. & Osmak, M. The relationship between cisplatin-induced reactive oxygen species, glutathione, and BCL-2 and resistance to cisplatin. Crit. Rev. Toxicol. 40, 347–59 (2010).
125. Wondrak, G. T. Redox-directed cancer therapeutics: molecular mechanisms and opportunities. Antioxid. Redox Signal. 11, 3013–69 (2009).
126. Gottesman, M. M., Fojo, T. & Bates, S. E. Multidrug resistance in cancer: role of ATP-dependent transporters. Nat. Rev. Cancer 2, 48–58 (2002).
127. Szakács, G., Paterson, J. K., Ludwig, J. A., Booth-Genthe, C. & Gottesman, M. M. Targeting multidrug resistance in cancer. Nat. Rev. Drug Discov. 5, 219–34 (2006).
171
128. Gonçalves, A. et al. Resistance to Taxol in lung cancer cells associated with increased microtubule dynamics. Proc. Natl. Acad. Sci. U. S. A. 98, 11737–42 (2001).
129. Kavallaris, M. et al. Taxol-resistant epithelial ovarian tumors are associated with altered expression of specific beta-tubulin isotypes. J. Clin. Invest. 100, 1282–1293 (1997).
130. Abdullah, L. N. & Chow, E. K.-H. Mechanisms of chemoresistance in cancer stem cells. Clin. Transl. Med. 2, 3 (2013).
131. Saldanha, S. N. & Tollefsbol, T. O. Pathway modulations and epigenetic alterations in ovarian tumorbiogenesis. J. Cell. Physiol. 229, 393–406 (2014).
132. Perdigoto, C. N. & Bardin, A. J. Sending the right signal: Notch and stem cells. Biochim. Biophys. Acta 1830, 2307–22 (2013).
133. Nickoloff, B. J., Osborne, B. A. & Miele, L. Notch signaling as a therapeutic target in cancer: a new approach to the development of cell fate modifying agents. Oncogene 22, 6598–608 (2003).
134. Aster, J. C. & Blacklow, S. C. Targeting the Notch Pathway: Twists and Turns on the Road to Rational Therapeutics. J. Clin. Oncol. 30, 2418–2420 (2012).
135. Ranganathan, P., Weaver, K. L. & Capobianco, A. J. Notch signalling in solid tumours: a little bit of everything but not all the time. Nat. Rev. Cancer 11, 338–51 (2011).
136. Takebe, N., Nguyen, D. & Yang, S. X. Targeting notch signaling pathway in cancer: clinical development advances and challenges. Pharmacol. Ther. 141, 140–9 (2014).
137. Fleming, R. J., Purcell, K. & Artavanis-Tsakonas, S. The NOTCH receptor and its ligands. Trends Cell Biol. 7, 437–41 (1997).
138. Lendahl, U. A growing family of Notch ligands. Bioessays 20, 103–7 (1998).
139. Gray, G. E. et al. Human ligands of the Notch receptor. Am. J. Pathol. 154, 785–94 (1999).
140. Yamaguchi, E. et al. Expression of Notch ligands, Jagged1, 2 and Delta1 in antigen presenting cells in mice. Immunol. Lett. 81, 59–64 (2002).
141. Logeat, F. et al. The Notch1 receptor is cleaved constitutively by a furin-like convertase. Proc. Natl. Acad. Sci. U. S. A. 95, 8108–12 (1998).
142. Fortini, M. E. Gamma-secretase-mediated proteolysis in cell-surface-receptor signalling. Nat. Rev. Mol. Cell Biol. 3, 673–84 (2002).
143. Kao, H. Y. et al. A histone deacetylase corepressor complex regulates the Notch signal transduction pathway. Genes Dev. 12, 2269–77 (1998).
144. Ronchini, C. & Capobianco, A. J. Induction of cyclin D1 transcription and CDK2 activity by Notch(ic): implication for cell cycle disruption in transformation by Notch(ic). Mol. Cell. Biol. 21, 5925–34 (2001).
145. Weng, A. P. et al. c-Myc is an important direct target of Notch1 in T-cell acute lymphoblastic leukemia/lymphoma. Genes Dev. 20, 2096–109 (2006).
146. Hirose, H. et al. Notch pathway as candidate therapeutic target in Her2/Neu/ErbB2 receptor-negative breast tumors. Oncol. Rep. 23, 35–43 (2010).
147. Yamaguchi, H., Chang, S.-S., Hsu, J. L. & Hung, M.-C. Signaling cross-talk in the resistance to HER family receptor targeted therapy. Oncogene 33, 1073–1081 (2013).
172
148. Park, J. T. et al. Notch3 gene amplification in ovarian cancer. Cancer Res. 66, 6312–8 (2006).
149. Jung, S. G. et al. Prognostic significance of Notch 3 gene expression in ovarian serous carcinoma. Cancer Sci. 101, 1977–83 (2010).
150. Hopfer, O., Zwahlen, D., Fey, M. F. & Aebi, S. The Notch pathway in ovarian carcinomas and adenomas. Br. J. Cancer 93, 709–718 (2005).
151. Park, J. T. et al. Notch3 overexpression is related to the recurrence of ovarian cancer and confers resistance to carboplatin. Am. J. Pathol. 177, 1087–94 (2010).
152. McAuliffe, S. M. et al. Targeting Notch, a key pathway for ovarian cancer stem cells, sensitizes tumors to platinum therapy. Proc. Natl. Acad. Sci. U. S. A. 109, E2939-48 (2012).
153. Rose, S. L., Kunnimalaiyaan, M., Drenzek, J. & Seiler, N. Notch 1 signaling is active in ovarian cancer. Gynecol. Oncol. 117, 130–133 (2010).
154. Wang, M., Wu, L., Wang, L. & Xin, X. Down-regulation of Notch1 by gamma-secretase inhibition contributes to cell growth inhibition and apoptosis in ovarian cancer cells A2780. Biochem. Biophys. Res. Commun. 393, 144–149 (2010).
155. Yap, T. A., Carden, C. P. & Kaye, S. B. Beyond chemotherapy: targeted therapies in ovarian cancer. Nat. Rev. Cancer 9, 167–181 (2009).
156. Longuespée, R. et al. Ovarian cancer molecular pathology. Cancer Metastasis Rev. 31, 713–732 (2012).
157. Toss, A. et al. Ovarian Cancer: Can Proteomics Give New Insights for Therapy and Diagnosis? Int. J. Mol. Sci. 14, 8271–8290 (2013).
158. Pohl, G. et al. Inactivation of the mitogen-activated protein kinase pathway as a potential target-based therapy in ovarian serous tumors with KRAS or BRAF mutations. Cancer Res. 65, 1994–2000 (2005).
159. Janku, F. et al. PI3K/AKT/mTOR inhibitors in patients with breast and gynecologic malignancies harboring PIK3CA mutations. J. Clin. Oncol. 30, 777–82 (2012).
160. Li, H., Zeng, J. & Shen, K. PI3K/AKT/mTOR signaling pathway as a therapeutic target for ovarian cancer. Arch. Gynecol. Obstet. 290, 1067–1078 (2014).
161. Edkins, S. et al. Recurrent KRAS codon 146 mutations in human colorectal cancer. Cancer Biol. Ther. 5, 928–32 (2006).
162. Harris, T. J. R. & McCormick, F. The molecular pathology of cancer. Nat. Rev. Clin. Oncol. 7, 251–65 (2010).
163. Li, H.-T., Lu, Y.-Y., An, Y.-X., Wang, X. & Zhao, Q.-C. KRAS, BRAF and PIK3CA mutations in human colorectal cancer: relationship with metastatic colorectal cancer. Oncol. Rep. 25, 1691–7 (2011).
164. Stewart, C. J. R. et al. KRAS mutations in ovarian low-grade endometrioid adenocarcinoma: association with concurrent endometriosis. Hum. Pathol. 43, 1177–83 (2012).
165. Lee, S., Choi, E.-J., Jin, C. & Kim, D.-H. Activation of PI3K/Akt pathway by PTEN reduction and PIK3CA mRNA amplification contributes to cisplatin resistance in an ovarian cancer cell line. Gynecol. Oncol. 97, 26–34 (2005).

173
166. Dobbin, Z. C. & Landen, C. N. The Importance of the PI3K/AKT/MTOR Pathway in the Progression of Ovarian Cancer. Int. J. Mol. Sci. 14, 8213–27 (2013).
167. Cantley, L. C. & Neel, B. G. New insights into tumor suppression: PTEN suppresses tumor formation by restraining the phosphoinositide 3-kinase/AKT pathway. Proc. Natl. Acad. Sci. U. S. A. 96, 4240–5 (1999).
168. Meng, Q., Xia, C., Fang, J., Rojanasakul, Y. & Jiang, B.-H. Role of PI3K and AKT specific isoforms in ovarian cancer cell migration, invasion and proliferation through the p70S6K1 pathway. Cell. Signal. 18, 2262–71 (2006).
169. Yan, X., Fraser, M., Qiu, Q. & Tsang, B. K. Over-expression of PTEN sensitizes human ovarian cancer cells to cisplatin-induced apoptosis in a p53-dependent manner. Gynecol. Oncol. 102, 348–55 (2006).
170. Paige, A. J. & Brown, R. Pharmaco(epi)genomics in ovarian cancer. Pharmacogenomics 9, 1825–1834 (2008).
171. Blanco-Aparicio, C., Renner, O., Leal, J. F. M. & Carnero, A. PTEN, more than the AKT pathway. Carcinogenesis 28, 1379–86 (2007).
172. Manning, B. D. & Cantley, L. C. AKT/PKB signaling: navigating downstream. Cell 129, 1261–74 (2007).
173. Datta, S. R. et al. Survival factor-mediated BAD phosphorylation raises the mitochondrial threshold for apoptosis. Dev. Cell 3, 631–43 (2002).
174. Wullschleger, S., Loewith, R. & Hall, M. N. TOR signaling in growth and metabolism. Cell 124, 471–84 (2006).
175. Mabuchi, S., Hisamatsu, T. & Kimura, T. Targeting mTOR signaling pathway in ovarian cancer. Curr. Med. Chem. 18, 2960–8 (2011).
176. No, J. H. et al. Activation of mTOR signaling pathway associated with adverse prognostic factors of epithelial ovarian cancer. Gynecol. Oncol. 121, 8–12 (2011).
177. Ho, K. K., Myatt, S. S. & Lam, E. W.-F. Many forks in the path: cycling with FoxO. Oncogene 27, 2300–11 (2008).
178. Liang, J. et al. PKB/Akt phosphorylates p27, impairs nuclear import of p27 and opposes p27-mediated G1 arrest. Nat. Med. 8, 1153–60 (2002).
179. Liang, J. & Slingerland, J. M. Multiple roles of the PI3K/PKB (Akt) pathway in cell cycle progression. Cell Cycle 2, 339–45 (2003).
180. Roy, S. K., Srivastava, R. K. & Shankar, S. Inhibition of PI3K/AKT and MAPK/ERK pathways causes activation of FOXO transcription factor, leading to cell cycle arrest and apoptosis in pancreatic cancer. J. Mol. Signal. 5, 10 (2010).
181. Zanella, F., Link, W. & Carnero, A. Understanding FOXO, new views on old transcription factors. Curr. Cancer Drug Targets 10, 135–46 (2010).
182. Kajihara, T. et al. Differential Expression of FOXO1 and FOXO3a Confers Resistance to Oxidative Cell Death upon Endometrial Decidualization. Mol. Endocrinol. (2013).
183. Sunters, A. et al. Paclitaxel-induced nuclear translocation of FOXO3a in breast cancer cells is mediated by c-Jun NH2-terminal kinase and Akt. Cancer Res. 66, 212–20 (2006).
184. Sunters, A. et al. FoxO3a transcriptional regulation of Bim controls apoptosis in paclitaxel-treated breast cancer cell lines. J. Biol. Chem. 278, 49795–805 (2003).

174
185. Hui, R. C.-Y. et al. Doxorubicin activates FOXO3a to induce the expression of multidrug resistance gene ABCB1 (MDR1) in K562 leukemic cells. Mol. Cancer Ther. 7, 670–8 (2008).
186. Francis, R. E. et al. FoxM1 is a downstream target and marker of HER2 overexpression in breast cancer. Int. J. Oncol. 35, 57–68 (2009).
187. Krol, J. et al. The transcription factor FOXO3a is a crucial cellular target of gefitinib (Iressa) in breast cancer cells. Mol. Cancer Ther. 6, 3169–79 (2007).
188. Fernandez de Mattos, S. et al. FoxO3a and BCR-ABL Regulate cyclin D2 Transcription through a STAT5/BCL6-Dependent Mechanism. Mol. Cell. Biol. 24, 10058–10071 (2004).
189. Birkenkamp, K. U. et al. FOXO3a induces differentiation of Bcr-Abl-transformed cells through transcriptional down-regulation of Id1. J. Biol. Chem. 282, 2211–20 (2007).
190. Myatt, S. S. & Lam, E. W.-F. The emerging roles of forkhead box (Fox) proteins in cancer. Nat. Rev. Cancer 7, 847–59 (2007).
191. Wilson, M. S. C., Brosens, J. J., Schwenen, H. D. C. & Lam, E. W.-F. FOXO and FOXM1 in cancer: the FOXO-FOXM1 axis shapes the outcome of cancer chemotherapy. Curr. Drug Targets 12, 1256–66 (2011).
192. Kwok, J. M.-M. et al. FOXM1 confers acquired cisplatin resistance in breast cancer cells. Mol. Cancer Res. 8, 24–34 (2010).
193. Mencalha, A. L., Binato, R., Ferreira, G. M., Du Rocher, B. & Abdelhay, E. Forkhead box M1 (FoxM1) gene is a new STAT3 transcriptional factor target and is essential for proliferation, survival and DNA repair of K562 cell line. PLoS One 7, e48160 (2012).
194. Yang, C. et al. Inhibition of FOXM1 transcription factor suppresses cell proliferation and tumor growth of breast cancer. Cancer Gene Ther. 20, 117–24 (2013).
195. Wang, Z. et al. FoxM1 is a Novel Target of a Natural Agent in Pancreatic Cancer. Pharm. Res. 27, 1159–1168 (2010).
196. Kinross, K. M. et al. In vivo activity of combined PI3K/mTOR and MEK inhibition in a Kras(G12D);Pten deletion mouse model of ovarian cancer. Mol. Cancer Ther. 10, 1440–9 (2011).
197. Abe, A. et al. PIK3CA overexpression is a possible prognostic factor for favorable survival in ovarian clear cell carcinoma. Hum. Pathol. 44, 199–207 (2013).
198. Huang, J. et al. Frequent genetic abnormalities of the PI3K/AKT pathway in primary ovarian cancer predict patient outcome. Genes. Chromosomes Cancer 50, 606–18 (2011).
199. Rivlin, N., Brosh, R., Oren, M. & Rotter, V. Mutations in the p53 Tumor Suppressor Gene: Important Milestones at the Various Steps of Tumorigenesis. Genes Cancer 2, 466–74 (2011).
200. Kandoth, C. et al. Mutational landscape and significance across 12 major cancer types. Nature 502, 333–9 (2013).
201. Hammond, E. M. & Giaccia, A. J. The role of p53 in hypoxia-induced apoptosis. Biochem. Biophys. Res. Commun. 331, 718–25 (2005).
202. Hoffman, W. H., Biade, S., Zilfou, J. T., Chen, J. & Murphy, M. Transcriptional repression of the anti-apoptotic survivin gene by wild type p53. J. Biol. Chem. 277, 3247–57 (2002).

175
203. Vogelstein, B., Lane, D. & Levine, A. J. Surfing the p53 network. Nature 408, 307–10 (2000).
204. Bartel, F. et al. Both germ line and somatic genetics of the p53 pathway affect ovarian cancer incidence and survival. Clin. Cancer Res. 14, 89–96 (2008).
205. de Graeff, P. et al. Modest effect of p53, EGFR and HER-2/neu on prognosis in epithelial ovarian cancer: a meta-analysis. Br. J. Cancer 101, 149–59 (2009).
206. Gadducci, A., Cosio, S., Tana, R. & Genazzani, A. R. Serum and tissue biomarkers as predictive and prognostic variables in epithelial ovarian cancer. Crit. Rev. Oncol. Hematol. 69, 12–27 (2009).
207. Canevari, S., Gariboldi, M., Reid, J. F., Bongarzone, I. & Pierotti, M. A. Molecular predictors of response and outcome in ovarian cancer. Crit. Rev. Oncol. Hematol. 60, 19–37 (2006).
208. Knudson, A. G. & Jr. Mutation and cancer: statistical study of retinoblastoma. Proc. Natl. Acad. Sci. U. S. A. 68, 820–3 (1971).
209. Sigal, A. & Rotter, V. Oncogenic mutations of the p53 tumor suppressor: the demons of the guardian of the genome. Cancer Res. 60, 6788–93 (2000).
210. Chène, P. In vitro analysis of the dominant negative effect of p53 mutants. J. Mol. Biol. 281, 205–9 (1998).
211. Kern, S. E. et al. Oncogenic forms of p53 inhibit p53-regulated gene expression. Science 256, 827–30 (1992).
212. Unger, T., Mietz, J. A., Scheffner, M., Yee, C. L. & Howley, P. M. Functional domains of wild-type and mutant p53 proteins involved in transcriptional regulation, transdominant inhibition, and transformation suppression. Mol. Cell. Biol. 13, 5186–94 (1993).
213. Harris, S. L. & Levine, A. J. The p53 pathway: positive and negative feedback loops. Oncogene 24, 2899–2908 (2005).
214. Piette, J., Neel, H. & Maréchal, V. Mdm2: keeping p53 under control. Oncogene 15, 1001–10 (1997).
215. Manfredi, J. J. The Mdm2-p53 relationship evolves: Mdm2 swings both ways as an oncogene and a tumor suppressor. Genes Dev. 24, 1580–9 (2010).
216. Marks, J. R. et al. Overexpression and mutation of p53 in epithelial ovarian cancer. Cancer Res. 51, 2979–84 (1991).
217. Havrilesky, L. et al. Prognostic significance of p53 mutation and p53 overexpression in advanced epithelial ovarian cancer: a Gynecologic Oncology Group Study. J. Clin. Oncol. 21, 3814–25 (2003).
218. Tai, Y. T. et al. BAX protein expression and clinical outcome in epithelial ovarian cancer. J. Clin. Oncol. 16, 2583–90 (1998).
219. Ziółkowska-Seta, I. et al. TP53, BCL-2 and BAX analysis in 199 ovarian cancer patients treated with taxane-platinum regimens. Gynecol. Oncol. 112, 179–84 (2009).
220. Ozer, H. et al. Immunohistochemistry with apoptotic-antiapoptotic proteins (p53, p21, bax, bcl-2), c-kit, telomerase, and metallothionein as a diagnostic aid in benign, borderline, and malignant serous and mucinous ovarian tumors. Diagn. Pathol. 7, 124 (2012).

176
221. Reles, A. et al. Correlation of p53 mutations with resistance to platinum-based chemotherapy and shortened survival in ovarian cancer. Clin. Cancer Res. 7, 2984–97 (2001).
222. Rose, S. L. et al. The impact of p53 protein core domain structural alteration on ovarian cancer survival. Clin. Cancer Res. 9, 4139–44 (2003).
223. Skirnisdóttir, I., Seidal, T., Gerdin, E. & Sorbe, B. The prognostic importance of p53, bcl-2, and bax in early stage epithelial ovarian carcinoma treated with adjuvant chemotherapy. Int. J. Gynecol. Cancer 12, 265–76 (2002).
224. Tan, D. S. P. & Kaye, S. Ovarian clear cell adenocarcinoma: a continuing enigma. J. Clin. Pathol. 60, 355–60 (2007).
225. Yamaguchi, K. et al. Identification of an ovarian clear cell carcinoma gene signature that reflects inherent disease biology and the carcinogenic processes. Oncogene 29, 1741–52 (2010).
226. Bach, I., Mattei, M. G., Cereghini, S. & Yaniv, M. Two members of an HNF1 homeoprotein family are expressed in human liver. Nucleic Acids Res. 19, 3553–9 (1991).
227. Horikawa, Y. et al. Mutation in hepatocyte nuclear factor-1 beta gene (TCF2) associated with MODY. Nat. Genet. 17, 384–5 (1997).
228. Tsuchiya, A. et al. Expression profiling in ovarian clear cell carcinoma: identification of hepatocyte nuclear factor-1 beta as a molecular marker and a possible molecular target for therapy of ovarian clear cell carcinoma. Am. J. Pathol. 163, 2503–12 (2003).
229. Shen, H. et al. Epigenetic analysis leads to identification of HNF1B as a subtype-specific susceptibility gene for ovarian cancer. Nat. Commun. 4, 1628 (2013).
230. Bali, A. et al. Cyclin D1, p53, and p21Waf1/Cip1 expression is predictive of poor clinical outcome in serous epithelial ovarian cancer. Clin. Cancer Res. 10, 5168–77 (2004).
231. Barbieri, F. et al. Overexpression of cyclin D1 is associated with poor survival in epithelial ovarian cancer. Oncology 66, 310–5 (2004).
232. Hashimoto, T. et al. Cyclin D1 predicts the prognosis of advanced serous ovarian cancer. Exp. Ther. Med. 2, 213–219 (2011).
233. Sherr, C. J. Cancer cell cycles. Science 274, 1672–7 (1996).
234. Gallagher, M. F. et al. Suppression of cancer stemness p21-regulating mRNA and microRNA signatures in recurrent ovarian cancer patient samples. J. Ovarian Res. 5, 2 (2012).
235. Hindley, C. & Philpott, A. Co-ordination of cell cycle and differentiation in the developing nervous system. Biochem. J. 444, 375–82 (2012).
236. Milde-Langosch, K., Hagen, M., Bamberger, A.-M. & Löning, T. Expression and prognostic value of the cell-cycle regulatory proteins, Rb, p16MTS1, p21WAF1, p27KIP1, cyclin E, and cyclin D2, in ovarian cancer. Int. J. Gynecol. Pathol. 22, 168–74 (2003).
237. Oudit, G. Y. et al. The role of phosphoinositide-3 kinase and PTEN in cardiovascular physiology and disease. J. Mol. Cell. Cardiol. 37, 449–71 (2004).
238. Anttila, M. A. et al. p21/WAF1 expression as related to p53, cell proliferation and prognosis in epithelial ovarian cancer. Br. J. Cancer 79, 1870–8 (1999).
177
239. Schmider-Ross, A. et al. Cyclin-dependent kinase inhibitors CIP1 (p21) and KIP1 (p27) in ovarian cancer. J. Cancer Res. Clin. Oncol. 132, 163–70 (2006).
240. Sharma, S., Kelly, T. K. & Jones, P. A. Epigenetics in cancer. Carcinogenesis 31, 27–36 (2010).
241. Kanwal, R. & Gupta, S. Epigenetic modifications in cancer. Clin. Genet. 81, 303–11 (2012).
242. Jones, P. A. & Baylin, S. B. The epigenomics of cancer. Cell 128, 683–92 (2007).
243. Lopez, J., Percharde, M., Coley, H. M., Webb, a & Crook, T. The context and potential of epigenetics in oncology. Br. J. Cancer 100, 571–577 (2009).
244. Nguyen, H. T., Tian, G. & Murph, M. M. Molecular epigenetics in the management of ovarian cancer: are we investigating a rational clinical promise? Front. Oncol. 4, 71 (2014).
245. Marks, P. et al. Histone deacetylases and cancer: causes and therapies. Nat. Rev. Cancer 1, 194–202 (2001).
246. Seeber, L. M. S. & van Diest, P. J. Epigenetics in ovarian cancer. Methods Mol. Biol. 863, 253–69 (2012).
247. Watson, J. Watson J.D., et al. Molecular Biology of the Gene (5th edition, 2004)b.pdf. BioScience 16, 209 (2004).
248. Kouzarides, T. Chromatin modifications and their function. Cell 128, 693–705 (2007).
249. Clark, S. J. & Melki, J. DNA methylation and gene silencing in cancer: which is the guilty party? Oncogene 21, 5380–7 (2002).
250. Gardiner-Garden, M. & Frommer, M. CpG islands in vertebrate genomes. J. Mol. Biol. 196, 261–82 (1987).
251. Lund, A. H. & van Lohuizen, M. Epigenetics and cancer. Genes Dev. 18, 2315–35 (2004).
252. Jones, P. A. & Baylin, S. B. The fundamental role of epigenetic events in cancer. Nat. Rev. Genet. 3, 415–28 (2002).
253. Baylin, S. B. & Chen, W. Y. Aberrant gene silencing in tumor progression: implications for control of cancer. Cold Spring Harb. Symp. Quant. Biol. 70, 427–33 (2005).
254. Horak, P. et al. Contribution of epigenetic silencing of tumor necrosis factor-related apoptosis inducing ligand receptor 1 (DR4) to TRAIL resistance and ovarian cancer. Mol. Cancer Res. 3, 335–43 (2005).
255. Baldwin, R. L. et al. BRCA1 promoter region hypermethylation in ovarian carcinoma: a population-based study. Cancer Res. 60, 5329–33 (2000).
256. Hilton, J. L. et al. Inactivation of BRCA1 and BRCA2 in ovarian cancer. J. Natl. Cancer Inst. 94, 1396–406 (2002).
257. McCoy, M. L., Mueller, C. R. & Roskelley, C. D. The role of the breast cancer susceptibility gene 1 (BRCA1) in sporadic epithelial ovarian cancer. Reprod. Biol. Endocrinol. 1, 72 (2003).
258. Strathdee, G. et al. Primary ovarian carcinomas display multiple methylator phenotypes involving known tumor suppressor genes. Am. J. Pathol. 158, 1121–7 (2001).
178
259. Wang, C. et al. Expression of BRCA1 protein in benign, borderline, and malignant epithelial ovarian neoplasms and its relationship to methylation and allelic loss of the BRCA1 gene. J. Pathol. 202, 215–23 (2004).
260. Yang, H.-J., Liu, V. W. S., Wang, Y., Tsang, P. C. K. & Ngan, H. Y. S. Differential DNA methylation profiles in gynecological cancers and correlation with clinico-pathological data. BMC Cancer 6, 212 (2006).
261. Bol, G. M. et al. Methylation profiles of hereditary and sporadic ovarian cancer. Histopathology 57, 363–70 (2010).
262. Rathi, A. et al. Methylation profiles of sporadic ovarian tumors and nonmalignant ovaries from high-risk women. Clin. Cancer Res. 8, 3324–31 (2002).
263. Kontorovich, T., Cohen, Y., Nir, U. & Friedman, E. Promoter methylation patterns of ATM, ATR, BRCA1, BRCA2 and p53 as putative cancer risk modifiers in Jewish BRCA1/BRCA2 mutation carriers. Breast Cancer Res. Treat. 116, 195–200 (2009).
264. Chan, K. Y. K., Ozçelik, H., Cheung, A. N. Y., Ngan, H. Y. S. & Khoo, U.-S. Epigenetic factors controlling the BRCA1 and BRCA2 genes in sporadic ovarian cancer. Cancer Res. 62, 4151–6 (2002).
265. Blasi, M. F. et al. A human cell-based assay to evaluate the effects of alterations in the MLH1 mismatch repair gene. Cancer Res. 66, 9036–44 (2006).
266. Jiricny, J. & Nyström-Lahti, M. Mismatch repair defects in cancer. Curr. Opin. Genet. Dev. 10, 157–61 (2000).
267. Murphy, M. A. & Wentzensen, N. Frequency of mismatch repair deficiency in ovarian cancer: a systematic review This article is a US Government work and, as such, is in the public domain of the United States of America. Int. J. Cancer 129, 1914–22 (2011).
268. Zhang, H. et al. Expression and promoter methylation status of mismatch repair gene hMLH1 and hMSH2 in epithelial ovarian cancer. Aust. N. Z. J. Obstet. Gynaecol. 48, 505–9 (2008).
269. Watanabe, Y. et al. A change in promoter methylation of hMLH1 is a cause of acquired resistance to platinum-based chemotherapy in epithelial ovarian cancer. Anticancer Res. 27, 1449–52
270. Tam, K. F. et al. Methylation profile in benign, borderline and malignant ovarian tumors. J. Cancer Res. Clin. Oncol. 133, 331–341 (2006).
271. Fu, S. et al. Phase 1b-2a study to reverse platinum resistance through use of a hypomethylating agent, azacitidine, in patients with platinum-resistant or platinum-refractory epithelial ovarian cancer. Cancer 117, 1661–1669 (2011).
272. Fang, F. et al. A phase 1 and pharmacodynamic study of decitabine in combination with carboplatin in patients with recurrent, platinum-resistant, epithelial ovarian cancer. Cancer 116, 4043–4053 (2010).
273. Lehrmann, H., Pritchard, L. L. & Harel-Bellan, A. Histone acetyltransferases and deacetylases in the control of cell proliferation and differentiation. Adv. Cancer Res. 86, 41–65 (2002).
274. Gallinari, P., Di Marco, S., Jones, P., Pallaoro, M. & Steinkühler, C. HDACs, histone deacetylation and gene transcription: from molecular biology to cancer therapeutics. Cell Res. 17, 195–211 (2007).

179
275. Richon, V. M., Garcia-Vargas, J. & Hardwick, J. S. Development of vorinostat: current applications and future perspectives for cancer therapy. Cancer Lett. 280, 201–10 (2009).
276. Lee, J.-H., Choy, M. L. & Marks, P. A. Mechanisms of resistance to histone deacetylase inhibitors. Adv. Cancer Res. 116, 39–86 (2012).
277. Hyun-Jung Kim, S.-C. B. Histone deacetylase inhibitors: molecular mechanisms of action and clinical trials as anti-cancer drugs. Am. J. Transl. Res. 3, 166 (2011).
278. Richon, V. M. Targeting histone deacetylases: development of vorinostat for the treatment of cancer. Epigenomics 2, 457–65 (2010).
279. Bolden, J. E., Peart, M. M. J. & Johnstone, R. R. W. Anticancer activities of histone deacetylase inhibitors. Nat. Rev. Drug Discov. 5, 769–84 (2006).
280. Bolden, J., Peart, M. & Johnstone, R. Anticancer activities of histone deacetylase inhibitors. Nat. Rev. Drug Discov. (2006).
281. Marks, P. A. & Dokmanovic, M. Histone deacetylase inhibitors: discovery and development as anticancer agents. Expert Opin. Investig. Drugs 14, 1497–511 (2005).
282. Dokmanovic, M., Clarke, C. & Marks, P. A. Histone deacetylase inhibitors: overview and perspectives. Mol. Cancer Res. 5, 981–9 (2007).
283. Blander, G. & Guarente, L. The Sir2 family of protein deacetylases. Annu. Rev. Biochem. 73, 417–35 (2004).
284. Luo, J. et al. Negative control of p53 by Sir2alpha promotes cell survival under stress. Cell 107, 137–48 (2001).
285. Firestein, R. et al. The SIRT1 deacetylase suppresses intestinal tumorigenesis and colon cancer growth. PLoS One 3, e2020 (2008).
286. Takai, N. & Narahara, H. Histone deacetylase inhibitor therapy in epithelial ovarian cancer. J. Oncol. 2010, 458431 (2010).
287. Dokmanovic, M. & Marks, P. A. Prospects: histone deacetylase inhibitors. J. Cell. Biochem. 96, 293–304 (2005).
288. Mercurio, C., Minucci, S. & Pelicci, P. G. Histone deacetylases and epigenetic therapies of hematological malignancies. Pharmacol. Res. 62, 18–34 (2010).
289. Piekarz, R. L. & Bates, S. E. Epigenetic modifiers: basic understanding and clinical development. Clin. Cancer Res. 15, 3918–26 (2009).
290. Burgess, A. et al. Histone deacetylase inhibitors specifically kill nonproliferating tumour cells. Oncogene 23, 6693–701 (2004).
291. Chambers, A. E. et al. Histone acetylation-mediated regulation of genes in leukaemic cells. Eur. J. Cancer 39, 1165–75 (2003).
292. Mitsiades, C. S. et al. Transcriptional signature of histone deacetylase inhibition in multiple myeloma: biological and clinical implications. Proc. Natl. Acad. Sci. U. S. A. 101, 540–5 (2004).
293. Glaser, K. B. Defining the role of gene regulation in resistance to HDAC inhibitors--mechanisms beyond P-glycoprotein. Leuk. Res. 30, 651–2 (2006).

180
294. Richon, V. M., Sandhoff, T. W., Rifkind, R. A. & Marks, P. A. Histone deacetylase inhibitor selectively induces p21WAF1 expression and gene-associated histone acetylation. Proc. Natl. Acad. Sci. U. S. A. 97, 10014–9 (2000).
295. Vidal, A. & Koff, A. Cell-cycle inhibitors: three families united by a common cause. Gene 247, 1–15 (2000).
296. Gui, C.-Y., Ngo, L., Xu, W. S., Richon, V. M. & Marks, P. A. Histone deacetylase (HDAC) inhibitor activation of p21WAF1 involves changes in promoter-associated proteins, including HDAC1. Proc. Natl. Acad. Sci. U. S. A. 101, 1241–6 (2004).
297. Xu, W.-S., Perez, G., Ngo, L., Gui, C.-Y. & Marks, P. A. Induction of polyploidy by histone deacetylase inhibitor: a pathway for antitumor effects. Cancer Res. 65, 7832–9 (2005).
298. Archer, S. Y., Meng, S., Shei, A. & Hodin, R. A. p21(WAF1) is required for butyrate-mediated growth inhibition of human colon cancer cells. Proc. Natl. Acad. Sci. U. S. A. 95, 6791–6 (1998).
299. Hitomi, T., Matsuzaki, Y., Yokota, T., Takaoka, Y. & Sakai, T. p15(INK4b) in HDAC inhibitor-induced growth arrest. FEBS Lett. 554, 347–50 (2003).
300. Minucci, S. & Pelicci, P. G. Histone deacetylase inhibitors and the promise of epigenetic (and more) treatments for cancer. Nat. Rev. Cancer 6, 38–51 (2006).
301. Xu, Y. Regulation of p53 responses by post-translational modifications. Cell Death Differ. 10, 400–3 (2003).
302. Zhao, Y. et al. Inhibitors of histone deacetylases target the Rb-E2F1 pathway for apoptosis induction through activation of proapoptotic protein Bim. Proc. Natl. Acad. Sci. U. S. A. 102, 16090–5 (2005).
303. Ashkenazi, A. Targeting death and decoy receptors of the tumour-necrosis factor superfamily. Nat. Rev. Cancer 2, 420–30 (2002).
304. Nakata, S. et al. Histone deacetylase inhibitors upregulate death receptor 5/TRAIL-R2 and sensitize apoptosis induced by TRAIL/APO2-L in human malignant tumor cells. Oncogene 23, 6261–71 (2004).
305. Insinga, A. et al. Inhibitors of histone deacetylases induce tumor-selective apoptosis through activation of the death receptor pathway. Nat. Med. 11, 71–6 (2005).
306. Jiang, X. & Wang, X. Cytochrome C-mediated apoptosis. Annu. Rev. Biochem. 73, 87–106 (2004).
307. Rosato, R. R. & Grant, S. Histone deacetylase inhibitors: insights into mechanisms of lethality. Expert Opin. Ther. Targets 9, 809–24 (2005).
308. Shao, Y., Gao, Z., Marks, P. A. & Jiang, X. Apoptotic and autophagic cell death induced by histone deacetylase inhibitors. Proc. Natl. Acad. Sci. U. S. A. 101, 18030–5 (2004).
309. Kim, Y. K. et al. Histone deacetylase inhibitor apicidin-mediated drug resistance: involvement of P-glycoprotein. Biochem. Biophys. Res. Commun. 368, 959–64 (2008).
310. Richon, V. M. Cancer biology: mechanism of antitumour action of vorinostat (suberoylanilide hydroxamic acid), a novel histone deacetylase inhibitor. Br. J. Cancer 95, S2–S6 (2006).
311. Cooper, A. L. et al. In vitro and in vivo histone deacetylase inhibitor therapy with suberoylanilide hydroxamic acid (SAHA) and paclitaxel in ovarian cancer. Gynecol. Oncol. 104, 596–601 (2007).
181
312. Serpa, J. et al. Butyrate-rich colonic microenvironment is a relevant selection factor for metabolically adapted tumor cells. J. Biol. Chem. 285, 39211–23 (2010).
313. Rajendran, P., Williams, D. E., Ho, E. & Dashwood, R. H. Metabolism as a key to histone deacetylase inhibition. Crit. Rev. Biochem. Mol. Biol. 46, 181–99 (2011).
314. Rodríguez-Paredes, M. & Esteller, M. Cancer epigenetics reaches mainstream oncology. Nat. Med. 330–339 (2011). doi:10.1038/nm.2305
315. Frew, A. J., Johnstone, R. W. & Bolden, J. E. Enhancing the apoptotic and therapeutic effects of HDAC inhibitors. Cancer Lett. 280, 125–33 (2009).
316. Deroanne, C. F. et al. Histone deacetylases inhibitors as anti-angiogenic agents altering vascular endothelial growth factor signaling. Oncogene 21, 427–36 (2002).
317. Cohen, L. A. et al. Suberoylanilide hydroxamic acid (SAHA), a histone deacetylase inhibitor, suppresses the growth of carcinogen-induced mammary tumors. Anticancer Res. 22, 1497–504 (2002).
318. Butler, L. M. et al. Suberoylanilide hydroxamic acid, an inhibitor of histone deacetylase, suppresses the growth of prostate cancer cells in vitro and in vivo. Cancer Res. 60, 5165–5170 (2000).
319. He, L.-Z. et al. Histone deacetylase inhibitors induce remission in transgenic models of therapy-resistant acute promyelocytic leukemia. J. Clin. Invest. 108, 1321–1330 (2001).
320. Lindemann, R. K. et al. Analysis of the apoptotic and therapeutic activities of histone deacetylase inhibitors by using a mouse model of B cell lymphoma. Proc. Natl. Acad. Sci. U. S. A. 104, 8071–6 (2007).
321. Kerr, J. S. et al. Nonclinical Safety Assessment of the Histone Deacetylase Inhibitor Vorinostat. Int. J. Toxicol. 29, 3–19 (2009).
322. Lane, A. A. & Chabner, B. A. Histone deacetylase inhibitors in cancer therapy. J. Clin. Oncol. 27, 5459–68 (2009).
323. Siegel, D. et al. Vorinostat in solid and hematologic malignancies. J. Hematol. Oncol. 2, 31 (2009).
324. Kelly, W. K. & Marks, P. A. Drug insight: Histone deacetylase inhibitors--development of the new targeted anticancer agent suberoylanilide hydroxamic acid. Nat. Clin. Pract. Oncol. 2, 150–7 (2005).
325. Hayashi, A. et al. Type-specific roles of histone deacetylase (HDAC) overexpression in ovarian carcinoma: HDAC1 enhances cell proliferation and HDAC3 stimulates cell migration with downregulation of E-cadherin. Int. J. Cancer 127, 1332–46 (2010).
326. Ahmad, M. et al. Understanding histone deacetylases in the cancer development and treatment: an epigenetic perspective of cancer chemotherapy. DNA Cell Biol. 31 Suppl 1, S62-71 (2012).
327. Ropero, S. & Esteller, M. The role of histone deacetylases (HDACs) in human cancer. (2007). doi:10.1016/j.molonc.2007.01.001
328. Jiao, F. et al. Aberrant expression of nuclear HDAC3 and cytoplasmic CDH1 predict a poor prognosis for patients with pancreatic cancer. Oncotarget 7, 16505–16 (2016).
329. Müller, B. M. et al. Differential expression of histone deacetylases HDAC1, 2 and 3 in human breast cancer - overexpression of HDAC2 and HDAC3 is associated with clinicopathological indicators of disease progression. BMC Cancer 13, 215 (2013).

182
330. Schneider, G., Krämer, O. H., Schmid, R. M. & Saur, D. Acetylation as a Transcriptional Control Mechanism—HDACs and HATs in Pancreatic Ductal Adenocarcinoma. J. Gastrointest. Cancer 42, 85–92 (2011).
331. Sangha, R., Lara, P. N., Mack, P. C. & Gandara, D. R. Beyond antiepidermal growth factor receptors and antiangiogenesis strategies for nonsmall cell lung cancer: exploring a new frontier. Curr. Opin. Oncol. 21, 116–23 (2009).
332. Bots, M. & Johnstone, R. W. Rational combinations using HDAC inhibitors. Clin. Cancer Res. 15, 3970–7 (2009).
333. Khan, O. & La Thangue, N. B. Drug Insight: histone deacetylase inhibitor-based therapies for cutaneous T-cell lymphomas. Nat. Clin. Pract. Oncol. 5, 714–26 (2008).
334. Duvic, M. et al. Phase 2 trial of oral vorinostat (suberoylanilide hydroxamic acid, SAHA) for refractory cutaneous T-cell lymphoma (CTCL). Blood 109, 31–9 (2007).
335. Chen, S. et al. The anti-tumor effects and molecular mechanisms of suberoylanilide hydroxamic acid (SAHA) on the aggressive phenotypes of ovarian carcinoma cells. PLoS One 8, e79781 (2013).
336. Hrzenjak, A. et al. Histone deacetylase inhibitor vorinostat suppresses the growth of uterine sarcomas in vitro and in vivo. Mol. Cancer 9, 49 (2010).
337. Slingerland, M., Guchelaar, H.-J. & Gelderblom, H. Histone deacetylase inhibitors: an overview of the clinical studies in solid tumors. Anticancer. Drugs 25, (2014).
338. Micci, F. et al. Genomic profile of ovarian carcinomas. BMC Cancer 14, 315 (2014).
339. Jin, K. L. et al. Expression profile of histone deacetylases 1, 2 and 3 in ovarian cancer tissues. J. Gynecol. Oncol. 19, 185–90 (2008).
340. Cristea, M., Han, E., Salmon, L. & Morgan, R. J. Practical considerations in ovarian cancer chemotherapy. Ther. Adv. Med. Oncol. 2, 175–87 (2010).
341. Park, S. Y. et al. Histone deacetylases 1, 6 and 8 are critical for invasion in breast cancer. Oncol. Rep. 25, 1677–81 (2011).
342. Brunmeir, R., Lagger, S. & Seiser, C. Histone deacetylase HDAC1/HDAC2-controlled embryonic development and cell differentiation. Int. J. Dev. Biol. 53, 275–89 (2009).
343. Luo, Y. et al. Trans-regulation of histone deacetylase activities through acetylation. J. Biol. Chem. 284, 34901–10 (2009).
344. Wilson, A. J. et al. HDAC4 promotes growth of colon cancer cells via repression of p21. Mol. Biol. Cell 19, 4062–75 (2008).
345. Rey, M., Irondelle, M., Waharte, F., Lizarraga, F. & Chavrier, P. HDAC6 is required for invadopodia activity and invasion by breast tumor cells. Eur. J. Cell Biol. 90, 128–35 (2011).
346. Ozdağ, H. et al. Differential expression of selected histone modifier genes in human solid cancers. BMC Genomics 7, 90 (2006).
347. Kong, Y. et al. Histone deacetylase cytoplasmic trapping by a novel fluorescent HDAC inhibitor. Mol. Cancer Ther. 10, 1591–9 (2011).
348. Zeng, L.-S. et al. Overexpressed HDAC4 is associated with poor survival and promotes tumor progression in esophageal carcinoma. Aging (Albany. NY). 8, 1236–1248 (2016).

183
349. Giaginis, C. et al. Histone deacetylase (HDAC)-1, −2, −4 and −6 expression in human pancreatic adenocarcinoma: associations with clinicopathological parameters, tumor proliferative capacity and patients’ survival. BMC Gastroenterol. (2015). doi:10.1186/s12876-015-0379-y
350. Shen, Y.-F., Wei, A.-M., Kou, Q., Zhu, Q.-Y. & Zhang, L. Histone deacetylase 4 increases progressive epithelial ovarian cancer cells via repression of p21 on fibrillar collagen matrices. Oncol. Rep. 35, 948–54 (2015).
351. Boyault, C. et al. HDAC6 controls major cell response pathways to cytotoxic accumulation of protein aggregates. Genes Dev. 21, 2172–81 (2007).
352. Shan, B. et al. Requirement of HDAC6 for transforming growth factor-beta1-induced epithelial-mesenchymal transition. J. Biol. Chem. 283, 21065–73 (2008).
353. Tsunoda, K. et al. Nucleus accumbens-associated 1 contributes to cortactin deacetylation and augments the migration of melanoma cells. J. Invest. Dermatol. 131, 1710–9 (2011).
354. Matsuyama, A. et al. In vivo destabilization of dynamic microtubules by HDAC6-mediated deacetylation. EMBO J. 21, 6820–31 (2002).
355. Kawaguchi, Y. et al. The deacetylase HDAC6 regulates aggresome formation and cell viability in response to misfolded protein stress. Cell 115, 727–38 (2003).
356. Matthias, P., Yoshida, M. & Khochbin, S. HDAC6 a new cellular stress surveillance factor. Cell Cycle 7, 7–10 (2008).
357. Lee, Y.-S. et al. The cytoplasmic deacetylase HDAC6 is required for efficient oncogenic tumorigenesis. Cancer Res. 68, 7561–9 (2008).
358. Sakuma, T. et al. Aberrant expression of histone deacetylase 6 in oral squamous cell carcinoma. Int. J. Oncol. 29, 117–24 (2006).
359. Santo, L. et al. Preclinical activity, pharmacodynamic, and pharmacokinetic properties of a selective HDAC6 inhibitor, ACY-1215, in combination with bortezomib in multiple myeloma. Blood 119, 2579–89 (2012).
360. Takai, N. et al. Human ovarian carcinoma cells: histone deacetylase inhibitors exhibit antiproliferative activity and potently induce apoptosis. Cancer 101, 2760–70 (2004).
361. Glozak, M. A. & Seto, E. Histone deacetylases and cancer. Oncogene 26, 5420–5432 (2007).
362. Juan, L.-J. et al. Histone Deacetylases Specifically Down-regulate p53-dependent Gene Activation*. (2000). doi:10.1074/jbc.M000202200
363. West, A. C. et al. An intact immune system is required for the anticancer activities of histone deacetylase inhibitors. Cancer Res. 73, (2013).
364. Akasaka, K. et al. Loss of class III beta-tubulin induced by histone deacetylation is associated with chemosensitivity to paclitaxel in malignant melanoma cells. J. Invest. Dermatol. 129, 1516–26 (2009).
365. Konecny, G. E. & Kristeleit, R. S. PARP inhibitors for BRCA1/2-mutated and sporadic ovarian cancer: current practice and future directions. Br. J. Cancer 115, 1157–1173 (2016).
184
366. Chung, C. & Lee, R. An update on current and emerging therapies for epithelial ovarian cancer: Focus on poly(adenosine diphosphate-ribose) polymerase inhibition and antiangiogenesis. J. Oncol. Pharm. Pract. (2016). doi:10.1177/1078155216657165
367. Mann, B. S., Johnson, J. R., Cohen, M. H., Justice, R. & Pazdur, R. FDA Approval Summary: Vorinostat for Treatment of Advanced Primary Cutaneous T-Cell Lymphoma. Oncologist 12, 1247–1252 (2007).
368. Mossman, D., Kim, K.-T. & Scott, R. J. Demethylation by 5-aza-2’-deoxycytidine in colorectal cancer cells targets genomic DNA whilst promoter CpG island methylation persists. BMC Cancer 10, 366 (2010).
369. Livak, K. J. & Schmittgen, T. D. Analysis of relative gene expression data using real-time quantitative PCR and the 2(-Delta Delta C(T)) Method. Methods 25, 402–8 (2001).
370. Elmore, S. Apoptosis: a review of programmed cell death. Toxicol. Pathol. 35, 495–516 (2007).
371. Wirawan, E., Vanden Berghe, T., Lippens, S., Agostinis, P. & Vandenabeele, P. Autophagy: for better or for worse. Cell Res. 22, 43–61 (2012).
372. Modesitt, S. C. & Parsons, S. J. In vitro and in vivo histone deacetylase inhibitor therapy with vorinostat and paclitaxel in ovarian cancer models: does timing matter? Gynecol. Oncol. 119, 351–7 (2010).
373. Diyabalanage, H. V. K., Granda, M. L. & Hooker, J. M. Combination therapy: histone deacetylase inhibitors and platinum-based chemotherapeutics for cancer. Cancer Lett. 329, 1–8 (2013).
374. Matulonis, U. et al. Phase I study of combination of vorinostat, carboplatin, and gemcitabine in women with recurrent, platinum-sensitive epithelial ovarian, fallopian tube, or peritoneal cancer. Cancer Chemother. Pharmacol. 76, 417–23 (2015).
375. Aghajanian, C. et al. OCEANS: A Randomized, Double-Blind, Placebo-Controlled Phase III Trial of Chemotherapy With or Without Bevacizumab in Patients With Platinum-Sensitive Recurrent Epithelial Ovarian, Primary Peritoneal, or Fallopian Tube Cancer. J Clin Oncol 30, (2012).
376. Meehan, R. S. et al. New treatment option for ovarian cancer: PARP inhibitors. Gynecol. Oncol. Res. Pract. 3, 3 (2016).
377. Benafif, S. & Hall, M. An update on PARP inhibitors for the treatment of cancer. Onco. Targets. Ther. 8, 519–28 (2015).
378. Singh, B. N. et al. Preclinical studies on histone deacetylase inhibitors as therapeutic reagents for endometrial and ovarian cancers. Future Oncol. 7, 1415–28 (2011).
379. Olsen, E. A. et al. Phase IIB Multicenter Trial of Vorinostat in Patients With Persistent, Progressive, or Treatment Refractory Cutaneous T-Cell Lymphoma. J. Clin. Oncol. 25, 3109–3115 (2007).
380. Modesitt, S. C. et al. A phase II study of vorinostat in the treatment of persistent or recurrent epithelial ovarian or primary peritoneal carcinoma: a Gynecologic Oncology Group study. Gynecol. Oncol. 109, 182–6 (2008).
381. Xu, W. S., Parmigiani, R. B. & Marks, P. A. Histone deacetylase inhibitors: molecular mechanisms of action. Oncogene 26, 5541–52 (2007).

185
382. Mottamal, M., Zheng, S., Huang, T. L. & Wang, G. Histone Deacetylase Inhibitors in Clinical Studies as Templates for New Anticancer Agents. Molecules 20, 3898–3941 (2015).
383. Al-Yacoub, N. et al. Apoptosis induction by SAHA in cutaneous T-cell lymphoma cells is related to downregulation of c-FLIP and enhanced TRAIL signaling. J. Invest. Dermatol. 132, 2263–74 (2012).
384. Luu, T. H. et al. A phase II trial of vorinostat (suberoylanilide hydroxamic acid) in metastatic breast cancer: a California Cancer Consortium study. Clin. Cancer Res. 14, 7138–42 (2008).
385. Dupéré-Richer, D. et al. Vorinostat-induced autophagy switches from a death-promoting to a cytoprotective signal to drive acquired resistance. Cell Death Dis. 4, e486 (2013).
386. Hou, W., Han, J., Lu, C., Goldstein, L. A. & Rabinowich, H. Autophagic degradation of active caspase-8: a crosstalk mechanism between autophagy and apoptosis. Autophagy 6, 891–900 (2010).
387. Lum, J. J. et al. Growth Factor Regulation of Autophagy and Cell Survival in the Absence of Apoptosis. Cell 120, 237–248 (2005).
388. Chen, M.-Y. et al. Decitabine and suberoylanilide hydroxamic acid (SAHA) inhibit growth of ovarian cancer cell lines and xenografts while inducing expression of imprinted tumor suppressor genes, apoptosis, G2/M arrest, and autophagy. Cancer 117, 4424–38 (2011).
389. Martin, T. A., Ye, L., Sanders, A. J., Lane, J. & Jiang, W. G. Cancer Invasion and Metastasis: Molecular and Cellular Perspective. (2013).
390. Quail, D. F. & Joyce, J. A. Microenvironmental regulation of tumor progression and metastasis. Nat. Med. 19, 1423–37 (2013).
391. Sonnemann, J. et al. Comparative evaluation of the treatment efficacy of suberoylanilide hydroxamic acid (SAHA) and paclitaxel in ovarian cancer cell lines and primary ovarian cancer cells from patients. BMC Cancer 6, 183 (2006).
392. Pectasides, D., Pectasides, E., Psyrri, A. & Economopoulos, T. Treatment Issues in Clear Cell Carcinoma of the Ovary: A Different Entity? Oncologist 11, 1089–1094 (2006).
393. Kim, A. et al. Enhanced expression of Annexin A4 in clear cell carcinoma of the ovary and its association with chemoresistance to carboplatin. Int. J. Cancer 125, 2316–22 (2009).
394. Angelucci, A. et al. Suberoylanilide hydroxamic acid partly reverses resistance to paclitaxel in human ovarian cancer cell lines. Gynecol. Oncol. 119, 557–63 (2010).
395. Dietrich, C. S. et al. Suberoylanilide hydroxamic acid (SAHA) potentiates paclitaxel-induced apoptosis in ovarian cancer cell lines. Gynecol. Oncol. 116, 126–130 (2010).
396. Nolan, L., Johnson, P. W. M., Ganesan, a, Packham, G. & Crabb, S. J. Will histone deacetylase inhibitors require combination with other agents to fulfil their therapeutic potential? Br. J. Cancer 99, 689–94 (2008).
397. Fantin, V. R. & Richon, V. M. Mechanisms of resistance to histone deacetylase inhibitors and their therapeutic implications. Clin. Cancer Res. 13, 7237–42 (2007).
186
398. Fujiwara, K., Shintani, D. & Nishikawa, T. symposium article Clear-cell carcinoma of the ovary. Ann. Oncol. 27, 1–3 (2016).
399. Gounaris, I. & Brenton, J. D. Molecular pathogenesis of ovarian clear cell carcinoma. Futur. Oncol. 11, 1389–1405 (2015).
400. Lim, D., Ip, P. P. C., Cheung, A. N. Y., Kiyokawa, T. & Oliva, E. Immunohistochemical Comparison of Ovarian and Uterine Endometrioid Carcinoma , Endometrioid Carcinoma. Am J Surg Pathol 39, 1061–1069 (2015).
401. Kao, Y., Lin, M., Lin, W., Jeng, Y. & Mao, T. Utility of hepatocyte nuclear factor-1 b as a diagnostic marker in ovarian carcinomas with clear cells. Histopathology 61, 760–8 (2012).
402. Shigetomi, H., Sudo, T. & Shimada, Þ. K. Inhibition of Cell Death and Induction of G2 Arrest Accumulation in Human Ovarian Clear Cells by HNF-1 A Transcription Factor Chemosensitivity Is Regulated by Checkpoint Kinase CHK1. Int. J. Gynecol. Cancer 24, 838–843 (2014).
403. Park, S. J. et al. SAHA , an HDAC inhibitor , overcomes erlotinib resistance in human pancreatic cancer cells by modulating E-cadherin. Tumor Biol. 37, 4323–30 (2015).
404. Ou, W. et al. HDACi inhibits liposarcoma via targeting of the MDM2-p53 signaling axis and PTEN , irrespective of p53 mutational status. Oncotarget 6, 10510–10520 (2015).
405. Diss, E., Nalabothula, N., Nguyen, D., Chang, E. & Kwok, Y. VorinostatSAHA Promotes Hyper-Radiosensitivity in Wild Type p53 Human Glioblastoma Cells. J Clin Oncol Res. 2, 1–16 (2014).
406. Liang, C.-C., Park, A. Y. & Guan, J.-L. In vitro scratch assay: a convenient and inexpensive method for analysis of cell migration in vitro. Nat. Protoc. 2, 329–33 (2007).
407. Lin, C. et al. Valproic acid resensitizes cisplatin-resistant ovarian cancer. Cancer Sci | 99, 1218–1226 (2008).
408. Yang, Y. et al. Initial characterization of the glutamate-cysteine ligase modifier subunit Gclm(-/-) knockout mouse. Novel model system for a severely compromised oxidative stress response. J. Biol. Chem. 277, 49446–52 (2002).
409. Marks, P. A., Richon, V. M. & Rifkind, R. A. Histone Deacetylase Inhibitors : Inducers of Differentiation or Apoptosis of Transformed Cells. J. Natl. Cancer Inst. 92, 2–8 (2000).
410. Chen, Z. et al. Induction and superinduction of growth arrest and DNA damage gene 45 ( GADD45 ) a and b messenger RNAs by histone deacetylase inhibitors trichostatin A ( TSA ) and butyrate in SW620 human colon carcinoma cells. Cancer Lett. 188, 127–140 (2002).
411. Ogryzko, V. V, Hirai, T. H., Russanova, V. R., Barbie, D. A. & Howard, B. H. Human Fibroblast Commitment to a Senescence-Like State in Response to Histone Deacetylase Inhibitors Is Cell Cycle Dependent. Mol. Cell. Biol. 16, 5210–5218 (1996).
412. Silva, G., Cardoso, B. A., Belo, H. & Almeida, A. M. Vorinostat induces apoptosis and differentiation in myeloid malignancies: genetic and molecular mechanisms. PLoS One 8, e53766 (2013).
413. Cardoso, B. A., Belo, H., Barata, J. T. & Almeida, A. M. The Bone Marrow-Mediated Protection of Myeloproliferative Neoplastic Cells to Vorinostat and Ruxolitinib Relies on the Activation of JNK and PI3K Signalling Pathways. PLoS One 10, e0143897 (2015).

187
414. Fischer, M., Quaas, M., Steiner, L. & Engeland, K. The p53-p21-DREAM-CDE/CHR pathway regulates G2/M cell cycle genes. Nucleic Acids Res. 44, 164–174 (2016).
415. Gartel, A. L. & Radhakrishnan, S. K. Lost in Transcription : p21 Repression , Mechanisms , and Consequences. Cancer Res. 65, 3980–3985 (2005).
416. Lozano, G. The oncogenic roles of p53 mutants in mouse models. Curr. Opin. Genet. Dev. 17, 66–70 (2007).
417. Weisz, L., Oren, M. & Rotter, V. Transcription regulation by mutant p53. Oncogene 53, 2202–2211 (2007).
418. Strano, S. et al. Mutant p53 : an oncogenic transcription factor. Oncogene 53, 2212–2219 (2007).
419. Papers, J. B. C. et al. Cyclin-dependent Kinases Phosphorylate p73 at Threonine 86 in a Cell Cycle-dependent Manner and Negatively Regulate p73 *. J. Biol. Chem. 278, 27421–27431 (2003).
420. Das, C. & Kundu, T. K. Critical Review Transcriptional Regulation by the Acetylation of Nonhistone Proteins in Humans – A New Target for Therapeutics. Life 57, 137–148 (2005).
421. Condorelli, F. et al. Inhibitors of histone deacetylase ( HDAC ) restore the p53 pathway in neuroblastoma cells. Br. J. pharmocology 153, 657–668 (2008).
422. Luo, J. et al. Acetylation of p53 augments its site-specific DNA binding both in vitro and in vivo. PNAS 101, 2259–2264 (2004).
423. Brooks, C. L. & Ã, W. G. Ubiquitination , phosphorylation and acetylation : the molecular basis for p53 regulation. Curr. Opin. Cell Biol. 15, 164–171 (2003).
424. Yang, X.-J. & Seto, E. Lysine acetylation: codified crosstalk with other posttranslational modifications. Mol. Cell 31, 449–461 (2008).
425. Yu, D. D., Guo, S. W., Jing, Y. Y., Dong, Y. L. & Wei, L. X. A review on hepatocyte nuclear factor ‑ 1beta and tumor. Cell Biosci. 5, 1–8 (2015).
426. Hnf-b, D. et al. Downregulation of HNF-1B in Renal Cell Carcinoma Is Associated With Tumor Progression and Poor Prognosis. Urology 76, 507.e6-507.e11 (2010).
427. Chen, M. et al. Decitabine and suberoylanilide hydroxamic acid (SAHA) inhibit growth of ovarian cancer cell lines and xenografts while inducing expression of imprinted tumor suppressor genes, apoptosis, G2/M arrest and autophagy. Cancer 117, 4424–4438 (2012).
428. Mendivil, A. A. et al. Increased incidence of severe gastrointestinal events with first-line paclitaxel, carboplatin, and vorinostat chemotherapy for advanced-stage epithelial ovarian, primary peritoneal, and fallopian tube cancer. Int. J. Gynecol. Cancer 23, 533–9 (2013).
429. Modesitt, S. C., Sill, M., Hoffman, J. S. & Bender, D. P. A phase II study of vorinostat in the treatment of persistent or recurrent epithelial ovarian or primary peritoneal carcinoma : A Gynecologic Oncology Group study. Gynecol. Oncol. 109, 182–186 (2008).
430. Kelly, W. K. et al. Phase I Clinical Trial of Histone Deacetylase Inhibitor : Suberoylanilide Hydroxamic Acid Administered Intravenously 1. Clin. Cancer Res. 9, 3578–3588 (2003).
431. Li, J.-L. & Harris, A. L. Notch signaling from tumor cells: A new mechanism of angiogenesis. Cancer Cell 8, 1–3 (2005).

188
432. Dufraine, J., Funahashi, Y. & Kitajewski, J. Notch signaling regulates tumor angiogenesis by diverse mechanisms. Oncogene 27, 5132–5137 (2008).
433. Bolós, V., Grego-Bessa, J. & de la Pompa, J. L. Notch Signaling in Development and Cancer. Endocr. Rev. 28, 339–363 (2007).
434. Capaccione, K. M. & Pine, S. R. The Notch signaling pathway as a mediator of tumor survival. Carcinogenesis 34, 1420–30 (2013).
435. Tan, D. S. P., Miller, R. E. & Kaye, S. B. New perspectives on molecular targeted therapy in ovarian clear cell carcinoma. Br. J. Cancer 108, 1553–1559 (2013).
436. Iso, T., Kedes, L. & Hamamori, Y. HES and HERP families: multiple effectors of the Notch signaling pathway. J. Cell. Physiol. 194, 237–55 (2003).
437. Feldmann, G., Rauenzahn, S. & Maitra, A. In vitro models of pancreatic cancer for translational oncology research. Expert Opin. Drug Discov. 4, 429–443 (2009).
438. Santo, V. E. et al. Drug screening in 3D in vitro tumor models: overcoming current pitfalls of efficacy read-outs. Biotechnol. J. 12, 1600505 (2017).
439. Beaufort, C. M. et al. Ovarian cancer cell line panel (OCCP): clinical importance of in vitro morphological subtypes. PLoS One 9, e103988 (2014).
440. Kallioniemi, O. P. et al. Optimizing comparative genomic hybridization for analysis of DNA sequence copy number changes in solid tumors. Genes. Chromosomes Cancer 10, 231–43 (1994).
441. Roque, L., Rodrigues, R., Pinto, A., Moura-Nunes, V. & Soares, J. Chromosome imbalances in thyroid follicular neoplasms: a comparison between follicular adenomas and carcinomas. Genes. Chromosomes Cancer 36, 292–302 (2003).
442. Santo, V. E. et al. Adaptable stirred-tank culture strategies for large scale production of multicellular spheroid-based tumor cell models. J. Biotechnol. 221, 1–12 (2016).
443. O’Neill, C. J. & McCluggage, W. G. p16 expression in the female genital tract and its value in diagnosis. Adv. Anat. Pathol. 13, 8–15 (2006).
444. Cory, G. Cell Migration. Methods in molecular biology (Clifton, N.J.) 769, (Humana Press, 2011).
445. Pejovic, T. et al. Chromosome aberrations in 35 primary ovarian carcinomas. Genes, Chromosom. Cancer 4, 58–68 (1992).
446. Bolton, K. L. et al. Common variants at 19p13 are associated with susceptibility to ovarian cancer. Nat. Genet. 42, 880–4 (2010).
447. Boersma, B. J. et al. Association of Breast Cancer Outcome With Status of p53 and MDM2 SNP309. JNCI J. Natl. Cancer Inst. 98, 911–919 (2006).
448. Berg, M. et al. DNA Sequence Profiles of the Colorectal Cancer Critical Gene Set KRAS-BRAF-PIK3CA-PTEN-TP53 Related to Age at Disease Onset. PLoS One 5, e13978 (2010).
449. Aquilina, G. et al. Mismatch Repair and p53 Independently Affect Sensitivity to N-(2-chloroethyl)-N′-cyclohexyl-N-nitrosourea. Clin. Cancer Res. 6, (2000).
450. Siddik, Z. H., Mims, B., Lozano, G. & Thai, G. Independent pathways of p53 induction by cisplatin and X-rays in a cisplatin-resistant ovarian tumor cell line. Cancer Res. 58, 698–703 (1998).

189
451. Zanjirband, M., Edmondson, R. J. & Lunec, J. Pre-clinical efficacy and synergistic potential of the MDM2-p53 antagonists, Nutlin-3 and RG7388, as single agents and in combined treatment with cisplatin in ovarian cancer. Oncotarget 7, 40115–40134 (2016).
452. Xie, X., Lozano, G. & Siddik, Z. H. Heterozygous p53V172F mutation in cisplatin-resistant human tumor cells promotes MDM4 recruitment and decreases stability and transactivity of p53. Oncogene 35, 4798–4806 (2016).
453. Cadwell, C. & Zambetti, G. P. The effects of wild-type p53 tumor suppressor activity and mutant p53 gain-of-function on cell growth. Gene 277, 15–30 (2001).
454. Jacob, F., Nixdorf, S., Hacker, N. F. & Heinzelmann-Schwarz, V. A. Reliable in vitro studies require appropriate ovarian cancer cell lines. J. Ovarian Res. 7, 60 (2014).
455. Köbel, M. et al. Differences in tumor type in low-stage versus high-stage ovarian carcinomas. Int. J. Gynecol. Pathol. 29, 203–11 (2010).
456. Kim, S. W. et al. Analysis of chromosomal changes in serous ovarian carcinoma using high-resolution array comparative genomic hybridization: Potential predictive markers of chemoresistant disease. Genes. Chromosomes Cancer 46, 1–9 (2007).
457. Bancroft, J. D., Layton, C. (Histologist) & Suvarna, S. K. Bancroft’s theory and practice of histological techniques.
458. Hanahan, D. & Weinberg, R. A. Hallmarks of cancer: the next generation. Cell 144, 646–74 (2011).
459. Micci, F. et al. Array-CGH analysis of microdissected chromosome 19 markers in ovarian carcinoma identifies candidate target genes. Genes Chromosom. Cancer 49, 1046–1053 (2010).
460. Estrada, M. F. et al. Modelling the tumour microenvironment in long-term microencapsulated 3D co-cultures recapitulates phenotypic features of disease progression. Biomaterials 78, 50–61 (2016).
461. He, Z.-Y. et al. Ovarian cancer treatment with a tumor-targeting and gene expression-controllable lipoplex. Sci. Rep. 6, 23764 (2016).
462. Katsumata, N. et al. Long-term results of dose-dense paclitaxel and carboplatin versus conventional paclitaxel and carboplatin for treatment of advanced epithelial ovarian, fallopian tube, or primary peritoneal cancer (JGOG 3016): a randomised, controlled, open-label trial. Lancet. Oncol. 14, 1020–6 (2013).
463. Stark, D. et al. Standard chemotherapy with or without bevacizumab in advanced ovarian cancer: quality-of-life outcomes from the International Collaboration on Ovarian Neoplasms (ICON7) phase 3 randomised trial. Lancet. Oncol. 14, 236–43 (2013).
464. Weichert, W. et al. Expression of class I histone deacetylases indicates poor prognosis in endometrioid subtypes of ovarian and endometrial carcinomas. Neoplasia 10, 1021–7 (2008).
465. Wagner, T., Brand, P., Heinzel, T. & Krämer, O. H. Histone deacetylase 2 controls p53 and is a critical factor in tumorigenesis. Biochim. Biophys. Acta 1846, 524–538 (2014).
466. Groeneweg, J. W., Foster, R., Growdon, W. B., Verheijen, R. H. & Rueda, B. R. Notch signaling in serous ovarian cancer. J. Ovarian Res. 7, 95 (2014).