Embed Size (px)
Citation preview

HAL Id: tel-00905951https://tel.archives-ouvertes.fr/tel-00905951
Submitted on 19 Nov 2013
HAL is a multi-disciplinary open accessarchive for the deposit and dissemination of sci-entific research documents, whether they are pub-lished or not. The documents may come fromteaching and research institutions in France orabroad, or from public or private research centers.
L’archive ouverte pluridisciplinaire HAL, estdestinée au dépôt et à la diffusion de documentsscientifiques de niveau recherche, publiés ou non,émanant des établissements d’enseignement et derecherche français ou étrangers, des laboratoirespublics ou privés.
Molecular mechanism of HIV-1 integrase inhibition byRaltegravir proposed by using of molecular modeling
approachesRohit Arora
To cite this version:Rohit Arora. Molecular mechanism of HIV-1 integrase inhibition by Raltegravir proposed by usingof molecular modeling approaches. Agricultural sciences. École normale supérieure de Cachan - ENSCachan, 2012. English. <NNT : 2012DENS0055>. <tel-00905951>

0
ENSC - 2012n°394
THESE DE DOCTORAT
DE L’ECOLE NORMALE SUPERIEURE DE CACHAN
Présentée par
Monsieur Rohit ARORA
pour obtenir le grade de
DOCTEUR DE L’ECOLE NORMALE SUPERIERE DE CACHAN
Domaine : Sciences de la Vie et de la Santé
Sujet de la thèse :
Molecular mechanism of HIV-1 integrase inhibition by Raltegravir proposed by using of molecular modeling approaches Thèse présentée et soutenue à Cachan le 26 octobre 2012 devant le jury composé de :
Philippe CUNIASSE Directeur de Recherche Rapporteur/President Florent BARBAULT Maitre des Conférences Rapporteur Liliane MOUAWAD Chargé de Recherche Examinatrice Luba TCHERTANOV Directrice de Recherche Directrice de thèse
Nom du Laboratoire : Laboratoire de Biologie et Pharmacologie Appliquée ENS CACHAN/CNRS/UMR8113 61, avenue du Président Wilson, 94235 CACHAN CEDEX, France

1
Mots clefs: SIDA, Intégrase du VIH-1, ADN virale, inhibition des cibles, Raltegravir, modélisation, reconnaissance moléculaire, simulation de dynamique moléculaire, amarrage
Le résumé
L'intégrase (IN) rétrovirale est responsable de l’intégration de l'ADN viral du VIH-1dans l’ADN cellulaire, processus indispensable à la réplication virale. Ce processus se déroule en deux étapes indépendantes, le 3’-processing et le transfert de brins, catalysées par l’IN. La
compréhension des interactions entre l’IN et l’ADN viral et de la cinétique de formation des complexes pré-intégratifs a permis l’identification du raltégravir (RAL) et de l’elvitégravir
(ELV) qui se sont avérés être des inhibiteurs très efficaces de la réplication virale. Le RAL, auparavant désigné sous le code MK-0518, est un nouveau médicament anti-VIH qui a obtenu son autorisation de commercialisation aux Etats-Unis sous le nom de IsentressTM le 12 octobre 2007. Le ELV est toujours en essais cliniques. Toutefois, comme on l'observe pour d'autres antirétroviraux, ces composés n’échappent cependant pas aux phénomènes de résistance. Des
mutations de résistance spécifiques au RAL ont ainsi été identifiées chez des patients. À ce jour, aucune donnée expérimentale caractérisant la structure de l’IN du VIH-1, la structure au RAL et/ou les interactions du RAL avec sa cible n'a été rapporté.
Premièrement, nous avons caractérisé les propriétés structurales et conformationnelles du RAL dans des états différents, en phase gazeuse, en solution dans l'eau et à l'état solide. Une etude détaillée a permis de caracteriser la reconnaissance du RAL par des cibles virals, l’IN
et l’ADN viral avant et après la réaction de 3’-processing. Nous avons trouvé que le RAL adopte un large spectre de conformations et configurations dans des états isolés et/ou liés avec le(s) cible(s). Les meilleures score et poses de docking confirment que le modèle représentant le complexe IN•vADN est la cible biologiquement pertinente du RAL. Ce résultat est cohérent avec le mécanisme d'inhibition du RAL communément admise. Nous avons suggéré que le processus d'inhibition peut comprendre dans un premier temps la reconnaissance du RAL par l'ADN viral clivé et lié à un état intermédiaire de l’IN. Le RAL couplé à l’ADN viral montre une orientation à l'extérieur de tous les atomes d'oxygène, d'excellents agents putatifs pour capturer de cations Mg2+, ce qui pourrait faciliter l'insertion du RAL dans le site actif. La flexibilité conformationnelle du RAL permet l'adaptation de l'inhibiteur dans une poche relativement grande de du complexe IN•vADN, permettant la production de diverses conformations du RAL. Nous croyons que cette diversité des conformations du RAL contribue à la reconnaissance de résidus enzymatiques et peut influer sur le choix des voies alternatives de résistance au RAL observées cliniquement.
Nous avons étudié également la reconnaissance par l’IN des inhibiteurs du VIH
appartenant à différents souches, B et CRF02_AG. Nous avons montré que la structure de l’IN des deux souches est quasi-identique. Le docking du RAL et de deux autres inhibiteurs de transfert de brins (ELV et L731_988) sur chaque modèle montre que leur reconnaissance par deux différentes souches cibles est identique.
Notre analyse des effets moléculaires et structuraux des mutations de résistance sur la structure de l’IN a montré que les structures de l’enzyme sauvage et mutante sont aussi quasi-identique. Par contre, les mutations modifient considérablement la spécificité de reconnaissance de l'ADN par l'IN. Nous avons effectué la simulation de dynamique moléculaire (MD) de l’IN sauvage et
mutant, avec une mutation ponctuelle R228A localisée dans le domaine C-terminale. Notre étude de la flexibilité de l’IN et du complexe IN•ADN par la dynamique moléculaire ouvre une voie très prometteuse non seulement sur le plan de la recherche fondamentale mais aussi pour l'application de nos concepts au développement de nouvelles générations d'inhibiteurs ciblant l'IN.
2
Keywords: AIDS, HIV-1 Integrase, viral DNA, targets inhibition, Raltegravir, modeling, molecular recognition, molecular dynamics simulation, docking
Summary
The HIV-1 integrase catalyzes the integration of HIV-1 viral DNA (vDNA) into the host cell chromosome in a process, which is essential for viral replication through two independent reactions, 3’-processing (3’-P) and strand transfer (ST), catalyzed by IN. Deciphering the structural determinants of the interaction between integrase and its substrates and the kinetics of this interaction sheds light on the importance of inhibitors targeting the pre-integration IN•vDNA complex. This approach led to the identification of raltegravir (RAL) and elvitegravir (ELV), which turned out to be highly efficient inhibitors of ST. RAL, formerly known under the code MK-0518, is a new anti-HIV drug that obtained clinical approval in the United States under the name IsentressTM on October 12, 2007. ELV is still in clinical trials. However, these compounds nevertheless encounter resistance phenomenon. To date, no experimental data characterizing the RAL structure, structure of the HIV-1 IN and/or interactions of RAL with its targets, has been reported.
First, we characterized the structural and conformational properties of RAL in different states ‒ the gas phase, in water solution and the solid state. Second, a detailed study allowed
characterisation the RAL recognition by the viral targets ‒ IN and the vDNA, before and after the 3'-P. We found that RAL shows a broad spectrum of conformations and configurations in isolated state and/or associated with the target(s). The best docking poses and scores confirmed that the model representing IN•vDNA complex is a biologically relevant target of
RAL. This result is consistent with the commonly accepted mechanism of RAL inhibition. Based on the docking results we suggested that the inhibition process may include, as a
first step, the RAL recognition by the processed vDNA bound to a transient intermediate IN state. RAL coupled to vDNA shows an outside orientation of all oxygen atoms, excellent putative chelating agents of Mg2+ cations, which could facilitate the insertion of RAL into the active site. The conformational flexibility of RAL further allows the accommodation/adaptation of the inhibitor in a relatively large binding pocket of IN•vDNA pre-integration complex thus producing various RAL conformation. We believe that such variety of the RAL conformations contributing alternatively to the enzyme residue recognition may impact the selection of the clinically observed alternative resistance pathways to the drug.
We also studied the recognition of the HIV-1 IN inhibitors from two different strains, B and CRF02_AG. Our in silico study showed that the sequence variations between CRF02_AG and B strains did not lead to any notable difference in the structural features of the enzyme and did not impact the susceptibility to the IN inhibitors.
Our analysis of the resistance mutations effects showed that structure of the wild-type enzyme and mutants is almost identical. However, the resistance mutations significantly altered the specificity of the viral DNA recognition by IN.
We performed molecular dynamics simulations of the native and mutated IN with a point mutation R228A localized in the C-terminal domain. The study of targets flexibility opens a very promising way, not only in terms of fundamental research, but also for the application of our concepts to the development of new generations of inhibitors targeting IN.
3
Acknowledgements
Working on my Ph.D. has been a wonderful and often overwhelming experience. It is hard to say whether is has been grappling with the topic itself which has been the real learning experience, or grappling with how to write papers, give talks and work in a group. In any case, I am indebted to many people for making the time working on my Ph.D. an unforgettable experience.
I am grateful to Doctors Phillipe Cuniasse and Florent Barbault for accepting to be the
reviewers of my thesis. Their comments and critique have been extremely helpful in improving my thesis and making it a rather learning experience. I sincerely thank Doctor Liliane Mouwad who accepted to examine my work.
Words cannot describe my gratitude to my thesis supervisor, Doctor Luba Tchertanov,
for welcoming me to her team BiMoDyM at LBPA. She patiently guided me through my master’s project – which was a relatively new field for me – and helped me prepare for my PhD thesis. We have had many fruitful discussions and brainstorming sessions over the last 4 years. Her outstanding ability, scientific and pedagogical, together with personal kindness and openness turned my work into truly one of a kind experience. Whatever she does, she does it with taste and elegance and I hope I was able to absorb at least a little bit of these qualities.
My sincere gratitude is reserved for all the current and former members of my group,
for making it a memorable experience. Especially - Elodie Laine, Isaure Chauvot de
Beauchene, Safwat Abdel-Azeim and Joseph Andre – who contributed in one way or the other to my research. This work would not have been possible without the great number collaborators. I am much obliged to Jean-Christophe Lambry (Ecole Polytechnique), Marina Gottikh (Moscow State University), the team of Jean-Francois Mouscadet (LBPA, ENS de Cachan) and clinicians from the Hospital Pitié-Salpetriere (Paris). A special mention to companies - Schrodinger, Tripos and CCDC - who helped in providing licenses and maintenance of some key softwares used in my research. A special thanks to Florent Langenfeld for his patience in correcting my oral and written French.
I am also indebted to the ENS Cachan for giving me an opportunity to conduct my
PhD thesis at this prestigious institute. I am grateful to the Ecole Doctorale des Sciences Pratiques (EDSP) de Cachan and the French Ministry of Higher Education for providing and managing the financial support for my PhD research during a period of three years.
I am extremely grateful to Professor Isabelle Ledoux-Rak who introduced me to ENS
Cachan and LBPA, and provided support at every step during my Master’s program as well as
during the application process of my PhD. I am also very thankful to all the professors of my Master’s program for providing me with excellent guidance and education.
Finally, I thank my parents and my family without whom none of this would have
been possible. I thank my dear friends – Hillary Kloeckner, Dhruv Shah and Karthik Aluru – who provided me with support and encouragement whenever I needed it the most. They have been my family away from home.
4
Content
ABBREVIATIONS......................................................................................... 8
Chapter 1. INTRODUCTION................................................................. 9
I. HIV, AIDS and Antiretroviral Therapy..................................................... 9
1. HIV epidemiology and polymorphism...................................................... 9 2. Human Immunodeficiency Virus Type 1.................................................. 14 3. HIV-1 subtypes and circulating recombinant forms.................................. 16 4. HIV replication cycle................................................................................. 18
II. Antiretroviral Drugs...................................................................................... 20
1. Entry and Fusion Inhibitors....................................................................... 20 2. The Reverse Transcriptase Inhibitors (RTIs)............................................. 21 3. The Protease Inhibitors (PIs)...................................................................... 22 4. The Integrase Inhibitors (INIs) .................................................................. 23 5. Highly Active Antiretroviral Therapy (HAART) and resistance effect to drugs. ........................................................................ 24
III. Structure and Functions of HIV-1 Integrase.............................................. 26
1. Structural characterization of the HIV-1 Integrase.................................. 26 1.1 Experimental Data.............................................................................. 26 1.2 Theoretical Models............................................................................. 29 1.3. Structural and functional role of the catalytic site loop..................... 31 1.4 Molecular Dynamics Simulation of HIV-1 Integrase........................ 34
2. HIV-1 Integrase functions........................................................................ 36
2.1 Integrase activity................................................................................. 36 2.2 Role of the cationic co-factors............................................................ 37 2.3 Mechanisms of inhibition and target-inhibitors interactions.............. 38
3. Resistance to Integrase Strand Transfer Inhibitors (INSTIs)..................... 46 3.1 Resistance phenomenon...................................................................... 46 3.2 Polymorphism effect........................................................................... 50
IV. Raltegravir-the first clinically used integrase specific drug..................... 51
1. Discovery and development of Raltegravir............................................. 51 2. Efficiency of Raltegravir......................................................................... 52
2.1 Antiviral activity in vivo.................................................................... 52 2.2 Safety................................................................................................. 53 2.3 Pharmacokinetics............................................................................... 54
3. Viral resistance to Raltegravir.................................................................. 55
V. Molecular Modeling Approaches................................................................. 56
1. Ab-initio Methods..................................................................................... 58

5
2. Fragment-Based Structure Analyses........................................................ 58 3. Docking.................................................................................................... 60 3.1 Protein-Ligand Docking..................................................................... 60 3.2 Protein-DNA Docking........................................................................ 61 4. Molecular Dynamics Simulations............................................................ 62 5. Homology Modeling................................................................................. 63
Chapter 2. RESULTS..................................................................................... 65
I. Raltegravir conformations in gas, water solution and solid state............ 65
1. Raltegravir conformations in the gas phase............................................... 66 2. Molecular dynamic simulations of Raltegravir in water solution............... 68 3. Fragment-based structural analysis............................................................. 70 3.1 Raltegravir configurational/conformational properties........................ 70 3.2 Probing of the Raltegravir coordination to biologically relevant cations - Mg, Mn and K.......................................................... 75 4. Discussion................................................................................................... 79
II. Targets models, representing the HIV-1 Integrase and viral DNA
before and after 3’-processing..................................................................... 81
1. Modelling of the biologically relevant HIV-1 targets.............................. 81
1.1 Models of the unbound Integrase....................................................... 81 1.2 Models of the INvDNA complex..................................................... 83
III. Raltegravir – Targets recognition............................................................. 86
1. Docking poses and conformations............................................................ 86 2. Evaluation of docking algorithms............................................................. 87 3. The viral DNA as a putative Raltegravir target......................................... 90 4. Discussion.................................................................................................. 92
IV. Comparison of Integrase structure from the HIV-1
subtypes B and CRF02_AG and its susceptibility to Integrase
Strand Transfer Inhibitors........................................................................ 96
1. Structural analysis of Integrase from B and CRF02_AG strains.............. 96 2. The INSTIs recognition by Integrase from B and CRF02_AG strains.... 98 3. Discussion.................................................................................................. 102
V. Alternative molecular recognition of DNA induced by Raltegravir
resistance mutations..................................................................................... 106
1. Evidence of a stable W-shaped hairpin in the catalytic site loop................ 106

6
2. Modeling of the catalytic site structure of the HIV-1 integrase.................. 108 3. Effect of Raltegravir-selected mutations on Catalytic Core Domain structure....................................................................................................... 112 4. Model of the displacement of the W-shaped hairpin towards the catalytic site................................................................................................. 114 5. Intermolecular interactions of the Raltegravir-selected mutated residues.......................................................................................... 115 6. 3D maps of H-bonding between the residues 148 and 155 and DNA bases............................................................................................. 117 6.1 The DNA bases recognition by the Wild Type Integrase residues N155 and Q148......................................................................... 118 6.2 The DNA bases recognition by the mutated Integrase residues
N155H and Q148R/H/K.......................................................................... 119 7. Modeling the ‘interacting’ DNA base pairs.................................................. 121 7.1 Arginine side chain interactions with A–T and G–C base pairs............. 121 8. Discussion..................................................................................................... 123
VI. Molecular Dynamics Simulation of the unbound Integrase in the
native and mutated form.............................................................................. 126
1. Root Mean Squared Distances (RMSD) Comparisons............................... 127 2. Root Mean Squared Fluctuations (RMSF) Analysis.................................. 129 3. Principal Component Analysis (PCA)....................................................... 130 3.1 Trajectory Analysis.............................................................................. 131 3.2 Eigen RMSFs Analysis........................................................................ 132 4. Structural Analysis..................................................................................... 133 5. Secondary Structure Analysis.................................................................... 137 6. Discussion.................................................................................................. 140
Chapter 3. GENERAL CONCLUSIONS AND
PERSPECTIVES................................................................. 141
Chapter 4. MATERIALS AND METHODS.............................. 145
I. Probing of Raltegravir structure.................................................................. 145
1. Conformational analysis............................................................................. 145 2. Molecular Dynamics Simulations.............................................................. 145 3. Structural fragment-based analysis (Cambridge Structural Database)....... 146
II. Targets modeling........................................................................................... 147
1. The HIV-1 Integrase models of the B and CRF02_AG strains................ 147 2. IN•DNA Models of the B and CRF02_AG strains.................................. 148 3. Secondary structure prediction.................................................................. 149
4. Generation of the models of unbound INHIV, INHIV•vDNAPFV complex and vDNAHIV............................................................................................. 150

7
III. Molecular Docking Protocols........................................................................ 151
1. Integrase Strand Transfer Inhibitors (INSTIs) binding with IN and IN•vDNA complex of B and CRF02_AG strains...................................... 151 2. Raltegravir docking onto the targets-INHIV, INHIV•vDNAPFV complex and
vDNAHIV................................................................................................... 152
IV. Molecular Dynamics Simulations of unbound Integrase........................... 154
V. Molecular Modelling..................................................................................... 155
1. Wild type IN models preparation.............................................................. 155
2. Model minimizations................................................................................. 156
3. Simulations of the movement of the 140–149 loop towards the catalytic site.......................................................................................... 156
4. Characterization of the side-chains and DNA bases interactions.............. 157
REFERENCES.................................................................................................. 159
APPENDIX........................................................................................................... 178
8
ABBREVIATIONS
2D In two dimensions
3D In three dimensions
3’-P 3’-Processing Reaction
AIDS Acquired Immuno-deficiency Syndrome
ARV Anti-retroviral
CCD Catalytic Core Domain
CTD C-Terminal Domain
DNA Deoxyribonucleic Acid
ELV Elvitagravir
GLIDE Grid-based Ligand Docking with Energetics
HIV Human Immuno-deficiency Virus
INSTI Integrase Strand Transfer Inhibitors
LEDGF Lens epithelium-derived growth factor
MD Molecular Dynamics
NMR Nuclear Magnetic Resonance
NTD N-Terminal Domain
PCA Principal Component Analysis
PDB Protein Data Bank
PFV Primate Foamy Virus
PIC Pre-Integration Complex
RAL Raltegravir
RMSD Root Mean Squared Distance
RMSF Root Mean Squared Fluctuations
RNA Ribonucleic Acid
ST Strand Transfer Reaction
WT Wild Type
9
Chapter 1. INTRODUCTION
I. HIV, AIDS and Antiretroviral Therapy
1. HIV Epidemiology and Polymorphism
In 1981, early cases of a new human epidemic began to emerge in the United States of
America. In June 1981, the Centre for Disease Control and Prevention (CDC) published an
article in Morbidity and Mortality Weekly Report which reported that 5 homosexual men were
diagnosed with Pneumocystis carinii pneumonia in Los Angeles (Centers for Disease Control,
1981a). Soon after this report, another article published by CDC reported the cases of
Kaposi’s Sarcoma among 26 homosexual men in the United States of America - 20 in New
York and 6 in Los Angeles (Centers for Disease Control, 1981b). These reports were the first
official reporting of a disease that would later become known as the AIDS epidemic. The
CDC published its first definition of AIDS in September 1982 as “a disease, at least
moderately predictive of a defect in cell mediated immunity, occurring in a person with no
known cause for diminished resistance to that disease”(Centers for Disease Control, 1982). It
was characterized by diseases resulting from an impaired immune system.
In 1978, Robert C. Gallo’s group reported the discovery of the first human retrovirus,
Human T-cell Leukemia Virus Type 1 (HTLV-I) (Gallo et al., 1978). HTLV-I was the first of
the only four retroviruses that infect human beings (the other three being HTLV-II, HIV-1 and
HIV-2). HTLV-I is a retrovirus containing single-stranded RNA and causes cancers such as
T-cell leukemia and T-cell lymphoma in adults. Gallo’s team and his collaborators had also
discovered the first cytokine called T-Cell Mitogenic factor, which was later named as
Interleukine-2 (IL-2) in 1976 (Morgan, Ruscetti, & Gallo, 1976) which was the to be
identified. IL-2 is a vital growth factor for the T-lymphocytes in the presence of which the

10
cells proliferate at significantly higher levels. This was one of the most important
technological developments that helped isolation of HIV eventually.
Gallo suggested in 1982, that AIDS was possibly caused by a retrovirus similar to
HTLV. Prior to that, James Curran of the CDC in Atlanta, USA, also proposed that AIDS was
possibly caused by an infectious agent, most likely a new virus. In 1984, Gallo and his
collaborators published a series of papers (Sarngadharan, Popovic, Bruch, Schupbach, &
Gallo, 1984; Schupbach et al., 1984; Gallo et al., 1984; Popovic, Sarngadharan, Read, &
Gallo, 1984) demonstrating that a retrovirus they had isolated, called HTLV-III in the belief
that the virus was related to the leukemia viruses of Gallo's earlier work, was the cause of
AIDS. In 1983, Luc Montagnier and his team at Pasteur Institute in Paris, France, had
published a paper, describing a retrovirus they called LAV (lymphadenopathy associated
virus, LAV), isolated from a patient at risk for AIDS (Barre-Sinoussi et al., 1983). The Nobel
Prize for Physiology or Medicine in 2008 was awarded to Montagnier and Barré-Sinoussi for
their co-discovery of the infectious agent, which came to be known as Human
Immunodeficiency Virus (HIV).
Following the discovery of the HIV as the causative agent of AIDS, many advances
were made in a short period of time. Some of the noteworthy advances include the
understanding of the modes of transmission in 1984-85; the sequencing of the HIV-1 genome
(Sanchez-Pescador et al., 1985; Ratner et al., 1985; Wain-Hobson, Sonigo, Danos, Cole, &
Alizon, 1985); the main target cells CD4 T cells and macrophages were elucidated (Harper,
Marselle, Gallo, & Wong-Staal, 1986; Shaw et al., 1984); production of key reagents; the
genomic heterogeneity of HIV ('84) – including the innumerable micro-variants within a
single patient (Saag et al., 1988; Hahn et al., 1986); the epidemic was closely monitored for
the first time; the SIV-monkey model (Chalifoux et al., 1987; Chakrabarti et al., 1987); and
the understanding of pathogenesis began (Lane & Fauci, 1985).

11
The spread of AIDS was rapid, soon after first reported in 1981 in the USA; fourteen
countries reported cases of AIDS in 1982, and 33 already in 1983. By the end of 2008, 33.4
million people worldwide were estimated to be living with HIV. Figure 1 displays the
prevalence of HIV in different regions of the world.
Figure 1. Global prevalence of HIV in 2009. The figure was adapted from the UNAIDS 2010 AIDS epidemic update report (www.unaids.org)
According to the UNAIDS 2010 report, in 2009, there were an estimated 2.6 million
[2.3 million–2.8 million] people who became newly infected with HIV. This is nearly one
fifth (19%) fewer than the 3.1 million [2.9 million–3.4 million] people newly infected in
1999, and more than one fifth (21%) fewer than the estimated 3.2 million [3.0 million–3.5
million] in 1997, the year in which annual new infections peaked .
As it can be seen from the regional profiles of HIV prevelance around the World
(Figure 1), there is geographic variation between and within countries and regions. Epidemic
patterns can change over time. A recent 2009 report from UNAIDS suggests that national
epidemics throughout the world are experiencing important transitions. In Eastern Europe and
Central Asia, epidemics that were once characterized primarily by transmission among
12
injecting drug users are now increasingly characterized by significant sexual transmission,
while in parts of Asia epidemics are becoming increasingly characterized by significant
transmission among heterosexual couples. Sub-Saharan Africa still bears an inordinate share
of the global HIV burden. The epidemics in sub-Saharan Africa vary considerably, with
southern Africa being the most severely affected. An estimated 11.3 million [10.6 million–
11.9 million] people were living with HIV in southern Africa in 2009, nearly one third (31%)
more than the 8.6 million [8.2 million– 9.1 million] people living with HIV in the region a
decade earlier. The high prevalence in sub- Saharan Africa can also be attributed to the fact
that this region is believed to be the origin of HIV (Zhu et al., 1998). It is estimated that HIV
entered the human population in 1931 through multiple infections from simian
immunodeficiency virus (SIV) - infected nonhuman primates (Korber et al., 2000). Thus, the
virus went undetected for many years after its entry into human population, until the cases of
AIDS were detected in 1981. During these years, the virus could spread unrecognized, mainly
because the late symptoms of AIDS coincide with symptoms of e.g. malnutrition and
tuberculosis, which happen to be frequent problems in the infected population.
HIV can be divided into two major types: HIV-1 evolved from an SIV variant present
in chimpanzees, whereas the other type, HIV-2 is the result of a zoonotic infection from SIV
in sooty mangabeys (Heeney et al., 2006). HIV-1 is the most common and pathogenic strain
of the virus. HIV-1 into a major group (Group M) and two or more minor groups. Group M
was the first to be discovered and is the most common type of HIV, with more than 90% of
HIV/AIDS cases deriving from infection with HIV-1 group M. Since its discovery it has
infected at least 60 million people and caused more than 25 million deaths The M group is
subdivided further subtypes. HIV-1 group M is further divided into subtypes, based on
clusters typically appearing in phylogenetic analyses of genetic sequences of HIV-1 group M
(Robertson et al., 2000). These subtypes are named A-D, F-H, J and K. In addition to these
13
subtypes of group M of HIV-1, there are also circulating recombinant forms (CRFs) derived
from recombination between viruses of different subtypes which are each given a number.
The other subtypes of HIV-1 are N, O and P which are much less prevalent than the group M.
Questions related to HIV-1 subtypes and its influence on disease progression (Kanki et
al., 1999) and efficacy of antiretroviral treatment are still of major interest. HIV-1 subtype B
is most prevalent in the developed, industrialized regions of the world, and therefore a
representative of this subtype was used for development of antiretroviral drugs (Kantor et al.,
2005). The genetic changes that distinguish B variants from non-B variants are believed to
hamper the effectiveness of antiretroviral therapy (Descamps et al., 1998). HIV-1 subtype B
is the best-studied variant of HIV-1 owing to the available resources and infrastructure for
research in its region of prevalence. The other HIV-1 subtypes clearly deserve more attention
than they have received so far. However, data collection efforts in regions of their prevalence
(mainly Africa, South America and Asia) are less advanced than in Europe and North
America. Hence, there exists a certain bias towards the HIV-1 subtype B. The diversity of
HIV poses also one of the major challenges for HIV vaccine design (Walker & Burton, 2008).
The sequence diversity within a single subtype, for example, can reach up to 20%. Clearly, the
sequence diversity is an issue especially for antibody based vaccines that require conserved
epitopes on surface proteins.
HIV-2 is much less pathogenic than HIV-1 and is restricted in its worldwide
distribution. HIV-2 has remained largely restricted to West Africa, with its highest prevalence
rates recorded in Guinea-Bissau and Senegal (de Silva et al. 2008). However, overall
prevalence rates are declining, and in most West African countries HIV-2 is increasingly
being replaced by HIV-1 (van der Loeff et al. 2006; Hamel et al. 2007). Most individuals
infected with HIV-2 do not progress to AIDS, although those who do, show clinical
symptoms indistinguishable from HIV-1 (Rowland- Jones and Whittle 2007). Thus, it is clear
14
that the natural history of HIV-2 infection differs considerably from that of HIV-1, which is
not surprising given that HIV-2 is derived from a very different primate lentivirus.
2. Human Immunodeficiency Virus Type 1
Extensive knowledge on HIV has been accumulated and a substantial amount of
literature is available (PubMed search for “The human immunodeficiency virus” extracted >
250, 000 publications). HIV is a part of the retroviruses family and, is a member of the genus
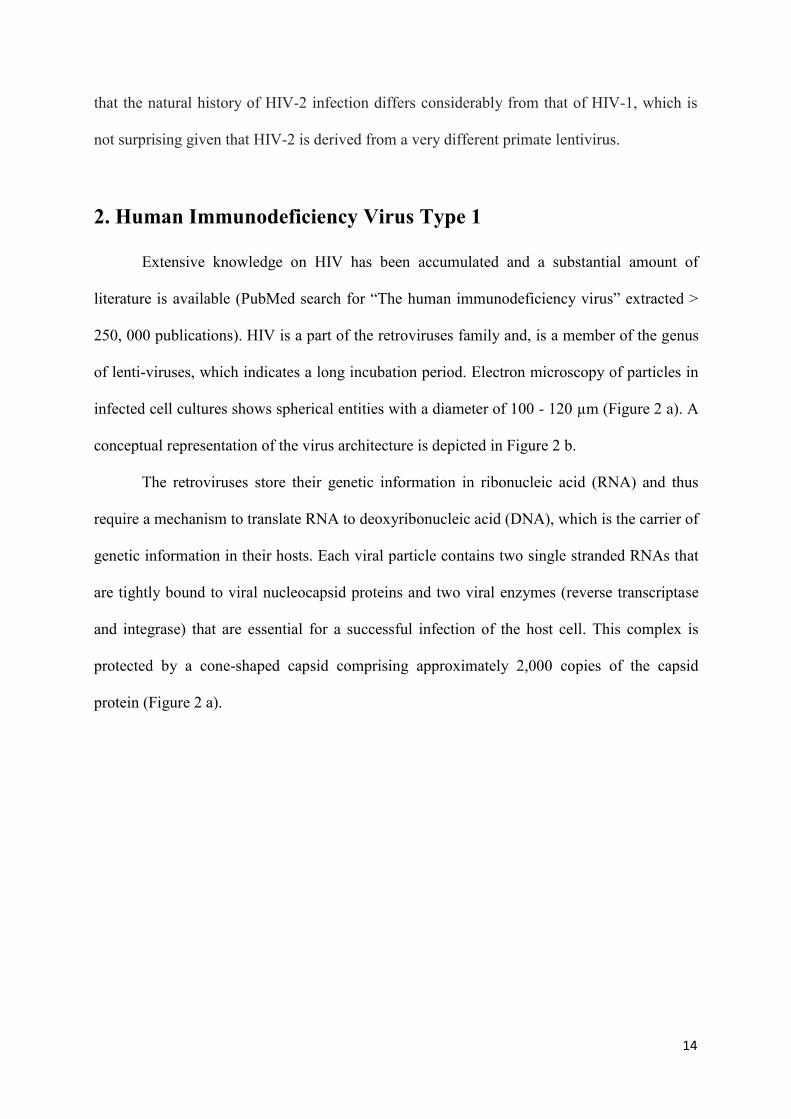
of lenti-viruses, which indicates a long incubation period. Electron microscopy of particles in
infected cell cultures shows spherical entities with a diameter of 100 - 120 µm (Figure 2 a). A
conceptual representation of the virus architecture is depicted in Figure 2 b.
The retroviruses store their genetic information in ribonucleic acid (RNA) and thus
require a mechanism to translate RNA to deoxyribonucleic acid (DNA), which is the carrier of
genetic information in their hosts. Each viral particle contains two single stranded RNAs that
are tightly bound to viral nucleocapsid proteins and two viral enzymes (reverse transcriptase
and integrase) that are essential for a successful infection of the host cell. This complex is
protected by a cone-shaped capsid comprising approximately 2,000 copies of the capsid
protein (Figure 2 a).
15
(a) (b)
Figure 2. (a) Electron micrograph of a budding HIV particle and mature HIV particles with visible viral core from Fields et al. (2007). (b) Schematic representation of a single HIV virion. (http://www.niaid.nih.gov/topics/hivaids/understanding/biology/pages/hivvirionlargeimage.aspx).
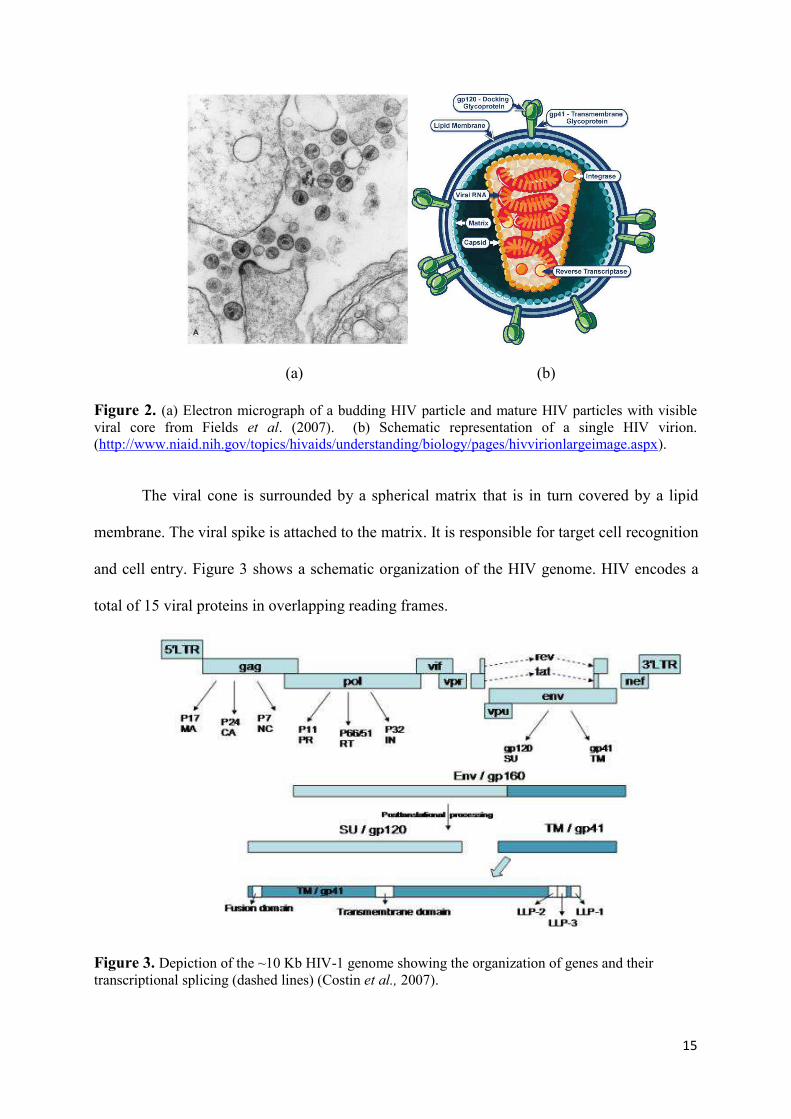
The viral cone is surrounded by a spherical matrix that is in turn covered by a lipid
membrane. The viral spike is attached to the matrix. It is responsible for target cell recognition
and cell entry. Figure 3 shows a schematic organization of the HIV genome. HIV encodes a
total of 15 viral proteins in overlapping reading frames.
Figure 3. Depiction of the ~10 Kb HIV-1 genome showing the organization of genes and their transcriptional splicing (dashed lines) (Costin et al., 2007).

16
HIV has several major genes coding for structural proteins. The gag (group-specific antigen)
gene provides the physical infrastructure of the virus. The gag gene is the precursor of four
viral structural proteins: p24 (the viral capsid), p6 and p7 (the nucleocapsid proteins), and p17
(the viral matrix). The polymerase gene (Pol) encodes for three proteins: the protease, the
reverse transcriptase, and the integrase. Pol gene provides the mechanism for the retroviral
reproduction. The env (envelope) gene codes for glycoprotein gp160 which acts as a
precursor to the glycoproteins gp 120 and gp 41. The smaller genes encode for transactivators
– Tat (Trans-Activator of Transcription), Rev (Regulator of Virion Expression), Vpr (Viral
Protein R)- which enhance gene expression, and other regulatory proteins – Vif (Viral
infectivity factor), Nef (Negative Regulatory Factor) and Vpu(Viral Protein U) which help
the virus to be more efficient in its reproduction and to counter the defense mechanisms of the
host cell.
3. HIV-1 subtypes and circulating recombinant forms
The global distribution of HIV-1 subtypes and recombinants indicated a broadly stable
distribution of HIV-1 subtypes worldwide with a notable increase in the proportion of
circulating recombinant forms (CRFs), a decrease in unique recombinant forms (URFs) and
an overall increase in recombinants (Hemelaar et al., 2011). Particularly, in 2004-2007,
CRF02_AG accounted for 8% of all global infections, following subtypes C (48%), A (12%)
and B (11%). CRF02_AG is the predominant HIV strain circulating in West and West Central
Africa (Fischetti et al., 2004; Njai et al., 2006). Recently the recombinant CRF02-AG form
was identified in the Amazon region of Brazil (Machado et al., 2009) and in China (Ye et al.,
2012).
In France the frequency of antiretroviral-naive chronically HIV-infected patients
infected with a non-B subtype reached 42% in 2006/2007, having increased significantly since
17
1998 (10%) and 2001 (33%). This evolution in subtype distribution was mainly due to a
higher proportion of patients originating from sub-Saharan countries. Among these non-B
subtypes, the most prevalent was CRF02-AG with a stable proportion around 20% between
2001 and 2006/2007 (Descamps et al., 2010).
Enzymatic and virological data support the concept that naturally occurring
polymorphisms in different non-B subtypes can affect the susceptibility of HIV-1 to different
antiretroviral drugs, the magnitude of resistance conferred by major mutations, and the
propensity to acquire some resistance mutations (Martinez-Cajas et al., 2008). The genetic
variation between viral isolates retroviral enzymes is estimated up to 25-35%; particularly the
pol gene exhibits high variation, about 10-15 % for reverse transcriptase (RT) and 8-12% for
integrase (IN) (Taylor et al., 2008). Integrase inhibitors are active in vivo against B and non-B
subtypes. Furthermore, in vitro studies suggested that subtype C integrase is equally
susceptible to INSTIs (Bar-Magen et al., 2009). Similarly, the analysis of pol gene in infected
patients showed that highly prevalent polymorphisms have little effect on INSTIs
susceptibility (Low et al., 2009). Nevertheless, the comparison of IN sequences of B and
CRF02_AG strains showed that CRF02_AG sequence differs from the B sequence by 13
residues (K/R14, V/I31, L/I101, T/V112, T/A124, T/A125, G/N134, I/V135, K/T136, V/I201,
T/S206, L/I234 and S/G283) (Malet et al., 2008). Based on a model of the B HIV-1
integrase/DNA complex (Fenollar-Ferrer et al., 2008), it was suggested that several of these
variations K/R14, T/V112, T/A125, G/N134, K/T136, and T/S206 may impact IN interaction
with DNA or IN susceptibility to INSTIs. Later we compared the genetic barriers between B
and CRF02_AG strains; we found that the variability between subtypes impacted the genetic
barrier for G140C/S and V151I with a higher genetic barrier being calculated for subtype
CRF02_AG suggesting a great difficulty in selecting these mutations for CR02_AG compared
to subtype B (Maiga et al., 2009).
18
4. HIV Replication Cycle
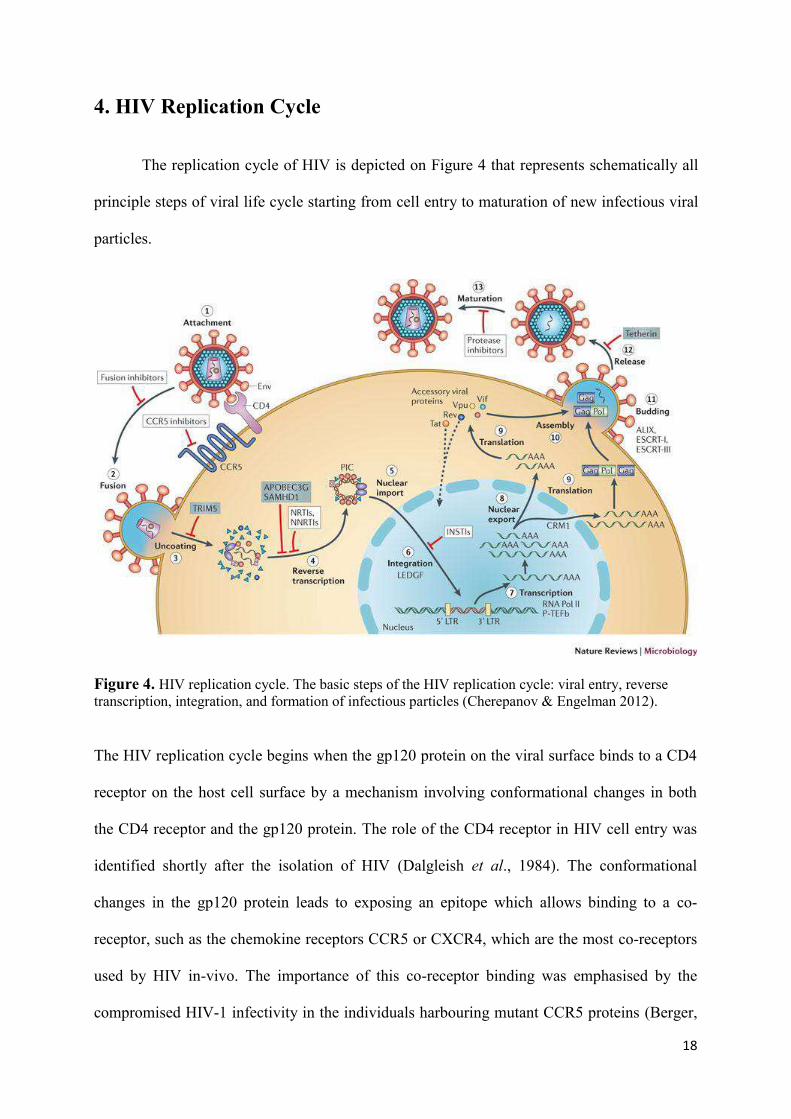
The replication cycle of HIV is depicted on Figure 4 that represents schematically all
principle steps of viral life cycle starting from cell entry to maturation of new infectious viral
particles.
Figure 4. HIV replication cycle. The basic steps of the HIV replication cycle: viral entry, reverse transcription, integration, and formation of infectious particles (Cherepanov & Engelman 2012).
The HIV replication cycle begins when the gp120 protein on the viral surface binds to a CD4
receptor on the host cell surface by a mechanism involving conformational changes in both
the CD4 receptor and the gp120 protein. The role of the CD4 receptor in HIV cell entry was
identified shortly after the isolation of HIV (Dalgleish et al., 1984). The conformational
changes in the gp120 protein leads to exposing an epitope which allows binding to a co-
receptor, such as the chemokine receptors CCR5 or CXCR4, which are the most co-receptors
used by HIV in-vivo. The importance of this co-receptor binding was emphasised by the
compromised HIV-1 infectivity in the individuals harbouring mutant CCR5 proteins (Berger,
19
Murphy, & Farber, 1999). Following this, HIV is now able to enter into the cell by a process
that involves fusion of the viral envelope with the plasma membrane of the host cell.
Although, studies have supported the hypothesis that HIV primarily enters the target cell by
endocytosis followed by fusion in the endosome and not by fusion directly at the plasma
membrane (Uchil & Mothes, 2009). The entry of virus inside the host cell is followed by
Reverse Transcription, catalysed by the the viral enzyme reverse transcriptase (RT), which
transcribes the viral single-stranded RNA genome is converted into double-stranded DNA
(dsDNA). ). Together with viral and host proteins the dsDNA forms the pre-integration
complex (PIC), which is guided to the nuclear pore. This is an essential step in the HIV
replication cycle of HIV because it prepares the viral genome for the subsequent integration
into the host chromosome. The viral enzyme Integrase is a part of the PIC which catalyzes the
integration of viral DNA into the host chromosome, after the PIC has entered the nucleus of
the host cell. The virus now exists as a part of the host genome and is referred to as Provirus.
The next phase of viral replication involves transcription of the integrated DNA provirus into
messenger RNA (mRNA), which is then spliced into smaller pieces. The spliced mRNA
fragments translated into regulatory proteins Tat and Rev, encouraging new virus production,
upon being exported exported to the cytoplasm from the nucleus. The poly-proteins Env and
Gag/Gag-Pol are also transported to the viral membrane where they participate in formation of
new viral particles. In the final step of the viral cycle, new HIV-1 virions begin to assemble at
the plasma membrane of the host cell. The Env poly protein (gp160) is transported to the
golgi complex after going through endoplasmatic reticulum of the host cell. In the cell’s Golgi
complex gp160 protein is cleaved into two HIV envelope glycoproteins – gp120 and gp41 –
which are further transported to the plasma membrane of the host cell. As the forming virion
begins to bud from the host cell, Gag and Gag-Pol poly proteins associate with the the plasma
membrane along with the HIV genomic RNA. The process of maturation can occur either in

20
the forming bud or in the immature virion after it buds from the host cell. After release, the
Gag and Gag–Pol proteins are cleaved into their mature forms by the viral protease (PR)
which is part of Gag or Gag–Pol polyproteins in the particle. The diverse structural entities
assemble to produce a mature HIV virion which is further able to infect another cell.
II. Antiretroviral Drugs
The significant advancement in the understanding of HIV replication and its pathogenesis has
helped in the identification of various pharmacological targets. The first anti-HIV agent to be
licensed for clinical use was Zidovudine (AZT), in 1987. Since then, several anti-HIV
compounds have been approved for the treatment of AIDS by the FDA and EMEA (European
Medicine Agency) for treating HIV infections (DrugBank: http://www.drugbank.ca/). These
compounds fall within different categories depending on the target within the HIV replicative
cycle they interact with.
1. The Entry and Fusion Inhibitors
These inhibitors intercept the viral replication at the entry of the viral core into the cytosol
of the host cell. Among all approved anti-HIV drugs, entry inhibitors are the only drugs that
target a host protein rather than a viral protein. The group of entry inhibitors can be
subdivided into classes of agents that act at different stages of entry: attachment and CD4
binding, co-receptor binding, and fusion. Currently, only antagonists that block CCR5 binding
(Maraviroc) and fusion (Enfuvirtide) have been approved by the FDA for treatment of HIV-
infected patients, although strategies to inhibit other aspects of HIV entry are under
development (Tilton & Doms, 2010). In addition to maraviroc, more CCR5 and also CXCR4
inhibitors are under investigation (Este & Telenti, 2007). Prior to the use of co-receptor

21
blockers, it is necessary to determine the co-receptor which is being used by the virus for
entering (Lengauer et al., 2007). Enfuvirtide (abbreviated ENF or T-20) prevents HIV from
entering a target cell inhibiting fusion of virus and host cell membranes. ENF binds to a
subunit of gp41 and therefore prevents the required conformational change that facilitates the
fusion of host and viral membrane. Drug resistance mutations are usually located in the ENF-
binding site on gp41 (direct resistance) or confer resistance indirectly via mutations in other
regions of gp41 and even in gp120 (Miller & Hazuda, 2004).
2. The Reverse Transcriptase (RT) Inhibitors
The Reverse Transcriptase (RT) inhibitors interfere with the generation of a DNA
copy of the viral genome. RT functions as a heterodimer to catalyze the conversion of the
single-stranded genomic RNA into double-stranded DNA with duplicated long terminal
repeats, which is integrated into cellular DNA by the viral integrase. RT heterodimer,
comprising of p66 and p51 units (Figure 3), is generated by the viral protease from a p66/p66
homodimer by cleavage of the C terminal RNase H domain during maturation of the viral
particle. The polymerase and RNase H catalytic sites are located on p66, while p51 plays a
structural role (Kohlstaedt et al., 1992).
There are two classes of RT inhibitors, distinguished by their mode of action. First of
them is the group of nucleoside/nucleotide reverse transcriptase inhibitors (NRTIs). These are
nucleoside and nucleotide analogues that are incorporated by the viral RT into the newly
synthesized DNA strand. They are inactive in their parent forms and require successive
phosphorylation steps by host cell kinases and phosphotransferases to form deoxynucleoside
triphosphate (dNTP) analogs capable of viral inhibition. In their respective triphosphate (TP)
forms, NRTIs compete with their corresponding endogenous dNTPs for incorporation by HIV
RT. Once incorporated, they serve as chain-terminators of viral RT, thus, acting early in the
22
viral replication cycle by inhibiting a critical step of proviral DNA synthesis prior to
integration into the host cell genome (Cihlar & Ray, 2010). The currently approved NRTIs
are Zidovudine, Lamivudine, Didanosine, Zalcitabine, Stavudine, Abacavir, and Emtricitabine
The second group of RT inhibitors is the Non-nucleoside reverse transcriptase
inhibitors (NNRTIs). They are small molecules that carry out the inhibition of RT by binding
to a hydrophobic pocket in the proximity of the active site of the enzyme. After the inhibitor is
bound, it impairs the flexibility of the RT resulting in its inability to synthesize DNA.
Mutations can cause resistance to NNRTIs which results in reduced affinity of the inhibitor to
the protein. Usually, a single mutation selected by one NNRTI is sufficient to confer complete
resistance to all compounds of the drug class (Clavel & Hance, 2004).
3. The Protease Inhibitors (PIs)
Protease Inhibitors (PIs) interfere with the process of forming new infectious viral
particles. The viral protease is engaged in virion maturation.
Protease targets the amino acid sequences in the gag and gag–pol polyproteins, which
must be cleaved before nascent viral particles (virions) can mature. Cleavage of the gag
polyprotein produces three large proteins (p24, p17 , and p7) that contribute to the
structure of the virion and to RNA packaging, and three smaller proteins (p6, p2, and p1) of
uncertain function. PIs are small molecules that bind to the active site of the protease and
therefore compete with its natural substrates. PIs contain a synthetic analogue of the amino
acid sequence of the gag–pol polyprotein at position that is cleaved by the protease. PIs
prevent cleavage of gag and gag–pol protein precursors in acutely and chronically infected
cells, arresting maturation and hence blocking the infectivity of nascent virions (Flexner,
1998). The resistance of HIV against PIs can be achieved by two mechanisms. The first one
involves the exchange of amino acids in the protease such that the affinity to the inhibitor is
23
decreased while the natural substrates can be bound efficiently as opposed to the synthetic
analogues (Clavel & Hance, 2004). Modifications of the affinity to the natural substrate alter
also the efficiency of the protease. Thus, the second mechanism introduces compensatory
mutations aiming at re-establishing the efficiency of the enzyme while maintaining resistance
against the inhibitor. These compensatory mutations can occur either in the protease or in its
substrate, i.e. at cleavage sites (Nijhuis et al., 2007). The four approved HIV-protease
inhibitors are based on amino acid sequences recognized and cleaved in HIV proteins-
Indinavir, Nelfinavir, Ritonavir and Saquinavir.
4. The Integrase Inhibitors (INIs)
Integrase inhibitors aim at preventing the enzyme activities, particularly integrating the
viral DNA into the host chromosome. The integrase (IN) functions as a tetramer. Each
monomer, which is cleaved out by the protease from the C-terminal portion of the Gag-Pol
polyprotein (Figure 3), has three domains.
The N-terminal domain (NTD) contains a HH-CC zinc finger motif that is partially
responsible for multimerization, optimal activity, and protein stability. The DDE motif in the
catalytic core domain (CCD) forms the catalytic triad. The C-terminal domain (CTD) binds
non-specifically to DNA with high affinity. The integration of the viral DNA requires three
subsequent steps (Figure 4). During the 3’ processing step the integrase removes a di-
nucleotide from the long terminal repeat of each HIV-DNA strand. This step is followed by a
process termed strand transfer occurring in the nucleus where the integrase cuts the cellular
DNA and covalently links the viral DNA 3’ ends to the target DNA. The final step, the
required gap repair, is believed to be carried out by host DNA repair enzymes (Yoder &
Bushman, 2000).
24
Two strategies were employed for the development of IN inhibitors. First, targeting the
IN structure at the 3’-P step and the other targeting the ST step (Discussed in III. Structure
and Functions of HIV-1 Integrase).
Currently only one FDA approved integrase inhibitor (INI) is available. Raltegravir
(RAL) is a strand transfer inhibitor that interferes with the process by binding to the DDE
motif in the catalytic domain (Hazuda et al., 2000). Successful inhibition of the integration
process leaves the viral DNA in the nucleus, where it is re-circularized by the host’s repair
enzymes. Hence, the HIV life cycle is interrupted. Like other antiretroviral inhibitors, RAL
develops/induces a resistance effect (Discussed in III. Structure and Functions of HIV-1
Integrase). The mechanism of resistance of HIV against INIs is still subject to investigation.
5. Highly Active Antiretroviral Therapy (HAART) and resistance
effect to drugs
As discussed above, the HIV develops resistance against individual drugs and
inhibitors. This problem required a new pharmaceutical strategy. An approach of combination
therapy was developed which involved combining several antiretroviral compounds. This
approach benefited the most from the development of drugs in NNRTIs and PI classes.
Combination therapy can block the resistance effect more effectively for two reasons; first,
multiple mechanisms are required for resistance to occur to all drugs in the regimen and
second; multiple drugs suppress viral replication more effectively than single agents. This
marked the beginning of the era of highly active antiretroviral therapy (HAART) in 1995.
HAART combines a minimum of three drugs from at least two different drug classes targeting
distinct proteins (Clavel & Hance, 2004). A typical HAART treatment combines two NRTIs
plus either one PI or one NNRTI (Dybul et al., 2002). Combinations of antiretrovirals create
25
multiple barriers to the HIV replication process. This helps to keep the number of offspring
low and reduce the possibility of a superior mutation.
In 2006, it was reported that the number of HIV related deaths declined as compared to
the pre-HAART era. Despite the increasing concerns regarding antiretroviral resistance, the
death rate among HIV-infected people continued to decline (Crum et al., 2006).
HAART suffers from certain limitations, despite of its success. HAART therapy is
highly effective in delaying the onset of AIDS but its clinical utility is limited by viral
resistance, non-adherence to therapy, and drug toxicity. Consequently, multidrug regimens are
necessary for successful treatment. Since each HAART agent has its own unique adverse
effect profile, selecting a regimen with a favourable profile may be difficult. For example,
certain PIs produce adverse metabolic effects that may increase the risk of developing
cardiovascular disease. On the other hand, NNRTI-based therapies may result a different side
effect profile. Since each HAART agent has specific limitations, tailoring a regimen to the
individual patient is of utmost importance for achieving optimal outcomes (Sension et al.,
2007). Once this therapy is initiated, it should never be stopped. This results from the fact that
the selection pressure of incomplete suppression of viral replication in the presence of drug
therapy can cause more drug sensitive strains to be selectively inhibited. In 1996, it was
discovered that
In 2005-06, FDA approved Fixed-dose combinations of antiretrovirals (for example,
Atripla). These are multiple antiretroviral drugs combined into a single pill, which helps to
significantly simplify a drug treatment regimen by reducing the pill burden, helping to
increase adherence and thus reducing potential development of viral resistance to the drugs.
This may result in longer term effectiveness of the regimen. They may combine different
classes of antiretrovirals or contain only a single class. Another milestone in HAART was the

26
discovery that the protease inhibitor ritonavir interferes with the liver enzyme cytochrome
P450 (Kumar et al., 1996). This enzyme is involved in the metabolic processing of most
protease inhibitors. Thus, the use of a small dose of ritonavir inhibits the liver enzyme, and
helps to maintain optimal levels of other protease inhibitors in the patient’s blood for a longer
period of time. The boosting of protease inhibitors with ritonavir is standard as of 2001 –
following the introduction of Kaletra (LPV+RTV) – and is usually denoted by PI/r.
II. Structure and Functions of the HIV-1 Integrase
1. Structural characterization of the HIV-1 Integrase
1.1 Experimental Data
The HIV-1 integrase is a 288-amino acid protein (32 kDa) encoded by the C-terminal part
of the pol gene of the HIV-1 genome (Figure 3). It has three structurally independent domains:
(i) the N-terminal domain (NTD) (IN1–49) with a non-conventional HHCC zinc-finger motif,
promoting protein multi-merization; (ii) the central core domain (CCD) (IN50–212) containing a
canonical D, D(35)E motif and involved in DNA substrate recognition; (iii) the C-terminal
domain (CTD) (IN213–288), which binds DNA non-specifically and helps to stabilize the
IN•DNA complex (Asante-Appiah & Skalka, 1999). Neither the structure of isolated full-
length IN from HIV-1 nor that of IN complex with its DNA substrate has been determined.
Nevertheless, the structures of the isolated HIV-1 domains or two domains were characterized
by X-ray crystallography (34 structures) and NMR analysis (9 structures) (Berman et al.,
2000).
The structures of the isolated HIV-1 NTD (IN1–49) and CTD (IN219–270) domains have been
determined by NMR (Cai et al., 1997; Eijkelenboom et al., 1995). The IN1–49 polypeptide has
a structure consisting of four helices stabilized by a Zn2+ cation in tetrahedral coordination
27
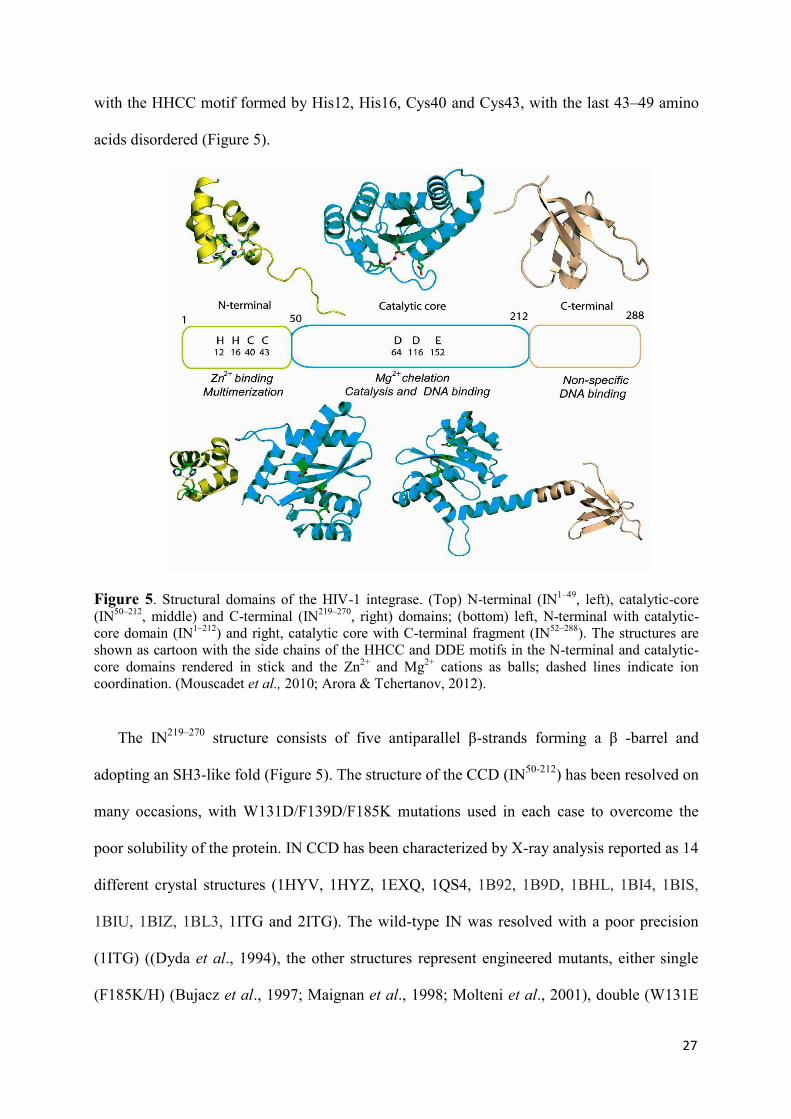
with the HHCC motif formed by His12, His16, Cys40 and Cys43, with the last 43–49 amino
acids disordered (Figure 5).
Figure 5. Structural domains of the HIV-1 integrase. (Top) N-terminal (IN1–49, left), catalytic-core (IN50–212, middle) and C-terminal (IN219–270, right) domains; (bottom) left, N-terminal with catalytic-core domain (IN1–212) and right, catalytic core with C-terminal fragment (IN52–288). The structures are shown as cartoon with the side chains of the HHCC and DDE motifs in the N-terminal and catalytic-core domains rendered in stick and the Zn2+ and Mg2+ cations as balls; dashed lines indicate ion coordination. (Mouscadet et al., 2010; Arora & Tchertanov, 2012).
The IN219–270 structure consists of five antiparallel β-strands forming a β -barrel and
adopting an SH3-like fold (Figure 5). The structure of the CCD (IN50-212) has been resolved on
many occasions, with W131D/F139D/F185K mutations used in each case to overcome the
poor solubility of the protein. IN CCD has been characterized by X-ray analysis reported as 14
different crystal structures (1HYV, 1HYZ, 1EXQ, 1QS4, 1B92, 1B9D, 1BHL, 1BI4, 1BIS,
1BIU, 1BIZ, 1BL3, 1ITG and 2ITG). The wild-type IN was resolved with a poor precision
(1ITG) ((Dyda et al., 1994), the other structures represent engineered mutants, either single
(F185K/H) (Bujacz et al., 1997; Maignan et al., 1998; Molteni et al., 2001), double (W131E
28
and F185K; G149A and F185K or C56S and F185K) (Goldgur et al., 1998; Goldgur et al.,
1999; Greenwald et al., 1999) or multiple (C56S, W131D, F139D and F185K) (Chen et al.,
2006) mutants which were designed to overcome the poor solubility of the protein.
The core domain has a mixed α/β structure, with five β-sheets and six α -helices (Figure 5)
(Dyda et al., 1994). The active site residues D64, D116 and E152 are located in different
structural elements: β-sheet (β1), coil and helix (α4), respectively. The CCD comprises a
flexible 10 residues loop (140–149) that encompasses the catalytic site. Conformational
changes in this loop are required for 3’-P and ST reactions (Mouscadet et al., 2010). The IN
activities require the presence of the metallic cofactor(s), which binds to the catalytic residues
D64, D116 and E152. The structures of Avian Sarcoma Virus (ASV) IN (Bujacz et al., 1997)
and the Tn5 transposase (Lovell et al., 2002) have provided evidence of a two-metal active
site structure, which has been used to build metal-containing IN models (Karki et al., 2004;
Wang et al., 2005). Crystallographic structures of IN1–212 and IN50–288 two-domain constructs
have also been obtained for W131D/F139D/F185K and C56S/W131D/F139D/F185K/C180S
mutants, respectively (Figure 6) (Chen et al., 2000; Wang et al., 2001). In the first of these
structures, there is an asymmetric unit containing four molecules forming pairs of dimers
connected by a non-crystallographic two fold axis, in which the CCD and NTD are well
resolved, their structures closely matching those found with isolated IN1–45 and IN50–212
domains, and connected by a highly disordered linking region (amino acids 47–55). The X-ray
structure of the other two-domain construct, IN50–288, showed there to be a two-fold symmetric
dimer in the crystal. The CCD and CTD were connected by a perfect helix formed by residues
195–221. The local structure of each domain was similar to the structure of the isolated
domains. The dimeric interface between two CCD monomer subunits was found to be similar
to the isolated CCD, whereas the dimer C-terminal interface differed from that obtained by
NMR. Recently the complete structure of the HIV-1 homologue - the Primate foamy virus

29
(PFV) integrase complexed with the substrate DNA has also recently been reported (Hare et
al., 2010). All these available structural experimental data together with biochemical
evidences are useful for generation of the HIV-1 IN models.
1.2 Theoretical Models
Integrase acts as a multimer (Ellison et al., 1995). Dimerization is required for the 3’-
processing step, with tetrameric IN catalyzing the ST reaction (Faure et al., 2005; Guiot et al.,
2006). Dimeric models were built to reflect the specific contacts between IN and the LTR
terminal CA/TG nucleotides identified in vitro (De et al., 2003; Esposito & Craigie, 1998)
(Figure 6 a). However, most models represent a tetrameric IN alone or IN complex with either
vDNA or vDNA/hDNA, recapitulating the simultaneous binding of IN to both DNAs required
for strand transfer (Figure 6 b–d). These models were either based on the partial crystal
structure of IN (Gao, Butler, & Bushman, 2001) or constructed by analogy with a synaptic
Tn5 transposase complex described in previous studies (Davies et al., 2000; Podtelezhnikov et
al., 2003; Wielens, Crosby, & Chalmers, 2005). Most models include an Mg2+ cationic
cofactors and take into account both structural data and biologically significant constraints. In
particular, HIV-1 IN synaptic complexes (IN4•vDNA•hDNA) have been constructed to take
into account the different enzymatic states occurring during the integration process (Figure 6
d) (Fenollar-Ferrer et al., 2008).
Such complexes have also been characterized by electron microscopy (EM) and single-
particle imaging at a low resolution of 27Å (Ren et al., 2007). The X-ray structure of full-
length integrase from Foamy Virus (PFV) in complex with its cognate viral DNA and INSTIs
(particularly, RAL and ELV) has recently been reported (Figure 6 e) (Hare et al., 2010). In
this complex, the retroviral intasome consists of an IN tetramer tightly associated with a pair
of viral DNA ends.

30
Figure 6. Integrase architecture and organization (Mouscadet et al., 2010; Tchertanov & Arora, 2012). Theoretical models: (a) dimeric model of the full-length INvDNA complex (DeLuca et al., 2003); (b) tetramer models of the IN4vDNA (Chen et al., 2006); (c and d) synaptic complexes IN4vDNAhDNA (Fenollar-Ferrer et al., 2008; Wielens et al., 2005); (e) X-ray structure of the PFV IN4vDNA intasome (Hare et al., 2010); and (f) EM maps reconstitution of IN4vDNAhDNA complex with LEGDF(Michel et al., 2009). Protein and DNA structures are presented as cartoon with color-coded nucleotides and Zn2+ and Mg2+ cations shown as balls. The active site contains two Mg2+ cations in (a) and one in (b–d).
The overall shape of the complex is consistent with a low-resolution structure obtained by
electron microscopy and single-particle reconstruction for HIV-1 IN complex with its cellular
cofactor, the lens epithelium-derived growth factor (LEDGF) (Figure 6 f) (Michel et al.,
2009). The sequence identity between HIV-1 and PFV INs is low (22%), the structure-based
alignment of the two proteins demonstrates high conservation of key secondary structural
elements and the three PFV IN domains shared with HIV-1 IN have essentially the same
structure as the isolated HIV-1 domains. This structure can be used to generate reliable HIV-1
IN models for INSTIs design, but the active site loop has a five-residue coil structure, rather
than the 10 residues of the extended loop of HIV-1IN. This difference may be due to a
31
difference in the sequence of the two enzymes or an effect induced by DNA binding, and
caution is therefore required in the use of this structure as a template for modeling biologically
relevant conformations of HIV-1 integrase (Davies et al., 2000; Hare et al., 2010).
1.3 Structural and functional role of the Catalytic Site Loop
As was mentioned above, the catalytic site loop, comprising residues 140-149, is a crucial
element of the HIV IN. This loop is known to be required for efficient IN function, but its
precise role in integration in unknown. Several residues subject to primary mutations for
resistance to both RAL and ELV (N155, E138, Y143, Q148) and to the secondary mutations
(G140, Q146, S147) are located within the 140–149 loop of the CCD, which is required for
efficient IN activity (Figure 7). The Molecular Dynamics (MD) simulation studies have
demonstrated the importance of its flexibility for catalysis (Lee et al., 2005; Weber et al.,
1998; Wijitkosoom et al., 2006). A significant conformational change, involving the E152
residue of the DDE motif, was observed upon viral DNA binding (Lins et al., 1999; Perryman
et al., 2010).
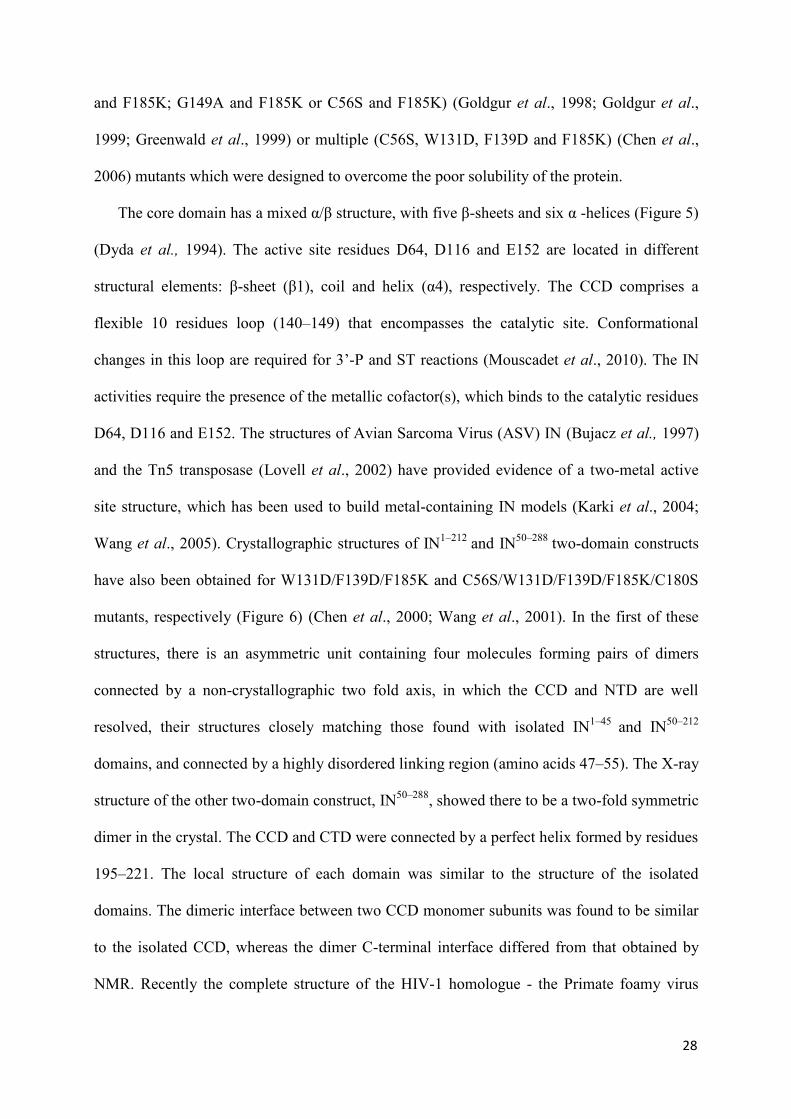
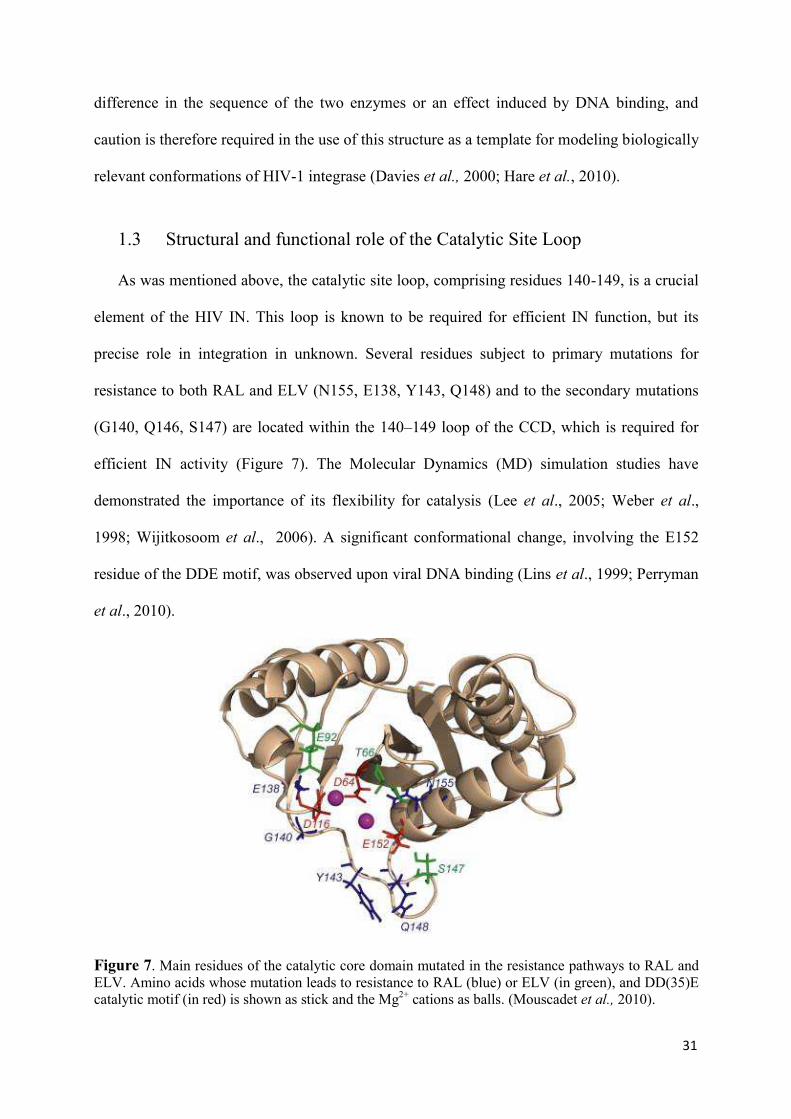
Figure 7. Main residues of the catalytic core domain mutated in the resistance pathways to RAL and ELV. Amino acids whose mutation leads to resistance to RAL (blue) or ELV (in green), and DD(35)E catalytic motif (in red) is shown as stick and the Mg2+ cations as balls. (Mouscadet et al., 2010).
32
The coordination of a second Mg2+ cation in the active site induced a switch of E152 side
chain conformation, directing this side chain towards the active site, but with no overall
change in the conformation of the catalytic loop (Mouscadet & Tchertanov, 2009). This
conformational flexibility is thought to be important for the catalytic steps following DNA
binding, as a decrease in flexibility induced, for example, by the G140A/G149A mutations,
results in lower levels of activity despite minimal effects on DNA binding (Greenwald et al.,
1999). Moreover, several residues, particularly Q148, Q137, Q146, and N144, are predicted to
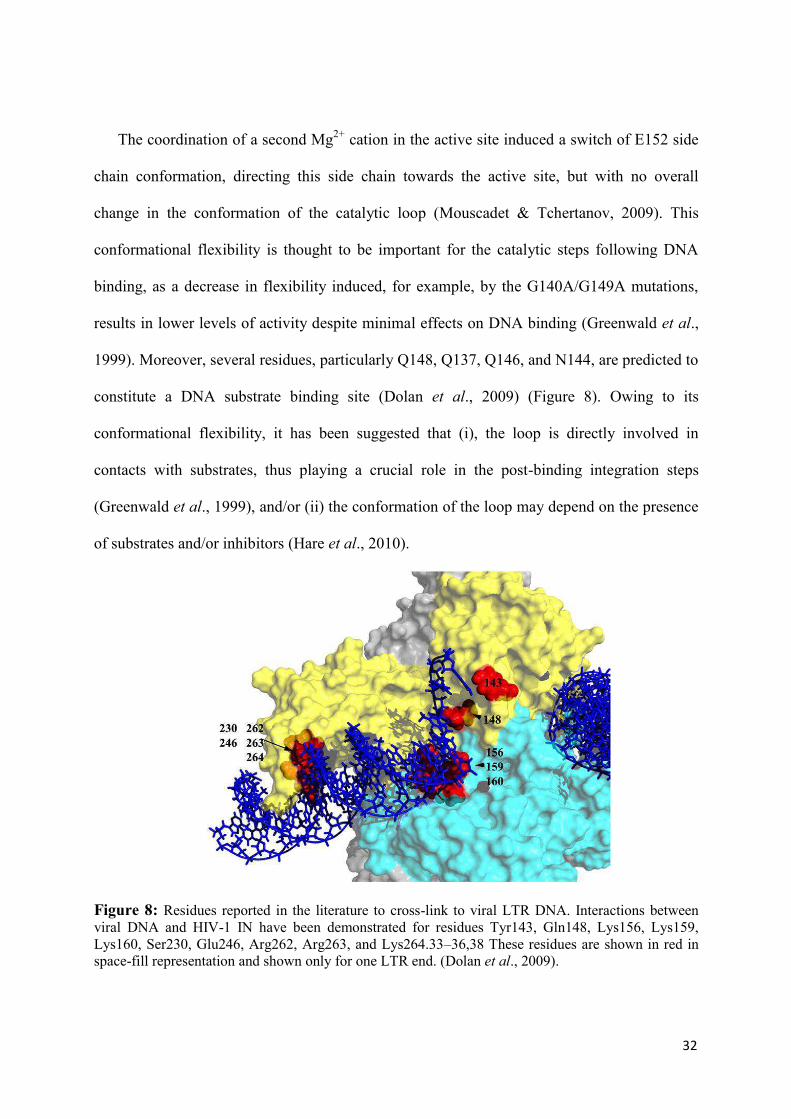
constitute a DNA substrate binding site (Dolan et al., 2009) (Figure 8). Owing to its
conformational flexibility, it has been suggested that (i), the loop is directly involved in
contacts with substrates, thus playing a crucial role in the post-binding integration steps
(Greenwald et al., 1999), and/or (ii) the conformation of the loop may depend on the presence
of substrates and/or inhibitors (Hare et al., 2010).
Figure 8: Residues reported in the literature to cross-link to viral LTR DNA. Interactions between viral DNA and HIV-1 IN have been demonstrated for residues Tyr143, Gln148, Lys156, Lys159, Lys160, Ser230, Glu246, Arg262, Arg263, and Lys264.33–36,38 These residues are shown in red in space-fill representation and shown only for one LTR end. (Dolan et al., 2009).
33
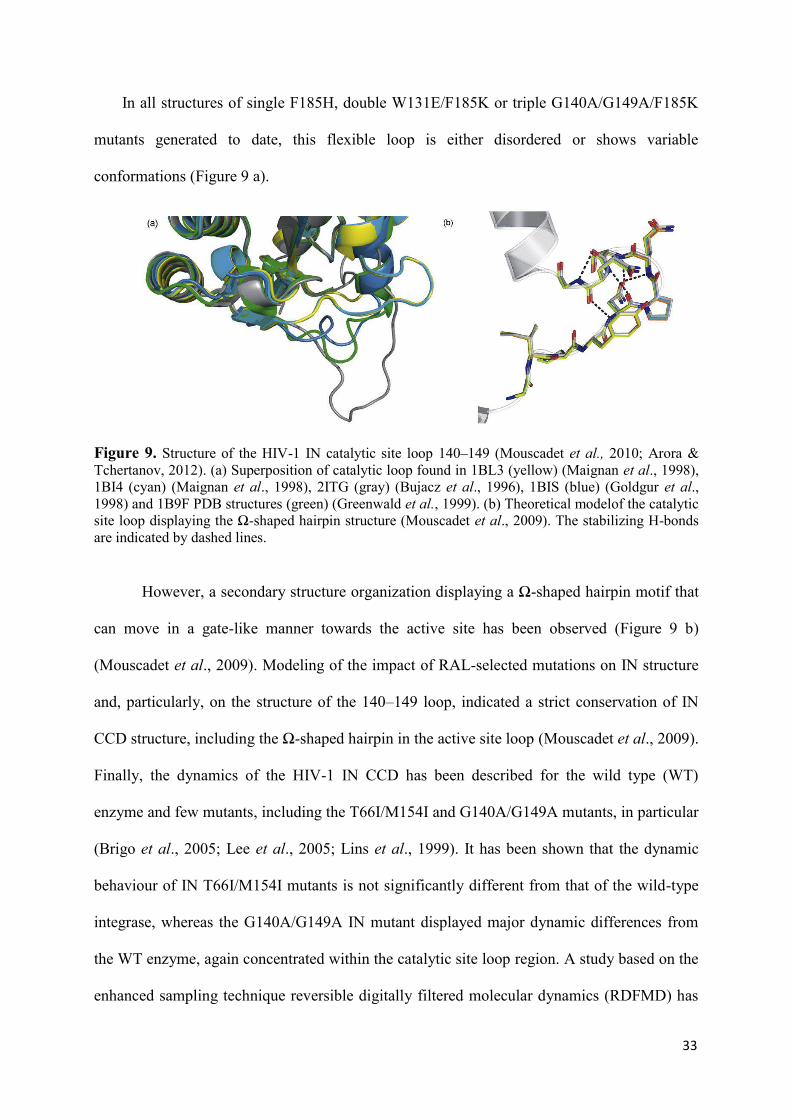
In all structures of single F185H, double W131E/F185K or triple G140A/G149A/F185K
mutants generated to date, this flexible loop is either disordered or shows variable
conformations (Figure 9 a).
Figure 9. Structure of the HIV-1 IN catalytic site loop 140–149 (Mouscadet et al., 2010; Arora & Tchertanov, 2012). (a) Superposition of catalytic loop found in 1BL3 (yellow) (Maignan et al., 1998), 1BI4 (cyan) (Maignan et al., 1998), 2ITG (gray) (Bujacz et al., 1996), 1BIS (blue) (Goldgur et al., 1998) and 1B9F PDB structures (green) (Greenwald et al., 1999). (b) Theoretical modelof the catalytic site loop displaying the Ω-shaped hairpin structure (Mouscadet et al., 2009). The stabilizing H-bonds are indicated by dashed lines.
However, a secondary structure organization displaying a Ω-shaped hairpin motif that
can move in a gate-like manner towards the active site has been observed (Figure 9 b)
(Mouscadet et al., 2009). Modeling of the impact of RAL-selected mutations on IN structure
and, particularly, on the structure of the 140–149 loop, indicated a strict conservation of IN
CCD structure, including the Ω-shaped hairpin in the active site loop (Mouscadet et al., 2009).
Finally, the dynamics of the HIV-1 IN CCD has been described for the wild type (WT)
enzyme and few mutants, including the T66I/M154I and G140A/G149A mutants, in particular
(Brigo et al., 2005; Lee et al., 2005; Lins et al., 1999). It has been shown that the dynamic
behaviour of IN T66I/M154I mutants is not significantly different from that of the wild-type
integrase, whereas the G140A/G149A IN mutant displayed major dynamic differences from
the WT enzyme, again concentrated within the catalytic site loop region. A study based on the
enhanced sampling technique reversible digitally filtered molecular dynamics (RDFMD) has
34
been applied to the CCD of the WT and G140A/G149A mutant enzymes. This study
highlighted significant differences between in the behaviour of the catalytic site loop,
potentially accounting for the decrease in activity observed in experimental studies of this
mutant (Williams & Essex, 2009).
These results have highlighted the role of the flexibility of the loop in the development of
resistance. In particular, they demonstrate the interdependence of residues G140 and Q148 for
IN catalytic activity (Metifiot et al., 2010). Indeed, the Q148H mutation, which strongly
affects IN catalytic activity, can be rescued by the compensatory G140S mutation, which
restores an active configuration of the flexible loop (Delelis et al., 2009). The G140 residue is
not directly involved in the cooperative flexibility of the catalytic loop, but plays a critical role
in controlling the overall motion of the loop and its precise position relative to the
phosphodiester bond to be cleaved (Mouscadet et al., 2009). The G140 residue participates in
catalytic loop hinge formation and its mutation may restore specific contacts required for
catalysis, between the loop of the double mutant and the end of the viral DNA.
1.4 Molecular Dynamics Simulation of HIV-1 Integrase
Structural data describes the protein in a static state and provides no time-dependant
information about conformational flexibility. Molecular Dynamics (MD) simulations provide
very useful information on the dynamic properties of IN and insight into the enzyme-substrate
or enzyme-inhibitor complex interactions. The first study by (Weber et al., 1998) was
performed for IN without the metal cations in the IN active site and it provides ideas about the
slow-motion dynamics of the loop. Later MD simulations, performed on completely hydrated
model of CCD with no metal cations, with one and with two metal cations have been reported
a significant conformational change, involving the catalytic site loop and the E152 residue of
the DDE motif, to occur when a second metal ion is included (Lins et al., 1999; Lins et al.,
35
2000; Lins, Straatsma, & Briggs, 2000). In contrast, the “rigid” molecular modelling shows
that metal coordination does not affect the conformation of the catalytic loop (Mouscadet et
al., 2009) and fixation of the second Mg2+ ion in the active site induced a switch of E152 side
chain conformation to those directed towards the active site (Savarino, 2007). The study of
structural and dynamic properties of HIV-1 integrase reports the difference in the molecular
properties of the full-length enzyme due to different construction methods or simulation
techniques applied as well as the effects of two terminal domains, the NTD and CTD, on the
CCD (Wijitkosoom et al., 2006).
The comparison of HIV-1 IN model structures derived from hybrid MD
simulations, including classical and quantum mechanical/molecular (QM/MM) approaches,
reveals two notable differences for two CCD loops, 116-119 and 140-149 (Nunthaboot et al.,
2007). In the conventional MD, residues 116-119 show high mobility, however, this loop was
quite rigid in QM/MM simulation. Differences in the dynamics of loop 140-149 lead to
substantially different orientations of key amino acids, particularly K159 in the α4-helix
resulted in two types of calculations.
The dynamic behaviour of the HIV-1 IN CCD has been described for the WT enzyme
(Lins et al., 1999) and for the mutants, T66I/M154I (Brigo et al., 2005) and G140A/G149A
(Lee et al., 2005). It has been shown that the dynamic behaviour of IN T66I/M154I mutant
does not display significant differences (Brigo et al., 2005) with respect to the behaviour of
the WT IN described by Lins (Lins et al., 1999), while the G140A/G149A mutant showed the
important dynamic differences which were mainly concentrated in the catalytic loop region
(Lee et al., 2005). This method was applied for study of enzyme complexed with the inhibitor
5CITEP (Nunthaboot et al., 2007; Barreca et al., 2003; Ni, Sotriffer, & McCammon, 2001;
Nunthaboot et al., 2007) showed that the mobility of the loop is constrained due to the
presence of the 5CITEP inhibitor.

36
Subsequent studies of the dynamic behaviour of the 140-149 loop as a function of the
presence/absence of the vDNA demonstrated a markedly different behaviour of the residues in
the loop in the chains A (contacting with viral DNA) and B (no contacts exist between CCD
and vDNA) (De Luca et al., 2005). MD studies also demonstrate the importance of the
flexibility of the 140-149 loop for catalysis (Lee et al., 2005). Moreover, in recent theoretical
predictions it has been shown that the active site loop residues constitute a vDNA substrate
binding site that include Q148, together with Q137, Q146 and N144 (Dolan et al., 2009; Chen
et al., 2008). The large scale conformational dynamics and clustering analysis performed by
Lee (Lee et al., 2005) permits to identify different conformational states of the WT catalytic
loop, particularly, the open and closed conformations. The dynamics of Y143 in these
simulations indicate the mobility allowing this residue to access the substrate easily.
2. HIV-1 Integrase functions
2.1 Integrase Activity
The HIV-1 integrase (IN) is a key enzyme in the replication mechanism of retroviruses,
catalyzing the covalent insertion of the reverse-transcribed DNA into the chromosomes of the
infected cells (Brown, 1990). Once integrated, the provirus persists in the host cell and serves
as a template for the transcription of viral genes and replication of the viral genome, leading to
the production of new viruses. Two reactions are required for the covalent integration of
vDNA into host DNA (hDNA). The integrase first binds to a short sequence located at either
end of the long terminal repeat (LTR) of the vDNA and catalyze an endo-nucleotide cleavage.
This process is known as 3’-processing (3’-P) and results in the elimination of a di-nucleotide
from each of the 3’ ends of the LTR. The resulting cleaved DNA is then used as a substrate
for integration or Strand Transfer (ST) reaction leading to the covalent insertion of the vDNA
into the genome of the infected cell (Brown, 1990). This second reaction occurs
37
simultaneously at both ends of the vDNA, with an offset of precisely five base pairs between
the two opposite points of insertion. The integration process is completed by the removal of
unpaired di-nucleotides from the 5’ends of the vDNA, the filling in of the single-strand gaps
between viral and target DNA (hDNA) and ligation of the 3’ends to the 5’ends of the hDNA
(Brown, 1990; Chiu & Davies, 2004).
2.2 Role of the cationic co-factors
All integrase activities strictly require the presence of the metallic cationic cofactors,
which are coordinated by residues of the catalytic triad (D64, D116 and E152 for HIV-1 IN)
(Sante-Appiah & Skalka, 1999). The catalytic cation may be either Mn2+ or Mg2+ in vitro, but
Mg2+ is the cofactor required in vivo and Mg2+ dependent activities also reproduce
physiological activity more faithfully in vitro. IN displays non specific nuclease activity in the
presence of Mn2+ and the Mg2+ containing enzyme is much less tolerant of sequence
variations at the ends of the LTR than the Mn2+ enzyme (Esposito & Craigie, 1998). Several
mutations are known to have no effect on IN activity in Mn2+- dependent assays, whereas they
do affect IN activity in Mg-dependent assays. For example, mutations of the HHCC domain
known to be detrimental for the virus in vivo alter 3’processing in vitro in the presence of
Mg2+, but not in the presence of Mn2+ (Lee & Han, 1996). In addition, factors promoting
integrase multimerization, such as Zn2+, also specifically stimulate the Mg2+-dependent
activity of the enzyme, consistent with the multimeric nature of the functional enzyme (Leh et
al., 2000). These differences between cofactor activities have resulted in pharmacological
discrepancies, as some early IN inhibitors identified on the basis of Mn2+-dependent assays
were not active against the Mg2+ enzyme. Based on a model of another phosphatidyl
transferase, the 3’-5’ exonuclease of E. coli DNA polymerase I (Beese & Steitz, 1991), it was
suggested early on that the retroviral integrase might contain two metal cation cofactors. As it
38
was mentioned above, the 3D structures of ASV integrase and the Tn5 transposase alone or in
complex with DNA have provided structure-based evidence for a two-metal active site
structure for retroviral integrases (Bujacz, Alexandratos, & Wlodawer, 1997; Lovell et al.,
2002). Hypothesis of two-cations IN active site eventually led to a pharmacological strategy
based on incorporation of Mg2+-chelating pharmacophores for the rational design of IN
inhibitors. Such pharmacopohores are present in all effective IN inhibitors, including RAL
(Grobler et al., 2002).
2.3 Mechanisms of inhibition and target-inhibitors interactions
In terms of pharmacological development, two principal strategies have been considered
for the development of IN inhibitors: one based on the free, unbound protein and the other on
the preformed IN•vDNA complex. Both approaches were demonstrated to be feasible, with
the inhibitors identification targeting either 3’-P, such blocking the binding of IN to the
vDNA, or blocking the strand transfer reaction, targeting the IN•vDNA complex. Since the
early 1990s, a number of compounds inhibiting one or other of these reactions have been
identified in vitro (Semenova, Marchand & Pommier, 2008). However, the pre-integration
complex (PIC) resulting from the association of integrase with viral DNA whether isolated
from infected cells , or reconstituted in vitro, is highly stable, keeping the complex together
for long enough after the 3'-processing reaction for subsequent integration to occur (Lee &
Craigie, 1994). This complex has an intrinsically slow catalytic activity and does not
dissociate after 3’-processing, limiting multiple turnover (Smolov et al., 2006). This weak
catalytic activity is not detrimental in host cells, because a single integration event is sufficient
for overall function, but it makes it difficult to develop competitive inhibitors of free IN. For
these reasons, the Merck’s team lead by D. Hazuda suggested in the middle of 1990s that the
PIC would be a more suitable target for inhibitors

39
Figure 10. Integrase strand transfer inhibitors.
.This hypothesis proved to be correct, particularly given that PIC formation probably occurs
within a capsid that is not fully dissociated, thus precluding easy access to free IN (Arhel et
al., 2007). The design of new assays for screening ligands of the IN•vDNA complex
eventually led to the identification of the first strand transfer inhibitors, L-731,988 and L-
708,906 at the turn of the century (Hazuda et al., 2000). These compounds compete with the
target DNA by binding to the IN•vDNA complex. They recognize a specific site close to the
catalytic triad of CCD, which opens following a change in conformation induced by the
binding and 3’-processing of the vDNA (Espeseth et al., 2000). The first selective ST
inhibitors to be identified were diketoacids (DKAs) (Hazuda et al., 2000). Such compounds
based on the β-ketoenol fragment efficiently chelate the Mg2+ cation required for the IN
activity and their overall affinity for the target depends on their surrounding substituent
groups (Figure 11 b) (Kawasuji et al., 2006; Tchertanov & Mouscadet, 2007). The
prerequisites for a specific ST inhibitor include the presence of a chemical group including the
heteroatoms, nitrogen or oxygen, capable of binding two divalent cations , and a hydrophobic
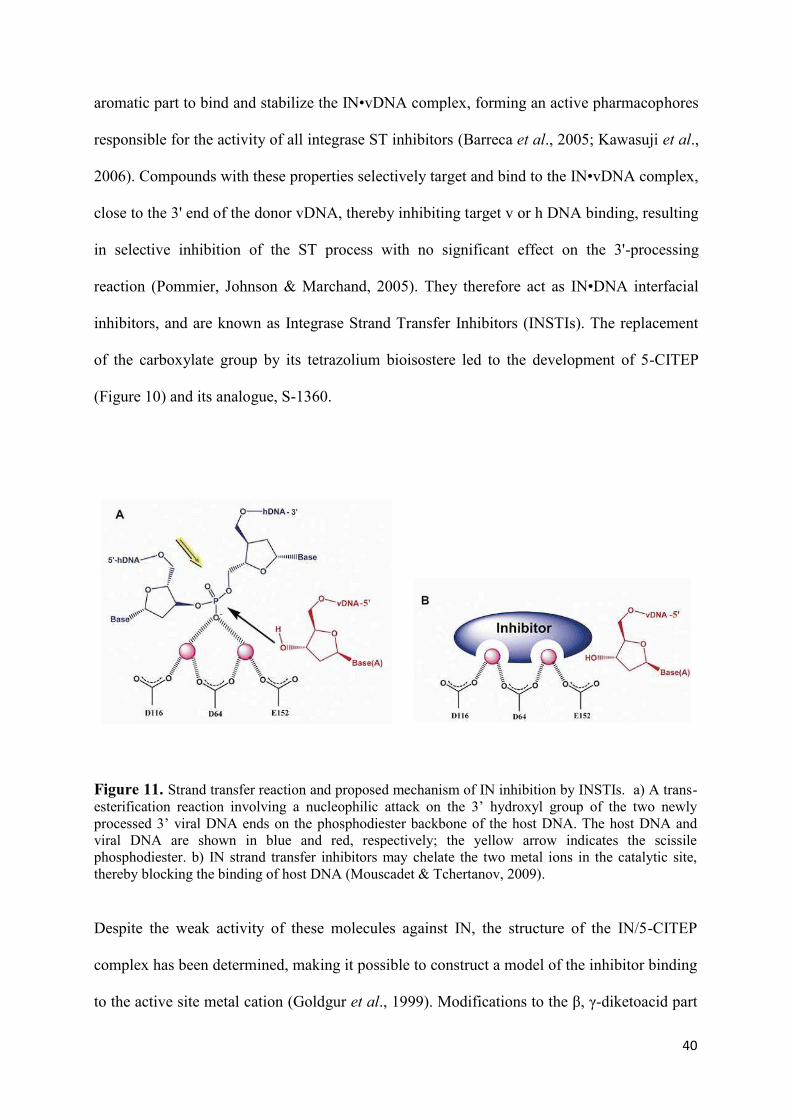
40
aromatic part to bind and stabilize the IN•vDNA complex, forming an active pharmacophores
responsible for the activity of all integrase ST inhibitors (Barreca et al., 2005; Kawasuji et al.,
2006). Compounds with these properties selectively target and bind to the IN•vDNA complex,
close to the 3' end of the donor vDNA, thereby inhibiting target v or h DNA binding, resulting
in selective inhibition of the ST process with no significant effect on the 3'-processing
reaction (Pommier, Johnson & Marchand, 2005). They therefore act as IN•DNA interfacial
inhibitors, and are known as Integrase Strand Transfer Inhibitors (INSTIs). The replacement
of the carboxylate group by its tetrazolium bioisostere led to the development of 5-CITEP
(Figure 10) and its analogue, S-1360.
Figure 11. Strand transfer reaction and proposed mechanism of IN inhibition by INSTIs. a) A trans-esterification reaction involving a nucleophilic attack on the 3’ hydroxyl group of the two newly
processed 3’ viral DNA ends on the phosphodiester backbone of the host DNA. The host DNA and viral DNA are shown in blue and red, respectively; the yellow arrow indicates the scissile phosphodiester. b) IN strand transfer inhibitors may chelate the two metal ions in the catalytic site, thereby blocking the binding of host DNA (Mouscadet & Tchertanov, 2009).
Despite the weak activity of these molecules against IN, the structure of the IN/5-CITEP
complex has been determined, making it possible to construct a model of the inhibitor binding
to the active site metal cation (Goldgur et al., 1999). Modifications to the β, γ-diketoacid part

41
of the molecule initially led to the replacement of this group by 8-hydroxy quinoline, to
increase antiviral activity and to overcome pharmacological limits, such as serum protein
binding (Zhuang et al., 2003). Compounds from this family, such as Merck L-870,812 (Figure
10), have potent antiviral activity, providing the proof-of-concept for INSTI activity in vivo
despite their toxicity in vivo (Hazuda et al., 2004). The L-870,812 series of compounds was
not developed further, but the dihydroquinoline JTK303/GS9137 derived from quinolone
antibiotics was used for further drug development and is now at the advanced clinical
development stage, under the name of Elvitegravir (ELV) (Figure 10) (Sato et al., 2006).
Figure 12. 5-CITEP binding to the HIV-1 IN (Mouscadet et al., 2010). (a) X-ray structure (Goldgur et al., 1999); (b) theoretical modeling (Savarino, 2007); (c) hybrid QM/MMMD simulations of IN complexed with the inhibitor (Nunthaboot et al., 2007). H-bonds are indicated by dashed lines in (a and b); coordination bonds and H-bonds by dotted lines in (c).
The cavity formed by residues D64, C65, T66, H67, E92, N120, F121 and D116
defines the active site for the 3’-P reaction, whereas residues Q62, I141, P142, Y143, Q148,
I151, E152, N155, K156 and K159 define the ST cavity. Theoretical studies have predicted
that the Q146, Q148 and N144 residues of the loop form a DNA binding site (Agapkina et al.,
2006; Dolan et al., 2009). An early INSTI, 5-CITEP was co-crystallized in the centre of the
active site, lying between the D64, D116 and E152 residues. Its tetrazolium moiety forms H-
bonds with T66, N155, K156 and K159, the ketoenol motif being H-bonded with E152,
whereas the indol ring of the inhibitor points toward the Q148 residue (Figure 12 a) (Goldgur
et al., 1999). A docking study positioned 5-CITEP close to Y143 and Q148 (Figure 12 b).
Hybrid QM/MM simulations showed that 5-CITEP interacted directly with the Mg2+ cation
42
via its ketoenol fragment whereas the tetrazole ring points toward residues N155, K156 and
K159 (Figure 12 c) (Nunthaboot et al., 2007). Finally, a MD study of 5-CITEP bound to IN
showed that the mobility of the 140–148 loop is constrained by the presence of the inhibitor
(Barreca et al., 2003). Rigid or semi-rigid docking of RAL and ELV onto the CCD confirmed
that both inhibitors chelate the Mg2+ cation via coplanar β-ketoenol fragments (Figure 13 b)
(Barreca et al., 2006) and that ELV may also chelate the cation in a non-coplanar metal-
binding mode (Savarino et al., 2007) (Figure 14 b).
A similar study demonstrated that RAL contacts the three catalytic residues, D64,
D116 and E152, and interacts with the five residues, T66, E92, Y143, Q148 and N155,
involved in primary resistance (Figure 13 a) (Serrao et al., 2009) (Table 1). Like RAL, ELV
was found in the vicinity of T66, E92, G140, Y143, Q148 and the catalytic residues D116 and
E152 (Figure 13 a). In another theoretical study, two different modes of binding were reported
for RAL (Loizidou et al., 2009) (Figure 13 c d), corresponding to different modes of Mg2+
chelation and an absence of direct contacts with Y143 or N155 and Q148 residues. The
authors also reported only one conformation observed for ELV, which displayed tolerant
contacts with residues D64, D116, E152, N155, G140 and T66 and made additional contact
with residues C65, H67, N117 and G118 (Figure 14 c).
A comparative residue interaction analysis (CoRIA) allowing evaluation of the non-
bonded interaction energies of integrase inhibitors with individual active sites suggested that
D64, T66, V77, D116, E152 and K159 were the key residues influencing the binding of ligand
to the integrase (Dhaked et al., 2009). However, the exact modes of binding of both inhibitors
remain a matter of debate. ELV was also docked onto the Tn5 transposase DNA complex,
which is considered as a surrogate model for studying the mechanism of action of INSTIs
(Pasquini et al., 2008; Ason et al., 2005).

43
Figure 13. Binding modes of raltegravir (Mouscadet et al., 2010). (a) Raltegravir docking (GOLD 3.2) on 1BL3 structure (Serrao et al., 2009). RAL (magenta) and residues in close contact (green) are indicated as sticks; (b) RAL induced-fit docking on the IN•DNA complex (Barreca et al., 2009). Two poses of RAL (orange) and (green) and residues in closed contact are indicated as sticks and the protein is shown as a secondary structure cartoon; (c) two different conformations of RAL obtained by docking (Autodock 4.0) on the 5-CITEP•IN complex (Loizidou et al., 2009). RAL and residues in close contact are indicated as sticks and the protein is shown as a secondary structure cartoon. 5-CITEP indicating the terminal portion of 3’-processed viral DNA, RAL, the catalytic triad (D64, D116 and E152) and interacting key residues are shown as orange, gray and yellow carbon backbone representations, respectively. (e) RAL (yellow) binding determined in X-ray structure of the PFV IN•DNA complex. Protein (green) and DNA (rose and orange) are shown as cartoons, with A17 and
the side chains of indicated amino acids as sticks; (f) RAL (gray sticks) binding mode in 5-CITEP•IN
complex predicted by dynamic approach (Perryman et al., 2010). A solvent-accessible surface is shownwith labels for key residues and 5-CITEP.
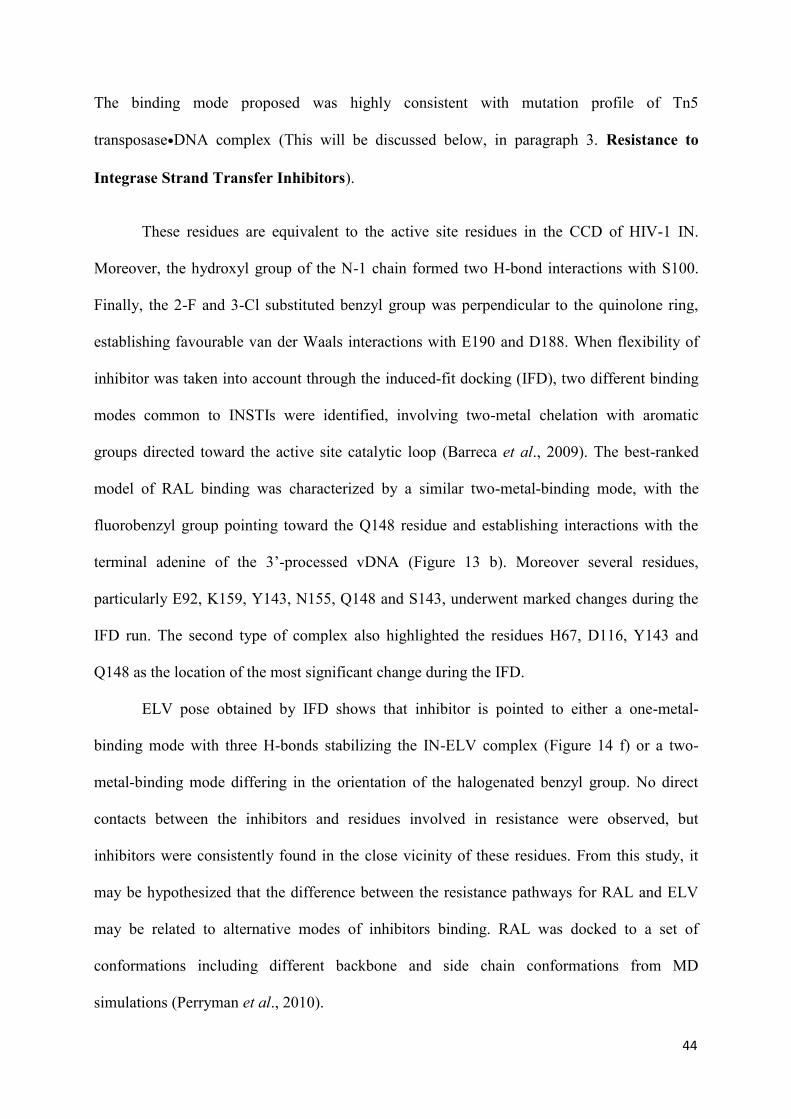
44
The binding mode proposed was highly consistent with mutation profile of Tn5
transposase DNA complex (This will be discussed below, in paragraph 3. Resistance to
Integrase Strand Transfer Inhibitors).
These residues are equivalent to the active site residues in the CCD of HIV-1 IN.
Moreover, the hydroxyl group of the N-1 chain formed two H-bond interactions with S100.
Finally, the 2-F and 3-Cl substituted benzyl group was perpendicular to the quinolone ring,
establishing favourable van der Waals interactions with E190 and D188. When flexibility of
inhibitor was taken into account through the induced-fit docking (IFD), two different binding
modes common to INSTIs were identified, involving two-metal chelation with aromatic
groups directed toward the active site catalytic loop (Barreca et al., 2009). The best-ranked
model of RAL binding was characterized by a similar two-metal-binding mode, with the
fluorobenzyl group pointing toward the Q148 residue and establishing interactions with the
terminal adenine of the 3’-processed vDNA (Figure 13 b). Moreover several residues,
particularly E92, K159, Y143, N155, Q148 and S143, underwent marked changes during the
IFD run. The second type of complex also highlighted the residues H67, D116, Y143 and
Q148 as the location of the most significant change during the IFD.
ELV pose obtained by IFD shows that inhibitor is pointed to either a one-metal-
binding mode with three H-bonds stabilizing the IN-ELV complex (Figure 14 f) or a two-
metal-binding mode differing in the orientation of the halogenated benzyl group. No direct
contacts between the inhibitors and residues involved in resistance were observed, but
inhibitors were consistently found in the close vicinity of these residues. From this study, it
may be hypothesized that the difference between the resistance pathways for RAL and ELV
may be related to alternative modes of inhibitors binding. RAL was docked to a set of
conformations including different backbone and side chain conformations from MD
simulations (Perryman et al., 2010).
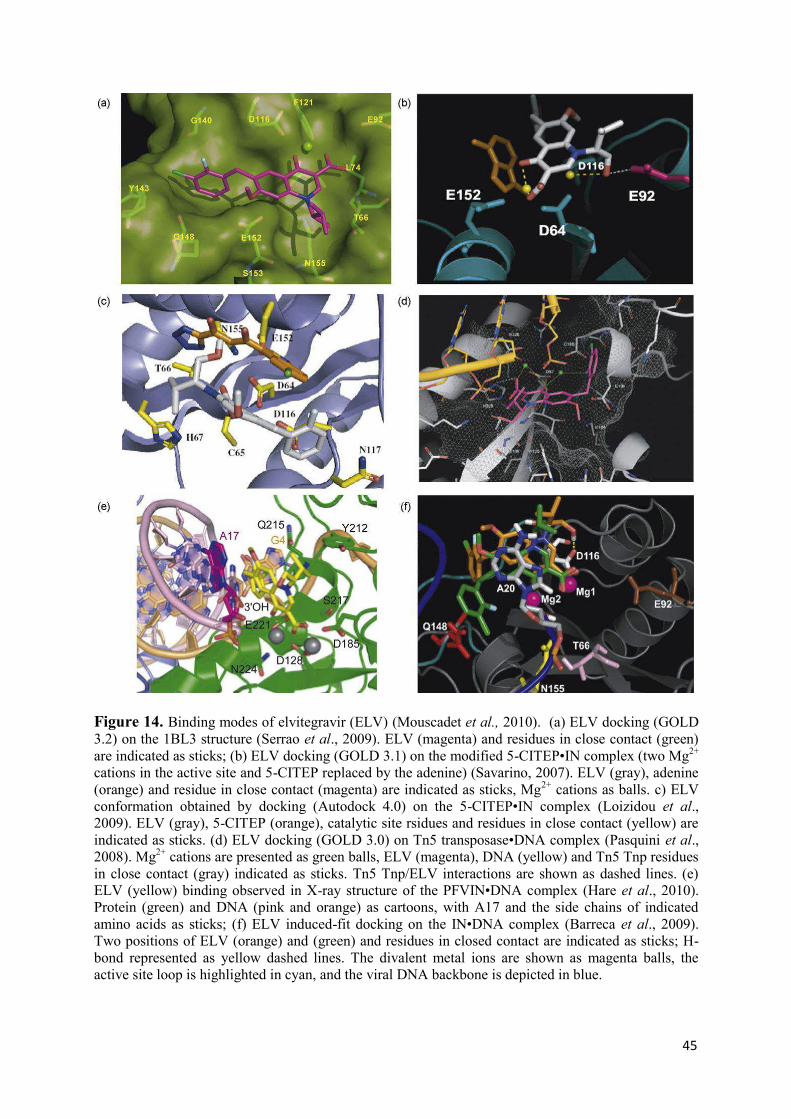
45
Figure 14. Binding modes of elvitegravir (ELV) (Mouscadet et al., 2010). (a) ELV docking (GOLD 3.2) on the 1BL3 structure (Serrao et al., 2009). ELV (magenta) and residues in close contact (green) are indicated as sticks; (b) ELV docking (GOLD 3.1) on the modified 5-CITEP•IN complex (two Mg
2+ cations in the active site and 5-CITEP replaced by the adenine) (Savarino, 2007). ELV (gray), adenine (orange) and residue in close contact (magenta) are indicated as sticks, Mg2+ cations as balls. c) ELV conformation obtained by docking (Autodock 4.0) on the 5-CITEP•IN complex (Loizidou et al., 2009). ELV (gray), 5-CITEP (orange), catalytic site rsidues and residues in close contact (yellow) are indicated as sticks. (d) ELV docking (GOLD 3.0) on Tn5 transposase•DNA complex (Pasquini et al., 2008). Mg2+ cations are presented as green balls, ELV (magenta), DNA (yellow) and Tn5 Tnp residues in close contact (gray) indicated as sticks. Tn5 Tnp/ELV interactions are shown as dashed lines. (e) ELV (yellow) binding observed in X-ray structure of the PFVIN•DNA complex (Hare et al., 2010). Protein (green) and DNA (pink and orange) as cartoons, with A17 and the side chains of indicated amino acids as sticks; (f) ELV induced-fit docking on the IN•DNA complex (Barreca et al., 2009). Two positions of ELV (orange) and (green) and residues in closed contact are indicated as sticks; H-bond represented as yellow dashed lines. The divalent metal ions are shown as magenta balls, the active site loop is highlighted in cyan, and the viral DNA backbone is depicted in blue.

46
The best binding mode involved close contact between both Mg2+ ions and the His67
residue and important interactions with T66, K159 and N155. An alternative, less favourable,
flipped mode yielded contacts with the E92 accounting for the possible involvement of this
residue in an alternative resistance pathway (Figure 13 f). In the G140S/Q148H mutant, as in
the WT and primary mutants, RAL coordinates two Mg2+cations.
3. Resistance to Integrase Strand Transfer Inhibitors (INSTIs)
3.1 Resistance phenomenon
As with other antiretroviral drugs, resistance to INSTIs emerges through the selection of
mutations in the IN-coding region of the pol gene that affect the susceptibility of the virus to
the inhibitors. More than 60 mutations have been specifically associated with resistance to
INSTIs in vitro and in vivo (Ceccherini-Silberstein et al., 2009). Resistance to RAL in vivo
has been associated, to different degrees, with 14 mutations, but the virologic failure of RAL
treatment initially observed during the BENCHMRK trials was unambiguously associated
with two principal independent genetic pathways involving primary mutations affecting the
N155 (N155H) and Q148 (Q148K/R/H) residues carried by 68% of subjects (Cooper et al.,
2008). Clonal analysis of the viral populations in patients displaying treatment failure on RAL
showed that no viral clone carried mutations simultaneously at positions 148 and 155,
demonstrating the independence of the two main pathways (Table 1). A third pathway,
involving the Y143R/C/H mutation and conferring a large decrease in susceptibility to the
inhibitor, was subsequently described (Delelis et al., 2010; Sichtig et al., 2009). Y143R/C/H
mutations occur less frequently and later than the other two mutations described above
(Croxtall & Keam, 2009). Phenotypic analysis showed that the presence of the mutation at
position 148, together with one or more secondary mutations, resulted in greater resistance to
RAL than observed for viruses carrying the N155H mutation. The level of phenotypic
47
resistance to RAL associated with the Q148 or Y143 mutation is always much higher (>100
times higher) than that associated with N155H (Hatano et al., 2010). These mutations were
not detected in various studies on IN polymorphism in INSTI-naive patients, confirming their
likely role in conferring resistance to this class of drugs (Lataillade, Chiarella & Kozal, 2007;
Rhee et al., 2008). Secondary mutations increasing the fitness of the resistant viruses have
been identified and include L74 M, E138A/K and G140A/S for the Q148H/R/K pathway and
L74 M, E92A/Q, T97A, Y143H/C, V151I, G163K/R and D232N for the N155H pathway
(Table 1) (Mouscadet et al., 2010). In particular, the G140S mutation rescues a replication
defect resulting from the Q148H primary mutation (Delelis et al., 2009). The change in IC50
was found to be largest in patients carrying viruses following the 148 pathway, with
secondary mutations increasing resistance from a factor of 10 (Q148H) to a factor exceeding
500 (Q148H + G140S and Q148K + E138A + G140A). A small number of mutations
involving residues E92, E157 or T97A/G163R may lead to alternative pathways of resistance
(Ceccherini-Silberstein et al., 2009; Ghosn et al., 2009). Other double mutations conferring
substantial resistance in vitro to RAL, such as T66I/E92Q, T66K/L74 M and F121Y/T125K,
have been identified in vitro (Table 1). It was recently confirmed in vivo that some double or
triple combinations of secondary mutations, such as T97A/G163R, V72I/T97A/G163R,
V72I/L74 M/T97A or L74 M/T97A/V151I, may lead to moderate resistance to RAL in the
absence of primary mutation (2<FC<5). The resistance mutations identified in a phase II study
of ELV included E92Q, T66I/A/K, E138K, S147G, Q148R/H/K and N155H (Mccoll et al.,
2007). The Q148R/H/K and N155H, E92Q and T66I substitutions were the principal causes of
ELV resistance (Goethals et al., 2008) summarising in (Table 1). In vitro susceptibility assays
with recombinant clones indicated that two other mutations, Q146P and S147G, conferred a
significant but more moderate decrease in ELV susceptibility (decrease by a factor of 11),
suggesting that these mutations may also be primary mutations involved in resistance to this
48
compound (Shimura et al., 2008). Other mutations — the H51Y, Q95K, and E157Q
substitutions — confer smaller decreases in ELV susceptibility, but increased resistance
further when combined with the T66I or E92Q mutations, suggesting that these mutations
constitute secondary resistance mutations. H114Y, L74 M, R20K, A128T, E138K and S230R
were observed in another in vitro study, in association with one or more of the four primary
mutations (Goethals et al., 2008) (Table 1). As single mutations, they had little effect on
susceptibility to either ELV or RAL. The accumulation of these inhibitors selected IN
mutations resulted in a significant decrease in the rate of viral replication. Thus, the
emergence of resistance to IN inhibitors maybe associated with a decrease in viral fitness.
Selection experiments with S/GSK1349572 resulted in the selection of T124A, S153A,
T124A/S153A and L101I/T124A/S153F mutants (Table 1), although the fold change (FC) in
susceptibility was low (FC < 5) (Emiliani et al., 2005). In vitro, only small changes (FC < 5)
in S/GSK1349572 (a new potent IN inhibitor, in stage 2 of clinical trials) activity were
observed with a broad range of single mutants, with the exception of S153A and double
mutants resistant to INSTIs, including RAL- and ELV-induced recombinant viruses. In
particular, Y143R/C and N155H viruses remained fully susceptible to S/GSK1349572. For 21
double mutants, a low FC (<5) in S/GSK1349572 activity was observed against all but the
E138K/Q148K, G140S/Q148R and Q148R/N155H mutants.
These data suggest that S/GSK1349572 has a resistance profile different from those of
RAL and ELV. Nevertheless, G140/Q148 double mutants displayed a low, but significant FC
in activity, ranging from 2 to 10, with a FC between 10 and 20 for E138K/Q148K; the
addition of T97A, M154I or V201I to G140S/Q148H also increased S/GSK1349572
resistance (Seki, 2010). Furthermore, multiple mutations identified during passage. Q148H/R,
used as a starting point, gave rise to resistant profiles, such as
V75I/E138K/G140S/Q148H/M154I, conferring resistance to both S/GSK1349572 and RAL.
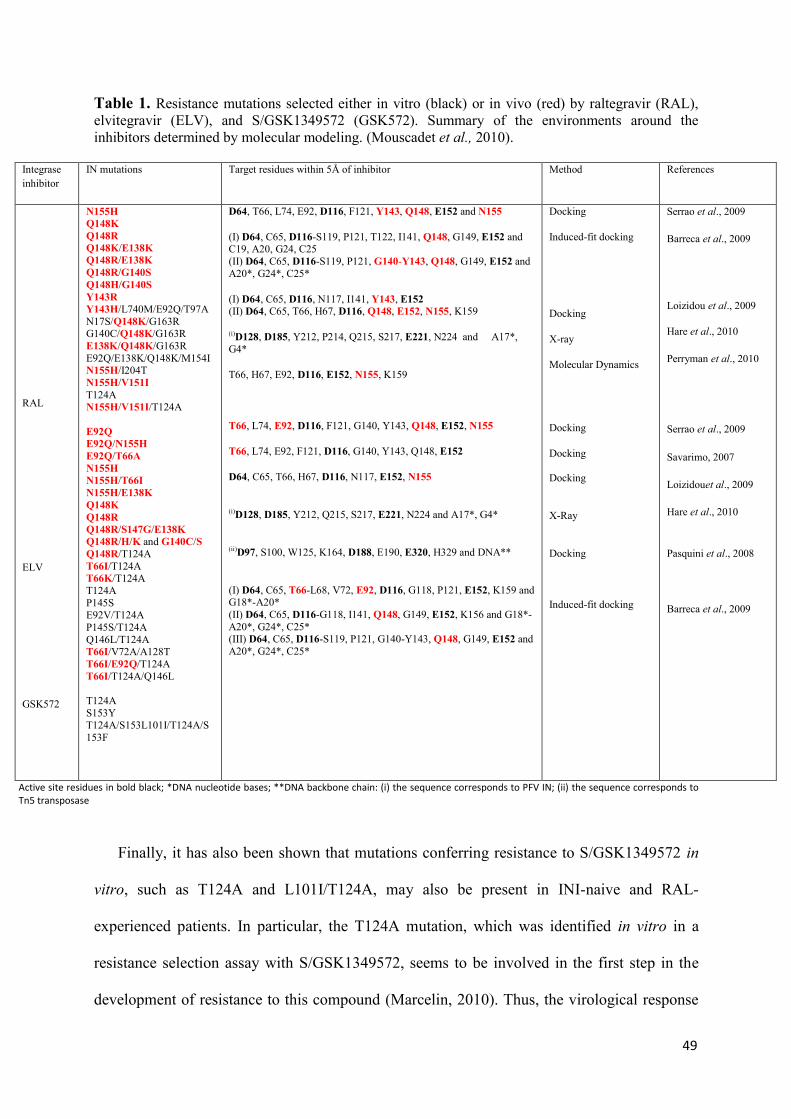
49
Table 1. Resistance mutations selected either in vitro (black) or in vivo (red) by raltegravir (RAL), elvitegravir (ELV), and S/GSK1349572 (GSK572). Summary of the environments around the inhibitors determined by molecular modeling. (Mouscadet et al., 2010).
Integrase inhibitor
IN mutations Target residues within 5Å of inhibitor Method References
RAL
ELV
GSK572
N155H
Q148K
Q148R
Q148K/E138K
Q148R/E138K Q148R/G140S Q148H/G140S Y143R
Y143H/L740M/E92Q/T97A N17S/Q148K/G163R G140C/Q148K/G163R E138K/Q148K/G163R E92Q/E138K/Q148K/M154I N155H/I204T N155H/V151I T124A N155H/V151I/T124A
E92Q
E92Q/N155H E92Q/T66A N155H
N155H/T66I N155H/E138K Q148K
Q148R
Q148R/S147G/E138K Q148R/H/K and G140C/S Q148R/T124A T66I/T124A T66K/T124A T124A P145S E92V/T124A P145S/T124A Q146L/T124A T66I/V72A/A128T T66I/E92Q/T124A T66I/T124A/Q146L T124A S153Y T124A/S153L101I/T124A/S153F
D64, T66, L74, E92, D116, F121, Y143, Q148, E152 and N155
(I) D64, C65, D116-S119, P121, T122, I141, Q148, G149, E152 and C19, A20, G24, C25 (II) D64, C65, D116-S119, P121, G140-Y143, Q148, G149, E152 and A20*, G24*, C25*
(I) D64, C65, D116, N117, I141, Y143, E152 (II) D64, C65, T66, H67, D116, Q148, E152, N155, K159
(i)D128, D185, Y212, P214, Q215, S217, E221, N224 and A17*, G4*
T66, H67, E92, D116, E152, N155, K159
T66, L74, E92, D116, F121, G140, Y143, Q148, E152, N155
T66, L74, E92, F121, D116, G140, Y143, Q148, E152
D64, C65, T66, H67, D116, N117, E152, N155
(i)D128, D185, Y212, Q215, S217, E221, N224 and A17*, G4*
(ii)D97, S100, W125, K164, D188, E190, E320, H329 and DNA**
(I) D64, C65, T66-L68, V72, E92, D116, G118, P121, E152, K159 and G18*-A20* (II) D64, C65, D116-G118, I141, Q148, G149, E152, K156 and G18*-A20*, G24*, C25* (III) D64, C65, D116-S119, P121, G140-Y143, Q148, G149, E152 and A20*, G24*, C25*
Docking
Induced-fit docking
Docking
X-ray
Molecular Dynamics
Docking
Docking Docking
X-Ray
Docking
Induced-fit docking
Serrao et al., 2009
Barreca et al., 2009
Loizidou et al., 2009
Hare et al., 2010
Perryman et al., 2010 Serrao et al., 2009 Savarimo, 2007
Loizidouet al., 2009
Hare et al., 2010
Pasquini et al., 2008
Barreca et al., 2009
Active site residues in bold black; *DNA nucleotide bases; **DNA backbone chain: (i) the sequence corresponds to PFV IN; (ii) the sequence corresponds to
Tn5 transposase
Finally, it has also been shown that mutations conferring resistance to S/GSK1349572 in
vitro, such as T124A and L101I/T124A, may also be present in INI-naive and RAL-
experienced patients. In particular, the T124A mutation, which was identified in vitro in a
resistance selection assay with S/GSK1349572, seems to be involved in the first step in the
development of resistance to this compound (Marcelin, 2010). Thus, the virological response
50
to S/GSK1349572 should be investigated further in patients with previous treatment failure on
RAL or ELV and with various profiles of resistance mutations to INSTI subsequently treated
with S/GSK1349572.
3.2 Polymorphism effect
The contribution of clade-specific polymorphisms of the IN gene to phenotypic
susceptibility to IN inhibitors was assessed in 137 clinical isolates, 60 of which were non-
clade B strains (Van Baelen et al., 2008). Phenotypic testing demonstrated that clade-specific
IN polymorphisms made no significant contribution to susceptibility to IN inhibitors. In vitro
studies comparing the enzymatic activities of HIV-1 INs from subtype B and C viruses, and
their susceptibility to various IN inhibitors (RAL, ELV and MK-2048) confirmed that the
catalytic activities of the enzymes of these two subtypes were similar and that the various
INSTIs used inhibited both types of enzyme to a similar extent (Bar-Magen et al., 2009). In
another study, IN genotyping was performed on patients with experience of multiple
treatments that had received RAL. No primary and very rare secondary RAL mutations
(T97A, G140A, V151I, G163R) were observed at baseline (Ceccherini-Silberstein, 2010). The
presence of these secondary mutations was not specifically associated with progression to
specific primary RAL resistance mutations. It was also confirmed that mutations altering
susceptibility to ELV in vitro, such as Q95K, H114Y, F121Y, T125K, Q146P, S153Y, were
not prevalent. Nevertheless, although the positions subject to primary mutations — E92Q,
Q148K/R/H, N155H and E157Q — are highly conserved and subject to similar genetic
barriers in subtypes B and CRF02 AG, it has been suggested that the CRF02 AG subtype has
a stronger genetic barrier to the acquisition of mutations of residue G140 than subtype B
(Maiga et al., 2009). Another study showed that treatment failure on RAL occurred more
rapidly in patients infected with non-B subtype viruses, indicating a possible impact of non-B-
associated polymorphisms on the genetic barrier to RAL (Sichtig et al., 2009). The dynamics

51
of resistance mutations is very complex in vivo. High levels of resistance are always
associated with the emergence of primary resistance mutations, but treatment failure on IN
inhibitors is common in patients infected with WT virus. Nevertheless, maintaining INI
treatment in patients with treatment failure but no IN mutations, invariably leads to emergence
of a high level of resistance (Hatano et al., 2010). Furthermore, in addition to the stepwise
accumulation of primary and secondary mutations under constant RAL pressure, as observed
with other antiretrovirals a switch from one resistance mutation pattern to another is also
commonly observed (Malet et al., 2009). The switch of resistance profile from residue N155
to residue Q148 mutations may occur due to the higher level of resistance to RAL conferred
by pathways associated with Q148R/H mutation and the greater instability of the pathways
associated with residue N155 (Malet et al., 2009). As it has been shown for RAL that no
relevant antiviral activity persists in vivo for viruses harbouring N155H mutations, and given
the risk of an accumulation or switching of mutations towards higher levels of resistance and
cross-resistance to other INSTIs, it would appear to be inadvisable to maintain INI treatment
in patients with treatment failure (Wirden et al., 2009).
IV. Raltegravir- the first clinically used Integrase specific
drug
1. Discovery and development of Raltegravir.
As was mentioned above, (II. Antiretroviral Drugs, 4. Integrase Inhibitors) the
discovery of RAL stemmed from investigations of a series of HCV polymerase inhibitors. The
architecture of the catalytic site and the arrangement of the metal cations are very similar in
integrase and the HCV NS5b RNA dependent RNA polymerase. These similarities led the
Merck team to test HCV polymerase inhibitors originally designed as drug-compliant DKA
replacements (Summa et al., 2008). This led to the identification of a compound with activity
52
in the enzymatic assay, which was further optimized in cell culture (Pace et al., 2007). RAL is
a very potent inhibitor of the replication of HIV-1 and HIV-2 in vitro (Roquebert et al., 2008).
It is more than 1,000 times more selective for integrase than for other phosphatidyl
transferases, such as HIV-1 RNAseH and human polymerases. It has an IC50 of 2 to 7nM for
the inhibition of recombinant IN-mediated strand transfer in vitro and an IC95 of 0.019 and
0.031 μM in 10% FBS and 50 % NHS, respectively, in a cell-based assay (Summa et al.,
2008). Due to its mode of action, it is independent of HIV-1 tropism (CCR5 and CXCR4) and
active against viruses resistant to other classes of antiretroviral drugs, such as nucleoside RT,
PR fusion and entry inhibitors (Grinsztejn et al., 2007).
2. Efficiency of Raltegravir
2.1 Antiviral activity in vivo
Phase II and III clinical trials demonstrated a remarkable potency of combinations of
RAL and other ARVs in treatment-experienced patients (Cooper et al., 2008; Grinsztejn et al.,
2007). The first phase II assay was a dose-ranging study in patients with documented
resistance to at least one drug in each of the three classes of ARVs. This population had
considerable experience of treatment and a very high level of drug resistance.
There was an approximate 2.0 log copies/ml drop in plasma HIV RNA levels by week 24
in the RAL group, versus only 0.35 log with optimized therapy alone plus placebo, with no
significant difference in viral efficacy between the three dosage groups studied (200, 400, 600
mg) (Grinsztejn et al., 2007). For the subsequent double blind phase III BENCHMARK I and
II studies, in which 699 patients with considerable experience of treatment were enrolled, the
combined analysis at 48 weeks showed that 72.3% and 62.1% of RAL treated patients had
HIV RNA levels of less than 400 and 50 copies/ml, respectively, whereas such levels were
found in only 37.1% and 32.9%, respectively, of the patients in the placebo group. The 48-
53
week results recently obtained for the phase III STARTMRK study comparing RAL-based
and Efavirenz-based (RT inhibitor) combination regimens as initial treatment demonstrated
that RAL suppressed HIV replication more rapidly than Efavirenz, this rapid viral decay being
of unknown origin (Lennox et al., 2009). Moreover, preliminary results from a non inferiority
study of the use of RAL to replace Enfuvirtide in patients intolerant to Enfuvirtide have
shown RAL to be virologically effective for sustained periods, with good tolerance for up to
48 weeks. Conversely, the SWITCHMRK 1 and 2 trials, designed to examine the benefit of
replacing a protease inhibitor with RAL, suggested that the RAL combination might not
inhibit HIV replication more efficiently. In situations of resistance due to prior treatment
failure, switching to RAL amounts to monotherapy, with the rapid selection of RAL-resistant
HIV strains, as the genetic barrier to RAL is easily overcome. Nevertheless, these results
suggest that RAL is an important additional drug for the initial treatment of HIV-1 infection.
2.2 Safety
Preclinical studies of toxicity by repeated administration, genotoxicity and toxic
effects on development have been conducted with RAL, in mice, rats, dogs and rabbits. No
mutagenic or teratogenic effect was observed. The effects observed at levels exceeding actual
exposure levels revealed no likelihood of a clinical risk in humans (Summa et al., 2008). RAL
is well tolerated and adverse events are rare. Most frequent drug-related clinical events, such
as diarrhoea, nausea, headache and fatigue, were moderate and transient (Iwamoto et al.,
2008). Laboratory abnormalities included an increase in serum lipid, amino-transferase and
creatinine concentrations. Increases in creatinine phosphokinase levels, although not
statistically significant, led to a cautious recommendation not to use RAL concomitantly with
other drugs known to increase these levels. In phase II and phase III trials, the frequency of
clinical and laboratory adverse events was similar in the RAL and placebo groups. In the
54
STARTMRK trial, significantly fewer drug-related clinical adverse events occurred in
patients on RAL than in those on Efavirenz (Lennox et al., 2009). The BENCHMRK trial
suggested a small increase of the risk of cancer in the RAL arm, with a relative risk of 1.5, but
a recent analysis of all the available data concluded that the relative risk was actually less than
1 (Chirch, Morrison & Steigbigel, 2009).
2.3 Pharmacokinetics
RAL is administered orally and is rapidly absorbed. Its absolute bioavailability has yet
to be determined, but the administration of 400 mg per day results in steady-state levels of the
drug in the body within two days, as demonstrated by pharmacokinetics studies. About 83%
of the RAL ingested binds to plasma proteins. Animal studies have shown RAL penetrate the
stomach, liver, small intestine, kidney and bladder effectively, but have suggested that
penetration into the brain is limited. Considerable intra- and inter individual variability was
observed. RAL is a substrate, but not an inhibitor of P-glycoprotein (Pgp). There is currently
no evidence to suggest that inhibitors or inducers of Pgp could affect RAL, but this property
may affect its absorption (Sante-Appiah & Skalka, 1999). It could also account for the limited
diffusion of this drug into the central nervous system. No effect of age or sex has been
identified in studies of the pharmacokinetics of RAL (no data are available for children)
(Iwamoto et al., 2008). The half-life of RAL in the body is about nine hours, with an initial
phase of rapid elimination lasting about 1 hour. At steady state, a slight increase in residual
concentrations of the drug is observed, but with no effect on the maximum concentration,
making it possible to administer RAL twice daily. RAL is mostly metabolized in the liver,
through glucuronidation by uridine diphosphate-glucuronolsy- transferase 1A1 (UGT1A1) to
generate a single metabolite, M2. RAL is neither a substrate nor an inhibitor of the
cytochrome P450 enzymes, consistent with a lack of interaction with drugs metabolized by
55
P450 isoenzymes, including PR inhibitors. It does not inhibit either UGT1A1 or 2B7 and does
not induce CYP34A. As RAL is mostly metabolized by UGT1A1, it should be used with
caution when co-administered with strong inducers of UGT1A1, such as Rifampicin. This
antibiotic has been shown to reduce plasma concentrations of RAL, although its impact on the
efficacy of RAL is unknown. A mutation of the UGT1A1 gene resulting in the production of
an inactive enzyme has been identified. Two studies have shown in the concentration of RAL
to be higher in patients with a homozygous mutant genotype. This genotype seems to be an
important factor in interindividual variability, but its clinical relevance, in terms of efficacy
and toxicity, is unknown (http://www.emea.europa.edu). Finally, Atazanavir, a PR inhibitor
affecting glucuronidation, decreases the formation of RAL glucuronide and induces a
moderate increase in RAL concentration (Grinsztejn et al., 2007).
3. Viral Resistance to Raltegravir
As with other antiretroviral drugs, resistance to INI emerges through the selection of
mutations in the integrase gene affecting the susceptibility of the virus to INI. More than 40
mutations have been specifically associated with resistance to INSTIs in vitro and in vivo
(Ceccherini-Silberstein et al., 2009) (Table 1). Resistance to RAL in vivo has been associated
with 14 mutations, to different degrees, but the virologic failure observed during the
BENCHMRK trials was unambiguously associated with two principal independent genetic
pathways involving primary mutations of residues N155 (N155H) and Q148 (Q148K/R/H)
(Cooper et al., 2008; Steigbigel et al., 2008). These mutations were not detected in the various
studies on integrase polymorphism in INI-naive patients, confirming their likely role in
conferring resistance to this class of drugs. Secondary mutations increasing the fitness of the
resistant viruses were identified in both pathways. In particular, the G140S mutation rescues a
replication defect resulting from the primary mutation Q148H (Delelis et al., 2009)

56
phenotypic analysis showed that the presence of the mutation at position 148 together with
one or more secondary mutations resulted in greater resistance to RAL than observed for
viruses carrying the mutation N155H. Clonal analysis of the viral populations in 11 patients
with treatment failure on RAL showed that no viral clone simultaneously carried mutations in
position 148 and 155, demonstrating the independence and exclusivity of the two main
pathways. Moreover, a switch of resistance profile from residue 155 to residue 148 mutations
may occur due to the higher level of resistance to RAL conferred by the pathways associated
with residue 148 mutation and the greater instability of the pathways associated with residue
155 (Delelis et al., 2009; Malet et al., 2009). A small number of mutations involving residues
E92, E157 and Y143 might constitute another pathway of resistance. There is some debate
about whether the first two of these mutations are true primary mutations for RAL resistance,
whereas the Y143 mutation has been shown to confer a real decrease in susceptibility to the
inhibitor (Sichtig et al., 2009). Y143R/C/H mutations occur less frequently and later than the
other two mutations (Croxtall & Keam, 2009). The major IN mutations E92Q, Q148K/R/H,
N155H and E157Q are highly conserved and subject to similar genetic barriers between
subtypes B and CRF02_AG. However, the CRFO2_AG subtype has a stronger genetic barrier
to the acquisition of mutations of residue G140 than subtype B (Maiga et al., 2009). Another
showed that treatment failure on RAL occurred more rapidly in patients infected with non B
subtype viruses, indicating a possible impact of non B-associated polymorphisms on the
genetic barrier to RAL (Sichtig et al., 2009).
V. Molecular Modeling Approaches
Molecular modeling encompasses all theoretical methods and computational
techniques used to model the biological or chemical molecules and mimic or simulate their

57
behaviour. The techniques are used in the fields of computational chemistry, biology and
materials science for studying molecular systems ranging from small chemical molecules to
large biological systems and molecular or material assemblies. The structural properties of
chemical and biological molecules are characterized mainly by X-ray analysis. Although
crystallographic data yield valuable insights into such structural rearrangements, they
represent only average conformation for a given set of crystallization conditions. Alternative
experimental techniques, such as NMR spectroscopy, and computational approaches, such as
molecular dynamics (MD) and normal mode analysis (NMA), provide a way to better
understand the structure-dynamics-function relationships at the atomic level and further
characterize the protein structure alteration and internal dynamics induced by exogenous
factors.
The common feature of modeling techniques is the atomistic level description of the
molecular systems; the lowest level of information is individual atoms. The benefit of
molecular modeling is that it reduces the complexity of the system, allowing many more
particles to be considered during simulations. Molecular modeling studies are useful in as
much as they may allow us particularly, to understand the activity and selectivity of currently
existing therapeutic agents, and, furthermore, may help in the design of novel effective
therapeutic agents. These theoretical methods also enable to describe intermediate
conformational states that can be used to guide the design of specific inhibitors acting as
modulators of the enzymatic function by targeting putative allosteric sites.
In the present work, we employed a series of molecular modeling approaches in order to
characterise the conformational flexibility of raltegravir, to build the structural models of the
HIV-1 integrase and to study the interactions between RAL and its viral targets, IN, viral
DNA and IN•vDNA complex.
58
1. Ab-initio Methods
Quantum mechanical (QM) calculation of macromolecular interaction energy presents a
grand challenge in theoretical chemistry and computational biology. Due to the large number
of atoms present in biological macromolecules (proteins, DNA), standard application of
quantum chemistry methods to computing interaction energy of biological molecules is
beyond the reach of computations due to steep computational scaling with the system size. At
present, the overwhelming computational studies of biological molecules employ molecular
force fields to calculate interaction energies of biological molecules (Brooks et al., 1983;
Brendesen, 1984; Brendesen, 1984).
The ab initio quantum mechanical methods are readily used in drug metabolism studies.
These methods require only the positions and atomic numbers of the atoms to be specified and
offer greater transferability than conventional molecular modeling techniques. This fact
permits computational experiments to be performed, allowing details of reaction mechanisms
to be understood (Segall, Payne, Ellis, Tucker, & Boyes, 1997).
Despite the great success of force field methods in biological applications, quantum
mechanical or ab initio computation of interaction energy is more desirable due to limitations
of the classical force field approach. The introduction of QM calculation of electronic energy
into biological molecules is of paramount importance for accurate prediction of chemical and
biological properties of complex biological systems (Chen & Zhang, 2004)
2. Fragment-based Structural Analysis
Drugs are typically discovered by identifying active compounds from screening
chemical libraries or natural products and optimizing their properties through the synthesis of
structurally related analogues. This is a costly and time-consuming process. Suitable
compounds with the requisite potency, compound availability, or desired chemical and
59
physical properties cannot always be found. Furthermore, even when such compounds are
found, optimization often requires the synthesis of many analogues (Shuker, Hajduk,
Meadows, & Fesik, 1996). The fragment-based structure design focuses on a relatively new
concept within the domain of drug discovery. The fragmentation of drug leads into smaller
pieces, or even into discrete functional groups (for example, carboxylate, amine, aryl group),
has been used for some time to simplify the computational analysis of ligand binding and to
map out different pharmacophoric elements required for high-affinity binding (Bohm, 1995;
Miranker & Karplus, 1991). These fragments are usually endowed with reduced affinities but
are better suited for chemical modifications aimed at producing novel drug candidates.
Since its onset, the technique has experienced a soaring success in large pharma, small
biotechs, and academia (Hajduk & Greer, 2007). Fragments can sample chemical space more
effectively than regular ligands do and fragment docking clearly outperforms traditional high-
throughput screening in terms of hit rates. Parallel to the purposeful deployment of
customized software, some other computational techniques have been adapted to handle
fragments, in particular those that attempt to yield ligands by starting off from these building
blocks. Fragments can evolve virtually, be linked (to join two or more fragments that occupy
different regions of the binding site), self-assemble (through direct bond formation, linkers,
between different reacting fragments), and/or be optimized to better fulfil drug-like properties.
Fragments are usually docked and scored, but due to the fact that their volumes are smaller
than the binding site cavity erroneous binding modes can be obtained. Besides, scoring
functions need to be tuned as they are parameterized for much larger molecular entities.
Nonetheless, despite these deficiencies, much progress has been made in the field and
fragment-based ligand design (FBLD) has become a routine tool nowadays. Fragments can be
designed de novo or obtained from ligand databases by chemical dissociation (i.e.
fragmentation) (Cortes-Cabrera, Gago, & Morreale, 2012).

60
3. Docking
3.1 Protein-Ligand Docking
Protein–ligand docking is a molecular modeling technique aimed to predict the
position and orientation of a small molecule (ligand, inhibitor, cofactor) when it is bound to a
protein or enzyme. Computational structure prediction of ligand-protein complexes by the use
of molecular docking simulations has led to great advances in understanding of the molecular
recognition phenomenon and has become a vital tool in drug discovery by facilitating
structure-based ligand design (Jones & Willett, 1995; Gschwend, Good, & Kuntz, 1996).
Docking simulations require the energy of the ligand-protein complex crystal structure to be
the global minimum on the binding energy landscape, that represents a thermodynamic
condition on the employed in simulations energy function.
Docking simulations usually determine a single structure of the molecular complex
with the lowest energy and postulate that the lowest energy conformation corresponds to the
wild-type structure. The number of low energy structures is usually very large and a
computationally demanding task of finding the lowest energy structure does not imply its
thermodynamic stability. Nevertheless, the structure prediction problem implies determination
of the ensemble of many similar conformations, which describe the thermodynamically stable
native basin of the global energy minimum, rather than a single structure (Verkhivker et al.,
2000).
The key characteristic of a good docking program is its ability to reproduce the
experimental binding modes of ligands. To test this, a ligand is taken out of the X-ray
structure of its protein–ligand complex and docked back into its binding site. The docked
binding mode is then compared with the experimental binding mode, and a root-mean-square
distance (RMSD) between the two is calculated; a prediction of a binding mode is considered

61
successful if the RMSD is below a certain value. Another characteristic of a good docking
program is the ability of its scoring function to score and rank ligands according to their
experimental binding affinities. To test this, the predicted binding affinities, or scores, are
plotted against the experimental binding affinities; the key indicator for the quality of the
predicted affinities is the standard deviation. An important use of protein–ligand docking
programs is virtual screening, in which large libraries of compounds are docked into a target
binding site and scored. For this purpose, the docking needs to be quick. Speeding up a
docking protocol is often done at the cost of sampling fewer binding modes, and, as a result,
reduces the success rates. It is therefore important that search parameters are chosen that give
docking speeds useful for virtual screening applications, with an acceptable loss in docking
accuracy (Verdonk, Cole, Hartshorn, Murray, & Taylor, 2003).
3.2 Protein-DNA Docking
Protein-DNA interactions regulate many cellular processes involving gene expression,
DNA replication and repair. The recognition process can either be specific or non-specific
depending on functional requirements. Although several structural studies have been
performed to understand the specificity of the recognition process, the mechanism is still
elusive and a simple code for DNA recognition by proteins does not seem to exist (Matthews,
1988; Lavery, 2005). Protein-DNA docking is a very challenging problem in bioinformatics
and has important implications in a number of applications (e.g. rational drug design).
Computational docking methods can provide structural models of molecular complexes in
cases where it is difficult or impossible to obtain an experimental complex structure. It is a
predictive approach based on the structures of the individual partners. Several methods for
protein-ligand and protein-protein docking have been developed and used extensively for the
prediction of these complexes. However, much fewer methods for systematic docking to

62
predict the structure of protein-DNA complexes have been published so far (Setny, Bahadur,
& Zacharias, 2012). This includes Fast Fourier correlation techniques (Aloy et al., 1998) and
the geometric hashing method - ParaDock (Banitt & Wolfson, 2011). Another program,
HADDOCK (van, van Dijk, Hsu, Boelens, & Bonvin, 2006; van & Bonvin, 2010) includes
conformational changes at some stage of a multi-start docking search has been used to tackle
the prediction of protein-DNA complexes.
4. Molecular Dynamics
Molecular Dynamics (MD) is a simulation of the physical
movements of atoms and molecules in a given system. These atoms and molecules are
allowed to interact for a period of time, producing a view of the atoms motion.
The trajectories of these entities are determined by solving the Newton's equations of
motion for a system of interacting particles, where forces between the particles and potential
energy are defined by molecular mechanics force fields.
The conformational dynamics of protein molecules is encoded in their
structures and is often a critical element of their function. A fundamental appreciation for
how proteins work therefore requires an understanding of the connection between three-
dimensional structure, obtained with increasing rapidity by X-ray crystallography or nuclear
magnetic resonance (NMR spectroscopy), and molecular dynamics, which is much more
difficult to probe experimentally. MD simulations provide powerful tools for the exploration
of the conformational energy landscape accessible to these molecules, and the rapid increase
in computational power coupled with improvements in methodology makes this an exciting
time for the application of simulation to structural biology (Karplus & Kuriyan, 2005). MD
simulations provide links between structure and dynamics by enabling the exploration of the
conformational energy landscape accessible to protein molecules (Karplus, 2002; Wang,

63
Donini, Reyes, & Kollman, 2001). The first MD simulation of a protein was reported in
1977 and consisted of a 9.2-ps trajectory for a small protein in vacuum (McCammon, Gelin,
& Karplus, 1977). The increase in computing power since then now makes it possible to run
simulations of much larger proteins, in various environments.
Molecular dynamics simulations can provide the ultimate detail concerning individual
atomic motions as a function of time; thus, they can be used to answer specific questions
about the properties of a model system often more readily than experiments (Karplus &
Kuriyan, 2005).
5. Homology Modeling
Homology modeling allows construction of a three-dimensional (3D) model of
the protein at the atomic level (target) from its amino acid sequence and an experimental 3D
structure of a related homologous protein (template). It relies on the identification of one or
more known protein structures likely to resemble the structure of the target sequence, and on
the production of an alignment that maps residues in the target sequence to residues in the
template sequence. It has been shown that protein structures are more conserved than protein
sequences amongst homologues (Chothia & Lesk, 1986).
3D protein structures provide invaluable insights into the molecular and structural
basis of protein function. Although great progress was made in the field of experimental
structure solution by X-ray crystallography and NMR spectroscopy, it is still a time-
consuming process with no guarantee of success.
Protein Data Bank (PDB) currently contains about 84 645 experimentally
characterized protein structures (Westbrook, Feng, Chen, Yang, & Berman, 2003;
http://www.rcsb.org/pdb/). Whereas, the number of known protein sequences in SWISS-

64
PROT and TrEMBL databases is much more (about 850,000 sequence entries) than number
of known different structures (Boeckmann et al., 2003). Hence, no structural information is
available for a vast majority of proteins. There exists a gap in the structure knowledge and
computational methods for protein structure prediction have helped in filling this gap, in
recent years. Among all current theoretical approaches, comparative homology modeling is
the only method that can reliably generate a 3D model of a protein (target) from its amino
acid sequence (Schwede, Kopp, Guex, & Peitsch, 2003). Successful model building requires
at least one experimentally solved 3D structure (template) that has a significant amino acid
sequence similarity to the target sequence. Homology modeling typically involves four steps
(Sanchez & Sali, 1997; Marti-Renom et al., 2000): (1) identification of protein homologs that
can be used as template(s) for modeling; (2) alignment of the target sequence to the
template(s); (3) building a 3D model for the target based on the information from the
alignment(s); and (4) evaluation of the model. Finally, all four steps can be repeated until a
satisfactory model is obtained. The elucidation of experimental structures and homology
modeling complement one another in the exploration of the protein structure space. The
growing number of structural templates brings a steadily increasing number of sequences into
‘modeling distance’ for comparative modeling. (Schwede et al., 2003)
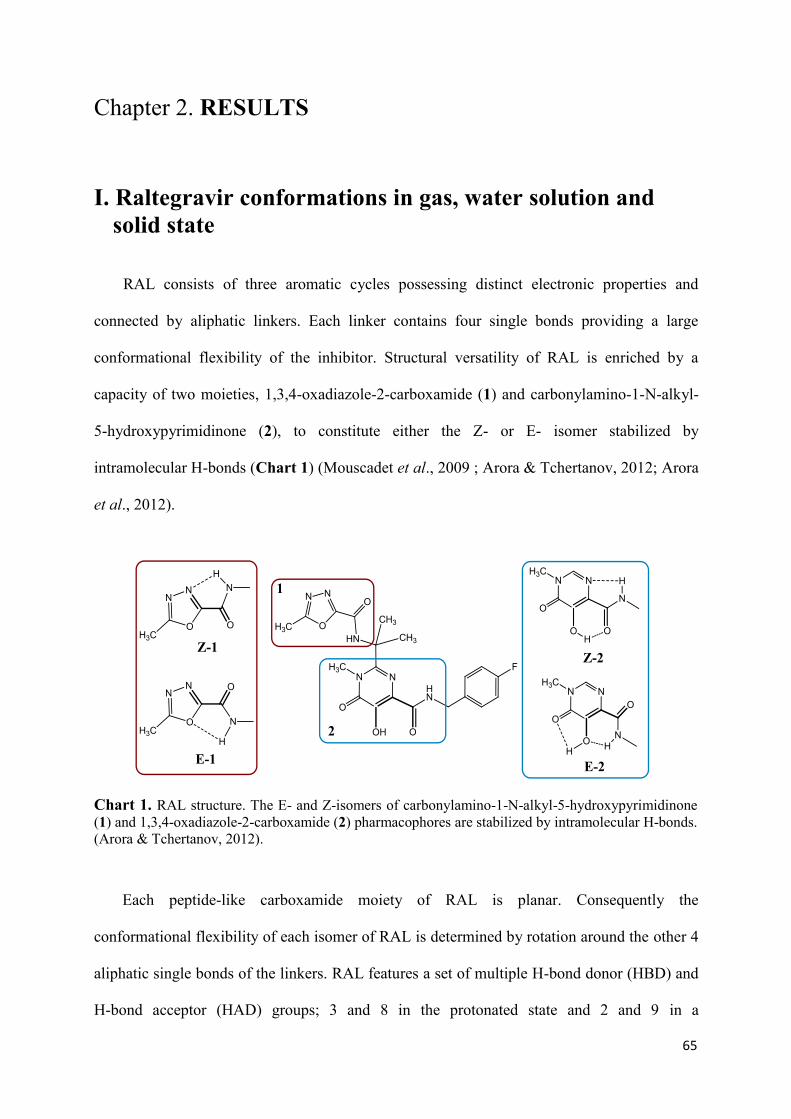
65
Chapter 2. RESULTS
I. Raltegravir conformations in gas, water solution and
solid state
RAL consists of three aromatic cycles possessing distinct electronic properties and
connected by aliphatic linkers. Each linker contains four single bonds providing a large
conformational flexibility of the inhibitor. Structural versatility of RAL is enriched by a
capacity of two moieties, 1,3,4-oxadiazole-2-carboxamide (1) and carbonylamino-1-N-alkyl-
5-hydroxypyrimidinone (2), to constitute either the Z- or E- isomer stabilized by
intramolecular H-bonds (Chart 1) (Mouscadet et al., 2009 ; Arora & Tchertanov, 2012; Arora
et al., 2012).
Chart 1. RAL structure. The E- and Z-isomers of carbonylamino-1-N-alkyl-5-hydroxypyrimidinone (1) and 1,3,4-oxadiazole-2-carboxamide (2) pharmacophores are stabilized by intramolecular H-bonds. (Arora & Tchertanov, 2012).
Each peptide-like carboxamide moiety of RAL is planar. Consequently the
conformational flexibility of each isomer of RAL is determined by rotation around the other 4
aliphatic single bonds of the linkers. RAL features a set of multiple H-bond donor (HBD) and
H-bond acceptor (HAD) groups; 3 and 8 in the protonated state and 2 and 9 in a

66
pharmaceutically acceptable potassium (K) salt, respectively, which could affect RAL affinity
for its target.
The intrinsic conformational features of RAL have been investigated in the gas phase, in
the water solution and the solid state.
1. Raltegravir conformations in the gas phase
First, the geometry and energetic of the protonated RAL was considered in the gas phase.
The ab initio calculations were performed at the Hartree Fock (HF) level of theory. The RAL
structure from crystallographic data characterized the PFV IN in complex with the viral DNA
and RAL (PDB code: 3OYA, 2.65Å resolution) was used as initial template. Full geometry
optimization and energy calculations were carried out for the four RAL isomers: Z-1/Z-2, Z-
1/E-2, E-1/Z-2 and E-1/E-2 (Chart 1). Following the geometry optimization, the RAL
conformations were generated for the four configurations by relaxed scan around four
aliphatic single bonds of the linkers, characterized by torsion angles t1-t4 respectively, with
an increment step of 30°. The energy profiles of generated RAL conformations differ strongly
in terms of energy value, while the local minima and maxima are localized within the
approximately same ranges of torsion angles in all configurational states (Figure 15 a-d). The
energetic profiles of free rotation describing conformational flexibility of two substituents
relatively to pyrimidine cycle (torsion angles t1 and t2, in blue and red colours respectively),
are quite indicative and discriminative for selection of the energetically favourable RAL
configuration. Energy profile describing rotation of oxadiazole-carboxamide (torsion angle t3,
in green color) is very similar in Z-1/Z-2 and E-1/Z-2 isomers and represents the energy
values varied weakly within a large torsion angle range from 30 to 330°. The max and min
values are observed at 0 and 360° respectively. In the two other configurational isomers, Z-
1/E-2 and E-1/E-2, their profiles are slightly different. Energetical profile of the fluorobenzyl
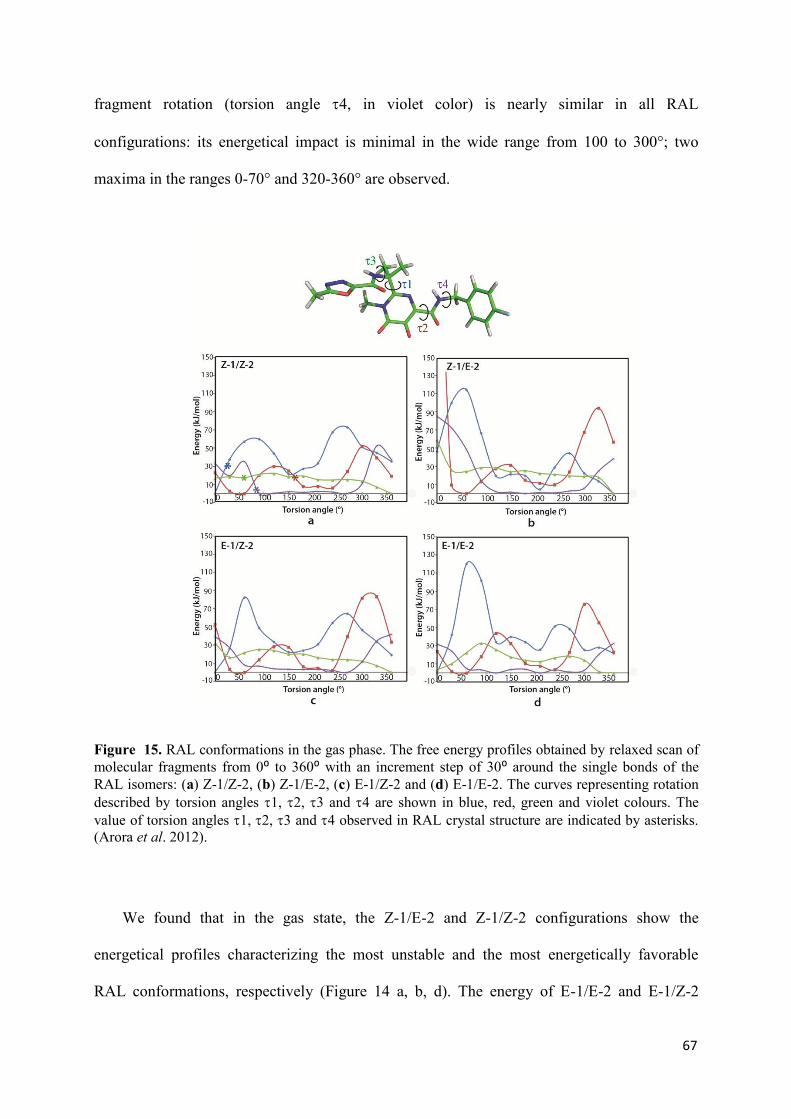
67
fragment rotation (torsion angle t4, in violet color) is nearly similar in all RAL
configurations: its energetical impact is minimal in the wide range from 100 to 300°; two
maxima in the ranges 0-70° and 320-360° are observed.
Figure 15. RAL conformations in the gas phase. The free energy profiles obtained by relaxed scan of molecular fragments from 0⁰ to 360⁰ with an increment step of 30⁰ around the single bonds of the RAL isomers: (a) Z-1/Z-2, (b) Z-1/E-2, (c) E-1/Z-2 and (d) E-1/E-2. The curves representing rotation described by torsion angles t1, t2, t3 and t4 are shown in blue, red, green and violet colours. The value of torsion angles t1, t2, t3 and t4 observed in RAL crystal structure are indicated by asterisks. (Arora et al. 2012).
We found that in the gas state, the Z-1/E-2 and Z-1/Z-2 configurations show the
energetical profiles characterizing the most unstable and the most energetically favorable
RAL conformations, respectively (Figure 14 a, b, d). The energy of E-1/E-2 and E-1/Z-2
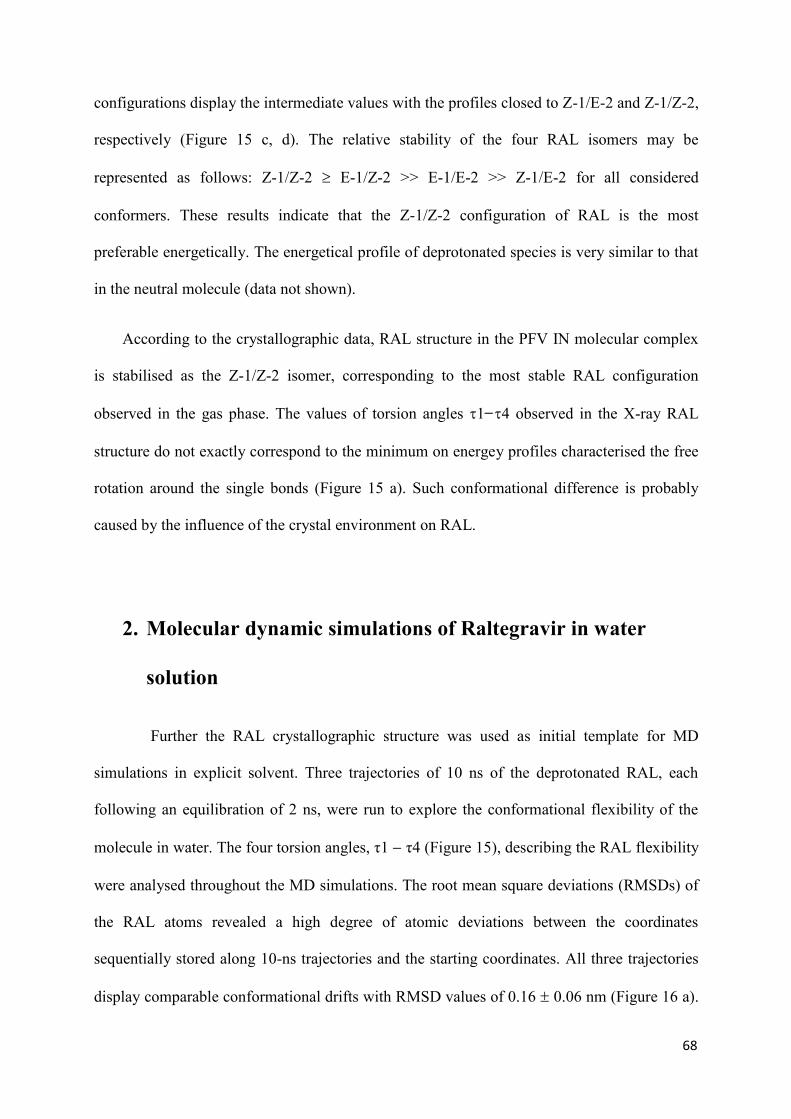
68
configurations display the intermediate values with the profiles closed to Z-1/E-2 and Z-1/Z-2,
respectively (Figure 15 c, d). The relative stability of the four RAL isomers may be
represented as follows: Z-1/Z-2 ³ E-1/Z-2 >> E-1/E-2 >> Z-1/E-2 for all considered
conformers. These results indicate that the Z-1/Z-2 configuration of RAL is the most
preferable energetically. The energetical profile of deprotonated species is very similar to that
in the neutral molecule (data not shown).
According to the crystallographic data, RAL structure in the PFV IN molecular complex
is stabilised as the Z-1/Z-2 isomer, corresponding to the most stable RAL configuration
observed in the gas phase. The values of torsion angles t1 t4 observed in the X-ray RAL
structure do not exactly correspond to the minimum on energey profiles characterised the free
rotation around the single bonds (Figure 15 a). Such conformational difference is probably
caused by the influence of the crystal environment on RAL.
2. Molecular dynamic simulations of Raltegravir in water
solution
Further the RAL crystallographic structure was used as initial template for MD
simulations in explicit solvent. Three trajectories of 10 ns of the deprotonated RAL, each
following an equilibration of 2 ns, were run to explore the conformational flexibility of the
molecule in water. The four torsion angles, τ1 - τ4 (Figure 15), describing the RAL flexibility
were analysed throughout the MD simulations. The root mean square deviations (RMSDs) of
the RAL atoms revealed a high degree of atomic deviations between the coordinates
sequentially stored along 10-ns trajectories and the starting coordinates. All three trajectories
display comparable conformational drifts with RMSD values of 0.16 ± 0.06 nm (Figure 16 a).
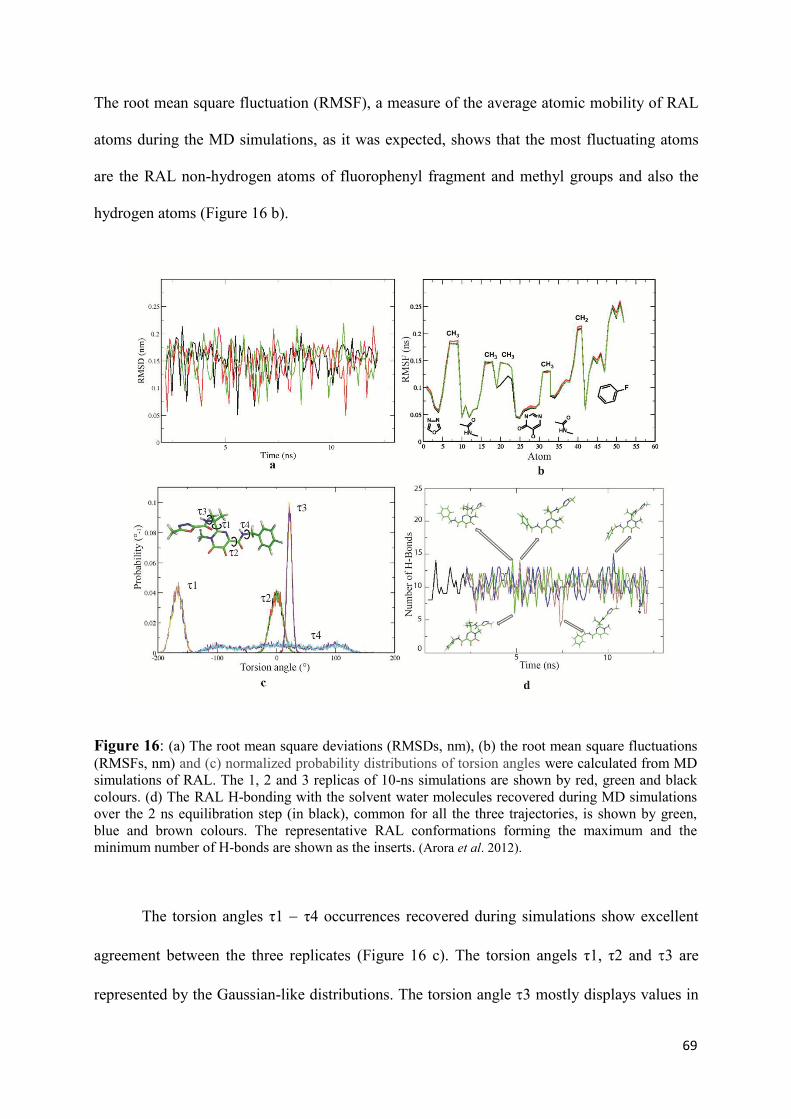
69
The root mean square fluctuation (RMSF), a measure of the average atomic mobility of RAL
atoms during the MD simulations, as it was expected, shows that the most fluctuating atoms
are the RAL non-hydrogen atoms of fluorophenyl fragment and methyl groups and also the
hydrogen atoms (Figure 16 b).
Figure 16: (a) The root mean square deviations (RMSDs, nm), (b) the root mean square fluctuations (RMSFs, nm) and (c) normalized probability distributions of torsion angles were calculated from MD simulations of RAL. The 1, 2 and 3 replicas of 10-ns simulations are shown by red, green and black colours. (d) The RAL H-bonding with the solvent water molecules recovered during MD simulations over the 2 ns equilibration step (in black), common for all the three trajectories, is shown by green, blue and brown colours. The representative RAL conformations forming the maximum and the minimum number of H-bonds are shown as the inserts. (Arora et al. 2012).
The torsion angles τ1 - τ4 occurrences recovered during simulations show excellent
agreement between the three replicates (Figure 16 c). The torsion angels τ1, τ2 and t3 are
represented by the Gaussian-like distributions. The torsion angle t3 mostly displays values in
70
a narrow range, from 10 to 30°. Values for the torsion angles τ1 and τ2 ranged from -190 to -
150° and -25 to 25° respectively. The τ4 values are largely/widely distributed from -130 to
130 .
The RAL H-bonding recorded during MD simulations indicates a very high capacity
of the molecule to bind water molecules (Figure 16 d). The number of H-bonds formed by
RAL varies from 4 to 15 with mean value of 11. In the majority of RAL conformations the
eight acceptor and two donor groups of RAL are exposed to the solvent accessible at the
same time, hence each such group is capable to form one or two H-bonds with the water
molecules. Most of these H-bonds are strong in terms of their length. The RAL involved in
multiple H-bonds may strongly affect the molecular conformation in solution compared to
those observed in the crystal (PDB code: 3OYA) and in the gas phase (Figure 15 a).
3. Fragment-based structural analysis
3.1 Raltegravir configuration/conformation properties
We analyzed the conformational properties of RAL in the solid state using the structural
data of the building stones of RAL, the 1,3,4-oxadiazole-2-carboxamide (1), carbonylamino-
1-5-hydroxypyrimidinone (2) and 4-fluorobenzylcarbamoyl (3) derivatives in crystals. The
Cambridge Structural Database (CSD) (Allen, 2002) search for the molecules based on the
each pharmacophore produced no hits for the 1, only 3 structures for the 2 and X structures for
the 3 (Table 2). The absence (1) or limited data (2 and 3) required the search for the more
general fragments and resulted in statistically relevant data (Table 2).

71
Figure 17. RAL conformations in the solid state. CSD fragment-based analysis of the RAL subunits as defined in Table 1. (a) F1: Scatter plots of the absolute value of torsion angle T1
vs intermolecular distance O···H. The E- (blue triangles) and Z- (red squares) conformations are indicated by closed symbols. Intermediate conformations are shown as hollow symbols. (b) F2: Absolute value of torsion angle T1
vs intermolecular distance O···H. The E- (red circles) and Z- (blue squares) conformations are indicated by closed symbols. Intermediate conformations are shown as hollow symbols. (c) F3: Absolute value of torsion angles T1
vs T2. The data representing F (blue circles), Cl (red squares) and Br (green triangles) substituent at the phenyl ring. The RAL and POPYOJ crystal structure parameters are indicated by asterisks. (Arora et al. 2012).
The torsion angle T1 describing the relative position of the O or N vicinal atoms and the
intramolecular contact O···H were used to distinguish between the F1 conformations. A
scatter plot of absolute values of torsion angle and O···H-N distance (T1 vs O···H) revealed
three major clusters and a limited number of randomly distributed observations (Figure 17 a)
Torsion angles within the range 0 to 25° and to 145 to 180° were considered to meet the
criteria for Z- and E-configuration, respectively. Bases on this definition, the one cluster with
T1 ~ 0° was attributed to the Z- and two distinct clusters with T1 ~180 to the E-configuration.
The randomly distributed points corresponding to intermediate conformations were not
72
considered. The populations of the different clusters were not identical, with most of the F1
fragments in crystals adopting E-conformation (~ 75%). The intramolecular O···H distance
was correlated with the F1 conformation. The O···H distance ranges from 2.0 to 2.5 Å and
corresponds to stabilising the E-configuration intramolecular H-bonds (IHB). The small
cluster with T1 ~ 180° and O···H distances from 3.35 to 3.65 Å represents also the E-
conformation, but the amino H-atom position is not favourable to form IHB.
This structural fragment-based analysis indirectly indicates a higher probability of the
E-conformation in the 1,3,4-oxadiazole-2-carboxamide derivatives than the Z-conformation.
The stability of such configuration can be attributed to the intramolecular H-bonding or steric
and/or other electronic molecular factors. Nevertheless the Z-conformation is observed in
~20% of related structures.
Retrieved carbonylamino-1-5-hydroxypyrimidinone (2) derivatives were synthesized
recently and represent a new class of heterocyclic ligands (Xu, Whisenhunt, Veeck, Uhlir, &
Raymond, 2003; Sunderland, Botta, Aime, & Raymond, 2001). These ligands were
synthesised by a two-step procedure to provide the desired flexibility and were characterized
by X-ray analysis (CSD refcodes: GACMUT and MESDAP). GACMUT shows a planar
structure stabilized in the E-configuration by N‒H···O intramolecular H-bonding with H···O
of 2.02 Å (Figure 17 a). To avoid the H-bond induced stabilization of the E-configuration H
atom was replaced by methyl group. Produced molecule, MESDAP, conserves its E-
conformation but not planarity: carbonylamino group is turned at 70° relatively
hydroxypyrimidinone ring to resolve the steric constrains. Later a multi-steps procedure was
applied to synthesized a RAL prototype, flurobenzyl derivative of carbonylamino-1-5-
hydroxypyrimidinone, POPYOJ (Zhong et al., 2009), lead to RAL synthesis which was
finalized by a manufacturing route for the synthesis of RAL potassium salt (Humphrey et al.,
2011). Carbonylamino-1-5-hydroxypyrimidinone moiety of POPYOJ is stabilized in a planar

73
Z-configuration by strong O‒H···O intramolecular H-bond with H···O bond distance of 1.86
Å (Figure 17 b). Consequently in the solid state carbonylamino-1-5-hydroxypyrimidinone
moiety shows two different configurations, E- and Z (Chart 1).
To enrich the structural data related to carbonylamino-1-5-hydroxypyrimidinone
moiety we referenced to the β-ketoenol fragments, F2, a very important pharmacophore and
corner stone of (1) and numerous biologically active molecules. F2 has been previously
characterized in details (Tchertanov & Mouscadet, 2007). We had shown that the vast
majority of β-ketoenols (96%) were stabilized by very strong intramolecular H-bonding in Z-
configuration. At the present work we performed the last update of the data with recent
version of CSD (Figure 17 b).
The halogenated aromatic rings are widely present in the drugs. Fluorine is the smallest
halogen, strongly electronegative and can interact with the H-atom donors in the enzyme as
well as contribute to an enhancement of the inhibitor lipophilicity that in turn effects on
improvement in cell permeability.
The CSD search was performed for more generalized fragment F3 based on
benzylcarbamoyl derivatives with a halogen atom (Hal =F/Cl/Br) at the para position. The
rotation of the aromatic ring relatively carbamoyl fragment was described with torsion angle,
T1 and dihedral angle D formed by two planes P1 and P2 defined in Table 2. A type of the
halogen atom was taken into consideration. A scatter plot of absolute value of torsion angles
T1 vs D reveals a dense cluster for T1 ranging from 60° to 120° and D from 65° to 90°. The
second and diffused cluster is in the range of T1 from 160 to 180° and D of 0° to 90°. Such
distribution indicates a very large conformational freedom of benzylcarbamoyl derivatives
with a halogen atom at the para position (blue circles for F, red squares for Cl and green
triangles for Br).
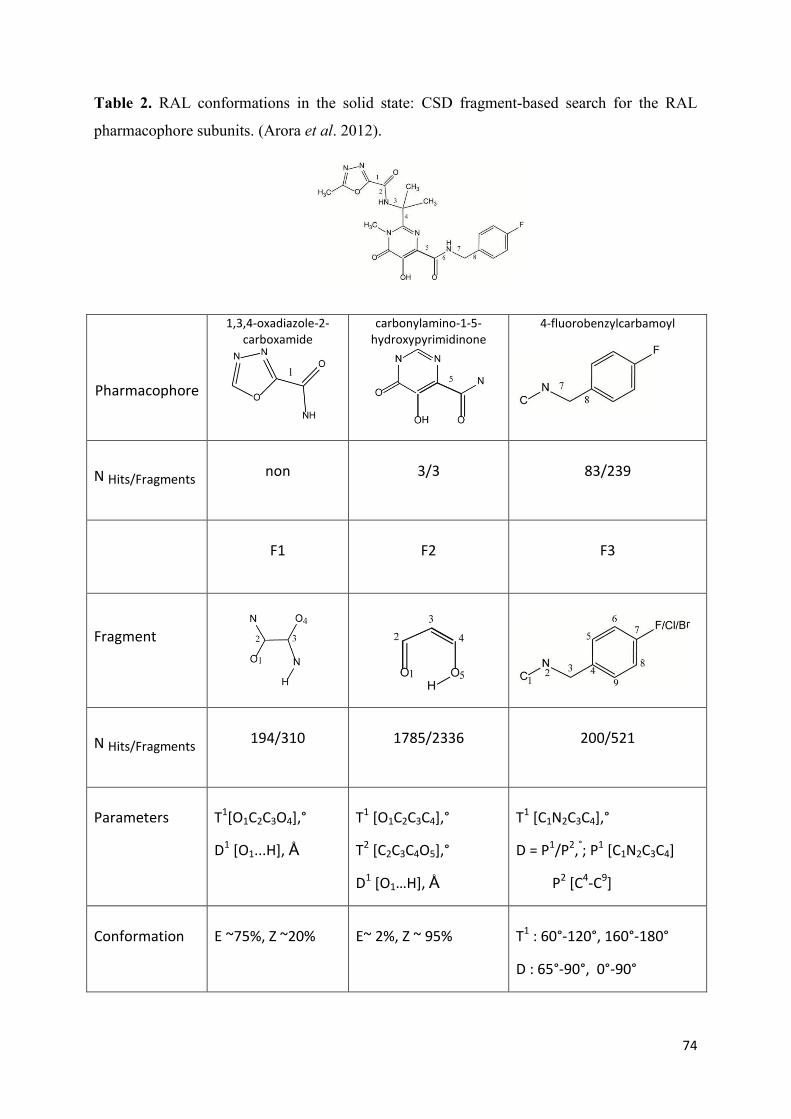
74
Table 2. RAL conformations in the solid state: CSD fragment-based search for the RAL
pharmacophore subunits. (Arora et al. 2012).
Pharmacophore
1,3,4-oxadiazole-2-
carboxamide
carbonylamino-1-5-
hydroxypyrimidinone
4-fluorobenzylcarbamoyl
N Hits/Fragments
non
3/3
83/239
F1
F2
F3
Fragment
N Hits/Fragments
194/310
1785/2336
200/521
Parameters
T1[O1C2C3O4],°
D1 [O1...H], Å
T1 [O1C2C3C4],°
T2 [C2C3C4O5],°
D1 [O1…H], Å
T1 [C1N2C3C4],°
D = P1/P
2,°; P
1 [C1N2C3C4]
P2 [C
4-C
9]
Conformation
E ~75%, Z ~20%
E~ 2%, Z ~ 95%
T1 : 60°-120°, 160°-180°
D : 65°-90°, 0°-90°
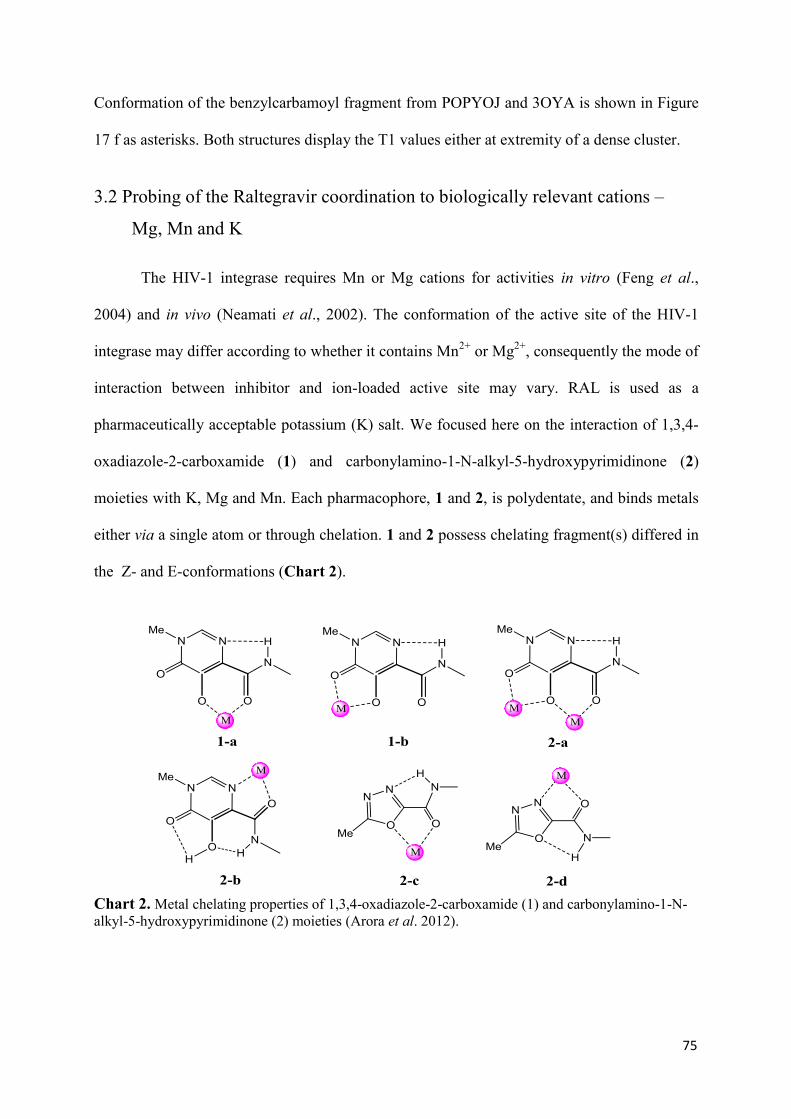
75
Conformation of the benzylcarbamoyl fragment from POPYOJ and 3OYA is shown in Figure
17 f as asterisks. Both structures display the T1 values either at extremity of a dense cluster.
3.2 Probing of the Raltegravir coordination to biologically relevant cations ‒
Mg, Mn and K
The HIV-1 integrase requires Mn or Mg cations for activities in vitro (Feng et al.,
2004) and in vivo (Neamati et al., 2002). The conformation of the active site of the HIV-1
integrase may differ according to whether it contains Mn2+ or Mg2+, consequently the mode of
interaction between inhibitor and ion-loaded active site may vary. RAL is used as a
pharmaceutically acceptable potassium (K) salt. We focused here on the interaction of 1,3,4-
oxadiazole-2-carboxamide (1) and carbonylamino-1-N-alkyl-5-hydroxypyrimidinone (2)
moieties with K, Mg and Mn. Each pharmacophore, 1 and 2, is polydentate, and binds metals
either via a single atom or through chelation. 1 and 2 possess chelating fragment(s) differed in
the Z- and E-conformations (Chart 2).
Chart 2. Metal chelating properties of 1,3,4-oxadiazole-2-carboxamide (1) and carbonylamino-1-N-alkyl-5-hydroxypyrimidinone (2) moieties (Arora et al. 2012).
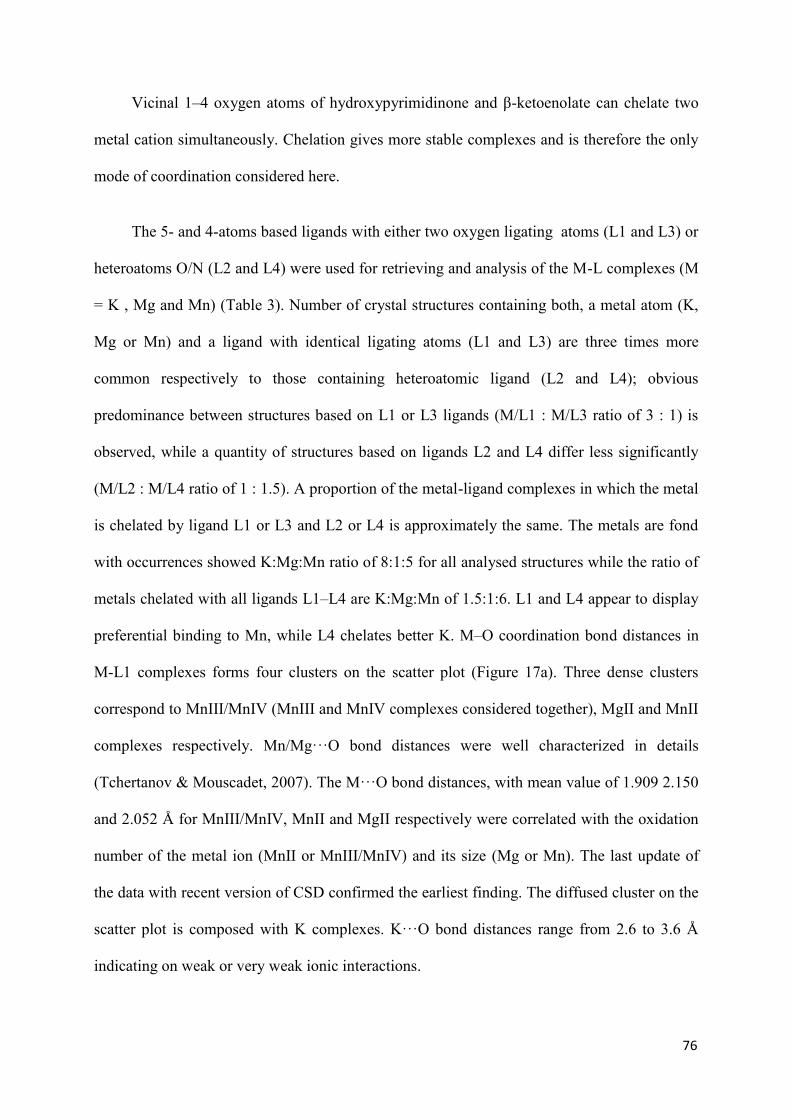
76
Vicinal 1‒4 oxygen atoms of hydroxypyrimidinone and β-ketoenolate can chelate two
metal cation simultaneously. Chelation gives more stable complexes and is therefore the only
mode of coordination considered here.
The 5- and 4-atoms based ligands with either two oxygen ligating atoms (L1 and L3) or
heteroatoms O/N (L2 and L4) were used for retrieving and analysis of the M-L complexes (M
= K , Mg and Mn) (Table 3). Number of crystal structures containing both, a metal atom (K,
Mg or Mn) and a ligand with identical ligating atoms (L1 and L3) are three times more
common respectively to those containing heteroatomic ligand (L2 and L4); obvious
predominance between structures based on L1 or L3 ligands (M/L1 : M/L3 ratio of 3 : 1) is
observed, while a quantity of structures based on ligands L2 and L4 differ less significantly
(M/L2 : M/L4 ratio of 1 : 1.5). A proportion of the metal-ligand complexes in which the metal
is chelated by ligand L1 or L3 and L2 or L4 is approximately the same. The metals are fond
with occurrences showed K:Mg:Mn ratio of 8:1:5 for all analysed structures while the ratio of
metals chelated with all ligands L1–L4 are K:Mg:Mn of 1.5:1:6. L1 and L4 appear to display
preferential binding to Mn, while L4 chelates better K. M‒O coordination bond distances in
M-L1 complexes forms four clusters on the scatter plot (Figure 17a). Three dense clusters
correspond to MnIII/MnIV (MnIII and MnIV complexes considered together), MgII and MnII
complexes respectively. Mn/Mg···O bond distances were well characterized in details
(Tchertanov & Mouscadet, 2007). The M···O bond distances, with mean value of 1.909 2.150
and 2.052 Å for MnIII/MnIV, MnII and MgII respectively were correlated with the oxidation
number of the metal ion (MnII or MnIII/MnIV) and its size (Mg or Mn). The last update of
the data with recent version of CSD confirmed the earliest finding. The diffused cluster on the
scatter plot is composed with K complexes. K···O bond distances range from 2.6 to 3.6 Å
indicating on weak or very weak ionic interactions.
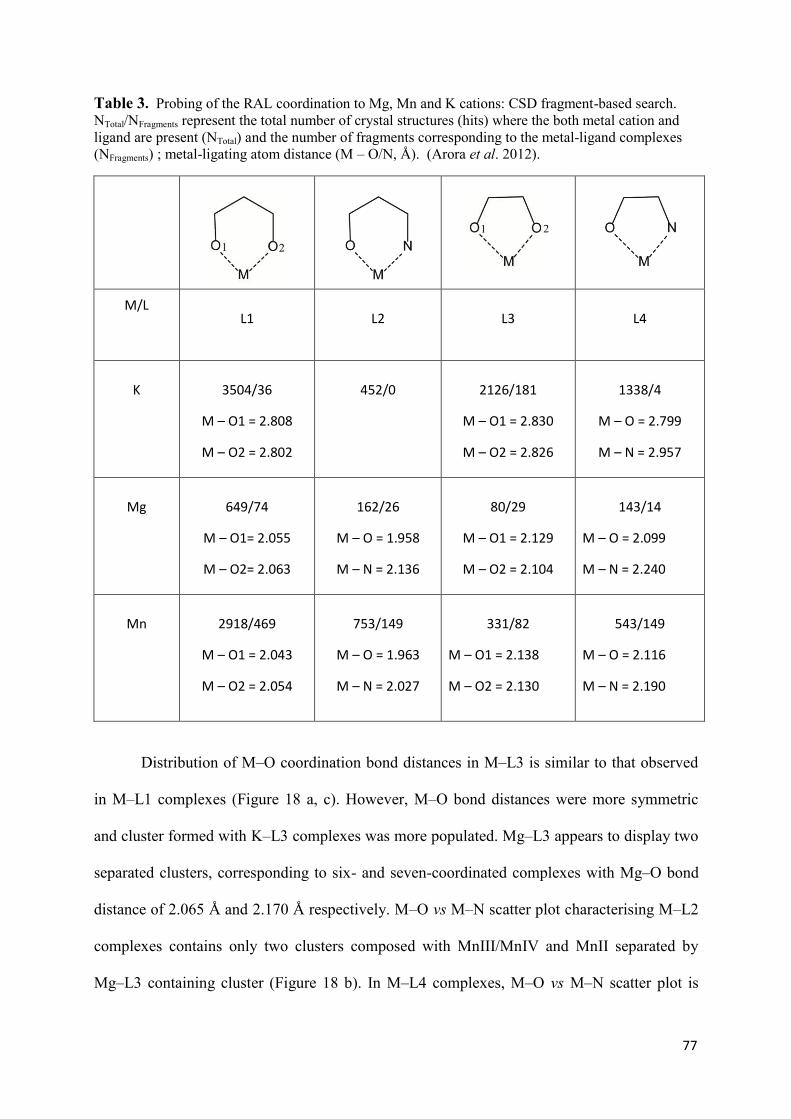
77
Table 3. Probing of the RAL coordination to Mg, Mn and K cations: CSD fragment-based search. NTotal/NFragments represent the total number of crystal structures (hits) where the both metal cation and ligand are present (NTotal) and the number of fragments corresponding to the metal-ligand complexes (NFragments) ; metal-ligating atom distance (M – O/N, Å). (Arora et al. 2012).
M/L
L1
L2
L3
L4
K
3504/36
M – O1 = 2.808
M – O2 = 2.802
452/0
2126/181
M – O1 = 2.830
M – O2 = 2.826
1338/4
M – O = 2.799
M – N = 2.957
Mg
649/74
M – O1= 2.055
M – O2= 2.063
162/26
M – O = 1.958
M – N = 2.136
80/29
M – O1 = 2.129
M – O2 = 2.104
143/14
M – O = 2.099
M – N = 2.240
Mn
2918/469
M – O1 = 2.043
M – O2 = 2.054
753/149
M – O = 1.963
M – N = 2.027
331/82
M – O1 = 2.138
M – O2 = 2.130
543/149
M – O = 2.116
M – N = 2.190
Distribution of M‒O coordination bond distances in M‒L3 is similar to that observed
in M‒L1 complexes (Figure 18 a, c). However, M‒O bond distances were more symmetric
and cluster formed with K‒L3 complexes was more populated. Mg‒L3 appears to display two
separated clusters, corresponding to six- and seven-coordinated complexes with Mg‒O bond
distance of 2.065 Å and 2.170 Å respectively. M‒O vs M‒N scatter plot characterising M‒L2
complexes contains only two clusters composed with MnIII/MnIV and MnII separated by
Mg‒L3 containing cluster (Figure 18 b). In M‒L4 complexes, M‒O vs M‒N scatter plot is
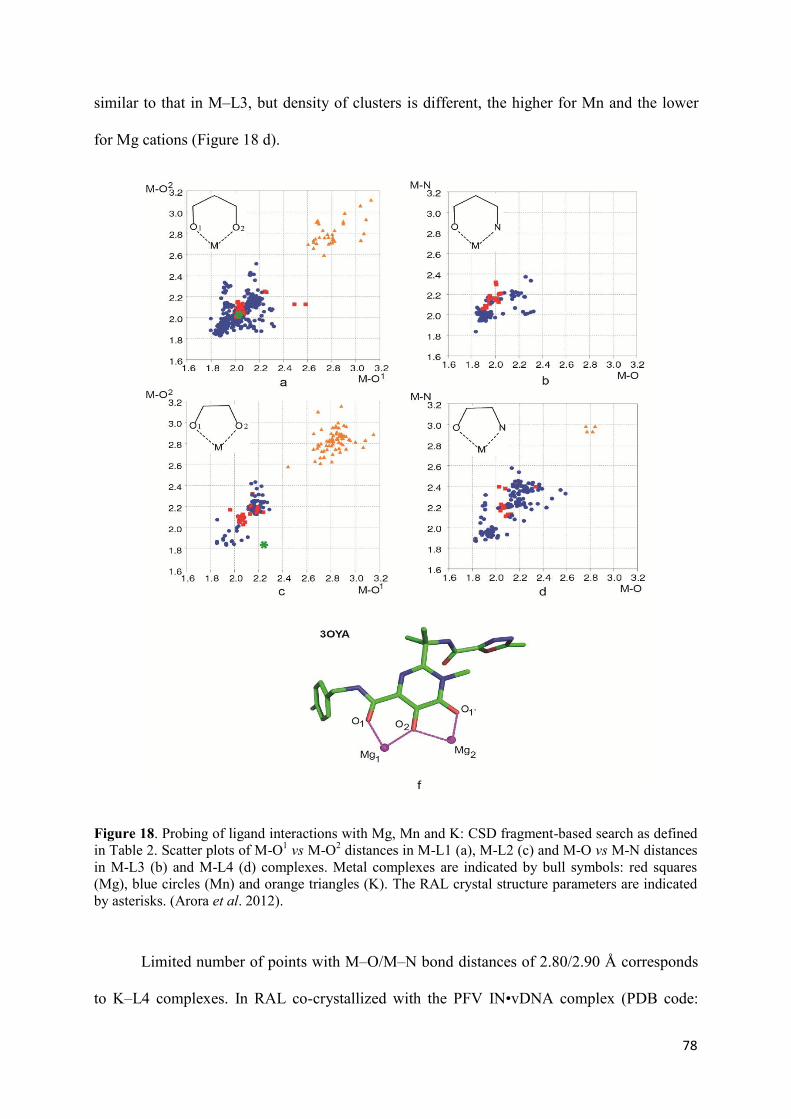
78
similar to that in M‒L3, but density of clusters is different, the higher for Mn and the lower
for Mg cations (Figure 18 d).
Figure 18. Probing of ligand interactions with Mg, Mn and K: CSD fragment-based search as defined in Table 2. Scatter plots of M-O1 vs M-O2 distances in M-L1 (a), M-L2 (c) and M-O vs M-N distances in M-L3 (b) and M-L4 (d) complexes. Metal complexes are indicated by bull symbols: red squares (Mg), blue circles (Mn) and orange triangles (K). The RAL crystal structure parameters are indicated by asterisks. (Arora et al. 2012).
Limited number of points with M‒O/M‒N bond distances of 2.80/2.90 Å corresponds
to K‒L4 complexes. In RAL co-crystallized with the PFV IN•vDNA complex (PDB code:
79
3OYA) the coordination bonds M‒O correspond very well to statistical observations for M-L1
complexes, while these distances are strongly asymmetric and differ from corresponding
statistical data for M‒L3 complexes (Figure 18 a, c). Both Mg2+ cations in the active site are
fixed as two-atom cluster by means of D64 residue that plays a role of the bridge. The sterical
conditions in the active site and conjugated effect in RAL may be the major factors for such
distorted coordination geometry.
4. Discussion
In the context of drug design, the conformation an inhibitor adopts when bound to a target
is of fundamental importance. The variety of inhibitor conformations observed in different
conditions may arise from interactions with a local environment and frequently differ from the
bioactive conformation. Systematic differences may occur between the solid state
conformation and those observed in solution or gas phase. Our conformational analysis of the
different isomeric states of RAL in the gas phase indicates a small difference between the
energy profiles of the Z-1/Z-2 and E-1/Z-2 isomers suggesting a relatively low energetical
barrier between these two inhibitor states. A slight preference for the Z-configuration of
carbonylamino-hydroxypyrimidinone pharmacophore in the gas phase was observed, in
coherence with the established predisposition of β-ketoenols – a principle corner stone of this
pharmacophore – to adopt the Z-isomer in the solid state (Tchertanov & Mouscadet, 2007).
The preference of aliphatic β-ketoenols to form energetically favourable Z-configuration has
been predicted early by ab initio studies at the B3LYP/3-G** level of theory (Schiavoni et al,
2001). Our structural databank search based on molecular fragments mimicking the two RAL
pharmacophores statistically demonstrates the preferential Z-configuration of carbonylamino-

80
hydroxypyrimidinone-like molecules and the E-configuration of oxadiazole carboxamide–like
molecules in the solid state.
Synthesized as a metal cations chelating ligand, RAL can bind the metal by both
pharmacophores in the different isomerisation states. Probing of the RAL chelating features
with the relevant cations, K, Mg and Mn, we evidenced that in the majority of metal
complexes, the carbonylamino hydroxypyrimidinone-like fragments are observed in the Z
configuration in the solid state. The oxadiazole carboxamide-like pharmacophore is observed
in the metal complexes as two isomers and demonstrates a strong selectivity to the metal type
: the Z isomer binds K and Mg while the E isomer binds mainly Mn. The higher probability of
Mg2+ cation coordination by the Z-isomer of both pharmacophores indicates that the presence
of two Mg2+ cations at the integrase binding site may be a decisive factor for stabilisation of
the Z/Z configuration of RAL which is observed in the PFV intasome complex (Hare et al.,
2010 a; Hare et al., 2010b).
Therapeutically used RAL is in deprotonated state neutralised by K cation. Such drug
formula corresponds to the optimal condition allowing efficient cations replacement in cells.
The significantly higher affinity of both parmacophores to Mg relatively to K permits a
positive competition between these cations, resulting in the change of RAL composition from
a pharmaceutically acceptable potassium (K) salt to a biologically relevant Mg complex. To
describe the pharmacological properties of a given inhibitor, the knowledge of the site where
the inhibitor is to bind in the target and of the interaction(s) that control the specific
recognition of the inhibitor by its target(s), represents a corner stone factor. Only a limited
number of target-ligand molecular complexes are characterized experimentally at the atomic
level (X-ray or NMR analysis). Part of them characterize the binding of therapeutically
relevant ligands to biologically non-relevant and non-pertinent targets, for example, the HIV-1
integrase specific inhibitor RAL was published as a ligand fixed to the PFV intasome (Hare et
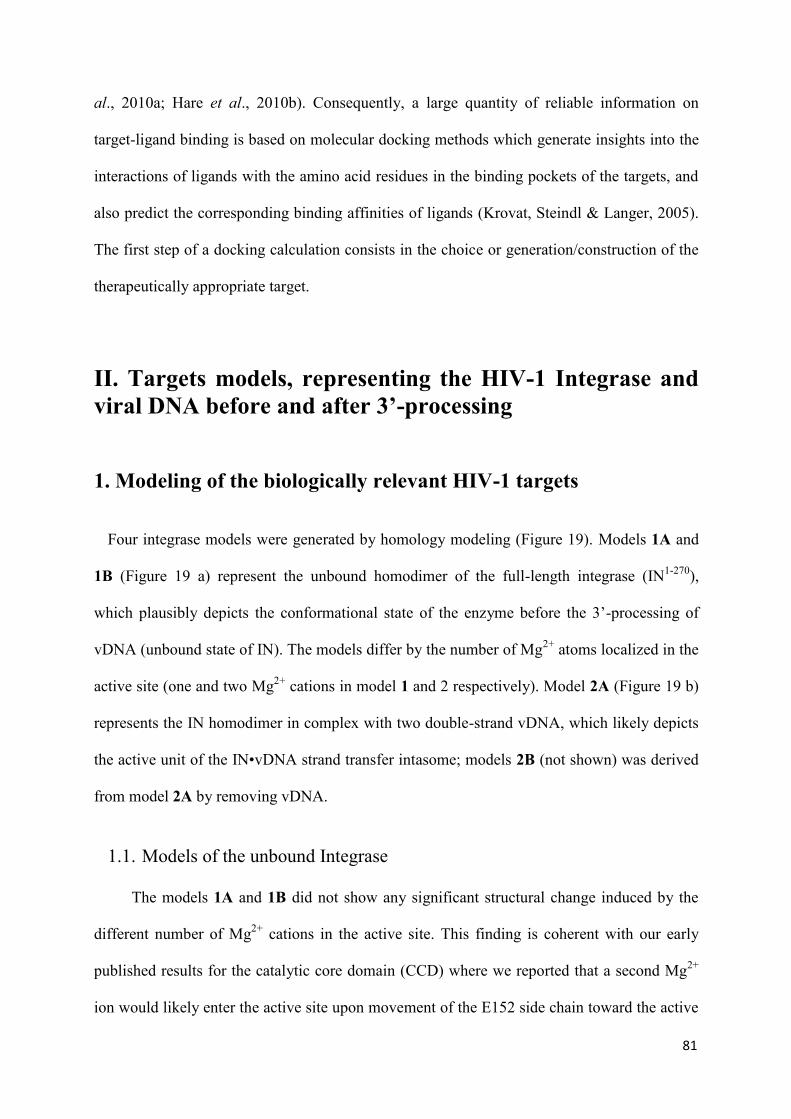
81
al., 2010a; Hare et al., 2010b). Consequently, a large quantity of reliable information on
target-ligand binding is based on molecular docking methods which generate insights into the
interactions of ligands with the amino acid residues in the binding pockets of the targets, and
also predict the corresponding binding affinities of ligands (Krovat, Steindl & Langer, 2005).
The first step of a docking calculation consists in the choice or generation/construction of the
therapeutically appropriate target.
II. Targets models, representing the HIV-1 Integrase and
viral DNA before and after 3’-processing
1. Modeling of the biologically relevant HIV-1 targets
Four integrase models were generated by homology modeling (Figure 19). Models 1A and
1B (Figure 19 a) represent the unbound homodimer of the full-length integrase (IN1-270),
which plausibly depicts the conformational state of the enzyme before the 3’-processing of
vDNA (unbound state of IN). The models differ by the number of Mg2+ atoms localized in the
active site (one and two Mg2+ cations in model 1 and 2 respectively). Model 2A (Figure 19 b)
represents the IN homodimer in complex with two double-strand vDNA, which likely depicts
the active unit of the IN•vDNA strand transfer intasome; models 2B (not shown) was derived
from model 2A by removing vDNA.
1.1. Models of the unbound Integrase
The models 1A and 1B did not show any significant structural change induced by the
different number of Mg2+ cations in the active site. This finding is coherent with our early
published results for the catalytic core domain (CCD) where we reported that a second Mg2+
ion would likely enter the active site upon movement of the E152 side chain toward the active
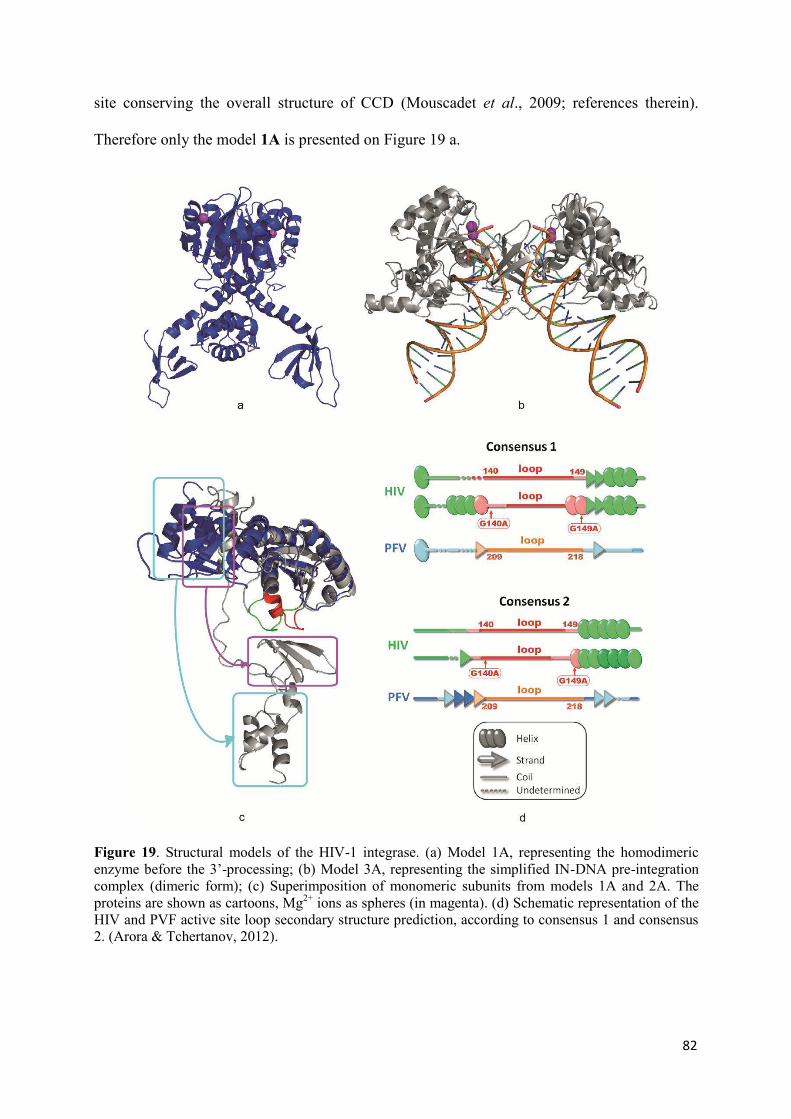
82
site conserving the overall structure of CCD (Mouscadet et al., 2009; references therein).
Therefore only the model 1A is presented on Figure 19 a.
Figure 19. Structural models of the HIV-1 integrase. (a) Model 1A, representing the homodimeric enzyme before the 3’-processing; (b) Model 3A, representing the simplified IN-DNA pre-integration complex (dimeric form); (c) Superimposition of monomeric subunits from models 1A and 2A. The proteins are shown as cartoons, Mg2+ ions as spheres (in magenta). (d) Schematic representation of the HIV and PVF active site loop secondary structure prediction, according to consensus 1 and consensus 2. (Arora & Tchertanov, 2012).

83
It will be useful to note that the Normal Modes Analysis (NMA) shows that in unbound IN
with two Mg2+ cations the active site is more rigid due to the stabilising role of the
coordination of the Mg2+ cations by three active site residues ‒D64, D116 and E152 ‒ whereas
the catalytic site loop flexibility increases significantly (S. Abdel-Azeim, personal
communication).
1.2 Models of the IN•vDNA complex
Model 2A was generated from the X-ray structure of the PFV intasome (Hare et al.,
2010). As we reported, despite the very low sequence identity (22%) between the HIV-1 and
PFV INs, the structure-based alignment of the two proteins demonstrates high conservation of
key secondary structural elements and the three PFV IN domains shared with HIV-1 IN have
essentially the same structure as the isolated IN domains from HIV-1 (Ni et al., 2012).
Moreover, the structure of the PFV intasome displays a distance between the reactive 3’ ends
of vDNA that corresponds to the expected distance between the integration sites of HIV-1 IN
target DNA (4 base pairs). Consequently, we suggested that the PFV IN X-ray structure
represents an acceptable template for the HIV-1 IN model generation (Yin & Craigie, 2010).
We supposed that a simplified dimer model of the IN•vDNA complex (Figure 19 b) will be
appropriate for the docking procedure.
It is worth noting large structural and conformational changes observed between the
unbound (model 1A) and vDNA-bound (model 2A) integrase states regarding the relative
positions of the IN domains (RMSD of 31 Å, based on Cα) (Figure 19 c). These structural
modifications result in different contacts between the IN domains. As such, in the model 1A
no interaction was detected between CTD and CCD whereas the two domains interact tightly
in model 2A. The NTD-CCD interface also exhibits substantial changes: in the unbound form

84
the NTD-CCD interface belongs to the same monomer subunit whereas in the vDNA-bound
form the interface is composed of residues from the two different subunits.
Moreover, in the homology modelled IN•vDNA complex, IN undergoes important
structural transformation leading to structural re-organisation of the catalytic site loop; the
coiled portion of the loop reduces from 10 residues (140 -149 aas) in the unbound form to 5
residues (140-144 aas) in the vDNA-bound form. Two hypotheses were proposed: (i) such
effect may be induced by the vDNA binding, or (ii) it is an artefact derived from homology
modeling with the structural data of the PFV IN in which the shorter loop may be a natural
fold of the PFV IN sequence.
To explore the influence of the sequence on the loop folding we used a large range of
algorithms designed to predict secondary structure elements. Efficiency of secondary structure
prediction tools has been recently improved by the use of evolutionary information from
multiple alignments: the query sequence is aligned with homologous sequences taken from a
protein structures database, and the experimental structures of the homologous sequences are
considered in the prediction. Such method can produce biased results, particularly in the case
studied here. To avoid this discrepancy we considered consensus predictions derived from two
sets of prediction tools (see Chapter 4. MATERIAL AND METHODS).
Three amino acid sequences IN133-155of the wild-type (WT) and the double mutant
G140A/G149A IN from HIV-1 and the WT IN from PFV were considered. The secondary
structure prediction shows that in HIV-1 WT the sequence segment IN150-155, a part of the a-
helix IN150-166, is preceded by a random coil composed of 10 residues, IN140-149, while in the
double mutant G140A/G149A a reduced coil formed by only 7 amino acids, IN141-147, and an
increased a-helix IN148-166 are observed (Figure 19 d). Mutation G140A also influences the
secondary structure of the IN133-139 sequence segment, improving a β-sheet structure
85
respectively to those in the WT. Prediction results obtained with high reliability (>75%)
correlate perfectly with the X-ray data characterising the WT HIV-1 integrase (PDB code:
1B3L) (Maignan et al., 1998) and its double mutant G140A/G149A (PDB code: 1B9F)
(Greenwald et al., 1999).
Prediction for the PFV IN indicates a high probability of a two β-strands organisation of
sequence segments IN204-208 and IN220-222 (corresponding to IN135-139 and IN151-153 in the HIV-
1), linked by a random coil including 10 residues, IN209-219, (IN140-152 in the HIV-1) (Figure 19
d). Consequently, the secondary structure prediction shows that the WT IN133-155 sequence
segment from HIV-1 and corresponding IN202-224 sequence segment from PFV should naturally
fold in different and unlike structural elements. Crystallographic data characterising the
unbound PFV IN reports that IN210-220 residues were not identified (PDB code: 3DLR)
(Valkov et al., 2009). Apparently this sequence represents a strongly flexible coiled structure
as we observed in our prediction. In contrast, the X-ray structure of the PFV IN bound to the
vDNA shows a shortened coil and a long well-organized a-helix in IN214-234 sequence (PDB
code: 3L2U) (Hare et al., 2010b). This partial folding of the catalytic site loop is stabilized
through intra-IN domain-domain interactions and interactions with vDNA that probably
contribute to stabilisation and elongation of the a4-helix.
To complete the RAL targets definition, structural models representing the non-cleaved
and cleaved HIV-1 viral DNA (model 3A and 3B respectively) were constructed as described
in Chapter 4. MATERIALS AND METHODS and represent the double strands helix which
is slightly distorted at 3’-end in 3A model (Figure 21 a,b).
86
III. Raltegravir ‒ targets recognition
The characterization of RAL recognition by it viral targets were performed as
follows. First, RAL in each conformation generated starting from crystallographic structure
(PDB ID: 3OYA) represented the Z-1/Z-2 isomer, was docked onto the active site of three
targets, unbounded IN with the one and two Mg2+ cations at the catalytic site (models 1A and
1B) and onto IN•vDNA pre-integration complex (model 2A). RAL was considered in its
deprotonated form, as it is pharmaceutically acceptable as the potassium (K) salt.
Four different software were used for the docking procedure, AutoDock, Glide, Vina
and SurFlex. Such routine allows (i) to optimize the algorithm choice to dock the flexible
inhibitor and (ii) to evaluate RAL binding with different kind of the targets, flexible
(unbounded IN with the one Mg2+ cations at the catalytic site), semi-flexible (unbounded IN
with the two Mg2+ cations at the catalytic site) and rather rigid (IN•vDNA complex).
To distinguish between the RAL conformations we will referred crystallographic
structure of RAL as the “crystallographic conformation”, the conformations generated by
relaxed scan from crystallographic structure of RAL as the “generated conformations” and
RAL conformations produced by docking to targets as the “docked conformations”.
1. Docking poses and conformations
The docking conformations of RAL produced by docking of the generated
conformations onto the unbounded IN with a single Mg2+ cation within the catalytic site are
positioned mainly at the space (region) delimited by the catalytic site loop in extended (open)
conformation (Figure 20). They differed strongly from the generated conformations and their
isomeric state is frequently not coincident with the initial crystallographic Z-1/Z-2 isomer.
87
The binding energy values obtained by all applied software are ranged from -8.8 to -5.3
kcal/mol (Figure 20).
Docking of the same RAL conformations onto the unbounded IN with two Mg2+
cations within the catalytic site shows that the molecule is re-positioned from the loop towards
the active site (Figure 20). The binding energies are ranged from -9.8 to -6.5 kcal/mol.
Similarly to the docking of RAL onto the unbounded IN with a single Mg2+ cation a large
variety of isomers/conformers is realized. The RAL is oriented rather randomly respectively
the active site and loop.
Docking of the RAL conformations onto the IN•vDNA model resulted in RAL
binding modes with significantly higher scores (from -11.9 to -7.8 kcal/mol) than those found
for the unbounded IN with different Mg2+ cations population at the active site. RAL is
positioned in the catalytic site of pre-integration complex and chelates the Mg2+ cations in
agreement with the mechanism of action of the integrase inhibitors blocking strand transfer
reaction. Consequently, according to the data obtained by four different docking algorithms,
the Z-1/Z-2 isomer of RAL in all generated conformations bound most efficiently to the
INvDNA model. Nevertheless, the docking conformations show some differences.
The docking conformations of RAL differ strongly from the generated conformations
of the Z-1/Z-2 isomer of RAL. Moreover, some of them represent alternative isomers (Figure
20).
2. Evaluation of the docking algorithms
We also analysed the docking results individually for each docking method and
compared the efficiency of docking algorithms taken into consideration the target.

88
Figure 20. RAL‒Integrase binding predicted by docking. The docking of RAL generated conformations for the Z-1/Z-2 isomer onto the unbound IN with a single Mg2+ cation within active site (model 1A), with two Mg2+ cations within the active site (model 1B), and the IN•vDNA complex (model 3A) are presented at the top, middle and bottom panels, respectively. The graphs in the middle column shows the score profiles obtained by docking with using of four algorithms ‒ GLIDE (in red, line 1), SurFlex (in violet, line 2), AutoDock (in blue, line 3), and VINA (in green, line 4). Snapshots on the right an on the left show the representative poses of RAL obtained by docking onto the targets 1A, 1B and 3A by using the four different programs Numeration of the scores curves and snapshots showed on the top panel is valid for other panels. The proteins are shown as cartoons with a colour coded the used docking program, Mg2+ ions as spheres (in yellow) and RAL as sticks. (Arora et al. 2012).

89
The score profiles obtained for the RAL docking onto the same target by the different
software are altered significantly (Figure 20, middle column). For RAL docking onto
unbounded IN with a single Mg2+ cation the best scores were obtained with VINA. Binding
energies for all RAL conformations are very similar and ranged in a very narrow interval
(from -7.9 to -7.6 kcal/mol) (Figure 20). The results obtained with Autodock are very close to
those obtained with VINA and show only very slight increase of binding energies (from -7.9
to -7.2 kcal/mol). Binding energies obtained with SurFlex are characterized by more
important fluctuations and ranged from -8.0 to - 6.3 kcal/mol. Docking with Glide produced
the poor scores nearly for all docked RAL conformations.
The RAL docking conformations obtained with VINA, AutoDock and Glide docking
onto unbounded IN with two Mg2+ cations show very small fluctuations of binding energies
(Figure 20). They score value profiles superimposed perfectly with mean value of 8.5
kcal/mol. Binding energies obtained with SurFlex fluctuates significantly and show slightly
decreased values.
RMSDs between generated, docked and crystallographic conformations in these
experiments of RAL docking onto unbounded IN with either a single Mg2+ cation or two Mg2+
cations and IN•vDNA complex revealed a very high degree of the average RAL atomic
fluctuations for all applied software for exception of only rare docking conformations
obtained with Glide (data not shown).
As was mentioned above, the RAL docking onto the IN•vDNA model results the best
binding score with all applied algorithms. Particularly the best scores were obtained with
AutoDock and Glide as compared to the other two docking algorithms, VINA and SurFlex
(m.v. of -11.4, -11.1 , -9.8 and of -8.3 kcal/mol respectively).
90
We generated the others RAL isomers, E-1/Z-2, Z-1/E-2 and E-1/E-2. The RAL
conformations were derived for each isomer similarly to the procedure applied to Z-1/Z-2. As
the best results were obtained with Glide, we further used this software to dock the RAL
generated conformation onto the IN targets applying the same strategy as for docking trials of
Z-1/Z-2 isomer generated conformations. The obtained results show a general similarity with
the docking data observed for Z-1/Z-2 isomer, nevertheless the score values in majority of
cases are lower and the RAL binding poses show rarely chelation with the Mg2+ ion(s) in the
active site of the IN targets (data not shown).
3. The viral DNA as a putative Raltegravir target
Quite recently it was reported that unprocessed viral DNA could be the primary target
of RAL (Ammar et al., 2012). This study is based on the PFV DNA and several
oligonucleotides mimicking the HIV-1 DNA probed by experimental and computing
techniques.
To provide further data concerning RAL recognition by the HIV-1 viral targets, we
docked inhibitor onto the uncleaved and cleaved viral DNA (the terminal GT nucleotides at
3’-end were removed) by using Glide. The docking pose of RAL docked onto the un-cleaved
vDNA represents the molecule positioned in the major (minor) groove of substrate (Figure 21
c,d). The chelating centers of molecule are oriented towards (inside) the helix centre;
stabilizing interactions between the partners, RAL and vDNA, were not observed.
In contrast, RAL docked onto the cleaved vDNA is located at position of the
removed di-nucleotides (Figure 21 a,b). The best score corresponds to the Z-1/Z-2 isomer of
RAL with all chelating centres oriented outside of the vDNA helix (Figure 21 b). Such
orientation is stabilized by H-bonds with unpaired cytosine. The nitrogen atom of RAL
oxadiazole cycle interacts with amino group of cytosine (N-H···N distance of 2.85) forming
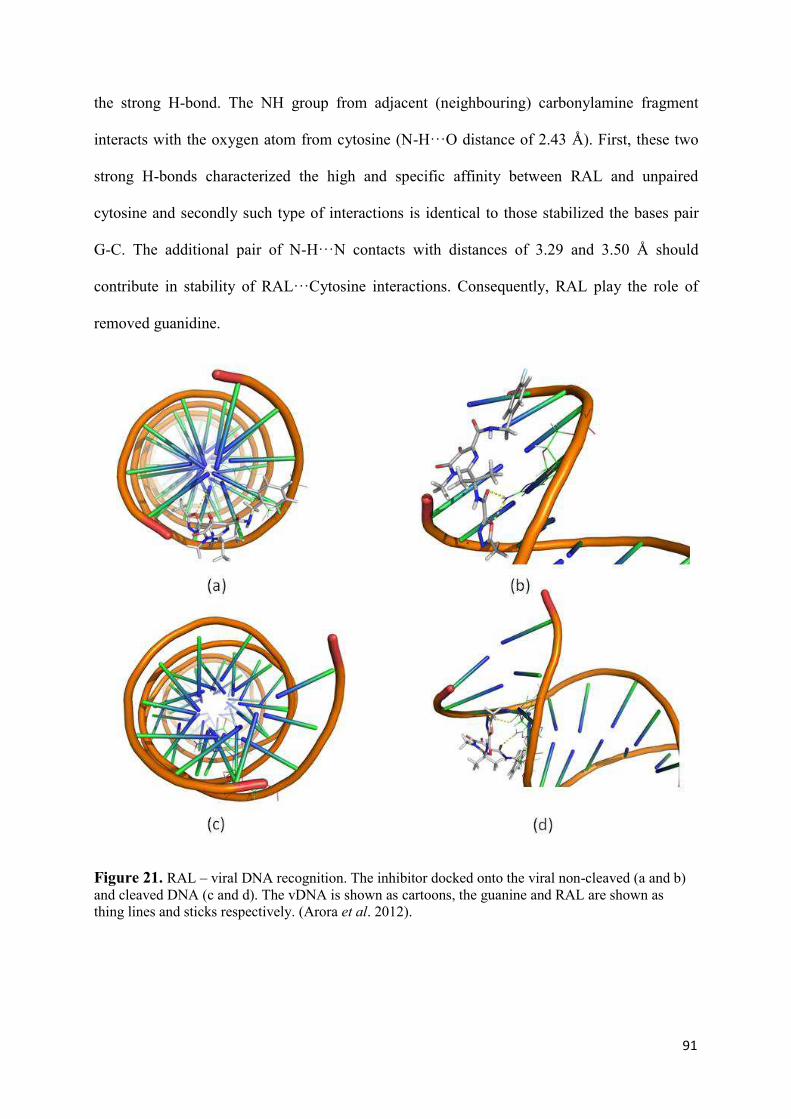
91
the strong H-bond. The NH group from adjacent (neighbouring) carbonylamine fragment
interacts with the oxygen atom from cytosine (N-H···O distance of 2.43 Å). First, these two
strong H-bonds characterized the high and specific affinity between RAL and unpaired
cytosine and secondly such type of interactions is identical to those stabilized the bases pair
G-C. The additional pair of N-H···N contacts with distances of 3.29 and 3.50 Å should
contribute in stability of RAL···Cytosine interactions. Consequently, RAL play the role of
removed guanidine.
Figure 21. RAL – viral DNA recognition. The inhibitor docked onto the viral non-cleaved (a and b) and cleaved DNA (c and d). The vDNA is shown as cartoons, the guanine and RAL are shown as thing lines and sticks respectively. (Arora et al. 2012).
92
4. Discussion
The structural models reported here were generated by homology modeling and represent
with a certain level of reliability two different enzymatic states of the HIV-1 IN that can be
explored as RAL biological relevant targets. All generated models are based on the
experimental data characterising either the partial structures of IN from HIV-1 or full-length
IN from PFV. The models of the separated full-length HIV-1 integrase represent the unbound
homodimers of IN (IN1-270) containing either one or two Mg2+ cations in the active site – a
plausible enzymatic state before the 3’-processing. The catalytic site loop encompassing ten
residues forms the boundary of the active site. This loop shows either a coiled structure
(Bujacz et al., 1996; Goldgur et al., 1998; Maignan et al., 1998) or contains an W-shaped
hairpin (Mouscadet et al., 2009;). Our simplified model of the HIV-1 IN•vDNA pre-
integration complex represents the homodimer of integrase attached non-covalently to the two
double strains of the viral DNA with two removed nucleotides GT at each 3’-end.
Two models of different states of the HIV-1 IN show a strong dissimilarity of their
structure evidenced by divergent relative spatial positions of their structural domains, NTD,
CCD and CTD. These tertiary structural modifications altered the contacts between IN
domains and the structure and conformation of the linker regions. Moreover, IN undergoes
important structural transformation leading to structural re-organisation of the catalytic site
loop; the coiled portion of the loop reduces from 10 residues in the unbound form to 5
residues in the vDNA-bound form. Such effect may be induced either by the vDNA binding or
it can derived as an artefact produced from the using of structural data of the PFV IN as a
template for the model generation. Prediction of IN133-155 sequence secondary structure
elements indicates a more significant predisposition of IN from HIV-1 to be folded as two
helices linked by a coiled loop than the IN from PFV. The helix elongation accompanied by
93
loop shortening may be easily induced over the enzyme conformational/structural transition
between the two integration steps prompted by substrate binding.
The docking calculations of RAL onto each model evidenced that (i) the large binding
pocket delimited by the active site and the extended catalytic site loop in the unbound IN can
accommodate RAL in distinct configurational/conformational states showing a lack of
interaction specificity between inhibitor and target; (ii) the well defined cavity formed by the
active site, vDNA and shortened catalytic site loop provides a more optimised RAL binding
site where the inhibitor is stabilised by coordination bonds with Mg2+ cations in the Z/Z-
configuration. Additional stabilisation of RAL is provided by non-covalent interactions with
the environmental residues of IN and the viral DNA bases. We suggested earlier the
stabilizing role of the vDNA in the inhibitors recognition by IN•vDNA pre-integration
complex (Ni et al., 2012). The role of the viral DNA in RAL recognition was further
evaluated in the present study. In the processed vDNA the Z/Z isomer of RAL takes place of
the remote GT based and is stabilised by strong and specific H-bonds with the unpaired
cytosine. These H-bonds characterize the high affinity and specific recognition between RAL
and the unpaired cytosine similarly to those observed in the DNA bases pair G-C.
Based on the docking results we suggest that the inhibition process may include as a
first step the RAL recognition by the processed viral DNA. RAL coupled to vDNA shows an
outside orientation of all oxygen atoms, excellent putative chelating agents of Mg2+ cations,
which could facilitate the insertion of RAL into the active site. The conformational flexibility
of RAL further allows the accommodation/adaptation of the inhibitor in a relatively large
binding pocket of IN•vDNA pre-integration complex thus producing various RAL docked
conformation. We speculate that such variety of the RAL conformations contributing
alternatively to the enzyme residue recognition may impact the selection of the clinically
94
observed alternative resistance pathways to the drug (Mouscadet, Delelis, Marcelin, &
Tchertanov, 2010 and references therein).
The other question considered in our work relates to the choice of the more adapted
molecular docking method to study a very flexible inhibitor – RAL in the given case – with
flexible and relatively rigid targets represented here by the HIV-1 IN unbound and bound to
the viral DNA, respectively.
Every protein-ligand docking program consists of two essential components, sampling
and scoring. Sampling refers to the generation of putative ligand binding
orientations/conformations at the proximity of a binding site of a protein and includes two
aspects, ligand sampling and protein flexibility. Scoring predicts the binding tightfistedness
for distinct ligand orientations/conformations (binding poses) with an energy function value
and the binding pose with the lowest energy is considered as the most favorable one (Hu,
Balaz, & Shelver, 2004). The recent methodological advances in protein-ligand docking are
reviewed in (Huang & Zou, 2010). Although the docking problem seems intuitively easy,
searching the space of all possible 3-dimensional protein–ligand conformations and
determining the energetically most favorable solution is a hard computational problem. In
case where both the protein and ligand are kept rigid, (wherein only the translational and
rotational degrees of freedom are considered), the docking problem is six-dimensional
(Thomsen, 2003). However, if flexibility in either the ligand or the receptor or both, is
allowed during the search process, the dimensionality of the problem increases with the
number of “rotatable” bonds. This generates an enormous search space attributed to the
possible conformations of the flexible ligand.
The docking studies reported RAL located within the active site of either unbound IN or
IN•vDNA complex. Distinct poses of RAL representing different RAL configuration and

95
modes of Mg2+ cations chelation were observed (Barreca et al., 2009; Loizidou et al., 2009;
Perryman et al., 2010; Serrao et al., 2009).
Our trials to dock the generated RAL conformations demonstrate that the four used
programs produce different results which in turn depend more on the targets choice than the
exact information on the initial configurational/conformational state of the flexible inhibitor.
Docking of the flexible RAL onto the flexible target (the unbound IN either with a one or two
Mg2+ ion(s) in the active site) with an extended and poor-defined (deleterious) binding pocket
produced contradictory results with all used algorithms. The programs were not capable to
discriminate between the docked conformations using the scoring functions. RAL docking
onto the IN•vDNA model systematically generated the RAL chelated to Mg2+ cations at the
active site by the oxygen atoms of carbonylamino hydroxypyrimidinone moiety. The best
binding energy was systematically obtained with GLIDE and AutoDock and the
pharmacologically relevant poses were identified with GLIDE.
The binding of strand-transfer inhibitors displaces the reactive vDNA end from the active
site, disarming the viral nucleoprotein complex. The early reported data and our results
indicate as “interacting” with the strand-transfer inhibitors a large number of the IN residues
forming the cavity defined as the active site for the strand-transfer reaction (Agapkina et al.,
2006),(Dolan et al., 2009) (Dhaked et al., 2009) (Ni et al., 2012). The identification of IN
residues specifically interacting with RAL by docking algorithms is likely a very difficult task
and the exact modes of binding of this inhibitor remain a matter of debate. Most probably the
flexible nature of RAL results in different conformations and the mode of binding may differ
in terms of the interacting residues of the target, which trigger the alternative resistance
phenomenon.

96
IV. Comparison of Integrase structure from the HIV-1
subtypes B and CRF02_AG and its susceptibility to
Integrase Strand Transfer Inhibitors
1. Structural analysis of Integrase from B and CRF02_AG strains
Comparative structural analysis of IN from two strains and study of the inhibitors binding
were performed considering 6 IN models generated by homology modelling (Figure 22).
Models 1 (B) and 2 (CRF02_AG) (Figure 22 a) represent the unbound homo-dimer of
integrase (IN1-270), which depicts the conformational state of the enzyme just before the 3’-
processing of vDNA (apo state); models 3(B) and 4 (CRF02_AG) (Figure 22 b) represent the
IN dimer in complex with vDNA (holo state), which depicts the active unit of the IN•vDNA
strand transfer intasome; models 5 (B) and 6 (CRF02_AG) (not shown) were derived from
models 3 and 4 by removing vDNA.
Figure 22: Structural models of the HIV-1 INs from B and CRF02 AG strains. (a) Superimposition of models 1 and 2, representing the enzyme before the 3’- processing from B (in blue) and CRF02 AG (in yellow) strains; (b) Superimposition of models 3 and 4, representing the IN·DNA pre-integration
97
complex from B (in blue) and CRF02 AG (in yellow) strains; (c) and (d) Comparison of the catalytic site and loop 140–149 structure in models 1/3 (in blue) and 2/4 (in yellow) respectively. The proteins are shown as cartoons, Mg2+ ions as spheres (in pink). (e and f) superimposition of the structural subunits from models 1 (in blue) and 3 (in yellow) and the structural details of the active site and loop 140–149.( Ni et al. 2012).
Models 1 and 2 were constructed from the crystallographic structures of HIV-1 IN
isolated domains or pairs of domains. Overall, the analysis of the models representing the
HIV-1 IN conformational state before 3'- processing (apo state), did not show any significant
structural change between the two subtypes (Figure 22 a, c).
Models 3 and 4 were constructed from the crystallographic structure of the IN•vDNA
complex of the PFV intasome. Although the sequence identity between HIV-1 and PFV INs is
low (22%), the structure-based alignment of the two proteins demonstrates high conservation
of key secondary structural elements and the three PFV IN domains shared with HIV-1 IN
have essentially the same structure as the isolated HIV-1 domains. Moreover, the structure of
the PFV intasome displays a distance between the reactive 3’ ends of vDNA that corresponds
to the expected distance between the integration sites of HIV-1 IN target DNA (4 base pairs).
Consequently, we are confident that the PFV IN X-ray structure represents a good template
for the HIV-1 IN model generation. To obtain a robust alignment, we adjusted the targets
(HIV-1 INs from B and CRF02_AG subtypes) and template (PFV IN) sequences manually,
considering each structural domain separately, in order to take into account the conservation
of the secondary structure (see Chapter 4. MATERIAL AND METHODS).
Again, models 3 and 4, representing the IN•vDNA intasomes of both strains,
superimposed perfectly and no structural dissimilarity was observed (Figure 22 b d). Most of
the variations are located far from the active sites and the nearest two mutated residues to the
active site, at positions 134 and 136, are exposed to the solvent and apparently did not affect
significantly the structure. Similarly for 3’-processing, strand transfer activities of B and
98
CRF02_AG recombinant proteins were assayed and compared. In agreement with the
modeling results, activities of both INs were comparable.
It is worth noting large structural and conformational changes observed between the
apo (models 1 and 2) and holo (3 and 4) states regarding the relative positions of the IN
domains (RMSD, root mean square deviation, of 31 Å, based on Cα) (Figure 22 e). These
structural modifications result in different contacts between IN domains, N-terminal domain
(NTD), catalytic core domain (CCD) and C-terminal domain (CDD). As such, in models 1
and 2 (apo state) no interaction was detected between CTD, and, CCD, whereas the two
domains interact tightly in models 3 and 4 (holo state). The NTD-CCD interface also exhibits
substantial changes: in the apo form the NTD-CCD interface belongs to the same monomer
subunit whereas in the holo form the interface is from two different subunits. Moreover, IN
undergoes important structural transformation leading to structural re-organization of the
catalytic site loop upon vDNA binding ; the coiled portion of the loop reduces from 10
residues (140 -149 aas) in the apo form to 5 residues (140-144 aas) in the holo form (Figure
22 f). This partial folding of the catalytic loop is probably stabilized through intra-IN domain-
domain interactions and interactions with vDNA which contribute in the helix α4 elongation.
2. The INSTIs recognition by Integrase from B and CRF02_AG
strains
Although B and CRF02_AG INs are structurally similar, residue variations may impact
the interaction and subsequent activity of the inhibitors. To address this hypothesis, the three
inhibitors RAL, ELV and L731,988 (Chart 3) were docked onto INs by using two different
docking algorithms, Glide and Autodock. RAL and ELV coordinates were taken from the
crystallographic structures of PFV intasome co-complexes (Hare et al., 2010a), L731,988 was
built from scratch (see Chapter 4. MATERIALS AND METHODS). The three compounds
were considered in their deprotonated form, as it has been clearly established that diketo acids
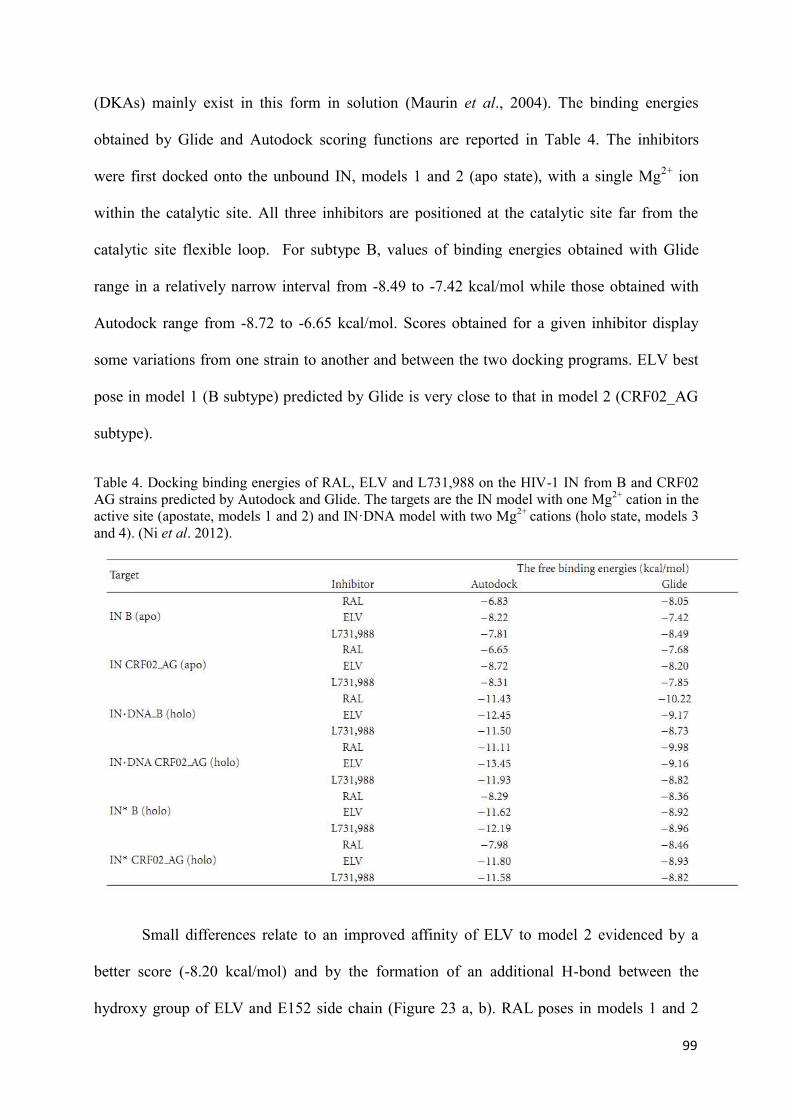
99
(DKAs) mainly exist in this form in solution (Maurin et al., 2004). The binding energies
obtained by Glide and Autodock scoring functions are reported in Table 4. The inhibitors
were first docked onto the unbound IN, models 1 and 2 (apo state), with a single Mg2+ ion
within the catalytic site. All three inhibitors are positioned at the catalytic site far from the
catalytic site flexible loop. For subtype B, values of binding energies obtained with Glide
range in a relatively narrow interval from -8.49 to -7.42 kcal/mol while those obtained with
Autodock range from -8.72 to -6.65 kcal/mol. Scores obtained for a given inhibitor display
some variations from one strain to another and between the two docking programs. ELV best
pose in model 1 (B subtype) predicted by Glide is very close to that in model 2 (CRF02_AG
subtype).
Table 4. Docking binding energies of RAL, ELV and L731,988 on the HIV-1 IN from B and CRF02 AG strains predicted by Autodock and Glide. The targets are the IN model with one Mg2+ cation in the active site (apostate, models 1 and 2) and IN·DNA model with two Mg2+ cations (holo state, models 3 and 4). (Ni et al. 2012).
Small differences relate to an improved affinity of ELV to model 2 evidenced by a
better score (-8.20 kcal/mol) and by the formation of an additional H-bond between the
hydroxy group of ELV and E152 side chain (Figure 23 a, b). RAL poses in models 1 and 2
100
differ strongly. In both cases RAL coordinates similarly the Mg2+ cations by its ketoenolate
functionality, but the inhibitor adopts opposite positions, more specifically in model 1 its
flurobenzyl ring is oriented towards Y143, while in 2 towards Q148. L731,988 poses are also
different in models 1 and 2, characterized by distinct pyrrole ring positions, close to E152 in 1
and to Y143 in 2. Such presence of alternative poses is likely due to a large pocket formed by
the accessible active site and the open conformation of the folded loop which allow a large
number of conformations and orientations with equivalent binding affinity for the flexible
RAL and L731,988 molecules. Consequently no significant difference can be assessed
between the binding of the three studied inhibitors to the unbound IN from strains B and
CRF02_AG.
Further the inhibitors were docked onto models 3 and 4 representing pre-integration
complexes, IN•2Mg2+•DNA, from B and CRF02_AG subtypes respectively. Docking resulted
in a binding for the three inhibitors with significantly higher scores than those found for the
apo IN. Glide scores ranked in a range from -10.22 to -8.73 kcal/mol, while Autodock scores
range from -13.45 to -11.11 kcal/mol. Comparison of the poses produced by the two docking
software were found similar, and consequently we focus here on the analysis of Glide results.
The three compounds are positioned in the catalytic site and chelate the Mg2+ cations
in agreement with the mechanism of action of these molecules, which are strand transfer
inhibitors (Mouscadet et al., 2010). RAL binding mode is characterized by higher scores in
both models 3 (B subtype) and 4 (CRF02_AG subtype) respectively to the other two
inhibitors. RAL predicted poses are identical in models 3 and 4.
It binds bidentantly both metal cofactors of the active site acting as a 1-5 and 1-4 type
ligand, with the enolic oxygen atom as an oxo-bridge between two Mg2+ cations.
Additional stabilization of inhibitor RAL is achieved by stabilization of inhibitor Mg a
1-5 and similarly to RAL, ELV coordinates the Mg2+ cofactors bidentantly through the 1-5

101
type β-ketoenolate moiety and 1-3 geminal carboxylic oxygen atoms, with a carboxylic
oxygen atom as an oxo-bridge at the bicationic cluster. A few differences of ELV binding in
model 3 and 4 refer to slightly different conformation of the chloroflurobenzyl moiety.
Figure 23. RAL (green), ELV (magenta), and L731,988 (cyan) best poses predicted by Glide. The inhibitors were docked into the active site of unbound IN (top) and IN·DNA complex (middle) and IN in holo conformation without DNA (bottom) from of the B (in blue) and CRF02 AG (in yellow). Proteins and DNA are shown as cartoons, inhibitors as sticks, and Mg2+ cations as balls. (Ni et al. 2012).

102
. L731,988 molecule shows different binding poses in models 3 and 4. In model 3 (B
subtype) L731,988 coordinates bidentately one Mg2+ cation by the oxygen atoms from keto
functionality of ketoenolate and carboxylate groups, acting as a ligand of 1-6 type. The second
Mg2+ cation is coordinated only by the carboxylate oxygen atom. In model 4 (CRF02_AG)
L731,988 inhibitor shows exclusively one coordination to the one Mg2+ cation.
3. Discussion
The predicted binding poses of RAL correlate well with those observed in the X-ray
structure of the PFV intasome complex (Hare et al., 2010a; Hare et al., 2010b). Undoubtedly,
the presence of the second catalytic Mg2+ cation, the partial loop folding and the DNA
substrate bearing are presumably the driving determinants for the tight binding of ST
inhibitors in the catalytic site. It was perfectly evidenced by Cherepanov that a series of
INSTIs fixed similarly to the PFV intasome (Hare et al., 2010a). Apparently the
crystallographic data or static models derived from these data are not suitable means to
explain the specificity of inhibitor recognition by a target. Consequently, considering the
similar scoring values for a given inhibitor and closed poses no significant dissimilarity can be
assessed between the binding of studied inhibitors to the IN•2Mg2+•DNA complex from
strains B and CRF02_AG.
To validate the in silico predictions regarding the susceptibility of subtypes B and
CRF02_AG INs, the efficiency of INSTIs (RAL, ELV and L731, 988) on recombinant INs
proteins were determined by in vitro strand transfer assay in the presence of increasing
concentration of INSTI (see MATERIALS AND METHODS). As to all the three studied
INSTIs, no significant difference in IC50 values against recombinant HIV-1 INs from B and
CRF02_AG strains was observed (Ni et al. 2012). IC50 of RAL, ELV and L731,988 against
HIV-1 INs from B and CRF02_AG strains are 41.8, 93.4, 855 nM and 13.7-25.9, 48.9-
103
66.8,193-291 nM, respectively (Ni et al., 2012). The experimental ranking of the three
compounds was predicted correctly by Glide scoring function.
The docking calculations evidenced that (i) the IN•DNA complex represents the best
target for the studied inhibitors and (ii) the co-complexed vDNA partially shapes the
inhibitors binding site. To further explore the role of vDNA, substrate was removed from the
IN•vDNA complex and inhibitors were docked again on unbound IN with a fold
corresponding to the holo state, models 5 and 6. The binding energies of RAL are depreciated
upon vDNA removal in B and CR02_AG subtypes while ELV and L731,988 binding scores
are less affected.
Docking scores are nearly similar between the two strains while poses display some
variations, as already observed on the apo form. Surprisingly, the Autodock results show the
lower score for RAL binding to both models 5 and 6, while the binding of the two other
inhibitors are characterized by better scores, closer to those obtained with models 3 and 4. In
contrast the scores produced by Glide are identical between the inhibitors and the subtypes.
Chelation of the Mg2+ ions by the inhibitors is still maintained but the interaction patterns
differ from those predicted in models 3 and 4. Indeed, in model 5 (B subtype) RAL chelates
the first Mg2+ cation through the nitrogen atom of the oxadiazol ring and the oxygen atom of
the carboxamide moiety; the second Mg2+ is coordinated by 1-4 oxygen atoms of
pyrimidinone fragment. In model 6 RAL mode of coordination resembles that observed in
model 4, however stabilizing π-stacking interactions were vanished. Again, the large volume
of the binding pocket and the lack of stabilizing protein-ligand and DNA-ligand interactions
can explain such variety. Consequently, unbound IN in the holo conformation, as unbound IN
in the apo conformation, does not appear as a suitable target for the inhibitors RAL and ELV.
L731,988 appears as a weaker binder, as confirmed by the experimental IC50 values.

104
Molecular modeling approaches were used to investigate the effect of the natural
variations showed by CRF02_AG strain on the in vitro activities of the enzyme and its
susceptibility to INSTIs as compared to the ones of the consensus B integrase. We found that
the structural models of unbound and viral DNA-bound integrase showed very similar folding
and tertiary structure for the two studied strains. The structural models of the IN•vDNA
complex, superimposed perfectly. This similarity was confirmed by comparable strand
transfer activity for IN variants in 14, 112, 125, 134, 136, 206 and 283 positions.
Consequently, the naturally occurring variations in the HIV-1 IN subtype CRF02_AG ‒
K14R, V31I, L101I, T112V, T124A, T125A, G134N, I135V, K136T, V201I, T206S, V234I
and S283G, which were suggested to modify IN structure do not affect significantly in vitro
DNA binding activity, either 3’-processing or strand transfer reaction. Furthermore, docking
results revealed that the modes of binding and docking conformations of three studied
inhibitors are comparable for B and CRF02_AG strains and these INSTIs possessed similar
IN inhibitory activity against B and CRF02_AG HIV-1 strains. Altogether these results
demonstrate the absence of difference in susceptibility and confirm previously reported
observations for subtype B and C HIV-1 IN (Bar-Magen et al., 2009). Thus, in contrast to the
lower baseline susceptibilities of recombinant A/G subtype virus to protease inhibitors (PIs)
and reduced susceptibility of some A/G isolates to abacavir, INSTIs potentially provide an
excellent therapeutic option for the treatment of HIV-1 subtype CRF02_AG infected patients
(Martinez-Cajas et al., 2008).
In the targets all three molecules are positioned similarly with ketoenol moiety in an
orientation encouraging coordination of the two metal cofactors in the active site.
Furthermore, independently of the method, the three INSTIs displayed a more favorable
binding onto the IN•vDNA complex than on the unbound enzyme, in good agreement with
their mechanism of action (Kawasuji et al., 2006). Same difference in theoretically predicted

105
modes of RAL binding was reported early by Loizidou (Loizidou et al., 2009). The observed
conformational and structural transformation of IN upon DNA binding led to an important
change in the folding and conformation of the catalytic site loop which in turn favours a
formation of the binding pocket accommodating the INSTIs. The binding modes of ELV and
L731,988 were practically not altered by the removal of the viral DNA. Conversely removing
vDNA had a significant effect on the docking results RAL, thereby highlighting the role of
vDNA for RAL recognition most likely due to the halogenated benzyl moiety that displaces
the unpaired 5’adenine and stacking with the Cyt16 through π-π interactions. Although such
interaction is thought to be involved in all the IN strand transfer inhibitors examined (Hare et
al., 2010), our results suggest that ELV and L731,988 binding determinants differed in part
from the ones of RAL.
It should be noted that slight differences were observed between the results obtained with
Glide and Autodock scores, which can be ascribed to the impact of electrostatic interactions in
the studied molecular systems. Indeed Glide uses higher negative charge localized on the two
oxygen atoms of the hydroxypyrimidinone of RAL than Autodock (-1.22 and -0.5 e versus -
0.183 and -0.265 e). Also, within Autodock scoring function, the carboxylate charges used
for ELV (2 x -0.64 e) and L731, 988 (2 x -0.62 e) are more than two oxygen atoms attached to
the pyrimidine cycle of RAL. To verify this hypothesis, we repeated the docking calculations
of ELV and L731,988 using the charges of two oxygen atoms attached to the pyrimidine ring
of RAL instead of those assigned by Gasteiger charges. The new binding energies of both
inhibitors increased from -12.45 and -11.50 to -7.95 and -7.80 kcal/mol for ELV and
L731,988 respectively. Since these atomic charges contribute highly in the binding energy as
the atoms coordinate Mg2+ ions, they are likely responsible for the discrepancies found
between the theoretical binding energies and the experimental IC50 values. The experimental
ranking of the three inhibitors based on IC50 is, RAL > ELV > L731,988, as predicted by
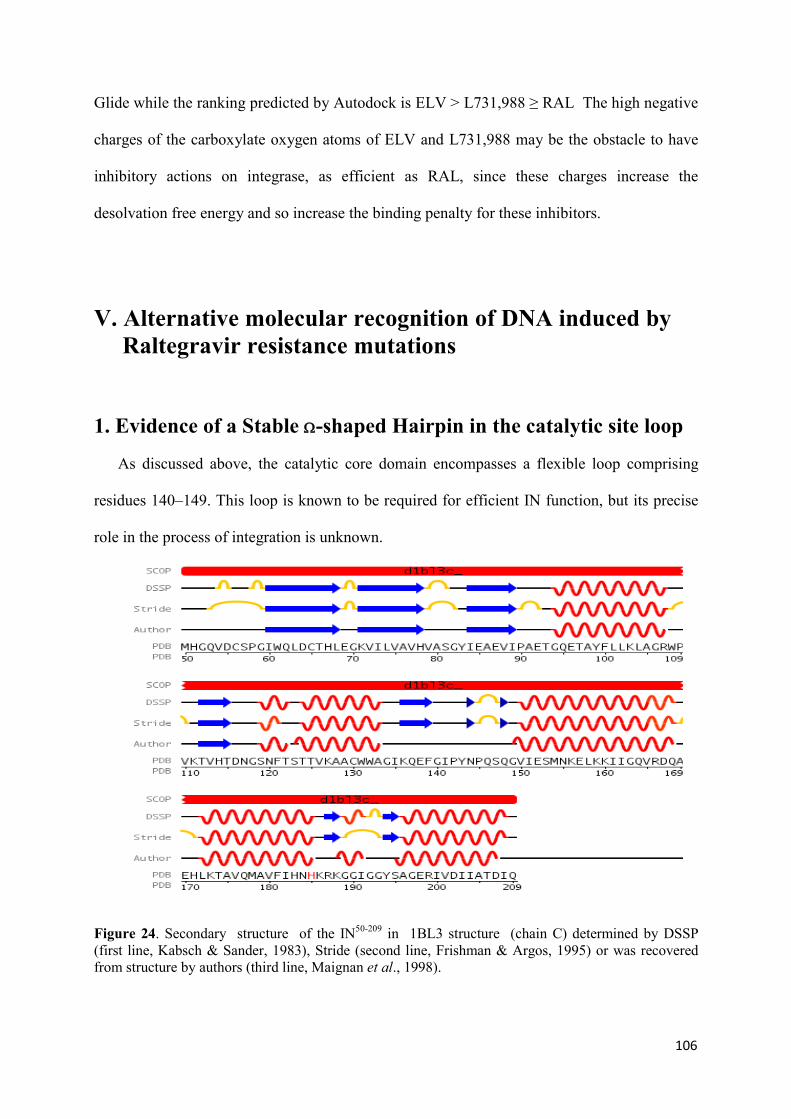
106
Glide while the ranking predicted by Autodock is ELV > L731,988 ≥ RAL The high negative
charges of the carboxylate oxygen atoms of ELV and L731,988 may be the obstacle to have
inhibitory actions on integrase, as efficient as RAL, since these charges increase the
desolvation free energy and so increase the binding penalty for these inhibitors.
V. Alternative molecular recognition of DNA induced by
Raltegravir resistance mutations
1. Evidence of a Stable W-shaped Hairpin in the catalytic site loop
As discussed above, the catalytic core domain encompasses a flexible loop comprising
residues 140–149. This loop is known to be required for efficient IN function, but its precise
role in the process of integration is unknown.
Figure 24. Secondary structure of the IN50-209 in 1BL3 structure (chain C) determined by DSSP (first line, Kabsch & Sander, 1983), Stride (second line, Frishman & Argos, 1995) or was recovered from structure by authors (third line, Maignan et al., 1998).
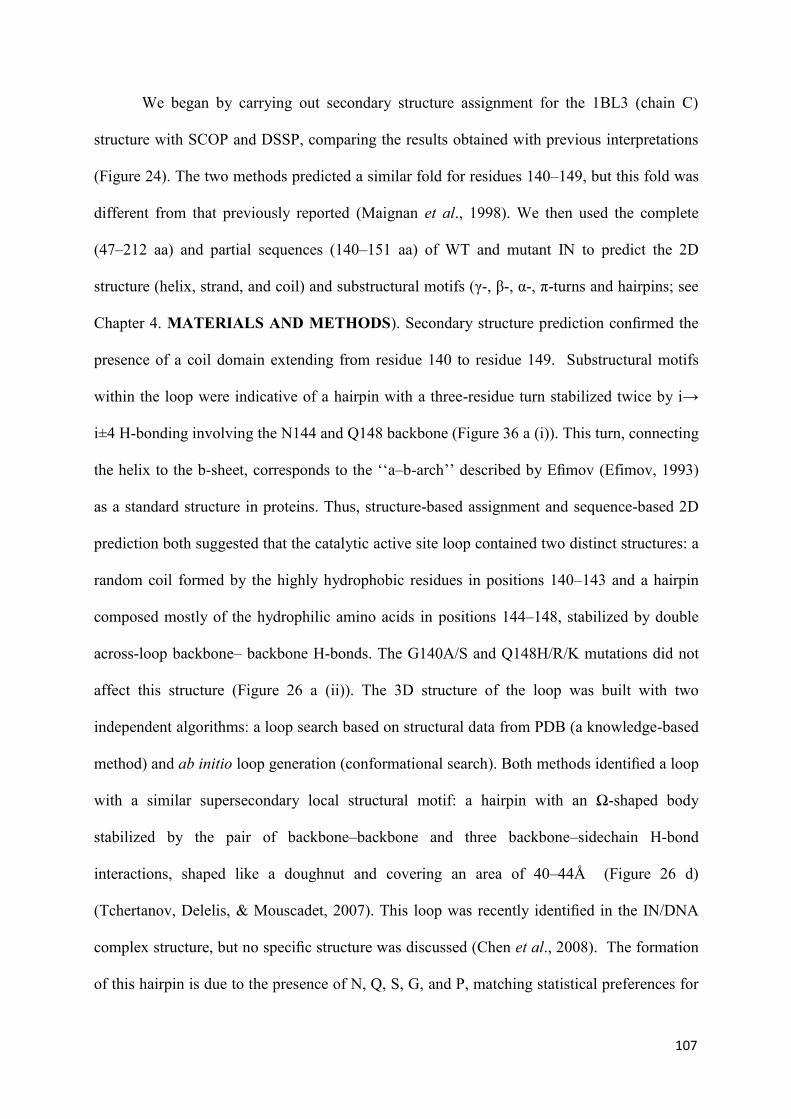
107
We began by carrying out secondary structure assignment for the 1BL3 (chain C)
structure with SCOP and DSSP, comparing the results obtained with previous interpretations
(Figure 24). The two methods predicted a similar fold for residues 140–149, but this fold was
different from that previously reported (Maignan et al., 1998). We then used the complete
(47–212 aa) and partial sequences (140–151 aa) of WT and mutant IN to predict the 2D
structure (helix, strand, and coil) and substructural motifs (γ-, β-, α-, π-turns and hairpins; see
Chapter 4. MATERIALS AND METHODS). Secondary structure prediction confirmed the
presence of a coil domain extending from residue 140 to residue 149. Substructural motifs
within the loop were indicative of a hairpin with a three-residue turn stabilized twice by i→
i±4 H-bonding involving the N144 and Q148 backbone (Figure 36 a (i)). This turn, connecting
the helix to the b-sheet, corresponds to the ‘‘a–b-arch’’ described by Efimov (Efimov, 1993)
as a standard structure in proteins. Thus, structure-based assignment and sequence-based 2D
prediction both suggested that the catalytic active site loop contained two distinct structures: a
random coil formed by the highly hydrophobic residues in positions 140–143 and a hairpin
composed mostly of the hydrophilic amino acids in positions 144–148, stabilized by double
across-loop backbone– backbone H-bonds. The G140A/S and Q148H/R/K mutations did not
affect this structure (Figure 26 a (ii)). The 3D structure of the loop was built with two
independent algorithms: a loop search based on structural data from PDB (a knowledge-based
method) and ab initio loop generation (conformational search). Both methods identified a loop
with a similar supersecondary local structural motif: a hairpin with an Ω-shaped body
stabilized by the pair of backbone–backbone and three backbone–sidechain H-bond
interactions, shaped like a doughnut and covering an area of 40–44Å (Figure 26 d)
(Tchertanov, Delelis, & Mouscadet, 2007). This loop was recently identified in the IN/DNA
complex structure, but no specific structure was discussed (Chen et al., 2008). The formation
of this hairpin is due to the presence of N, Q, S, G, and P, matching statistical preferences for

108
amino acid type within particular turns (Levitt & Warshel, 1975; Hutchinson & Thornton,
1994). G and P are characteristic of reverse turns, as they confer conformational flexibility and
cannot form hydrogen bonds. The importance of loops has been confirmed experimentally.
Many enzymes use flexible loops that change conformation upon substrate binding to form a
catalytically competent active site. Indeed, 57% of catalytic residues are located in or close to
such loops (P. Aloy, personal communication). Ω–loops constitute a relatively new category
of secondary structures (Leszczynski & Rose, 1986; Fetrow, 1995; Street et al., 2007) and
appear to be important for substrate or inhibitor binding and/or protein–protein recognition
(Strobel & Ryder, 2001).
2. Modeling of the catalytic site structure of the HIV-1 integrase
According to X-ray structure data, Mg, coordinated by D64 and D116, does not affect the
conformation of the catalytic loop (Maignan et al., 1998). A second Mg2+ ion would be likely
to enter the site upon movement of the E152 side chain toward the active site. However, this
does not appear to alter the conformation of the loop (Savarino, 2007). Conversely, MD
simulations demonstrated a significant conformational change involving the catalytic loop and
E152 of the DDE motif in the presence of the second cation (Lins et al., 2000). This
conformational change occurred earlier in the simulation, when hydrogen phosphate was
included to mimic DNA, suggesting that the binding of the second cation and the resulting
conformational change occurred upon DNA binding. We investigated the effect of the metal
cofactor further, by constructing models of the core domain with no cation (0LJ), one (1LJ) or
two Mg2+ cations (2LJ–5LJ), starting from the 1BI4 and 1BL3 templates, as described in the
Methods section (Figure 25). In the 2LJ and 3LJ models, the binuclear Mg2+ cluster was
symmetric, with each Mg2+ ion coordinated by the D116 and E152 residues in either a
monodentate (2LJ) or a bidentate (3LJ) mode. In the 4LJ and 5LJ models, the binuclear Mg2+

109
cluster was asymmetric, with each Mg2+ cation coordinated by D116 and E152 in either a
mono- or bidentate mode. All the 3D models had similar topologies (Figure 26 b). The first
two models, 0LJ and 1LJ, did not differ from their templates: Mg2+ was coordinated by D64
and D116 and the other positions were occupied by water molecules, constituting pseudo-
octahedral Mg coordination. The other models had a binuclear Mg2+ core with two non-
identical bridges, the D64, and the µ-aqua bridge, with the water molecule bridging the gap
between the two coordination centers. These binuclear models differed in the mode of
chelation of D116 and E152. Based on the total energy values of the complexes modeled, the
3LJ and 5LJ models were excluded from further analysis due to their low probability.
Figure 25. Constructed models of the core domain of IN with no cation (0LJ), one (1LJ), or two Mg2+ cations (2LJ–5LJ). In 2LJ and 3LJ, the binuclear Mg2+ cluster was symmetric, with each Mg2+ coordinated with D116 and E152 in either the monodentate (2LJ) or the bidendate (3LJ) mode. In 4LJ and 5LJ, the binuclear Mg2+ cluster was asymmetric; each Mg2+ cation was coordinated with D116 and E152 in either mono- or bidentate mode. (Mouscadet et al. 2009).
D64 and water stabilize the binuclear complex, with a Mg…Mg distance of 4.2 A for
both the 2LJ and 4LJ models. This distance is slightly smaller than the equivalent distance in
the 1SA model (4.5 A) (Savarino, 2007) and greater than that in the 1WKN model (3.9 A) (De
Luca et al., 2005). All side chains of the catalytic amino acids involved in coordination are in
a cis-position relative to the Mg…Mg axis, with E152 arranged in the equatorial and D116 in
the axial position (Figure 26 c). In two-cation models, the D64 carboxylate group was rotated
by about 308 relative to the Mg…O… Mg plane, corresponding to the D64 configuration in
the cation-free and one-cation models. Thus, the conformation of bridged D64 was not
110
affected by the second Mg2+. By contrast, the binding of the second Mg2+ ion required a major
change in the conformation of the E152 side chains: the Chi1, Chi2, and Chi3 angles were -
167, 169, and -38 in 1LJ and -174, 58, and 56 in 2LJ models. The binding of the second
cation also required a slight alteration to both the D116 side chain and the first Mg2+ ion
relative to its position in the one-cation model. Two modes of Mg coordination by E152 were
possible (monodentate for 2LJ and mixed for 4LJ), but the type of coordination had no
significant effect on the two-cation model. Finally, the Mg2+…O distances corresponded to
typical coordination bonds in Mg-containing complexes. Based on the covalent and ionic radii
of the Mg and O atoms, the chelation of Mg2+ was essentially ionic.
The N155 residue, in the α4 helix, is a primary site of mutation leading to RAL
resistance. The position and orientation of N155 relative to D64 favors -(NH2)N155…O=D64 H-
bonding (Appendix of the paper, Figure 1). In cation-free and one-cation models, this H-bond
was bifurcated and involved both H atoms of the 155 NH2 group, which was also H-bonded to
a carbonyl oxygen atom of the D64 backbone. Only the N-HN155…O=E152 backbone–backbone
interaction was involved in stabilizing the a4 helix, the distances between the N155 and E152
side chains being greater than for van der Waals (VdW) contacts. In the two-cation model, the
E152 residue complexed with Mg2+ is oriented in a position favoring H-bonding with N155.
Consequently unlike the H-bonding involving two partners in cation-free and one-cation
models—a three-partner H-bond is formed in the two-cation model, with (NH2)N155 as a donor
and two oxygen atoms of the carboxylate groups of D64 and E152 as the acceptors. Thus, in
all models, the active site was stabilized by both metal coordination and H-bonding involving
catalytic residues. We tried to identify the most probable configuration of D64, E152, and
N155 side chains in wild-type IN, by carrying out a statistical analysis of the relative
configuration of D, E, and N residues on the basis of reported X-ray structures. We found that
the orientation of D64, E152, and N155 in the two-cation models corresponded to the more

111
populated N–D and N–E distributions, whereas the N–E orientation in cation-free and one-
cation models was less probable. These statistical observations are thus consistent with our
two-cation model (2LJ) for the structure of the IN active site, supporting the validity of our
model. Our models demonstrate that Mg2+ cations do not alter the structure of the catalytic
core domain. The catalytic loop retained its structure, with the distinctive H-bond pattern of
the Ω-shaped hairpin observed for all models generated (Figure 26 d).
Figure 26. Structure of the HIV-1 IN core domain: (a) 2D prediction of the wild-type (i) and mutated (ii) loop of IN comprising residues 140–149. The first line represents the amino acid sequence; the second line represents the beta sheet stabilized by H-bonding and the third line indicates the turn state per residue. (b) Superimposition of the 0LJ, 1LJ, 2LJ and 4LJ (the wild-type IN) 3D models generated. Ribbon diagram, with the backbone and catalytic amino acid side chains shown as sticks; Mg2+ ions are not shown. (c) Active site: side chains of catalytic amino acids and Mg2+ cations shown as sticks and balls, respectively; coordination distances shown as dashed lines. Colors: gray (0LJ), orange (1LJ), yellow (2LJ) and green (4LJ). (d) Top: Catalytic loop structure; residues are shown as sticks, H-bonds as dashed lines. Colors: gray (0LJ), orange (1LJ), yellow (2LJ) and green (4LJ). Bottom: H-bonding patterns of the HIV-1 IN 131–149 domain observed in 3-D models. The residues 140–149 are shown in blue. H-bonds between the residues are shown by dashed lines. (Mouscadet et al. 2009).

112
3. Effect of raltegravir-selected mutations on Catalytic Core
Domain structure
We then investigated the effect of the mutations selected by RAL and belonging to the
independent N155 and Q148 pathways identified in previous studies (Charpentier et al., 2008;
Cooper et al., 2008; Malet et al., 2008). The Q148 pathway is characterized by the presence of
G140S or E138K secondary mutations. We first investigated the effect on structure of the
N155H mutation affecting a residue in the catalytic site. We chose to study the N155H
substitution because the imidazole side chain of histidine, if uncharged, may exist in either the
Nd1–H or the Ne2
–H tautomeric form (at pH 7, the Nε2–H predominates). We generated
mutated models for both H-donor orientations, with the protonated N pointing either towards
the catalytic site or in the opposite direction. The two tautomeric forms of histidine in both
orientations led to local reorganization of the structure of the active site (Figure 27 a-c).
Conformations differed most between models with the same tautomers oriented differently,
stabilized by different patterns of H-bonding. In one-cation models, the Nε2–H tautomer with
the H-atom pointing toward the active site was stabilized by N-HH155...O=D64, with O=
corresponding to the oxygen atom of the carboxylate group, as observed in the wild-type
structure. However, for stabilization of the active site with the Ne2–H tautomer in the opposite
orientation, O= was the backbone atom. The conformation of Nd1–H was not influenced by H-
bonding in the one-cation model, whereas, in the two-cation model, this tautomer with N–H
pointing towards the active site was stabilized by H-bonding with the E152 side chain (Figure
27 b and c).We conclude that the active site structure may be conserved in the N155H mutant
at physiological pH and, in this case, the Nε2–H tautomer of histidine acts as a conformational
bioisoster of asparagine. We then studied six representative combinations of mutations
including primary and secondary mutations of the Q148 resistance pathway. Three-
dimensional models were generated from the ILJ and 2LJ templates. The E138K, G140S/A

113
and Q148H/K/R mutations only slightly modified the side-chain conformation, and the
catalytic loop backbone retained its structure (Figure 27 d).
The H-bond patterns stabilizing the Ω-shaped hairpin in the mutants were similar to
that in the wild-type IN. This finding is consistent with our sub-structural motif predictions.
Figure 27. Superimposition of the wild-type and mutated models of the HIV-1 IN in (a) cation-free, (b) one- and (c) two-cation active sites. Molecular display style: enzyme structures shown by ribbons, residues D64, D116, E152 and H155 shown as ball-and-stick representations; the Mg2+ cation in (b) and in (c) shown as a ball. The wild-type N155 residue is shown as a wire frame. The mutant H155 is shown as a ball-and-stick representation in the following colors: the Nδ1–H tautomer oriented toward the catalytic site is shown in cyan and that in the opposite direction is shown in sand brown; the Ne2–H tautomer oriented toward the catalytic site is shown in light blue and that oriented in the opposite direction is shown in yellow. The H-bonds are indicated as dashed lines. (d) Ribbon diagram of the catalytic loop comprising residues 140–149 in the wild-type and mutated models, with residues 140 and 148 presented as ball-and-stick representations. (Mouscadet et al. 2009).
Consequently, our results suggest that the two primary pathways implicated in RAL
resistance—the N155H substitution or replacement of the Q148 residue by H, R, or K—result
in the retention of all the structural features of the catalytic domain of IN, unlike deleterious
G140A/G149A mutations, which are thought to cause structural changes (Greenwald et al.,
114
1999). These findings highlight the importance of maintaining the integrity of the catalytic
domain structure, consistent with the observation that the virus selects mutations resulting in
the maintenance of catalytic activity (Delelis et al., 2009). They also suggest that the Ω -
shaped hairpin may have a crucial function.
4. Model of the displacement of the Ω-shaped hairpin toward the
catalytic site
The stabilization of the Ω -shaped hairpin by the formation of multiple H-bonds
suggests that the previously reported flexibility of the 140–149 loop may be limited. We
investigated the behavior of the Ω-shaped hairpin through simulations of loop motion in one-
(1LJ) and two-cation (2LJ) models. The distance between two centroids—the first of which
(C1) describes the center of gravity of the Ω -shaped hairpin and the second (C2), the center
of gravity of the active site—gradually decreased, in 2Å steps, from 16 (open form) to 4.5Å
A(closed form). Energy minimization was carried out after every step. The conformation of
the backbone of the catalytic core domain did not change significantly during this process, but
regular movements of the Ω -hairpin loop towards the catalytic site were observed (Figure 28
a). The total energy of all intermediate structures was similar for distances between 16 and
8Å, for both models. Structural fitness, as estimated by the violation values, satisfied
constraints for 10<C1…C2<16Å, but showed a weak violation of constraints for 4.5<C1…
C2< 8Å in the one-cation model (Figure 28 b). In the two-cation model, the movement of the
hairpin satisfied violation criteria for 8<C1…C2<16Å, but further decreases in C1…C2
distance down to 6 or 4.5Å led to strong violation. However, G140A/S mutants displayed
lower levels of hairpin mobility than the wild type. The G140S mutant, in particular, had total
energy and violation values 10–30% higher than those for the wild type. We have shown that
the hairpin can move, as a rigid body, in a gate-like manner toward the active site. Both
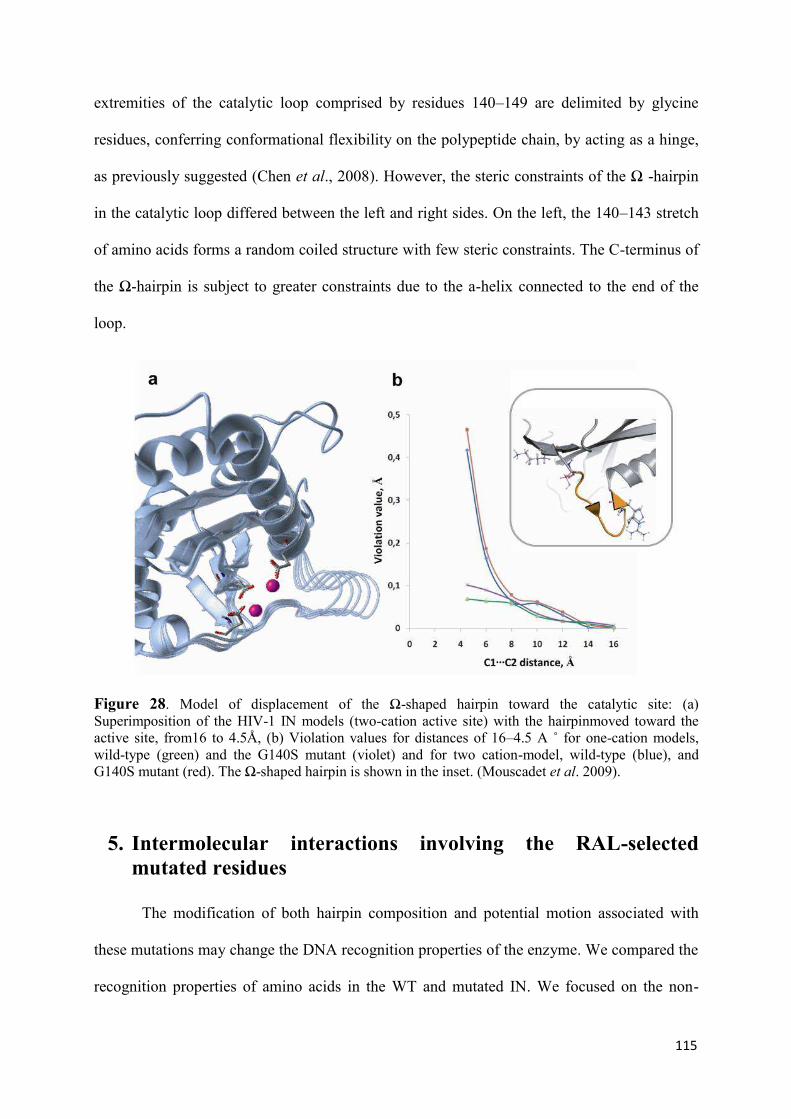
115
extremities of the catalytic loop comprised by residues 140–149 are delimited by glycine
residues, conferring conformational flexibility on the polypeptide chain, by acting as a hinge,
as previously suggested (Chen et al., 2008). However, the steric constraints of the Ω -hairpin
in the catalytic loop differed between the left and right sides. On the left, the 140–143 stretch
of amino acids forms a random coiled structure with few steric constraints. The C-terminus of
the Ω-hairpin is subject to greater constraints due to the a-helix connected to the end of the
loop.
Figure 28. Model of displacement of the Ω-shaped hairpin toward the catalytic site: (a) Superimposition of the HIV-1 IN models (two-cation active site) with the hairpinmoved toward the active site, from16 to 4.5Å, (b) Violation values for distances of 16–4.5 A ˚ for one-cation models, wild-type (green) and the G140S mutant (violet) and for two cation-model, wild-type (blue), and G140S mutant (red). The Ω-shaped hairpin is shown in the inset. (Mouscadet et al. 2009).
5. Intermolecular interactions involving the RAL-selected
mutated residues
The modification of both hairpin composition and potential motion associated with
these mutations may change the DNA recognition properties of the enzyme. We compared the
recognition properties of amino acids in the WT and mutated IN. We focused on the non-

116
covalent interactions underlying the recognition properties of the residues at positions 155 and
148, corresponding to the primary mutations selected by RAL. Based on the known structures
of protein/DNA complexes, we assessed the statistical probability of these residues
recognizing DNA bases (see Chapter 4. MATERIAL AND METHODS). We found that
asparagines (N) and glutamine (Q) residues preferentially recognized adenine, as H-bonds
formed with this base represented a significant non-random cluster, whereas the H-bonds
formed with cytosine, guanine, and thymine followed a random distribution. The replacement
of the N residue in position 155 by an H residue led to the loss of H-bonding with adenine
(A), thymine (T), and cytosine (C) (Figure 29).
Figure 29. Statistical probability of residues 140–155 recognizing DNA bases based on the known structures of protein/DNA complexes. The H-bond (blue color) and van der Waals (red color) contacts were compiled based on the protein-DNA complexes. Interactions involving residues 148 and 155 are framed by dashed lines, in green and magenta, respectively. (Mouscadet et al. 2009)
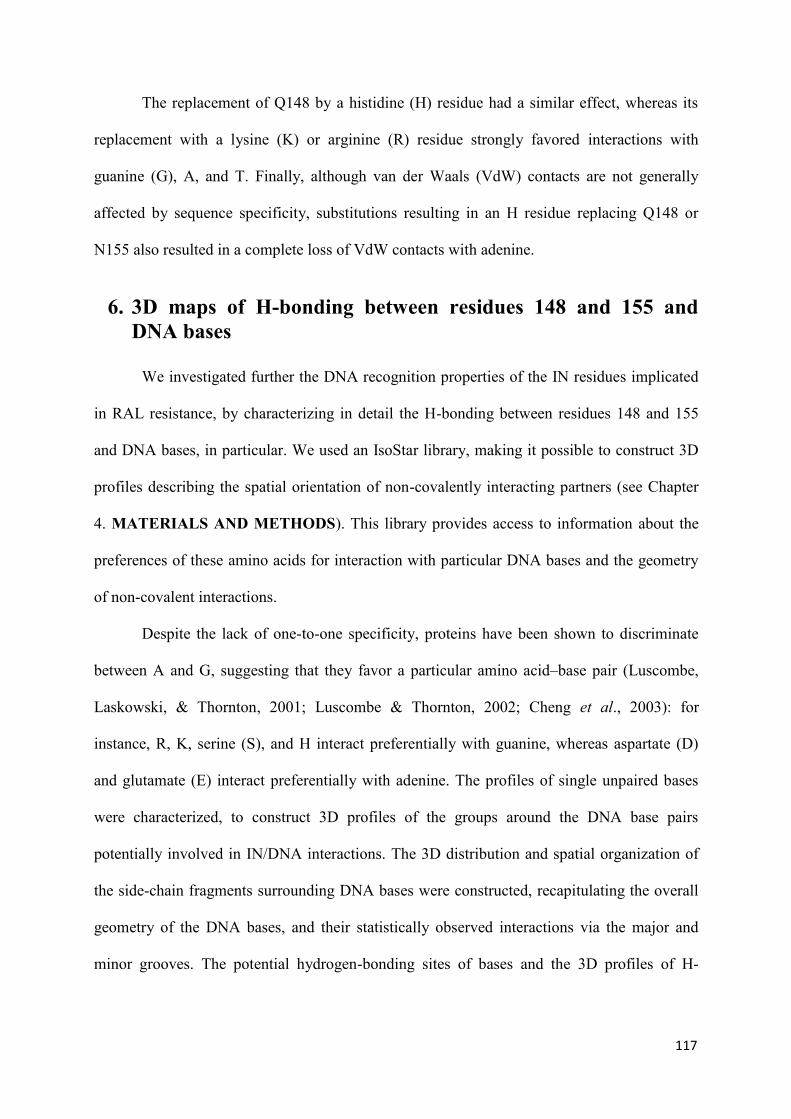
117
The replacement of Q148 by a histidine (H) residue had a similar effect, whereas its
replacement with a lysine (K) or arginine (R) residue strongly favored interactions with
guanine (G), A, and T. Finally, although van der Waals (VdW) contacts are not generally
affected by sequence specificity, substitutions resulting in an H residue replacing Q148 or
N155 also resulted in a complete loss of VdW contacts with adenine.
6. 3D maps of H-bonding between residues 148 and 155 and
DNA bases
We investigated further the DNA recognition properties of the IN residues implicated
in RAL resistance, by characterizing in detail the H-bonding between residues 148 and 155
and DNA bases, in particular. We used an IsoStar library, making it possible to construct 3D
profiles describing the spatial orientation of non-covalently interacting partners (see Chapter
4. MATERIALS AND METHODS). This library provides access to information about the
preferences of these amino acids for interaction with particular DNA bases and the geometry
of non-covalent interactions.
Despite the lack of one-to-one specificity, proteins have been shown to discriminate
between A and G, suggesting that they favor a particular amino acid–base pair (Luscombe,
Laskowski, & Thornton, 2001; Luscombe & Thornton, 2002; Cheng et al., 2003): for
instance, R, K, serine (S), and H interact preferentially with guanine, whereas aspartate (D)
and glutamate (E) interact preferentially with adenine. The profiles of single unpaired bases
were characterized, to construct 3D profiles of the groups around the DNA base pairs
potentially involved in IN/DNA interactions. The 3D distribution and spatial organization of
the side-chain fragments surrounding DNA bases were constructed, recapitulating the overall
geometry of the DNA bases, and their statistically observed interactions via the major and
minor grooves. The potential hydrogen-bonding sites of bases and the 3D profiles of H-
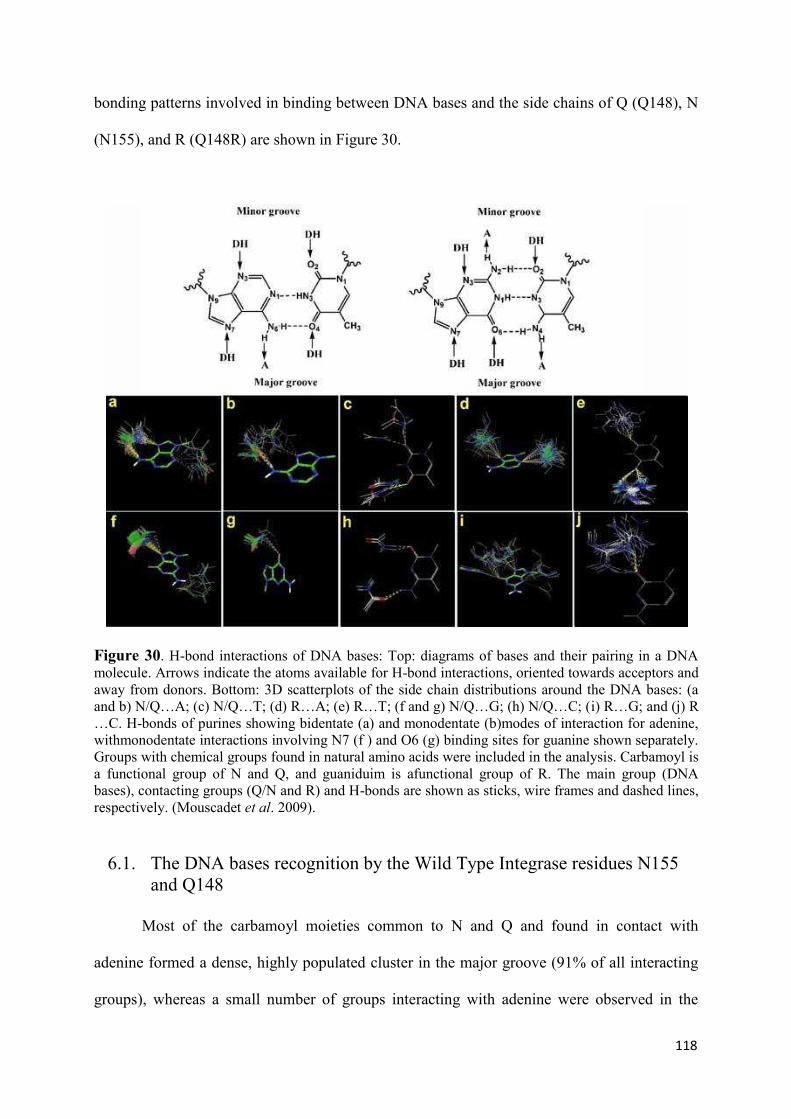
118
bonding patterns involved in binding between DNA bases and the side chains of Q (Q148), N
(N155), and R (Q148R) are shown in Figure 30.
Figure 30. H-bond interactions of DNA bases: Top: diagrams of bases and their pairing in a DNA molecule. Arrows indicate the atoms available for H-bond interactions, oriented towards acceptors and away from donors. Bottom: 3D scatterplots of the side chain distributions around the DNA bases: (a and b) N/Q…A; (c) N/Q…T; (d) R…A; (e) R…T; (f and g) N/Q…G; (h) N/Q…C; (i) R…G; and (j) R
…C. H-bonds of purines showing bidentate (a) and monodentate (b)modes of interaction for adenine, withmonodentate interactions involving N7 (f ) and O6 (g) binding sites for guanine shown separately. Groups with chemical groups found in natural amino acids were included in the analysis. Carbamoyl is a functional group of N and Q, and guaniduim is afunctional group of R. The main group (DNA bases), contacting groups (Q/N and R) and H-bonds are shown as sticks, wire frames and dashed lines, respectively. (Mouscadet et al. 2009).
6.1. The DNA bases recognition by the Wild Type Integrase residues N155 and Q148
Most of the carbamoyl moieties common to N and Q and found in contact with
adenine formed a dense, highly populated cluster in the major groove (91% of all interacting
groups), whereas a small number of groups interacting with adenine were observed in the

119
minor groove (Figure 30 a, b). Moreover, most of the carbamoyl groups (67% of all
interacting fragments) in the major groove were coplanar with adenine and formed a pair of
strong, directional H-bonds with N7 and N6H2 in this base (Figure 38). Other carbamoyl
groups formed only one H-bond with adenine, with either N6-H2 or N7 (Figure 30 b). The N/Q
side chains in contact with adenine through the minor groove formed moderately strong non-
linear H-bonds, NH2…N3. Similarly, most of the carbamoyl groups contacting guanine bases
(94%) clustered in the major groove (Figure 30 f, g). Nevertheless, all contacts were single H-
bonds, with either N7 or O6 acceptors, positioned outside the guanine plane, at a dihedral angle
of 45 . Very few occurrences of H-bonded carbamoyl-guanine (N2H2 …O=) contacts were
observed in the minor groove. In the case of N/Q recognition by pyrimidines, carbamoyl
group interactions were observed only rarely (Figure 30 c, h). The positions and mode of
interaction of these groups suggested certain common rules. For example, thymine and
cytosine binding involves single H-bonds with carbamoyl groups, with no preference for
either of the two bases. The binding of the amino acid in position 4 with C or T is
characterized by a different orientation of the carbamoyl group, allowing an H-bond to be
formed with either O4 (T) or N4H2 (C). All carbamoyl groups interacting with T or C are
rotated 30–45 relative to the plane of the base.
6.2. The DNA bases recognition by the mutated Integrase residues N155H and Q148R/H/K
Guanidium fragments (arginine side chain) H-bonded to adenine bases clustered within
the major groove (33% of all contacting groups), with a dispersed cloud-like distribution
around N7 (Figure 30 d). The other dense and well grouped cluster (77% of all contacting
groups) was localized around the single acceptor site, N3, in the minor groove. Fragments
corresponding to both clusters were rotated relative to the adenine plane and participated in H-

120
bonding at either one or two NH2-termini. Guanidium groups forming H-bonds with guanine
were grouped into three diffuse clusters. Two of these clusters were positioned within the
major groove and the third was positioned in the minor groove (Figure 30 i) and consisted
mostly of end-on-oriented guanidium groups H-bonded to O6, N7, and N3, at various angles
relative to the guanine plane. Detailed analysis of DNA base recognition by H and K was
limited by the small amount of data available (see Appendix, Figure 2). Nevertheless, as for
R, the imidazole groups of the H side chain formed separate clusters at the N7 and N3 adenine
binding sites. The imidazoles interacting with guanine were grouped in the major groove,
interacting either with O6 or N7. Both adenine and guanine acceptor sites interact preferably
with the Nε2–H tautomer. The numbers of -C-NH3 groups (terminal moiety of the K side
chain) H-bonded to adenine or guanine were similar, but the modes of interaction with these
bases were different. The lysine side chains contacting adenine were clustered at the N7 and
N3 acceptor atoms, whereas all C-NH3 groups were clustered in the major groove of guanine,
H-bonded to either the O6 or N7 atom. The H-bonds formed between the guanidium fragments
of R and pyrimidine bases differed significantly. Thymine binds guanidium at two acceptor
sites, O2 and O4, whereas interaction with cytosine involves only one acceptor site, O2 (Figure
30 e, j). The guanidium at the thymine O4 site displays two orientations, coplanar and
orthogonal to the base plane. The coplanar fragments interact through their terminal NH2
groups, forming a strong bifurcated H-bond with the O4 atom, whereas guanidium in the
orthogonal orientation forms only a single H-bond. The guanidium at the O2 atom of cytosine
displays various orientations, including a rotation by 45 allowing the formation of two H-
bonds (bifurcated H-bonding). As for purines, the numbers of imidazole and -C-NH3 groups
involved in thymine cytosine recognition were too small to be statistically significant, thus,
limiting comparison with purines. Nevertheless, the positions of imidazole and, in particular, -
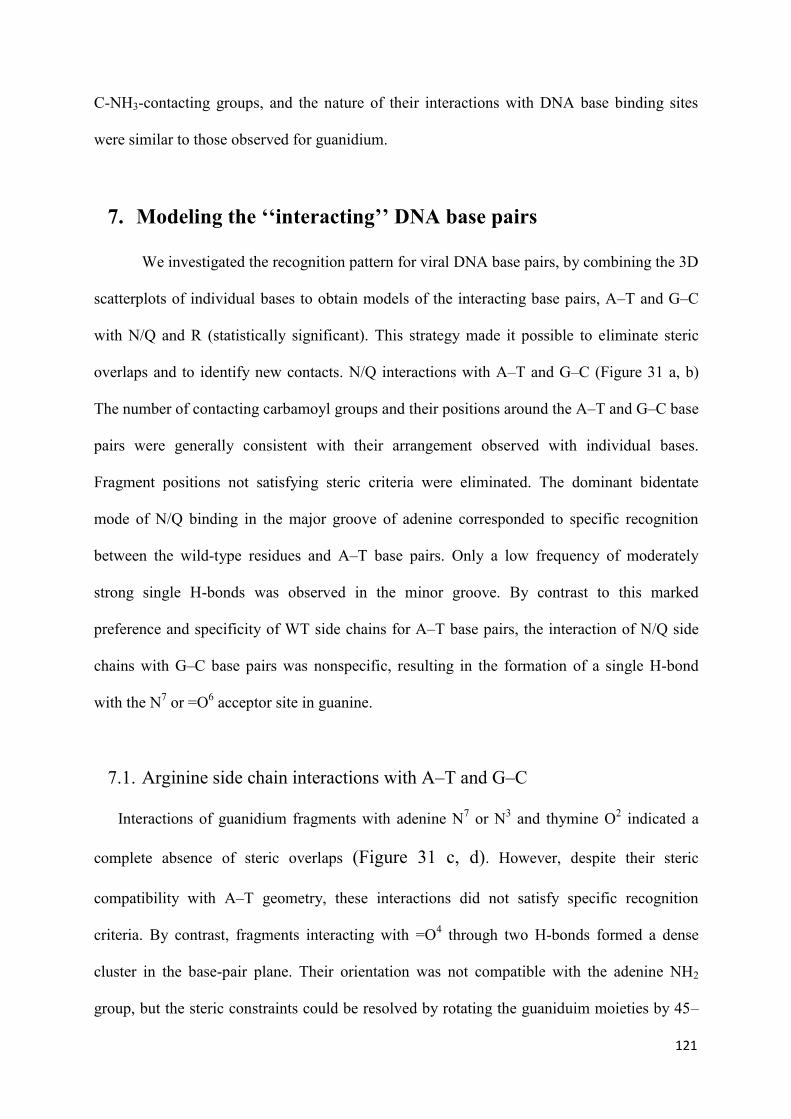
121
C-NH3-contacting groups, and the nature of their interactions with DNA base binding sites
were similar to those observed for guanidium.
7. Modeling the ‘‘interacting’’ DNA base pairs
We investigated the recognition pattern for viral DNA base pairs, by combining the 3D
scatterplots of individual bases to obtain models of the interacting base pairs, A–T and G–C
with N/Q and R (statistically significant). This strategy made it possible to eliminate steric
overlaps and to identify new contacts. N/Q interactions with A–T and G–C (Figure 31 a, b)
The number of contacting carbamoyl groups and their positions around the A–T and G–C base
pairs were generally consistent with their arrangement observed with individual bases.
Fragment positions not satisfying steric criteria were eliminated. The dominant bidentate
mode of N/Q binding in the major groove of adenine corresponded to specific recognition
between the wild-type residues and A–T base pairs. Only a low frequency of moderately
strong single H-bonds was observed in the minor groove. By contrast to this marked
preference and specificity of WT side chains for A–T base pairs, the interaction of N/Q side
chains with G–C base pairs was nonspecific, resulting in the formation of a single H-bond
with the N7 or =O6 acceptor site in guanine.
7.1. Arginine side chain interactions with A–T and G–C
Interactions of guanidium fragments with adenine N7 or N3 and thymine O2 indicated a
complete absence of steric overlaps (Figure 31 c, d). However, despite their steric
compatibility with A–T geometry, these interactions did not satisfy specific recognition
criteria. By contrast, fragments interacting with =O4 through two H-bonds formed a dense
cluster in the base-pair plane. Their orientation was not compatible with the adenine NH2
group, but the steric constraints could be resolved by rotating the guaniduim moieties by 45–

122
90 . This rotation did not disrupt the pattern of H-bonding between guanidium and thymidine,
revealing a new contact between the deprotonated N atom of the amino acid side chain and the
NH2 group of adenine. Thus, arginine residues behaved like wild-type N/Q residues, binding
specifically to A–T base pairs through the major groove, but the sites of R recognition—
thymidine O4 and adenine N6H2 groups—were different.
Figure 31. 3D scatterplots of ‘‘interacting’’ base pairs (a) A–T…N/Q; (b) G–C…N/Q; (c) A–T…R;
and (d) G–C…R represented in approximately the same orientation, with the purine bases at the top and the major groove at the left. The main group (DNA base pairs) and contacting groups (N/Q and R) are shown as wire frames; H-bonds as yellow dashed lines (including Watson-Crick bonds); additional contacts revealed by the generation of interacting base pairs in magenta, (c) and (d); van der Waals radii (dotted spheres) of groups (N1) and (N6) of adenine in green; (N3) and (O4) of thymine in magenta and arginine in yellow, illustrating conflict between arginine and N1 (A). (Mouscadet et al. 2009).
The arginine side-chain distribution around G–C base pairs corresponded exactly to
that around the individual DNA bases. Indeed, all side chains avoided steric constraint with

123
base exocyclic groups. Interestingly, the R fragments H-bonded to the cytosine O2 binding site
were found to be in an appropriate orientation to form a third H-bond with the guanine -
N2H2group. These chains therefore probably interact with both bases simultaneously, resulting
in multi-dentate H-bonding through the minor groove of the G–C base pair.
In conclusion, our results demonstrate that one of the key differences between the
wild-type (N/Q) and RAL-selected mutated (R/H/K) residues relates to their DNA base
recognition properties. N155 and Q148 clearly interact preferentially with adenine, either as a
single base or in the A–T base pair. In both cases, a strong and specific interaction with
adenine is ensured by linear and highly directional bidendate H-bonding within the major
groove. In contrast, a single, moderately strong and non-linear H-bond is formed with
guanine. The DNA base-pair model generated by this strategy identifies new possibilities for
H-bonding, demonstrating that the arginine side chain can engage in multiple and directed H-
bond interactions, allowing specific R…A–T (major groove) or R…G–C (minor groove)
interactions.
8. Discussion
RAL resistance is associated with two genetic pathways defined by the N155H or
Q148H/R/K primary mutations (Hazuda et al., 2007; Kobayashi et al., 2008; Myers & Pillay,
2008). Secondary G140S/A mutation in the Q148H/R/K background compensate for
replication defects associated with primary mutations and increases resistance. These
substitutions significantly decrease the binding affinity of the integrase inhibitor and allow IN
to retain its activity. We performed in silico analyses of the structural features and recognition
properties of wild-type and mutated INs to gain further insight into the molecular basis of
HIV-1 IN resistance. This study focuses on the active site of IN and the catalytic loop-

124
containing residues in particular, the mutation of which has been selected by RAL in clinical
practice.
This study highlighted the importance of a stable Ω-shaped hairpin within the catalytic
loop. The importance of this loop has not previously been reported for the HIV-1 IN, although
a related subsecondary structure had been described (Maignan et al., 1998; Chen et al., 2008).
This hairpin can move toward the active site, defining open and closed conformations.
Movements of the hairpin opening the active site lead to the formation of a cleft by the active
site and the catalytic loop, which can then accommodate DNA. G140A/S-mutated forms of IN
display slightly lower levels of hairpin mobility than the wild-type enzyme. This lower level
of mobility is associated with lower levels of G140S mutant enzyme activity in vitro (Malet et
al., 2008) and slower 3′-processing kinetics for both the G140S and G140S/Q148H mutants
(Delelis et al., 2009 ). Our 3D models of RAL-selected mutants demonstrated that the two
primary pathways to RAL resistance, one involving N155H mutations and the other involving
the replacement of Q148 by H, R, or K, conserve all the structural features of the IN catalytic
domain. They also demonstrated that the specific interactions of RAL-selected amino acids
with DNA base pairs differed from those of the wild-type enzyme, accounting for the
observed differences in efficacy between mutant and wild-type integrase in vitro.
Furthermore, the G140S mutation, which occurs after the primary Q148 mutation in vivo,
changes slightly the mobility of the catalytic loop, thereby possibly modifying the change in
base specificity induced by Q148R/H/K mutation. Although this modification appears limited
in our study, it may provide a possible basis for the optimizing role of G140S mutation.
Experimental biological data suggest that the core domain interacts with the terminal
CAGT bases of LTR ends (Ellison et al., 1995; Heuer & Brown, 1997; Esposito & Craigie,
1998; Heuer & Brown, 1998) required for IN activity. Substitutions introducing nucleotide
analogues stabilizing the double strand decrease 3′-processing activity, whereas those
125
weakening base pairing in the vicinity of the CA dinucleotide increase activity (Agapkina et
al., 2006). Our data suggest that the A–T pair at the terminus or in the third position is
selectively recognized by the WT Q148 or N155 residue. A recent biochemical study
(Langley et al., 2008) carried out with a different IN inhibitor concluded that the terminal
adenosine of the viral LTR controlled the binding of strand transfer inhibitors. This result
supports the validity of our model. A recent theoretical prediction for DNA substrate binding
sites on HIV-1 IN indicated that amino acids 139–152 constitute a binding site that includes
Q148, together with Q137, Q146, and N144 (Chen et al., 2008; Dolan et al., 2009).
Adenine can be specifically recognized in either its paired (A–T) or unpaired form.
However, we suggest that Q148/N155 residues interact with the sterically and energetically
more favorable terminal unpaired adenine, consistent with previous data showing post-3′-
processing contact between Q148 and the 5′-AC overhang (Chiu & Davies, 2004) and the
theoretical model of the IN–DNA complex (Dolan et al., 2009). By contrast, the Q148R
mutant preferentially established specific interactions by binding the two bases of a pair,
either A–T or G–C, simultaneously. This lack of discrimination for base pair binding implies a
loss of strict sequence specificity. Thus, Q148R, through its long arginine side chain, may
interact either with A–T at the third position, via the major groove edge, or with the next base
pair, G–C, across the minor groove. These alternative arrangements are possible due to the
flexibility of the catalytic loop, demonstrated by movement of the hairpin.
Strand transfer inhibitors, such as RAL, bind at the interface of the IN-viral DNA
complex, by forming a quaternary complex with the catalytic metal in the enzyme active site
and the 3′-processed donor DNA. RAL has a very flexible conformation, with multiple H-
bonding sites and E-, Z-conformers of the two pharmacophores, 1,3,4-oxadiazole-2-
carboxamide (F1) and N-methyl-4-carboxamide-dihydroxy-pyrimidine (F2). The conformers
of these two fragments constitute alternative bioisosters of adenine (in Z-) or guanine (in E-).
126
RAL may, therefore, act as a base analog, competing with the target DNA for the
establishment of specific interactions with IN. We previously reported stabilization of the β-
ketoenol fragment in the Z-conformation by intramolecular H-bonds, suggesting that F2 is a
bioisoster of adenine (Tchertanov and Mouscadet, 2007). We have also shown that β-
ketoenolate is an excellent chelator of divalent metals (Tchertanov and Mouscadet, 2007).
Thus, F2 can efficiently coordinate magnesium via the two 1–5 oxygen atoms, orienting RAL
such that its “adenine-like” part, adjacent to β-ketoenolate, is specifically recognized by N155,
which is found close to the Mg2+ cation. The F1 fragment can mimic adenine or guanine,
depending on its rotational isomer. However, conformational analysis of the isolated
compound revealed the adenine bioisoster to be the most stable conformer. Given the specific
recognition of adenine by Q148 and N155, the adenine bioisosters of F1 and F2 also constitute
targets for these residues.
VI. Molecular Dynamics Simulation of unbound
Integrase in the native and mutated forms
The experimental data obtained by our colleagues from the Moscow University (Dr.
Marina Gottikh) showed that mutations in the C-terminal domain affect the vDNA binding
efficiency and the 3’-processing reaction (Figure 32). Particularly it has been shown that the
R228A mutation reduces the 3’-processing efficiency to 5-7% respective to the 100% activity
of the WT IN.
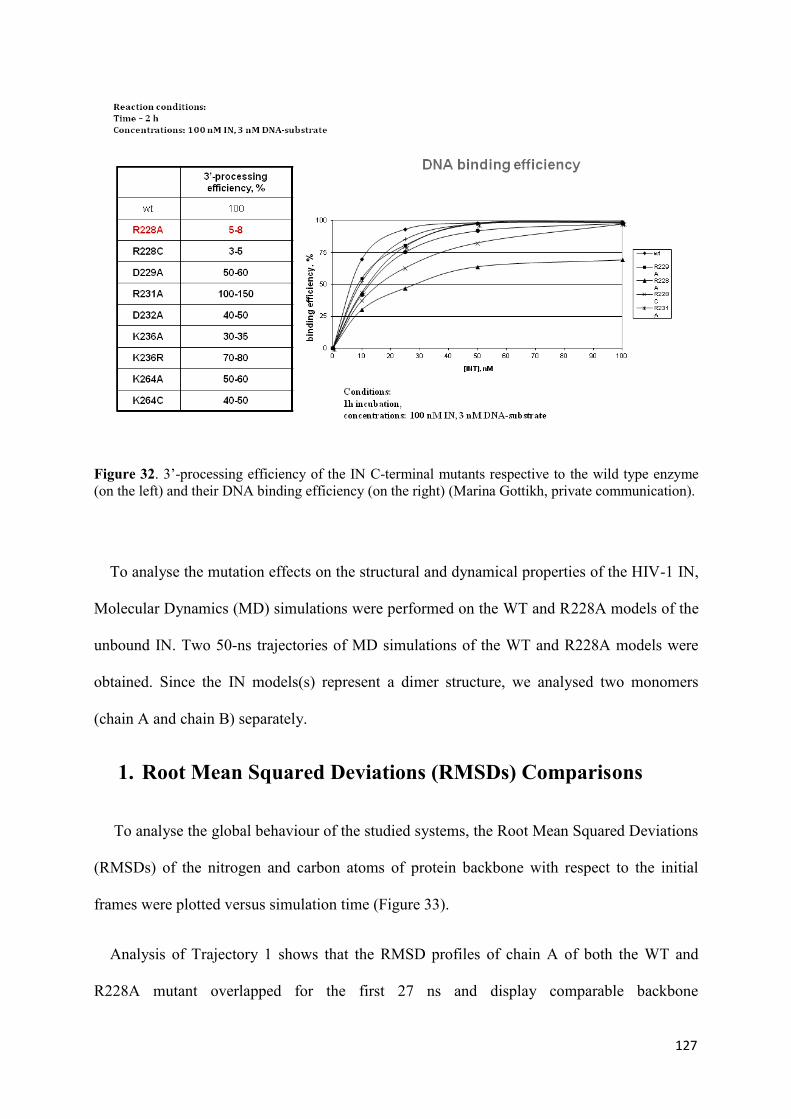
127
Figure 32. 3’-processing efficiency of the IN C-terminal mutants respective to the wild type enzyme (on the left) and their DNA binding efficiency (on the right) (Marina Gottikh, private communication).
To analyse the mutation effects on the structural and dynamical properties of the HIV-1 IN,
Molecular Dynamics (MD) simulations were performed on the WT and R228A models of the
unbound IN. Two 50-ns trajectories of MD simulations of the WT and R228A models were
obtained. Since the IN models(s) represent a dimer structure, we analysed two monomers
(chain A and chain B) separately.
1. Root Mean Squared Deviations (RMSDs) Comparisons
To analyse the global behaviour of the studied systems, the Root Mean Squared Deviations
(RMSDs) of the nitrogen and carbon atoms of protein backbone with respect to the initial
frames were plotted versus simulation time (Figure 33).
Analysis of Trajectory 1 shows that the RMSD profiles of chain A of both the WT and
R228A mutant overlapped for the first 27 ns and display comparable backbone
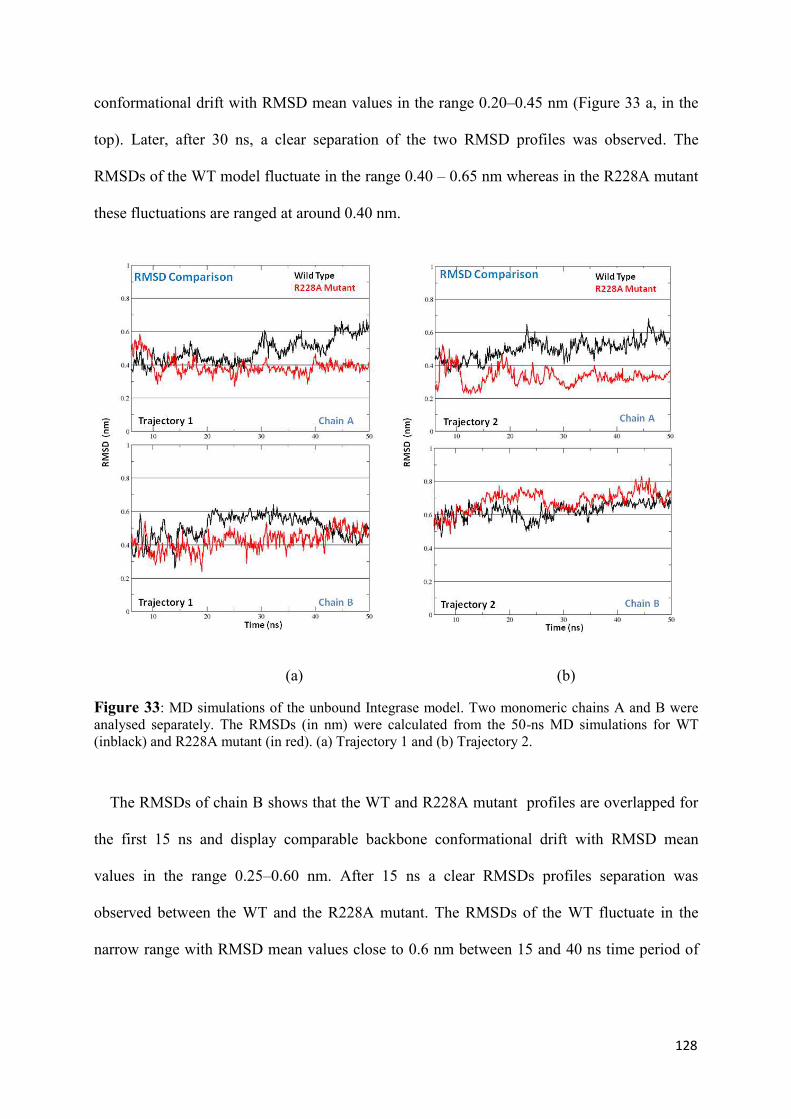
128
conformational drift with RMSD mean values in the range 0.20‒0.45 nm (Figure 33 a, in the
top). Later, after 30 ns, a clear separation of the two RMSD profiles was observed. The
RMSDs of the WT model fluctuate in the range 0.40 ‒ 0.65 nm whereas in the R228A mutant
these fluctuations are ranged at around 0.40 nm.
(a) (b)
Figure 33: MD simulations of the unbound Integrase model. Two monomeric chains A and B were analysed separately. The RMSDs (in nm) were calculated from the 50-ns MD simulations for WT (inblack) and R228A mutant (in red). (a) Trajectory 1 and (b) Trajectory 2.
The RMSDs of chain B shows that the WT and R228A mutant profiles are overlapped for
the first 15 ns and display comparable backbone conformational drift with RMSD mean
values in the range 0.25‒0.60 nm. After 15 ns a clear RMSDs profiles separation was
observed between the WT and the R228A mutant. The RMSDs of the WT fluctuate in the
narrow range with RMSD mean values close to 0.6 nm between 15 and 40 ns time period of
129
the MD simulations. The last 10 ns simulations evidenced that the RMSDs profiles of chain A
and chain B overlap again and fluctuate in the range 0.40‒0.55 ns.
Analysis of Trajectory 2 (Figure 33 b) indicated that the RMSDs profiles of chain A from
WT and R228A mutant are overlapped for a short time period (the first 10 ns). Starting from
12 ns the RMSDs of the WT fluctuate in the range 0.40‒0.65 nm, while the R228A mutant
RMSDs are ranged from 0.23 to 0.45 ns. The RMSDs characterising the chain B fluctuations
of the WT and R228A mutant overlap for most of the simulation run and their mean values
ranged from 0.53 to 0.82 nm, except for the simulation time between 14‒27 ns. Within this
interval, the RMSDs are in the ranges 0.50‒0.60 nm in WT and 0.65‒0.75 nm in mutant. At
the end of simulation run the RMSDs profiles of the WT and the R228A mutant are
superimposed.
2. Root Mean Squared Fluctuations (RMSFs) Analysis
The root mean square fluctuation (RMSF) per residue was computed on the C and N
backbone atoms on the last 50-ns of each simulation, referenced to the average structure, and
averaged over the two simulation replica of each model (Figure 34). The most fluctuant
domains in all models are the CTD and catalytic site loop of CCD. Many regions appear
stabilized in both chains of two models.

130
Figure 34. Atomic fluctuations changes per residue in mutants compared to the WT protein. RMSFs are computed on C and N backbone atoms over the total production simulation time of of 50 ns MD simulations (Trajectories 1 and 2) of WT and mutant.
The RMSF values computed either on the WT or on the mutant seems globally quantitatively
comparable. The mean RMSF over the whole structure range from 0.24 to 0.27 nm for WT,
and from 0.25 to 0.28 for mutant. This allowed us to perform the PCA comparison, on
different simulation durations for the different simulated models.
3. Principal Component Analysis (PCA)
To further characterise IN chains motions, principle component analysis (PCA), also
called quasi-harmonic analysis or essential dynamics method, of the MD trajectories was
performed. The approach is based on the covariance matrix, which provides information on
the two-point correlations of the system. The PCA represents a linear transformation that
diagonalizes the covariance matrix and thus removes the instantaneous linear correlations
among the variables. Ordering the Eigen values of the transformation decreasingly, a large
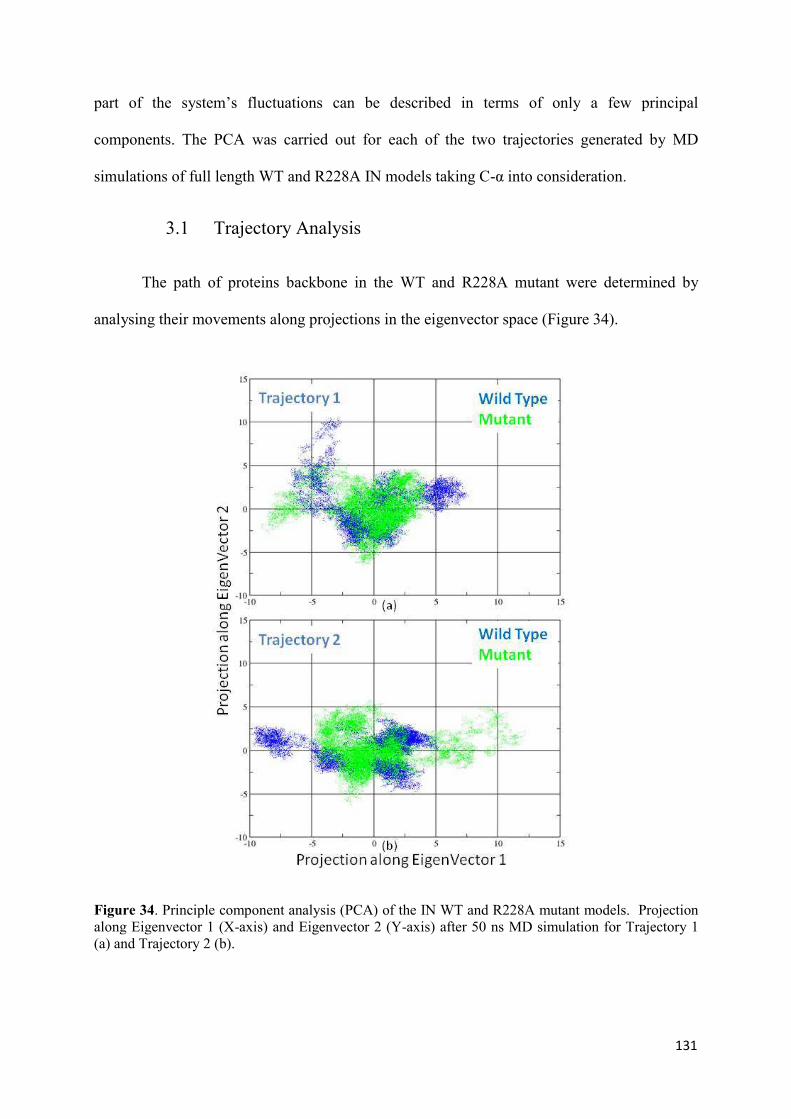
131
part of the system’s fluctuations can be described in terms of only a few principal
components. The PCA was carried out for each of the two trajectories generated by MD
simulations of full length WT and R228A IN models taking C-α into consideration.
3.1 Trajectory Analysis
The path of proteins backbone in the WT and R228A mutant were determined by
analysing their movements along projections in the eigenvector space (Figure 34).
Figure 34. Principle component analysis (PCA) of the IN WT and R228A mutant models. Projection along Eigenvector 1 (X-axis) and Eigenvector 2 (Y-axis) after 50 ns MD simulation for Trajectory 1 (a) and Trajectory 2 (b).
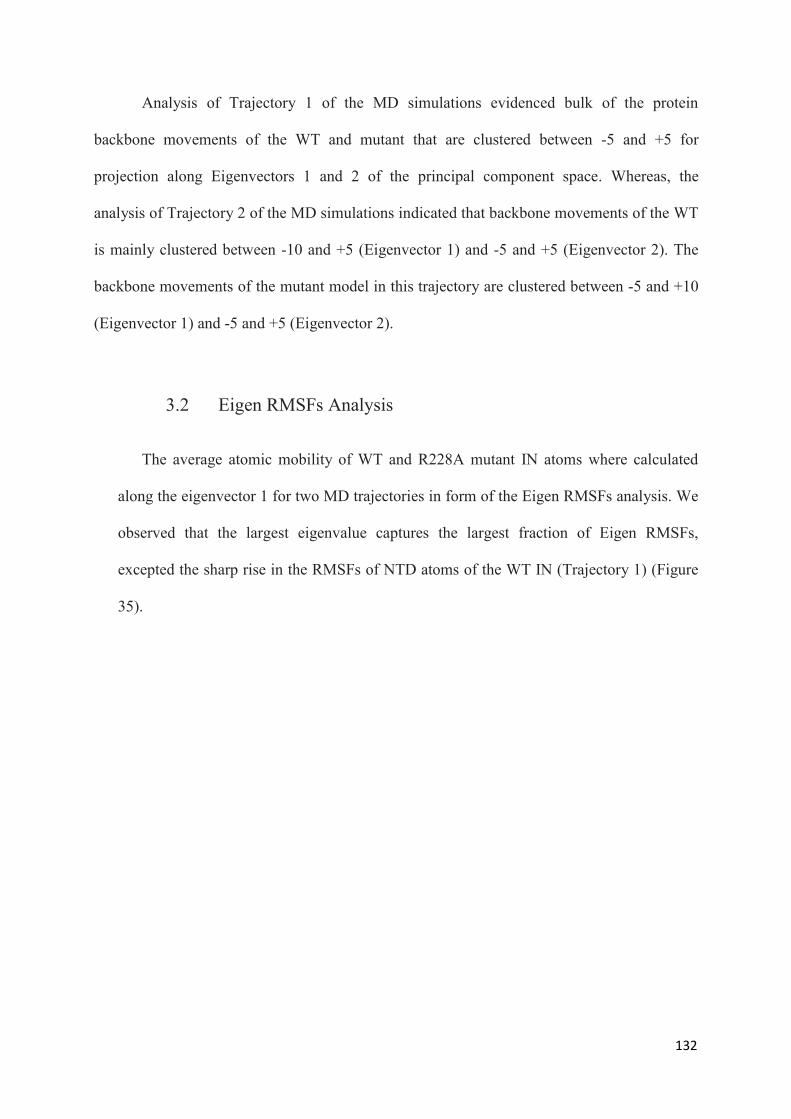
132
Analysis of Trajectory 1 of the MD simulations evidenced bulk of the protein
backbone movements of the WT and mutant that are clustered between -5 and +5 for
projection along Eigenvectors 1 and 2 of the principal component space. Whereas, the
analysis of Trajectory 2 of the MD simulations indicated that backbone movements of the WT
is mainly clustered between -10 and +5 (Eigenvector 1) and -5 and +5 (Eigenvector 2). The
backbone movements of the mutant model in this trajectory are clustered between -5 and +10
(Eigenvector 1) and -5 and +5 (Eigenvector 2).
3.2 Eigen RMSFs Analysis
The average atomic mobility of WT and R228A mutant IN atoms where calculated
along the eigenvector 1 for two MD trajectories in form of the Eigen RMSFs analysis. We
observed that the largest eigenvalue captures the largest fraction of Eigen RMSFs,
excepted the sharp rise in the RMSFs of NTD atoms of the WT IN (Trajectory 1) (Figure
35).
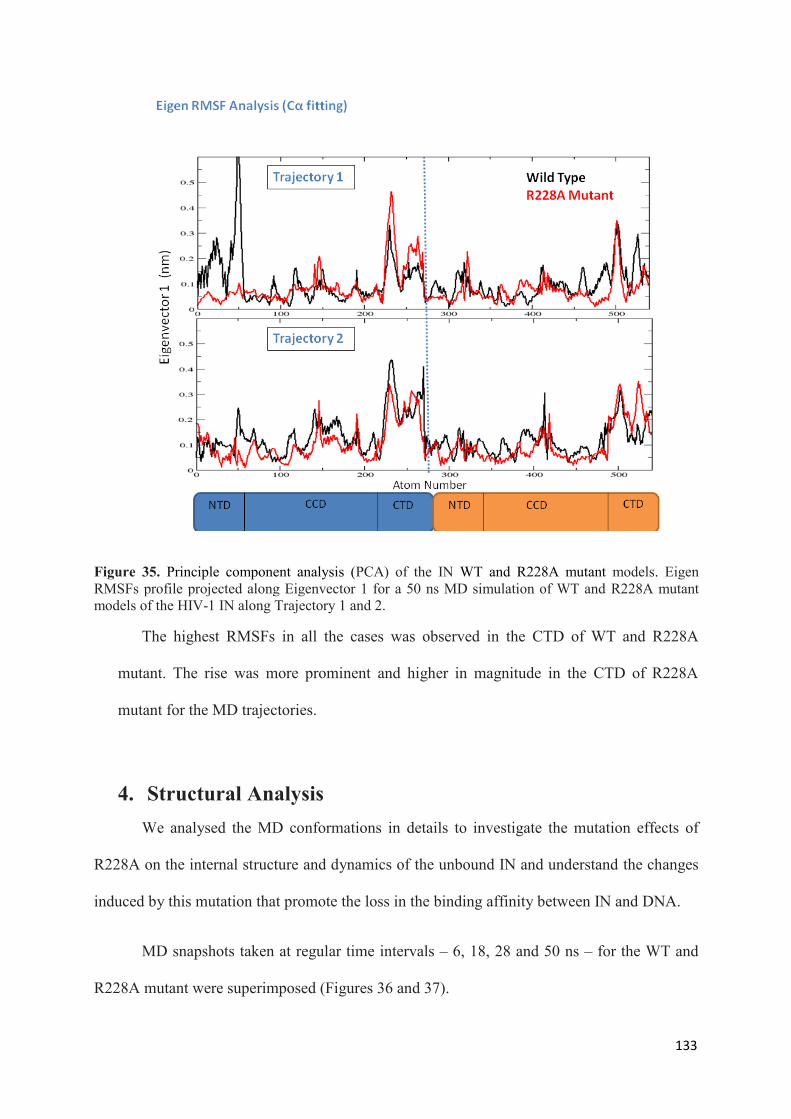
133
Figure 35. Principle component analysis (PCA) of the IN WT and R228A mutant models. Eigen RMSFs profile projected along Eigenvector 1 for a 50 ns MD simulation of WT and R228A mutant models of the HIV-1 IN along Trajectory 1 and 2.
The highest RMSFs in all the cases was observed in the CTD of WT and R228A
mutant. The rise was more prominent and higher in magnitude in the CTD of R228A
mutant for the MD trajectories.
4. Structural Analysis
We analysed the MD conformations in details to investigate the mutation effects of
R228A on the internal structure and dynamics of the unbound IN and understand the changes
induced by this mutation that promote the loss in the binding affinity between IN and DNA.
MD snapshots taken at regular time intervals ‒ 6, 18, 28 and 50 ns ‒ for the WT and
R228A mutant were superimposed (Figures 36 and 37).
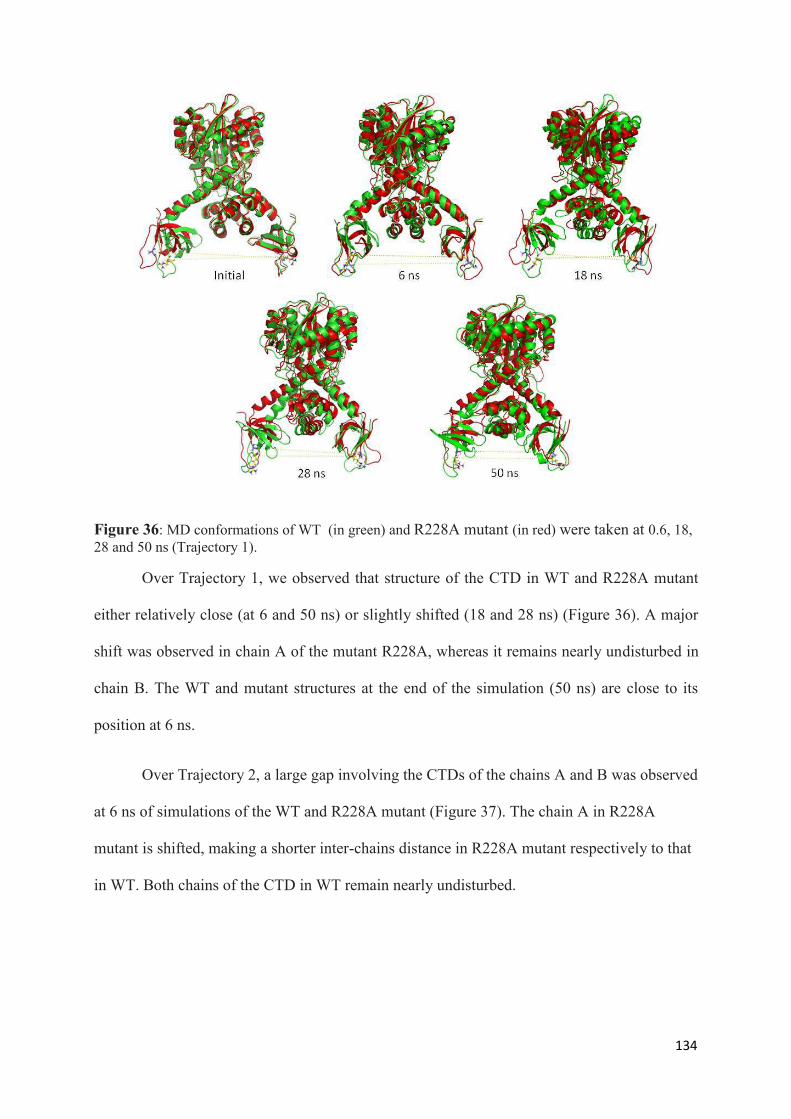
134
Figure 36: MD conformations of WT (in green) and R228A mutant (in red) were taken at 0.6, 18, 28 and 50 ns (Trajectory 1).
Over Trajectory 1, we observed that structure of the CTD in WT and R228A mutant
either relatively close (at 6 and 50 ns) or slightly shifted (18 and 28 ns) (Figure 36). A major
shift was observed in chain A of the mutant R228A, whereas it remains nearly undisturbed in
chain B. The WT and mutant structures at the end of the simulation (50 ns) are close to its
position at 6 ns.
Over Trajectory 2, a large gap involving the CTDs of the chains A and B was observed
at 6 ns of simulations of the WT and R228A mutant (Figure 37). The chain A in R228A
mutant is shifted, making a shorter inter-chains distance in R228A mutant respectively to that
in WT. Both chains of the CTD in WT remain nearly undisturbed.

135
Figure 37: MD conformations of WT (in green) and R228A mutant (in red) were taken at 0.6, 18, 28 and 50 ns (Trajectory 2).
The position of the CTD of chain A in the WT and R228A mutant did not change at 18 and
28 ns of simulation, while the chain B in R228A mutant is shifted towards the chain B of the
WT CTD. The chains B of two INs, WT and R228A mutant, appear to almost overlap.
The CTDs positions in WT and R228A mutant (chains A and B) at 50 ns remain to be
similar to their positions at 28 ns. Such observation indicates the absence the major inter-
chains movement in the CTD as was evidenced by Trajectory 2.
Distance between R228 from the chains A and B in WT and in R228A mutant was
monitored over Trajectories 1 and 2. (Figure 38).
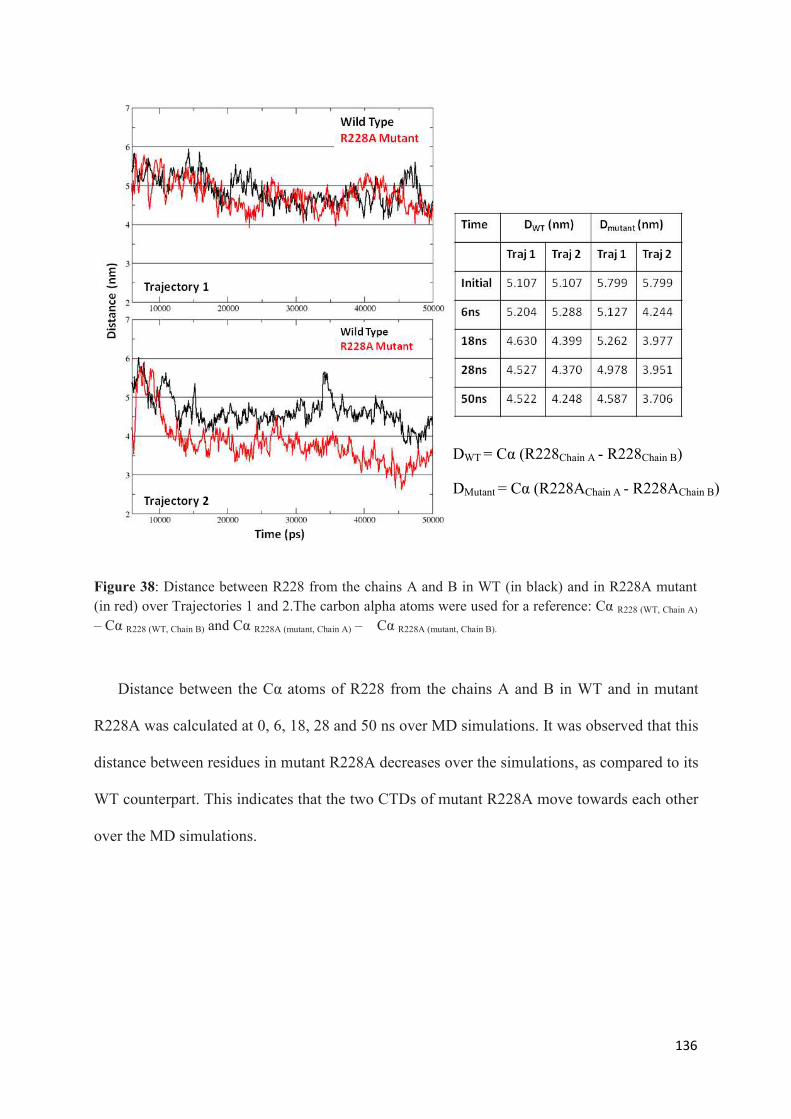
136
Figure 38: Distance between R228 from the chains A and B in WT (in black) and in R228A mutant (in red) over Trajectories 1 and 2.The carbon alpha atoms were used for a reference: Cα R228 (WT, Chain A) – Cα R228 (WT, Chain B) and Cα R228A (mutant, Chain A) – Cα R228A (mutant, Chain B).
Distance between the Cα atoms of R228 from the chains A and B in WT and in mutant
R228A was calculated at 0, 6, 18, 28 and 50 ns over MD simulations. It was observed that this
distance between residues in mutant R228A decreases over the simulations, as compared to its
WT counterpart. This indicates that the two CTDs of mutant R228A move towards each other
over the MD simulations.
DWT = Cα (R228Chain A - R228Chain B)
DMutant = Cα (R228AChain A - R228AChain B)

137
5. Secondary Structure Analysis
Secondary structure analysis of WT and R228A mutant was carried out separately for the
two trajectories of the MD simulations and only the CTD of the IN was considered. First, a
comparison between chain A from the CTD in WT and mutant was performed over Trajectory
1 of the MD simulations. The main difference between WT and R228A mutant was observed
in the region from 227 to 235 amino acids. It was observed that in chain A of WT, the average
secondary structure represents an approximately 90% of turn, 70% of coil and near 50% of
bend (Figure 39). In contrast, the same region in R228A mutant consists mainly of the bend
and coil structures with only 10% of turn.
In chain B other region, from 250 to 260 amino acids, shows divergent secondary
structures between two integrases. This region in WT consists of the sheets and nearly 50% of
the bend and turn (Figure 39). In R228A mutant mainly of the sheet structures were observed
similarly to the WT, while the turn portion is increased up to 85% and the bend was at almost
10%.

138
Figure 39: MD simulations (50 ns) of the WT and R228A mutant. Average secondary structure profile of the IN CTD (Chains A and B) over Trajectory 1.
Similar analysis of average secondary structure performed for Trajectory 2 put in
evidence that other regions show a difference at the secondary structure level, particularly, the
region from 220 to 225 amino acids (aas) in chain A and from 213 to 220 amino acids in B. In
WT the 220-225 aas from the chain A is characterised by the turn structures (60%) while the
bend and coil are 20% each (Figure 40). In contrast, the same region in R228A mutant shows
that the turn is 85%.
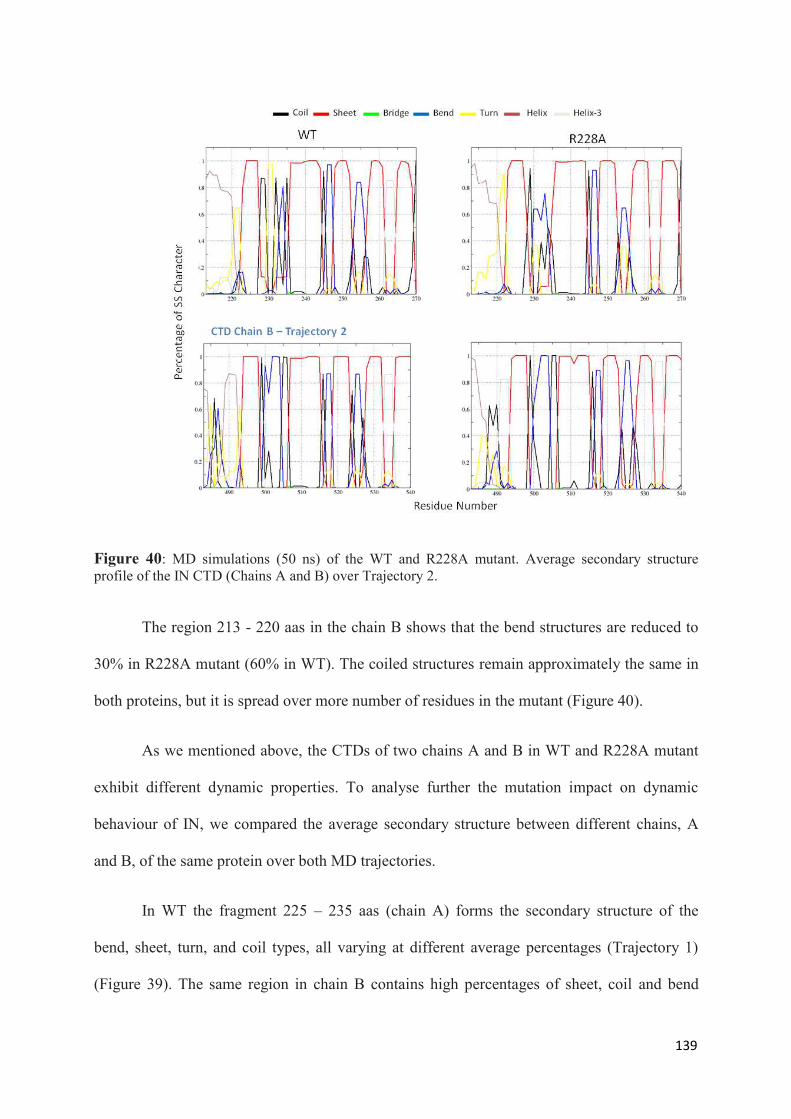
139
Figure 40: MD simulations (50 ns) of the WT and R228A mutant. Average secondary structure profile of the IN CTD (Chains A and B) over Trajectory 2.
The region 213 - 220 aas in the chain B shows that the bend structures are reduced to
30% in R228A mutant (60% in WT). The coiled structures remain approximately the same in
both proteins, but it is spread over more number of residues in the mutant (Figure 40).
As we mentioned above, the CTDs of two chains A and B in WT and R228A mutant
exhibit different dynamic properties. To analyse further the mutation impact on dynamic
behaviour of IN, we compared the average secondary structure between different chains, A
and B, of the same protein over both MD trajectories.
In WT the fragment 225 – 235 aas (chain A) forms the secondary structure of the
bend, sheet, turn, and coil types, all varying at different average percentages (Trajectory 1)
(Figure 39). The same region in chain B contains high percentages of sheet, coil and bend

140
secondary structures. In R228A mutant the region 250 – 260 aas (chain A) revealed a
significantly higher average percentage of the bend (80%) and coil (60%) secondary structure
elements; the turn was much less (20%). In chain B the same sequence sows a high average
percentage of the bend structure (80%) while the average percentages of the bend and coil was
low (10%). A comparison between chains A and B of WT indicated that the secondary
structure of the region 225 -235 aas is similar over Trajectory 1 and 2 (Figure 40).
6. Discussion
The role of CTD in non-specific binding of the vDNA was previously well-documented
experimentally. Experimental results have shown a particular mutation R228A decreases the
vDNA binding with the IN to 5-8% of its WT value. We contributed to characterisation of
this domain by using the molecular dynamics simulations. The MD simulations of the WT
and R228A mutated IN (unbound form) were performed.
In silico results evidenced by analysis of RMSDs, RMSFs, secondary structure, 3D
structure of the dynamic conformations show the structural and dynamical differences in the
CTD (i) between the similar chains in WT and R228A mutant ; and (ii) between the different
chains, A and B, of the same protein. Analysis of the distance profile between CTDs of the
same protein (WT and R228A mutant) over the MD simulations shows a change in the
R228A mutant conformation respectively to the WT.
141
Chapter 3. GENERAL CONCLUSIONS AND
PERSPECTIVES
The structural and recognition properties of the first the HIV-1 Integrase specific drug
‒ Raltegravir were studied. First, we characterised the conformational/configurational
properties of RAL, a very flexible molecule displaying the E/Z isomerism. Second, we
characterised the RAL recognition by its putative HIV-1 targets – the unbound IN, the viral
DNA and the IN·vDNA complex. The docked confirmations we observed represent a
spectrum of possible conformational/configurational states. The lower docking scores and
RAL poses confirms that the generated structure of the IN·vDNA complex is the biologically
relevant target of this inhibitor. The results of the docking are in perfect agreement with the
proposed mechanism of action for such type of the inhibitors, INSTIs. The identified RAL
pose at the cleaved vDNA shed light on a putative even plausible step of the RAL inhibition
mechanism. Based on the docking results we suggested that the inhibition process may
include as a first step the RAL recognition by the processed viral DNA bound to a transient
intermediate IN state. RAL coupled to vDNA shows an outside orientation of all oxygen
atoms, excellent putative chelating agents of Mg2+ cations, which could facilitate the insertion
of RAL into the active site. The conformational flexibility of RAL further allows the
accommodation/adaptation of the inhibitor in a relatively large binding pocket of IN•vDNA
pre-integration complex thus producing various RAL docked conformation. We believe that
such variety of the RAL conformations contributing alternatively to the enzyme residue
recognition may impact the selection of the clinically observed alternative resistance
pathways to the drug.
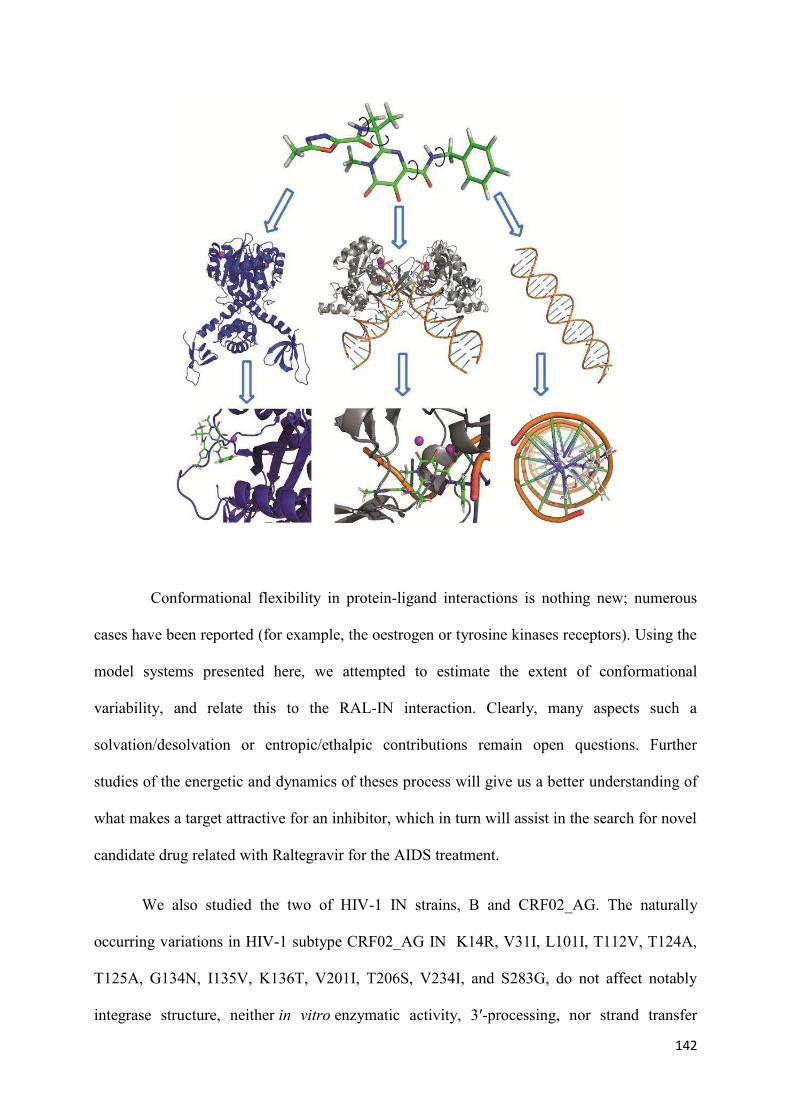
142
Conformational flexibility in protein-ligand interactions is nothing new; numerous
cases have been reported (for example, the oestrogen or tyrosine kinases receptors). Using the
model systems presented here, we attempted to estimate the extent of conformational
variability, and relate this to the RAL-IN interaction. Clearly, many aspects such a
solvation/desolvation or entropic/ethalpic contributions remain open questions. Further
studies of the energetic and dynamics of theses process will give us a better understanding of
what makes a target attractive for an inhibitor, which in turn will assist in the search for novel
candidate drug related with Raltegravir for the AIDS treatment.
We also studied the two of HIV-1 IN strains, B and CRF02_AG. The naturally
occurring variations in HIV-1 subtype CRF02_AG IN K14R, V31I, L101I, T112V, T124A,
T125A, G134N, I135V, K136T, V201I, T206S, V234I, and S283G, do not affect notably
integrase structure, neither in vitro enzymatic activity, 3′-processing, nor strand transfer
143
reaction. Docking results reveal that the modes of binding and docking conformations of three
studied molecules are identical for the HIV-1 IN from B and CRF02_AG strains. The
proposed mechanism of the integrase inhibition based on considering of different
conformational states, unbound IN, and IN·vDNA complex holds for the two studied strains.
We performed a detailed in silico study of the structural and molecular recognition of
DNA, induced by raltegravir-selected mutations. We demonstrated the topological invariance
of the integrase core domain, including the conservation of a recently identified Ω-shaped
hairpin in the catalytic loop. By contrast, we showed that the mutations greatly altered the
specificity of DNA recognition by integrase. The native residues displayed a clear preference
for adenine, whereas the mutants strongly favored pyrimidines. We propose a hypothetical
model, in which raltegravir inhibits HIV-1 replication by acting as an adenine mimic and
establishing specific interactions with the Q148 and/or N155 residues of the integrase. We
also provide a plausible explanation for the decrease in responsiveness to RAL when these
residues are replaced by arginine, histidine, or lysine. One of the obvious applications of our
models is as a docking guide for the placement of the viral DNA within its binding site in IN.
Future studies could focus on the correlation between the spatial orientation of the side chains
around the DNA bases and their pairs and the mapping of different frames from a Molecular
Dynamics run. Such work might open up new opportunities for the design of HIV-1 IN
inhibitors active against emerging HIV-1 mutants.
The novel drugs, targeted the HIV-1 Integrase, outcome primarily due to the rapid
emergence of RAL analogues (for example, GS-9137 or elvitegravir, MK-2048 and S/GSK
1349572, currently under clinical trials (Korolev et al., 2011). The clinical trials of several
RAL analogues (BMS-707035, GSK-364735) were suspended. All these molecules
specifically suppress the IN ST reaction. We conceive that the future HIV-1 integrase drug
development will be mainly oriented to design of inhibitors with a mechanism of action that
144
differs from that of RAL and its analogues. Distinct conceptions are potentially conceivable:
(i) Design of the allosteric inhibitors, able to recognize specifically the binding sites that differ
from the IN active site. Inhibitor V-165, belonging to such type inhibitors, prevents IN
binding with the viral DNA such blocking 3’-processing reaction (Pannecouque et al., 2002).
(ii) Design of the protein-protein inhibitors (PPIs) acting on interaction interface between
either viral components (the IN monomers upon multimerization process or sub-units of the
IN·vDNA complex) (Mazumder et al. 1996; Tsiang et al. 2011) or between viral and cellular
proteins (IN/LEDGF) (De Luca et al., 2010; Tsiang et al., 2012). These alternative strategies
represent rational and prospective directions in the HIV-1 integrase drug development.

145
Chapter 4. MATERIALS AND METHODS
I. Probing of Raltegravir Structure
1. Conformational analysis
RAL in Z-1/Z-2 configuration was taken from the X-ray structure of the Prototype Foamy
Virus (PFV) integrase co-crystallised with RAL (PDB code: 3OYA, 2.65 Å resolution) (Hare
et al., 2010b). Alternative RAL configurations (or isomers) – Z-1/E-2, E-1/Z-2 and E-1/E-2
(Chart 1) – were generated using the SYBYL package (Tripos Inc. Sybyl-X 1.1.1, 2009) by
employing simple carbon-carbon bond rotation to achieve the desired configuration, followed
by minimization. Further, the conformational space of each of four RAL isomers was
characterized by relaxed scan of molecular fragments around four single bonds using the
Jaguar program of MAESTRO molecular modeling package (Jaguar, version 7.0,
Schrödinger, LLC, New York, NY, 2007). In each case, rotation was performed from 0 to
360 with an increment step of 30 for each particular single bond while the others were kept
fixed. All the scans were performed with 6-31g(d) basis set at the Hartree-Fock (HF) level of
theory (Friesner & R.A, 1987). Each scan was analyzed and corresponding potential energy
plot and the RAL conformations were characterized for each of the four configurations.
2. Molecular Dynamics simulations
The initial molecular geometry of RAL was taken from the crystallographic
coordinates file representing RAL co-crystallized with integrase of the Prototype Foamy Virus
(PFV) (PDB code: 3OYA, at 2.65 Å resolution) (Hare et al., 2010). The initial model was
prepared with pdb2gmx of GROMACS 4.0 (van der Spoel et al., 2005); The ligand topology
was generated by Acpype using a combination of GAFF with Amber 99sb-ILDN force field;
The charge on the ligand was -1, generated by Acpype; The hydrogen atoms were then added;
146
In-vacuum minimization of the RAL for 1000 steps was performed using a Steepest-Descent
(SD) integrator. The minimized model of RAL was placed in an octahedral TIP3P water box.
The charge of the solvated system was neutralized by adding Na+ counter ions. The system
was then heated up to 300° K at a constant volume using a modified Berendsen thermostat
(Berendsen, Postma, Vangunsteren, Dinola, & Haak, 1984) while restraining the solute atoms
by 1 000 kJ/mol/nm2. The system was then equilibrated for 1 ns under the constant volume
and temperature conditions (NVT). The pressure coupling was also turned “on” using
Parrinello-Rahman barostat (Martonak, Laio, & Parrinello, 2003). Thereafter, three replicas
of MD simulations were produced for the equilibrated system during 10 ns. The torsion angles
t1-t4 were monitored over the MD simulations. The average fraction of distribution expressed
as a probability of the occurrence of t1-t4 is given by (1):
(1)
where m is a mean value and s is a standard deviation.
The H-bonds formed by RAL with the water molecules were recovered over the MD
simulations. The contacts D-H×××A, where D and A = O/N, with D×××A distances < 3.4 Å and
pseudo valent angles ÐD-H×××A > 90°, were considered as the H-bonds.
3. Structural fragment-based analysis (Cambridge Structural
Database)
Relevant structures were retrieved from the CSD (Release 2011, 541,748 entries)
(Allen, 2002). Substructural searches, geometry calculations and data analysis were carried
out with the CSD programs ConQuest 1.13 (Bruno et al., 1997), Vista v2.1 (CSD, 1994) and
Mercury 2.4.5 (Macrae et al., 2006). Structures flagged in the database as being erroneous or
disordered were rejected from analysis.

147
We searched CSD for three groups of molecules based on the 1,3,4-oxadiazole-2-
carboxamide (1), carbonylamino-1-N-alkyl-5-hydroxypyrimidinone (2) and fluorobenzyl
carbamoyl (3) moieties. No structures included moiety (1) and a limited number (3 structures)
of molecules based on moiety (2) was retrieved, therefore the search was performed using the
more general fragments F1, F2 and F3 (Table 2). The F1 and F2 were investigated to
characterise the molecular geometry and intramolecular H-bonding (D-H…A, where D and A
= O/N). The definition of the parameters characterizing the H-bonds was used as reported
early (Tchertanov & Mouscadet, 2007). Molecules based on F3 with halogen atom F, Cl or Br
in the para position, were analysed for the torsion and dihedral angles. The coordination
geometry in metal complexes was probed for the Mn, Mg and K complexes chelated with F1
and F2 as defined in (Tchertanov & Mouscadet, 2007).
A simple and general computational procedure was carried out with all selected
crystallographic observations obtained from the CSD. For each instance of every fragment,
F1, F2 and F3, the related geometric parameters (depicted in Table 2) were calculated. The
structural relationships in the studied molecular fragments were estimated by carrying out
univariate and bivariate analysis. The results obtained for univariate analysis are presented as
numerical values, and those for bivariate analyses are presented as scatter plots.
II. Targets modeling
1. The HIV-1 Integrase Models of the B and CRF02_AG strains
3D models of the full-length IN homo-dimer (the apo state respectively to DNA)
representing one- and two Mg+2 cation(s) active sites were generated as follows: (i) The X-
Ray structures of the isolated fragmented domains, IN1-210 (1K6Y) (Wang, Ling, Yang, &
Craigie, 2001) and IN56-270 (1EX4) (Chen et al., 2000) were chosen as the initial templates.

148
Both structures were superposed; CCD domain (IN56-210) of 1EX4 determined with lower
resolution (2.8 Å) than 1K6Y (2.4 Å) was deleted. Crystal structures represent the multiple
mutants, W131D/F139D/F185K in 1K6Y and C56S/W131D/F139/F185K/ C180S in 1EX4;
the mutated residues were replaced by the wild type amino acids of the B strain (model 1); the
homology modeling produced the model CRF02_AG (model 2) corresponding to followed
replacements, K14R/T112V/T125A/G134N/K136T/T206S. Residues 271-288 in 1EX4 and in
1K6Y are disordered and were omitted from the model. The missing loops (47-55 and 140-
148) were constructed using Modeller program. The models were exposed to further
refinement at the loop regions level (139-149 catalytic site loop and 47-55 CCD and N-
terminal linker) using the loop-refining protocol based on DOPE scoring as implemented in
Modeller software. Further the models were ranked based on the Discrete Optimized Protein
Energy (DOPE) score (Shen & Sali, 2006) and the models of the lowest energy were selected.
In the one- and two-cation models, the Mg2+ ions were inserted at the catalytic residues D64,
D116 and E152, as described for the two-cation structure of 1VSH (Bujacz et al., 1997) and
minimized using the molecular mechanics under constrains as described in (Mouscadet et al.,
2009) by using CHARMM program (Brooks et al., 2009).
2. IN•DNA Models of the B and CRF02_AG strains
3D models (Model 3 and Model 4) of the full-length IN homo-dimer (Holo state
respectively to DNA) were generated as follows:
(i) Full length sequence alignment of the HIV-1 (B strain) and PFV INs: In order to favor
pertinent superimposition of the residues conserved, the alignment of the sequences was
shifted for 1-50 residues (NED domain in PFV IN) and broken down in two steps, allowing
for more flexible inspection of the results and easier corrections. First, the sequences were
subjected to a pair wise alignment archived with ClustalW. Second, the helices from PFV IN

149
as defined in the original description of X-ray structure (Hare et al., 2010) and the
corresponding residues of the INs were examined to verify the correspondence of conserved
amino acids. Then each inter-helical alignment was refined separately without altering the rest
of superimposition using the selected residue range realignment feature of ClustalW.
(ii) The sequence alignment files were used as input for homology modeling with the X-ray
structure of IN•DNA complex of PFV co-crystallized with RAL 3L2T (Hare et al., 2010)
which were chosen as the template.
(iii) The stereochemical quality of the models was assessed with ProTable Procheck
(Laskowski, Macarthur, Moss, & Thornton, 1993), which showed that more than 97% of the
non-glycine residues in all models had dihedral angles in the most favorable and allowed
regions of the Ramachandram plot, consistent with high model quality. This part of the
calculations was carried out using Sybyl package (Tripos Inc., 2007).
3. Secondary structure prediction
Secondary structure assignment for the 1BL3 (Maignan et al., 1998), 1B9F (Greenwald et
al., 1999) ‒ the crystallographic structures of the HIV-1 IN catalytic core domain representing
the single F185H mutant and the G140A/G149A/F185K triple mutant respectively, and 3DLR
(Valkov et al., 2009) and 3OYA (Hare et al., 2010) ‒ the crystallographic structures of PFV
IN, either isolated or in complex with DNA, respectively, was achieved with the DSSP
(Kabsch & Sander, 1983) and Stride (Frishman & Argos, 1995) algorithms.
The secondary structures of the 23 amino acids (aas) polypeptides IN133-155 of the
HIV-1 IN and IN202-225 of the PFV IN were predicted by combining different methods: GOR4
(Garnier, Gibrat, & Robson, 1996); SIMPA96 (Levin, 1997); PSIpred (McGuffin, Bryson, &
Jones, 2000); APSSP2 (Raghava, 2002); DSC (King, Saqi, Sayle, & Sternberg, 1997); HNN
(NPS@ : CLUSTALW ALIGNMENT); PHD (Rost, Sander, & Schneider, 1994); SORMA
150
(Deleage, 1995); Jnet (Cuff, Clamp, Siddiqui, Finlay, & Barton, 1998); MLRC (Guermeur,
Geourjon, Gallinari, & Deleage, 1999) combining GOR4, SIMPA96 and SOPMA; and
SSPRO (Pollastri, Przybylski, Rost, & Baldi, 2002). A score was assigned to each predicted
secondary structures (β-strand, a-helix, coil and turns) per amino acid by each method
applied, to further derive a consensus prediction. Two types of consensus predictions were
computed: the first type was derived from the tools that do not perform alignment before
computing predictions (DPM, PREDATOR and GOR4), and the second type was derived
from the tools that are based on multiple alignments (SIMPA96, PHD, SOPMA, Jnet, DSC,
GORV and PSIPRED). The occurrences of each structural element at a given position were
summed over all the predictions for each set resulting as consensus 1 and consensus 2. The
confidence rate of a consensus prediction at one position was considered as “high” when at
least 75% of the predictions of the set converged.
4. Generation of the models of unbound INHIV, INHIV•vDNAPFV
complex and vDNAHIV
The IN models were constructed using Modeller package 9V8 (Eswar et al., 2003) as we
reported above. The sequence alignment was performed using ClustalW server
(http://www.ebi.ac.uk/Tools/clustalw2/index.html). Briefly, 3D model of the full-length IN
homo-dimer, IN1-270 (unbound state respectively to DNA) was generated by homology
modeling from crystallographic structures of isolated pairs of IN domains, IN1-210 (PDB code:
1K6Y) (Wang et al., 2001) and IN56-270 (PDB code: 1EX4) (Chen et al., 2000). The sequence
of the native HIV-1 IN was aligned to the templates sequences (non wild-type) using
ClustalW (Thompson, Higgins, & Gibson, 1994; Larkin et al., 2007). The missing regions,
namely the linker from residues 47 to 55 and the catalytic site loop, from residues 140 to 148,
were constructed by an ab initio approach as we reported in (Mouscadet et al., 2009). We
shall refer the model with one Mg+2 cation inserted into the active site as reported in structure

151
1BI4 (Maignan et al., 1998) as model 1A, and to the model with two Mg+2 cations inserted as
reported in (Mouscadet et al., 2009) as model 1B.
The 3D model of the IN•vDNA pre-integration complex was generated by homology
modeling from the crystal structure of the PFV IN•vDNA complex (PDB code: 3OYA,
resolution of 2.65 Ǻ) (Hare et al., 2010b; Hare et al., 2010). Despite the low sequence identity
between these two INs (22%), a high conservation of key structural elements in the both
integrases, allowed us to use the PFV IN structure as a template for the HIV-1 IN model
generation. We shall refer to the constructed and optimized model as model 2A. The
stereochemical quality of the models was assessed with ProTable Procheck (Laskowski et al.,
1993).
A 27 base pair model of the vDNA was constructed using the 3D-DART webserver (van
& Bonvin, 2009) according to the following sequence: TAGTCAGTGTGGAAAATCT
CTAGCAGT/complement (Hazuda et al., 2000) in B-form (model 3A). A subsequent model
was generated by removing in silico the two nucleotides GT from the 3’-end of the modelled
vDNA, leaving a CA dinucleotide sequence at the terminal end that is required for integration
(model 3B).
III. Molecular Docking Protocols
1. Integrase Strand Transfer Inhibitors (INSTIs) Binding with
IN and INvDNA Complex of B and CRF02_AG strains
Docking studies of the studied compounds were performed on the models of IN
corresponding to 3-processing and strand transfer pre-integration complex IN•DNA from the
B and CRF02_AG strains using the Glide (Friesner et al., 2004), incorporated in the
Schrödinger suite (Schrödinger Inc.) and the Autodock 4.2 (Morris et al., 2009) algorithms.

152
The initial geometry of the inhibitors was obtained by minimization with the semi-empirical
method AM1 (Dewar, 1993) by using Gaussian03 (Gaussian, Inc.) program in vacuum.
The docking results were compared to the in vitro enzymatic activity of B and
CRF02_AG strains of IN obtained by using steady-state fluorescence anisotropy assay (Ni et
al., 2012).
2. Raltegravir docking onto the targets - INHIV, INHIV•vDNAPFV
complex and vDNAHIV
Recorded configurational (isomeric) and conformational states of RAL (see
Conformational analysis) were used for the inhibitor docking onto the generated models
representing the targets with an extended loop in an open conformation, unbound IN (models
1A and 1B), and the target with a shortened loop and a well-delimited binding site, IN•vDNA
complex (model 2A). The docking was performed by using four algorithms: GLIDE (Friesner
et al., 2004) incorporated in the Schrödinger suite (Schrödinger Inc.), AutoDock 4.2 (Morris
et al., 2009), VINA (Trott & Olson, 2010) and SurFlex (Jain, 2003). The targets were
considered as rigid bodies while the inhibitor was treated as wholly flexible. Before the
docking, the models were prepared (addition of hydrogen atoms, bond order assignment)
according to the given software default requirements.
The conformation of RAL determined by X-ray analysis of PFV IN•DNA complex (PDB
code: 3OYA) was optimized and docked onto the vDNA (models 3A and 3B) using GLIDE.
AutoDock: AutoDock (Morris et al., 2009) is based on a hybrid search method that applies a
Lamarckian genetic algorithm. Exploration of the binding site is based on a global search that
uses a Genetic Algorithm (GA) followed by an adaptive local search method derived from the
optimization algorithm of Solis and Wets which has the advantage of not requiring gradient
153
computation while it performs torsional angles space search. The graphical user interface
(GUI) of AutoDock 4.2 (Morris et al., 2009) was used for preparation of ligand and receptor
files. Grid maps of interaction energies for various atom types were carried out with a grid
box of dimension 25×25×25 Å3 centred on the active site. Calculations were performed with a
population size of 150, number of energy evaluations of 5x10⁶, maximum number of
generations of 27,000 and crossover rate of 0.02 and 0.8, respectively. The number of runs
was set to 100 to explore a large number of poses of the highest affinity and the Solis and
Wets algorithm was used to relax the best 10 % of the obtained conformations. The active site
coordinates were explicitly defined in the input file.
GLIDE: GLIDE 4.5 (Grid-based Ligand Docking with Energetics) (Friesner et al., 2004)
program uses a hierarchical series of filters to search for possible locations of the ligand in the
binding site region of the receptor. The shape and properties of the receptor are represented on
a grid by several sets of fields that provide progressively more accurate scoring of the ligand
poses. Conformational flexibility of the ligand is handled by an extensive conformational
search. Receptor grids were generated by GLIDE within an enclosing box of size 20 Å centred
on the active site. The inhibitor was docked flexibly to these pre-computing grids using
standard precision (SP) scoring (Friesner et al., 2004).
VINA: VINA (Trott & Olson, 2010) uses a gradient optimization method in its local
optimization procedure. It uses an Iterated Local Search global optimizer algorithm where a
succession of steps consisting of a mutation in the context of a genetic algorithm, where it is a
genetic operator that alters one or more gene values in an algorithm chromosome from its
initial state, and a local optimization are taken, with each step being accepted according to the
Metropolis criterion. The general functional form of the conformation-dependent part of the
scoring function VINA works with the summation over all of the pairs of atoms that can move
relative to each other (excluding) 1–4 atoms interactions (Trott & Olson, 2010). The binding
154
site for each receptor was explicitly defined. Grid maps were generated on a grid box with
dimensions 25 Å centered over the binding site of the receptor. The maximum energy
difference between the best and the worst binding mode was set to 4 kcal/mol, while the
exhaustiveness and the maximum number of binding modes were set to 80 and 100,
respectively.
SURFLEX: SurFlex (Jain, 2003) is a relatively new docking algorithm that combines
Hammerhead’s empirical scoring function (Welch, Ruppert, & Jain, 1996) with a molecular
similarity (morphological similarity) to generate putative poses of ligand fragments. It
implements an incremental construction search approach, as in Hammerhead (Welch et al.,
1996) but also implements a new fragment assembly method that is both faster and more
accurate. SurFlex employs an idealized active site ligand (a protomol) as a target to generate
putative poses of molecular fragments. These putative poses are scored using the
Hammerhead function. The protomol was generated with a threshold value of 0.5 and bloat
value of 1 Å. The SurFlex package integrated in SYBYL-X 1.1.1 was used for docking.
The scoring functions of GLIDE, AudoDock, VINA and SurFlex, developed in order to
rank the solutions, give an estimation of the free binding energy DDG of the protein-ligand
interaction. The binding affinity of RAL-IN complexes was expressed in terms of docking
scores. For each RAL conformation, the best-scored pose was saved and analyzed.
IV. Molecular Dynamics Simulations of unbound Integrase
The model of WT IN (as prepared above) was used to generate the R228A mutant
using MODELLER. The initial models of IN were prepared for GROMACS run with
pdb2gmx of GROMACS 4.0 (van der Spoel et al., 2005); The protein topologies were
generated with Amber 99sb-ILDN force field; The hydrogen atoms were then added; In-
vacuum minimization of the IN models (WT and mutant) for 1000 steps was performed using
155
a Steepest-Descent (SD) integrator. The minimized models of WT and mutant were placed in
an octahedral TIP3P water box. The charge of the solvated system was neutralized by adding
Na+ counter ions. The system was then heated up to 300° K at a constant volume using a
modified Berendsen thermostat (Berendsen et al., 1984) while restraining the solute atoms by
1 000 kJ/mol/nm2. The system was then equilibrated for 1 ns under the constant volume and
temperature conditions (NVT). The pressure coupling was also turned “on” using Parrinello-
Rahman barostat (Martonak et al., 2003). Thereafter, two replicas of MD simulations were
produced for the equilibrated system during 50 ns, for each system, separately.
V. Molecular modeling
1. Wild-type IN models
3D models of the WT IN core domain representing cation-free, one- and two-Mg2+ active
sites were generated as follows: (i) X-ray data for 1BI4 and 1BL3 were chosen as the initial
templates (Maignan et al., 1998); crystal structures represent the F185H mutant; for the WT
model, H185 was replaced by F. (ii) In two-cation models, the second Mg2+ ion was inserted
at the catalytic residues D64 and E152, as described for the two-cation structure of 1VSH
(Bujacz et al., 1997). In two-cation models, D64 was considered to act as a ligand bridging the
two metals, and was referred to as a “µ-bridge” (Cotton and Wilkinson, 1999), whereas D116
and E152 were monodentate, bidentate or mixed. (iii) Coordination spheres of the Mg cations
were completed with water molecules to give octahedral coordination, as suggested by
structural data for CSD (Allen, 2002). In all the models considered, one water molecule was
fixed between two Mg2+ cations, forming a second bridge of the µ-aqua type (aqua refers here
to the nature of the second bridging group). (iv) Residues 143–148 were deleted from X-ray
structures and the 3D structure of the loop was reconstituted with two different modeling
156
protocols: a loop-generating algorithm based on database searches known as Protein Loop
Search (Sybyl), and ab initio loop generation with PEP-FOLD. The candidates identified by
Protein Loop Search were compared with the lowest energy solution for peptide structures
generated with PEP-FOLD (see Appendix, Figure 3). The loop yielding the best solution with
both methods was inserted into the target molecule and the coordinates of the fragment atoms
were transformed according to the fragment least-squares fit to anchor regions. (v) H-atoms
were added with the Biopolymer and Build/Edit options (SYBYL). The models generated,
corresponding to different active site structures, were denoted as 0LJ, 1LJ, 2LJ, 3LJ, 4LJ,
and 5LJ (Figure 33).
2. Model minimizations
The Simplex method was used for the initial optimization. Energy minimization of the
wild-type and “mutated” promodels was performed with the Powell algorithm and
Amber/Kollman atom–atom force field, for 10 000 steps, or if the energy gradient was lower
than 0.005 kcal/mol Å. The following parameters were used: a dielectric constant of 1, a
minimization step of 0.001, a scaling factor of 1, an H-bond radius scaling of 0.7 and the non-
bonded interaction list was set to 8 Å. Constraints were defined between Mg2+ ions and the
coordinating oxygen atoms, based on the data for CSD data (Allen, 2002). The stereochemical
quality of the models was assessed with ProTable Procheck (Laskowski et al., 1993), which
showed that more than 97% of the non-glycine residues in all models had dihedral angles in
the most favored and allowed regions of the Ramachandran plot, consistent with high model
quality. The overall folding of the mutant proteins was similar to that of the WT protein and
the RMSD coordinate difference between WT and mutant proteins was small (0.6 Å) for the
common Cα atoms.
157
3. Simulations of the movement of the 140–149 loop towards
the catalytic site
Simulations of 140–149 loop movement were carried out with the one- (1LJ) and two-
cation (2LJ) models for WT and mutated IN. We compared the total energy and conformation
of intermediate states by carrying out energy minimization for the protein structures of the IN
models, with different distances between two centroids: C1, describing the center of gravity of
the Ω-shaped hairpin and C2, corresponding to the center of gravity of the active site. The
movement was simulated in 2 Å steps, extending from 16 (open form) to 4.5 Å (closed form)
for models, 1LJ and 2LJ.
4. Characterization of the side-chains and DNA base
interaction
We investigated two types of molecular complex deposited in the PDB, for analyses of
side chain-DNA base interactions: (i) protein/DNA complexes and (ii) protein–ligand
complexes with nucleic acid bases as the ligands. The protein/DNA complexes were analyzed
for H-bonding and van der Waals contacts, using the “Atlas of Protein Side-Chain
Interactions” (Singh and Thornton, 1992). The number of contacts identified between the loop
side chains and DNA bases were represented graphically as superimposed diagrams of H-
bonds and van der Waals contacts. H-bonding between amino acid 148 or 155 and DNA bases
was characterized in details with IsoStar 2.0 (Bruno et al., 1997). Data extracted from X-ray
structures (resolution > 2.0 Å) of protein–ligand complexes (nucleic acid bases as ligands) are
presented as scatterplots, showing the distribution of a contact group (side chain) around a
specified central group (DNA base). Groups with chemical functions found in natural amino
acids were included in the analysis. Carbamoyl is a functional group of N and Q, guaniduim is
a functional group of R, imidazol is a functional group of H, and the cationic C

158
NH3 group is a functional group of K. The ionization states of acidic and basic groups could
not be determined unambiguously from protein structures. These groups were combined for
PDB-based plots. The primary IsoStar scatterplots were stored in a modeling format, mol2,
and used for further analysis. For these data only, interactions were considered for distances
up to 3.4 Å (van der Waals overlaps) and contacting groups involved in π–π interactions were
excluded from the analysis. The H-atoms of groups involved in H-bonding were placed in
normalized positions. The resulting 3D distributions of side-chain-like fragments around the
individual bases were superimposed to represent the A–T and G–C base-pair environment.

159
REFERENCES
Agapkina, J., Smolov, M., Barbe, S., Zubin, E., Zatsepin, T., Deprez, E. et al. (2006). Probing of HIV-1 integrase/DNA interactions using novel analogs of viral DNA. Journal of Biological Chemistry,
281, 11530-11540.
Allen, F. H. (2002). The Cambridge Structural Database: a quarter of a million crystal structures and rising. Acta Crystallogr.B, 58, 380-388.
Aloy, P., Moont, G., Gabb, H. A., Querol, E., Aviles, F. X., & Sternberg, M. J. (1998). Modeling
repressor proteins docking to DNA. Proteins, 33, 535-549.
Ammar FF, Abdel-Azeim S, Zargarian L, Hobaika Z, Maroun RG, Fermandjian S. (2012). Unprocessed Viral DNA Could Be the Primary Target of the HIV-1 Integrase Inhibitor Raltegravir. PLoS One.;7(7):e40223.
Arhel, N. J., Souquere-Besse, S., Munier, S., Souque, P., Guadagnini, S., Rutherford, S. et al. (2007).
HIV-1 DNA Flap formation promotes uncoating of the pre-integration complex at the nuclear pore. Embo Journal, 26, 3025-3037.
Arora R. and Tchertanov L. (2012). The HIV-1 Integrase: Modeling and Beyond. Chapter in the Book “An Integrated View of the Molecular Recognition and Toxicology - From Analytical Procedures
to Biomedical Applications”. INTECH. ISBN 980-953-307-586-5.
Asante-Appiah, E. & Skalka, A. M. (1999). HIV-1 integrase: structural organization, conformational changes, and catalysis. Adv.Virus Res., 52, 351-369.
Ason, B., Knauss, D. J., Balke, A. M., Merkel, G., Skalka, A. M., & Reznikoff, W. S. (2005). Targeting Tn5 transposase identifies human immunodeficiency virus type 1 inhibitors. Antimicrobial Agents and Chemotherapy, 49, 2035-2043.
Banitt, I. & Wolfson, H. J. (2011). ParaDock: a flexible non-specific DNA--rigid protein docking algorithm. Nucleic Acids Res., 39, e135.
Bar-Magen, T., Sloan, R. D., Faltenbacher, V. H., Donahue, D. A., Kuhl, B. D., Oliveira, M. et al. (2009). Comparative biochemical analysis of HIV-1 subtype B and C integrase enzymes. Retrovirology, 6. 103.
Barre-Sinoussi, F., Chermann, J. C., Rey, F., Nugeyre, M. T., Chamaret, S., Gruest, J. et al. (1983). Isolation of a T-lymphotropic retrovirus from a patient at risk for acquired immune deficiency syndrome (AIDS). Science, 220, 868-871.
Barreca, M. L., De Luca, L., Iraci, N., & Chimirri, A. (2006). Binding mode prediction of strand transfer HIV-1 integrase inhibitors using Tn5 transposase as a plausible surrogate model for HIV-1 integrase. Journal of Medicinal Chemistry, 49, 3994-3997.
Barreca, M. L., Ferro, S., Rao, A., De Luca, L., Zappala, M., Monforte, A. M. et al. (2005). Pharmacophore-based design of HIV-1 integrase strand-transfer inhibitors. Journal of Medicinal
Chemistry, 48, 7084-7088.
Barreca, M. L., Iraci, N., De Luca, L., & Chimirri, A. (2009). Induced-Fit Docking Approach Provides Insight into the Binding Mode and Mechanism of Action of HIV-1 Integrase Inhibitors. Chemmedchem, 4, 1446-1456.

160
Barreca, M. L., Lee, K. W., Chimirri, A., & Briggs, J. M. (2003). Molecular dynamics studies of the wild-type and double mutant HIV-1 integrase complexed with the 5CITEP inhibitor: Mechanism for inhibition and drug resistance. Biophysical Journal, 84, 1450-1463.
Beese, L. S. & Steitz, T. A. (1991). Structural Basis for the 3'-5' Exonuclease Activity of Escherichia-Coli Dna-Polymerase-I - A 2 Metal-Ion Mechanism. Embo Journal, 10, 25-33.
Berendsen, H. J. C., Postma, J. P. M., Vangunsteren, W. F., Dinola, A., & Haak, J. R. (1984). Molecular-Dynamics with Coupling to An External Bath. Journal of Chemical Physics, 81, 3684-3690.
Berger, E. A., Murphy, P. M., & Farber, J. M. (1999). Chemokine receptors as HIV-1 coreceptors:
roles in viral entry, tropism, and disease. Annu.Rev.Immunol., 17, 657-700.
Berman, H. M., Westbrook, J., Feng, Z., Gilliland, G., Bhat, T. N., Weissig, H. et al. (2000). The Protein Data Bank. Nucleic Acids Research, 28, 235-242.
Boeckmann, B., Bairoch, A., Apweiler, R., Blatter, M. C., Estreicher, A., Gasteiger, E. et al. (2003).
The SWISS-PROT protein knowledgebase and its supplement TrEMBL in 2003. Nucleic Acids
Res., 31, 365-370.
Bohm, H. J. (1995). Site-directed structure generation by fragment-joining. Perspectives in Drug
Discovery and Design, 3, 21-33.
Brendesen, H. J. C. (1984). Molecular dynamics with coupling to an external bath. J.Chem.Phys, 81, 3684-3690.
Brigo, A., Lee, K. W., Fogolari, F., Mustata, G. L., & Briggs, J. M. (2005). Comparative molecular dynamics simulations of HIV-1 integrase and the T66I/M154I mutant: Binding modes and drug resistance to a diketo acid inhibitor. Proteins-Structure Function and Bioinformatics, 59, 723-741.
Brooks, B. R., Brooks, C. L., Mackerell, A. D., Nilsson, L., Petrella, R. J., Roux, B. et al. (2009). CHARMM: The Biomolecular Simulation Program. Journal of Computational Chemistry, 30, 1545-1614.
Brooks, B. R., Bruccoleri, R. E., Olafson, B. D., States, D. J., Swaminathan, S., & Karplus, M. (1983). Charmm - A Program for Macromolecular Energy, Minimization, and Dynamics Calculations 1. Journal of Computational Chemistry, 4, 187-217.
Brown, P. O. (1990). Integration of Retroviral DNA. Current Topics in Microbiology and
Immunology, 157, 19-48. Bruno, I. J., Cole, J. C., Lommerse, J. P. M., Rowland, R. S., Taylor, R., & Verdonk, M. L. (1997).
IsoStar: A library of information about nonbonded interactions. Journal of Computer-Aided
Molecular Design, 11, 525-537. Bujacz, G., Alexandratos, J., Wlodawer, A., Merkel, G., Andrake, M., Katz, R. A. et al. (1997).
Binding of different divalent cations to the active site of avian sarcoma virus integrase and their effects on enzymatic activity. J.Biol.Chem., 272, 18161-18168.
Bujacz, G., Alexandratos, J., ZhouLiu, Q., ClementMella, C., & Wlodawer, A. (1996). The catalytic domain of human immunodeficiency virus integrase: Ordered active site in the F185H mutant. Febs Letters, 398, 175-178.

161
Cai, M., Zheng, R., Caffrey, M., Craigie, R., Clore, G. M., & Gronenborn, A. M. (1997). Solution structure of the N-terminal zinc binding domain of HIV-1 integrase. Nat.Struct.Biol., 4, 567-577.
Ceccherini-Silberstein, F. (2010). Primary mutations associated with resistance to raltegravir are not detectable by pyrosequencing in integrase inhibitors-naive patients. Armenia, D, D'Arrigo, R., Vandebroucke, I, Van Marck, H, Rizzardini, G, Narciso, P, Antinori, A., Stuyver, L. J., and Perno, C. F. In: 17th Conference on RetrovirusesandOpportunistic Infections (CROI), San Fransisco, February16–19 (abstract #566).
Ceccherini-Silberstein, F., Malet, I., D'Arrigo, R., Antinori, A., Marcelin, A. G., & Perno, C. F.
(2009). Characterization and Structural Analysis of HIV-1 Integrase Conservation. Aids Reviews,
11, 17-29.
Centers for Disease Control (1981a). Pneumocystis Pneumonia --- Los Angeles. MMWR
Morb.Mortal.Wkly.Rep., 30, 1-3.
Centers for Disease Control (1981b). Kaposi's sarcoma and Pneumocystis pneumonia among homosexual men--New York City and California. MMWR Morb.Mortal.Wkly.Rep., 30, 305-308.
Centers for Disease Control (1982). Update on acquired immune deficiency syndrome (AIDS)-United States. MMWR Morb.Mortal.Wkly.Rep., 31.
Cihlar, T. and Ray, A. S. (2010). Nucleoside and nucleotide HIV reverse transcriptase inhibitors: 25 years after zidovudine. Antiviral Res. 85(1), 39-58.
Chakrabarti, L., Guyader, M., Alizon, M., Daniel, M. D., Desrosiers, R. C., Tiollais, P. et al. (1987). Sequence of simian immunodeficiency virus from macaque and its relationship to other human and simian retroviruses. Nature, 328, 543-547.
Chalifoux, L. V., Ringler, D. J., King, N. W., Sehgal, P. K., Desrosiers, R. C., Daniel, M. D. et al. (1987). Lymphadenopathy in macaques experimentally infected with the simian immunodeficiency virus (SIV). Am.J.Pathol., 128, 104-110.
Charpentier, C., Karmochkine, M., Laureillard, D., Tisserand, P., Belec, L., Weiss, L. et al. (2008). Drug resistance profiles for the HIV integrase gene in patients failing raltegravir salvage therapy. Hiv Medicine, 9, 765-770.
Chen, A. P., Weber, I. T., Harrison, R. W., & Leis, J. (2006). Identification of amino acids in HIV-1 and avian sarcoma virus integrase subsites required for specific recognition of the long terminal repeat ends. Journal of Biological Chemistry, 281, 4173-4182.
Chen, J. C. H., Krucinski, J., Miercke, L. J. W., Finer-Moore, J. S., Tang, A. H., Leavitt, A. D. et al. (2000). Crystal structure of the HIV-1 integrase catalytic core and C-terminal domains: A model for viral DNA binding. Proceedings of the National Academy of Sciences of the United States of
America, 97, 8233-8238.
Chen, X., Tsiang, M., Yu, F., Hung, M., Jones, G. S., Zeynalzadegan, A. et al. (2008). Modeling, analysis, and validation of a novel HIV integrase structure provide insights into the binding modes of potent integrase inhibitors. Journal of Molecular Biology, 380, 504-519.
Chen, X. H. & Zhang, J. Z. (2004). Theoretical method for full ab initio calculation of DNA/RNA-ligand interaction energy. J.Chem Phys, 120, 11386-11391.
Chen, Z., Yan, Y., Munshi, S., Li, Y., Zugay-Murphy, J., Xu, B. et al. (2000). X-ray structure of simian immunodeficiency virus integrase containing the core and C-terminal domain (residues 50-293)--an initial glance of the viral DNA binding platform. J.Mol.Biol., 296, 521-533.
162
Cheng, A. C., Chen, W. W., Fuhrmann, C. N., & Frankel, A. D. (2003). Recognition of nucleic acid bases and base-pairs by hydrogen bonding to amino acid side-chains. Journal of Molecular
Biology, 327, 781-796. Chirch, L. M., Morrison, S., & Steigbigel, R. T. (2009). Treatment of HIV infection with raltegravir.
Expert.Opin.Pharmacother., 10, 1203-1211.
Chiu, T. K. & Davies, D. R. (2004). Structure and function of HIV-1 integrase. Current Topics in
Medicinal Chemistry, 4, 965-977. Chothia, C. & Lesk, A. M. (1986). The relation between the divergence of sequence and structure in
proteins. EMBO J., 5, 823-826.
Clavel, F. & Hance, A. J. (2004). HIV drug resistance. N.Engl.J.Med., 350, 1023-1035.
Cooper, D. A., Steigbigel, R. T., Gatell, J. M., Rockstroh, J. K., Katlama, C., Yeni, P. et al. (2008). Subgroup and resistance analyses of raltegravir for resistant HIV-1 infection. New England Journal
of Medicine, 359, 355-365.
Cortes-Cabrera, A., Gago, F., & Morreale, A. (2012). A reverse combination of structure-based and ligand-based strategies for virtual screening. J.Comput.Aided Mol.Des, 26, 319-327.
Croxtall, J. D. & Keam, S. J. (2009). Raltegravir: a review of its use in the management of HIV infection in treatment-experienced patients. Drugs, 69, 1059-1075.
Crum, N. F., Riffenburgh, R. H., Wegner, S., Agan, B. K., Tasker, S. A., Spooner, K. M. et al. (2006). Comparisons of causes of death and mortality rates among HIV-infected persons: analysis of the pre-, early, and late HAART (highly active antiretroviral therapy) eras. J.Acquir.Immune
Defic.Syndr., 41, 194-200.
Costin, J. M. (2007).Cytopathic mechanisms of HIV-1. Virol.J. 4, 100.
CSD (1994). Vista - A Program for the Analysis and Display of Data Retrieved from the CSD. [Computer software]. Cambridge Crystallographic Data Centre, 12 Union Road, Cambridge, England.
Cuff, J. A., Clamp, M. E., Siddiqui, A. S., Finlay, M., & Barton, G. J. (1998). JPred: a consensus secondary structure prediction server. Bioinformatics, 14, 892-893.
Dalgleish, A. G., Beverley, P. C., Clapham, P. R., Crawford, D. H., Greaves, M. F., & Weiss, R. A. (1984). The CD4 (T4) antigen is an essential component of the receptor for the AIDS retrovirus. Nature, 312, 763-767.
Davies, D. R., Goryshin, I. Y., Reznikoff, W. S., & Rayment, I. (2000). Three-dimensional structure of the Tn5 synaptic complex transposition intermediate. Science, 289, 77-85.
De Luca, L., Vistoli, G., Pedretti, A., Barreca, M. L., & Chimirri, A. (2005). Molecular dynamics studies of the full-length integrase-DNA complex. Biochemical and Biophysical Research
Communications, 336, 1010-1016.
De Luca L, Ferro S, Gitto R, Barreca ML, Agnello S, Christ F, et al. Small molecules targeting the interaction between HIV-1 integrase and LEDGF/p75 cofactor. Bioorg Med Chem. 2010 Nov 1;18(21):7515-21.
163
De, L. L., Pedretti, A., Vistoli, G., Barreca, M. L., Villa, L., Monforte, P. et al. (2003). Analysis of the full-length integrase-DNA complex by a modified approach for DNA docking. Biochem.Biophys.Res.Commun., 310, 1083-1088.
de Silva, T. I., Cotten, M., and Rowland-Jones, S. L.(2008). HIV-2: the forgotten AIDS virus. Trends
Microbiol. 16(12),588-595.
Delelis, O., Malet, I., Na, L., Tchertanov, L., Calvez, V., Marcelin, A. G. et al. (2009). The G140S mutation in HIV integrases from raltegravir-resistant patients rescues catalytic defect due to the resistance Q148H mutation. Nucleic Acids Research, 37, 1193-1201.
Delelis, O., Thierry, S., Subra, F., Simon, F., Malet, I., Alloui, C. et al. (2010). Impact of Y143 HIV-1 Integrase Mutations on Resistance to Raltegravir In Vitro and In Vivo. Antimicrobial Agents and
Chemotherapy, 54, 491-501.
Descamps, D., Apetrei, C., Collin, G., Damond, F., Simon, F., & Brun-Vezinet, F. (1998). Naturally occurring decreased susceptibility of HIV-1 subtype G to protease inhibitors. AIDS, 12, 1109-1111.
Descamps, D., Chaix, M. L., Montes, B., Pakianather, S., Charpentier, C., Storto, A. et al. (2010). Increasing prevalence of transmitted drug resistance mutations and non-B subtype circulation in antiretroviral-naive chronically HIV-infected patients from 2001 to 2006/2007 in France. J.Antimicrob.Chemother., 65, 2620-2627.
Dewar, M. J. S. (1993). The Semi-Abinitio (Sa) Approach to Chemistry. Organic Mass Spectrometry,
28, 305-310.
Dhaked, D. K., Verma, J., Saran, A., & Coutinho, E. C. (2009). Exploring the binding of HIV-1 integrase inhibitors by comparative residue interaction analysis (CoRIA). Journal of Molecular
Modeling, 15, 233-245.
Dhaked, D. K., Verma, J., Saran, A., & Coutinho, E. C. (2009). Exploring the binding of HIV-1 integrase inhibitors by comparative residue interaction analysis (CoRIA). Journal of Molecular
Modeling, 15, 233-245.
Dolan, J., Chen, A. P., Weber, I. T., Harrison, R. W., & Leis, J. (2009). Defining the DNA Substrate Binding Sites on HIV-1 Integrase. Journal of Molecular Biology, 385, 568-579.
Dybul, M., Fauci, A. S., Bartlett, J. G., Kaplan, J. E., & Pau, A. K. (2002). Guidelines for using antiretroviral agents among HIV-infected adults and adolescents. Ann.Intern.Med., 137, 381-433.
Dyda, F., Hickman, A. B., Jenkins, T. M., Engelman, A., Craigie, R., & Davies, D. R. (1994). Crystal structure of the catalytic domain of HIV-1 integrase: similarity to other polynucleotidyl transferases. Science, 266, 1981-1986.
Efimov, A. V. (1993a). Patterns of Loop Regions in Proteins. Current Opinion in Structural Biology,
3, 379-384. Efimov, A. V. (1993b). Standard Structures in Proteins. Progress in Biophysics & Molecular Biology,
60, 201-239. Eijkelenboom, A. P., Lutzke, R. A., Boelens, R., Plasterk, R. H., Kaptein, R., & Hard, K. (1995). The
DNA-binding domain of HIV-1 integrase has an SH3-like fold. Nat.Struct.Biol., 2, 807-810.
Ellison, V., Gerton, J., Vincent, K. A., & Brown, P. O. (1995). An essential interaction between distinct domains of HIV-1 integrase mediates assembly of the active multimer. J.Biol.Chem., 270, 3320-3326.
164
Emiliani, S., Mousnier, A., Busschots, K., Maroun, M., Van Maele, B., Tempe, D. et al. (2005). Integrase mutants defective for interaction with LEDGF/p75 are impaired in chromosome tethering and HIV-1 replication. Journal of Biological Chemistry, 280, 25517-25523.
Espeseth, A. S., Felock, P., Wolfe, A., Witmer, M., Grobler, J., Anthony, N. et al. (2000). HIV-1 integrase inhibitors that compete with the target DNA substrate define a unique strand transfer conformation for integrase. Proceedings of the National Academy of Sciences of the United States
of America, 97, 11244-11249. Esposito, D. & Craigie, R. (1998). Sequence specificity of viral end DNA binding by HIV-1 integrase
reveals critical regions for protein-DNA interaction. EMBO J., 17, 5832-5843.
Este, J. A. & Telenti, A. (2007). HIV entry inhibitors. Lancet, 370, 81-88.
Eswar, N., John, B., Mirkovic, N., Fiser, A., Ilyin, V. A., Pieper, U. et al. (2003). Tools for comparative protein structure modeling and analysis. Nucleic Acids Research, 31, 3375-3380.
Faure, A., Calmels, C., Desjobert, C., Castroviejo, M., Caumont-Sarcos, A., Tarrago-Litvak, L. et al. (2005). HIV-1 integrase crosslinked oligomers are active in vitro. Nucleic Acids Res., 33, 977-986.
Feng, M., Patel, D., Dervan, J. J., Ceska, T., Suck, D., Haq, I. et al. (2004). Roles of divalent metal ions in flap endonuclease-substrate interactions. Nature Structural & Molecular Biology, 11, 450-456.
Fenollar-Ferrer, C., Carnevale, V., Raugei, S., & Carloni, P. (2008). HIV-1 integrase-DNA interactions investigated by molecular modelling. Computational and Mathematical Methods in
Medicine, 9, 231-243.
Fetrow, J. S. (1995). Protein Motifs .6. Omega-Loops - Nonregular Secondary Structures Significant in Protein Function and Stability. FASEB Journal, 9, 708-717.
Fischetti, L., Opare-Sem, O., Candotti, D., Lee, H., & Allain, J. P. (2004). Higher viral load may
explain the dominance of CRF02_AG in the molecular epidemiology of HIV in Ghana. Aids, 18, 1208-1210.
Fischetti, L., Opare-Sem, O., Candotti, D., Sarkodie, F., Lee, H., & Allain, J. P. (2004). Molecular epidemiology of HIV in Ghana: dominance of CRF02_AG. J.Med.Virol., 73, 158-166.
Friesner & R.A (1987). Solution of the Hartree-Fock equations for polyatomic molecules by a pseudospectral method. Journal of Chemical Physics, 86, 3522-3531.
Flexner, C. (1998). HIV-protease inhibitors. N.Engl.J.Med. 338(18), 1281-1292.
Friesner, R. A., Banks, J. L., Murphy, R. B., Halgren, T. A., Klicic, J. J., Mainz, D. T. et al. (2004). Glide: A new approach for rapid, accurate docking and scoring. 1. Method and assessment of docking accuracy. Journal of Medicinal Chemistry, 47, 1739-1749.
Frishman, D. & Argos, P. (1995). Knowledge-based protein secondary structure assignment. Proteins-
Structure Function and Genetics, 23, 566-579. Gallo, R. C., Salahuddin, S. Z., Popovic, M., Shearer, G. M., Kaplan, M., Haynes, B. F. et al. (1984).
Frequent detection and isolation of cytopathic retroviruses (HTLV-III) from patients with AIDS and at risk for AIDS. Science, 224, 500-503.

165
Gallo, R. C., Sarin, P. S., Gelmann, E. P., Robert-Guroff, M., Richardson, E., Kalyanaraman, V. S. et al. (1983). Isolation of human T-cell leukemia virus in acquired immune deficiency syndrome (AIDS). Science, 220, 865-867.
Gao, K., Butler, S. L., & Bushman, F. (2001). Human immunodeficiency virus type 1 integrase: arrangement of protein domains in active cDNA complexes. EMBO J., 20, 3565-3576.
Garnier, J., Gibrat, J. F., & Robson, B. (1996). GOR method for predicting protein secondary structure from amino acid sequence. Computer Methods for Macromolecular Sequence Analysis, 266, 540-553.
Ghosn, J., Mazet, A. A., Avettand-Fenoel, V., Peytavin, G., Wirden, M., Delfraissy, J. F. et al. (2009). Rapid selection and archiving of mutation E157Q in HIV-1 DNA during short-term low-level replication on a raltegravir-containing regimen. J.Antimicrob.Chemother., 64, 433-434.
Glass, T. R., De, G. S., Hirschel, B., Battegay, M., Furrer, H., Covassini, M. et al. (2008). Self-reported non-adherence to antiretroviral therapy repeatedly assessed by two questions predicts treatment failure in virologically suppressed patients. Antivir.Ther., 13, 77-85.
Goethals, O., Clayton, R., Van Ginderen, M., Vereycken, I., Wagemans, E., Geluykens, P. et al. (2008). Resistance Mutations in Human Immunodeficiency Virus Type 1 Integrase Selected with Elvitegravir Confer Reduced Susceptibility to a Wide Range of Integrase Inhibitors. Journal of
Virology, 82, 10366-10374.
Goldgur, Y., Craigie, R., Cohen, G. H., Fujiwara, T., Yoshinaga, T., Fujishita, T. et al. (1999). Structure of the HIV-1 integrase catalytic domain complexed with an inhibitor: A platform for antiviral drug design. Proceedings of the National Academy of Sciences of the United States of
America, 96, 13040-13043. Goldgur, Y., Dyda, F., Hickman, A. B., Jenkins, T. M., Craigie, R., & Davies, D. R. (1998). Three
new structures of the core domain of HIV-1 integrase: An active site that binds magnesium. Proceedings of the National Academy of Sciences of the United States of America, 95, 9150-9154.
Greenwald, J., Le, V., Butler, S. L., Bushman, F. D., & Choe, S. (1999). The mobility of an HIV-1
integrase active site loop is correlated with catalytic activity. Biochemistry, 38, 8892-8898. Grinsztejn, B., Nguyen, B. Y., Katlama, C., Gatell, J. M., Lazzarin, A., Vittecoq, D. et al. (2007).
Safety and efficacy of the HIV-1 integrase inhibitor raltegravir (MK-0518) in treatment-experienced patients with multidrug-resistant virus: a phase II randomised controlled trial. Lancet,
369, 1261-1269.
Grobler, J. A., Stillmock, K., Hu, B. H., Witmer, M., Felock, P., Espeseth, A. S. et al. (2002). Diketo acid inhibitor mechanism and HIV-1 integrase: Implications for metal binding in the active site of phosphotransferase enzymes. Proceedings of the National Academy of Sciences of the United
States of America, 99, 6661-6666.
Gschwend, D. A., Good, A. C., & Kuntz, I. D. (1996). Molecular docking towards drug discovery. J.Mol.Recognit., 9, 175-186.
Guermeur, Y., Geourjon, C., Gallinari, P., & Deleage, G. (1999). Improved performance in protein secondary structure prediction by inhomogeneous score combination. Bioinformatics, 15, 413-421.
Guiot, E., Carayon, K., Delelis, O., Simon, F., Tauc, P., Zubin, E. et al. (2006). Relationship between the oligomeric status of HIV-1 integrase on DNA and enzymatic activity. J.Biol.Chem., 281, 22707-22719.
166
Hamel, D. J., Sankale, J. L., Eisen, G., Meloni, S. T., Mullins, C., Gueye-Ndiaye, A., Mboup, S., and Kanki, P. J. (2007). Twenty years of prospective molecular epidemiology in Senegal: changes in HIV diversity. AIDS Res.Hum.Retroviruses 23(10), 1189-1196.
Hajduk, P. J. & Greer, J. (2007). A decade of fragment-based drug design: strategic advances and lessons learned. Nat.Rev.Drug Discov., 6, 211-219.
Hahn, B. H., Shaw, G. M., Taylor, M. E., Redfield, R. R., Markham, P. D., Salahuddin, S. Z. et al. (1986). Genetic variation in HTLV-III/LAV over time in patients with AIDS or at risk for AIDS. Science, 232, 1548-1553.
Hare, S., Gupta, S. S., Valkov, E., Engelman, A., & Cherepanov, P. (2010a). Retroviral intasome assembly and inhibition of DNA strand transfer. Nature, 464, 232-236.
Hare, S., Vos, A. M., Clayton, R. F., Thuring, J. W., Cummings, M. D., & Cherepanov, P. (2010b). Molecular mechanisms of retroviral integrase inhibition and the evolution of viral resistance. Proc.Natl.Acad.Sci.U.S.A, 107, 20057-20062.
Harrigan, P. R., Hogg, R. S., Dong, W. W., Yip, B., Wynhoven, B., Woodward, J. et al. (2005). Predictors of HIV drug-resistance mutations in a large antiretroviral-naive cohort initiating triple antiretroviral therapy. J.Infect.Dis., 191, 339-347.
Harper, M. E., Marselle, L. M., Gallo, R. C., & Wong-Staal, F. (1986). Detection of lymphocytes expressing human T-lymphotropic virus type III in lymph nodes and peripheral blood from infected individuals by in situ hybridization. Proc.Natl.Acad.Sci.U.S.A, 83, 772-776.
Hatano, H., Lampiris, H., Fransen, S., Gupta, S., Huang, W., Hoh, R. et al. (2010). Evolution of integrase resistance during failure of integrase inhibitor-based antiretroviral therapy. J.Acquir.Immune Defic.Syndr., 54, 389-393.
Hazuda, D. J., Felock, P., Witmer, M., Wolfe, A., Stillmock, K., Grobler, J. A. et al. (2000). Inhibitors of strand transfer that prevent integration and inhibit HIV-1 replication in cells. Science, 287, 646-650.
Hazuda, D. J., Miller, M. D., Nguyen, B. Y., & Zhao, J. (2007). Resistance to the HIV-integrase inhibitor raltegravir: analysis of protocol 005, a Phase II study in patients with triple-class resistant HIV-1 infection. Antiviral Therapy, 12, S10.
Hazuda, D. J., Young, S. D., Guare, J. P., Anthony, N. J., Gomez, R. P., Wai, J. S. et al. (2004). Integrase inhibitors and cellular immunity suppress retroviral replication in rhesus macaques. Science, 305, 528-532.
Heeney, J. L., Dalgleish, A. G., & Weiss, R. A. (2006). Origins of HIV and the evolution of resistance to AIDS. Science, 313, 462-466.
Hemelaar, J., Gouws, E., Ghys, P. D., & Osmanov, S. (2011). Global trends in molecular epidemiology of HIV-1 during 2000-2007. Aids, 25, 679-689.
Heuer, T. S. & Brown, P. O. (1997). Mapping features of HIV-1 integrase near selected sites on viral and target DNA molecules in an active enzyme-DNA complex by photo-cross-linking. Biochemistry, 36, 10655-10665.
Heuer, T. S. & Brown, P. O. (1998). Photo-cross-linking studies suggest a model for the architecture
of an active human immunodeficiency virus type 1 integrase-DNA complex. Biochemistry, 37, 6667-6678.
167
Hu, X., Balaz, S., & Shelver, W. H. (2004). A practical approach to docking of zinc metalloproteinase inhibitors. Journal of Molecular Graphics & Modelling, 22, 293-307.
Huang, S. Y. & Zou, X. Q. (2010). Advances and Challenges in Protein-Ligand Docking. International Journal of Molecular Sciences, 11, 3016-3034.
Humphrey, G. R., Pye, P. J., Zhong, Y. L., Angelaud, R., Askin, D., Belyk, K. M. et al. (2011). Development of a Second-Generation, Highly Efficient Manufacturing Route for the HIV Integrase Inhibitor Raltegravir Potassium. Organic Process Research & Development, 15, 73-83.
Hutchinson, E. G. & Thornton, J. M. (1994). A Revised Set of Potentials for Beta-Turn Formation in Proteins. Protein Science, 3, 2207-2216.
Iwamoto, M., Wenning, L. A., Petry, A. S., Laethem, M., De, S. M., Kost, J. T. et al. (2008). Safety, tolerability, and pharmacokinetics of raltegravir after single and multiple doses in healthy subjects. Clin.Pharmacol.Ther., 83, 293-299.
Jacks, T., Power, M. D., Masiarz, F. R., Luciw, P. A., Barr, P. J., & Varmus, H. E. (1988). Characterization of ribosomal frameshifting in HIV-1 gag-pol expression. Nature, 331, 280-283.
Jain, A. N. (2003). Surflex: Fully automatic flexible molecular docking using a molecular similarity-based search engine. Journal of Medicinal Chemistry, 46, 499-511.
Jones, G. & Willett, P. (1995). Docking small-molecule ligands into active sites. Curr.Opin.Biotechnol., 6, 652-656.
Kabsch, W. & Sander, C. (1983). Dictionary of Protein Secondary Structure - Pattern-Recognition of Hydrogen-Bonded and Geometrical Features. Biopolymers, 22, 2577-2637.
Kanki, P. J., Hamel, D. J., Sankale, J. L., Hsieh, C., Thior, I., Barin, F. et al. (1999). Human immunodeficiency virus type 1 subtypes differ in disease progression. J.Infect.Dis., 179, 68-73.
Kantor, R., Katzenstein, D. A., Efron, B., Carvalho, A. P., Wynhoven, B., Cane, P. et al. (2005). Impact of HIV-1 subtype and antiretroviral therapy on protease and reverse transcriptase genotype: results of a global collaboration. PLoS.Med., 2, e112.
Karki, R. G., Tang, Y., Burke, T. R., & Nicklaus, M. C. (2004). Model of full-length HIV-1 integrase complexed with viral DNA as template for anti-HIV drug design. Journal of Computer-Aided
Molecular Design, 18, 739-760.
Karplus, M. (2002). Molecular dynamics simulations of biomolecules. Acc.Chem.Res., 35, 321-323.
Karplus, M. & Kuriyan, J. (2005). Molecular dynamics and protein function. Proc.Natl.Acad.Sci.U.S.A, 102, 6679-6685.
Kawasuji, T., Fuji, M., Yoshinaga, T., Sato, A., Fujiwara, T., & Kiyama, R. (2006a). A platform for designing HIV integrase inhibitors. Part 2: A two-metal binding model as a potential mechanism of HIV integrase inhibitors. Bioorganic & Medicinal Chemistry, 14, 8420-8429.
Kawasuji, T., Yoshinaga, T., Sato, A., Yodo, M., Fujiwara, T., & Kiyama, R. (2006). A platform for designing HIV integrase inhibitors. Part 1: 2-hydroxy-3-heteroaryl acrylic acid derivatives as novel HIV integrase inhibitor and modeling of hydrophilic and hydrophobic pharmacophores. Bioorganic
& Medicinal Chemistry, 14, 8430-8445.
King, R. D., Saqi, M., Sayle, R., & Sternberg, M. J. E. (1997). DSC: public domain protein secondary structure prediction. Computer Applications in the Biosciences, 13, 473-474.
168
Kobayashi, M., Nakahara, K., Seki, T., Miki, S., Kawauchi, S., Suyama, A. et al. (2008). Selection of diverse and clinically relevant integrase inhibitor-resistant human immunodeficiency virus type 1 mutants. Antiviral Research, 80, 213-222.
Kohlstaedt, L. A., Wang, J., Friedman, J. M., Rice, P. A., and Steitz, T. A. (1992). Crystal structure at 3.5 A resolution of HIV-1 reverse transcriptase complexed with an inhibitor. Science 256(5065), 1783-1790..
Korber, B., Muldoon, M., Theiler, J., Gao, F., Gupta, R., Lapedes, A. et al. (2000). Timing the ancestor of the HIV-1 pandemic strains. Science, 288, 1789-1796.
Korolev S, Agapkina Yu, Gottikh M. Clinical Use of Inhibitors of HIV-1 Integration: Problems and Prospects. Acta Naturae 2011;3;3:12-28.
Krovat, E. M., Steindl, T., & Langer, T. (2005). Recent Advances in Docking and Scoring. Current
Computer-Aided Drug Design, 1, 93-102. Kumar, G. N., Rodrigues, A. D., Buko, A. M., & Denissen, J. F. (1996). Cytochrome P450-mediated
metabolism of the HIV-1 protease inhibitor ritonavir (ABT-538) in human liver microsomes. J.Pharmacol.Exp.Ther., 277, 423-431.
Lane, H. C. & Fauci, A. S. (1985). Immunologic abnormalities in the acquired immunodeficiency syndrome. Annu.Rev.Immunol., 3, 477-500.
Langley, D. R., Samanta, H. K., Lin, Z., Walker, M. A., Krystal, M. R., & Dicker, I. B. (2008). The terminal (catalytic) adenosine of the HIV LTR controls the kinetics of binding and dissociation of HIV integrase strand transfer inhibitors. Biochemistry, 47, 13481-13488.
Larkin, M. A., Blackshields, G., Brown, N. P., Chenna, R., McGettigan, P. A., McWilliam, H. et al. (2007). Clustal W and clustal X version 2.0. Bioinformatics, 23, 2947-2948.
Laskowski, R. A., Macarthur, M. W., Moss, D. S., & Thornton, J. M. (1993). Procheck - A Program to Check the Stereochemical Quality of Protein Structures. Journal of Applied Crystallography, 26, 283-291.
Lataillade, M., Chiarella, J., & Kozal, M. J. (2007). Natural polymorphism of the HIV-1 integrase
gene and mutations associated with integrase inhibitor resistance. Antiviral Therapy, 12, 563-570.
Lavery, R. (2005). Recognizing DNA. Q.Rev.Biophys., 38, 339-344.
Lee, M. C., Deng, J. X., Briggs, J. M., & Duan, Y. (2005). Large-scale conformational dynamics of the HIV-1 integrase core domain and its catalytic loop mutants. Biophysical Journal, 88, 3133-3146.
Lee, M. S. & Craigie, R. (1994). Protection of Retroviral Dna from Autointegration - Involvement of
A Cellular Factor. Proceedings of the National Academy of Sciences of the United States of
America, 91, 9823-9827.
Lee, S. P. & Han, M. K. (1996). Zinc stimulates Mg2+-dependent 3'-processing activity of human immunodeficiency virus type 1 integrase in vitro. Biochemistry, 35, 3837-3844.
Leh, H., Brodin, P., Bischerour, J., Deprez, E., Tauc, P., Brochon, J. C. et al. (2000). Determinants of Mg2+-dependent activities of recombinant human immunodeficiency virus type 1 integrase. Biochemistry, 39, 9285-9294.

169
Lengauer, T., Sander, O., Sierra, S., Thielen, A., & Kaiser, R. (2007). Bioinformatics prediction of HIV coreceptor usage. Nat.Biotechnol., 25, 1407-1410.
Lennox, J. L., DeJesus, E., Lazzarin, A., Pollard, R. B., Madruga, J. V., Berger, D. S. et al. (2009). Safety and efficacy of raltegravir-based versus efavirenz-based combination therapy in treatment-naive patients with HIV-1 infection: a multicentre, double-blind randomised controlled trial. Lancet, 374, 796-806.
Leszczynski, J. F. & Rose, G. D. (1986). Loops in Globular-Proteins - A Novel Category of Secondary Structure. Science, 234, 849-855.
Levin, J. M. (1997). Exploring the limits of nearest neighbour secondary structure prediction. Protein
Engineering, 10, 771-776.
Levitt, M. & Warshel, A. (1975). Computer-Simulation of Protein Folding. Nature, 253, 694-698. Lins, R. D., Adesokan, A., Soares, T. A., & Briggs, J. M. (2000). Investigations on human
immunodeficiency virus type 1 integrase/DNA binding interactions via molecular dynamics and electrostatics calculations. Pharmacology & Therapeutics, 85, 123-131.
Lins, R. D., Briggs, J. M., Straatsma, T. P., Carlson, H. A., Greenwald, J., Choe, S. et al. (1999).
Molecular dynamics studies on the HIV-1 integrase catalytic domain. Biophysical Journal, 76, 2999-3011.
Lins, R. D., Straatsma, T. P., & Briggs, J. M. (2000). Similarities in the HIV-1 and ASV integrase active sites upon metal cofactor binding. Biopolymers, 53, 308-315.
Loizidou, E. Z., Kousiappa, I., Zeinalipour-Yazdi, C. D., Van de Vijver, D. A. M. C., & Kostrikis, L.
G. (2009). Implications of HIV-1 M Group Polymorphisms on Integrase Inhibitor Efficacy and Resistance: Genetic and Structural in Silico Analyses. Biochemistry, 48, 4-6.
Loizidou, E. Z., Zeinalipour-Yazdi, C. D., Christofides, T., & Kostrikis, L. G. (2009). Analysis of binding parameters of HIV-1 integrase inhibitors: Correlates of drug inhibition and resistance. Bioorganic & Medicinal Chemistry, 17, 4806-4818.
Lovell, S., Goryshin, I. Y., Reznikoff, W. R., & Rayment, I. (2002). Two-metal active site binding of a Tn5 transposase synaptic complex. Nat.Struct.Biol., 9, 278-281.
Low, A., Prada, N., Topper, M., Vaida, F., Castor, D., Mohri, H. et al. (2009). Natural Polymorphisms of Human Immunodeficiency Virus Type 1 Integrase and Inherent Susceptibilities to a Panel of Integrase Inhibitors. Antimicrobial Agents and Chemotherapy, 53, 4275-4282.
Luscombe, N. M., Laskowski, R. A., & Thornton, J. M. (2001). Amino acid-base interactions: a three-dimensional analysis of protein-DNA interactions at an atomic level. Nucleic Acids Research, 29, 2860-2874.
Luscombe, N. M. & Thornton, J. M. (2002). Protein-DNA interactions: Amino acid conservation and
the effects of mutations on binding specificity. Journal of Molecular Biology, 320, 991-1009. Machado, L. F., Ishak, M. O., Vallinoto, A. C., Lemos, J. A., Azevedo, V. N., Moreira, M. R. et al.
(2009). Molecular epidemiology of HIV type 1 in northern Brazil: identification of subtypes C and D and the introduction of CRF02_AG in the Amazon region of Brazil. AIDS
Res.Hum.Retroviruses, 25, 961-966.
170
Macrae, C. F., Edgington, P. R., McCabe, P., Pidcock, E., Shields, G. P., Taylor, R. et al. (2006). Mercury: visualization and analysis of crystal structures. Journal of Applied Crystallography, 39, 453-457.
Maiga, A. I., Malet, I., Soulie, C., Derache, A., Koita, V., Amellal, B. et al. (2009). Genetic barriers for integrase inhibitor drug resistance in HIV type-1 B and CRF02_AG subtypes. Antivir.Ther., 14, 123-129.
Maignan, S., Guilloteau, J. P., Zhou-Liu, Q., Clement-Mella, C., & Mikol, V. (1998). Crystal structures of the catalytic domain of HIV-1 integrase free and complexed with its metal cofactor: High level of similarity of the active site with other viral integrases. Journal of Molecular Biology,
282, 359-368. Malet, I., Delelis, O., Soulie, C., Wirden, M., Tchertanov, L., Mottaz, P. et al. (2009). Quasispecies
variant dynamics during emergence of resistance to raltegravir in HIV-1-infected patients. Journal
of Antimicrobial Chemotherapy, 63, 795-804.
Malet, I., Delelis, O., Valantin, M. A., Montes, B., Soulie, C., Wirden, M. et al. (2008). Mutations associated with failure of raltegravir treatment affect integrase sensitivity to the inhibitor in vitro. Antimicrobial Agents and Chemotherapy, 52, 1351-1358.
Malet, I., Soulie, C., Tchertanov, L., Derache, A., Amellal, B., Traore, O. et al. (2008). Structural effects of amino acid variations between B and CRF02-AG HIV-1 integrases. Journal of Medical
Virology, 80, 754-761.
Marcelin, A. G. (2010). Resistance-associated mutations to integrase inhibitor S/GSK1349572 in HIV-1 integrase inhibitor- naive and raltegravir-experienced patients. Malet, I, Fabeni, L, Armenia, D, Fourati, S, Masquelier, B, Katlama, C., Perno, C. F., Calvez, T., and Ceccherini-Silberstein, F. In: 17th Conference on Retroviruses and Opportunistic Infections (CROI), San Fransisco, February 16–19 (abstract #554).
Martinez-Cajas, J. L., Pant-Pai, N., Klein, M. B., & Wainberg, M. A. (2008). Role of Genetic
Diversity amongst HIV-1 Non-B Subtypes in Drug Resistance: A Systematic Review of Virologic and Biochemical Evidence. Aids Reviews, 10, 212-223.
Marti-Renom, M. A., Stuart, A. C., Fiser, A., Sanchez, R., Melo, F., & Sali, A. (2000). Comparative protein structure modeling of genes and genomes. Annu.Rev.Biophys.Biomol.Struct., 29, 291-325.
Martonak, R., Laio, A., & Parrinello, M. (2003). Predicting crystal structures: the Parrinello-Rahman method revisited. Phys.Rev.Lett., 90, 075503.
Matthews, B. W. (1988). Protein-DNA interaction. No code for recognition. Nature, 335, 294-295.
Maupetit, J., Tuffery, P., & Derreumaux, P. (2007). A coarse-grained protein force field for folding and structure prediction. Proteins-Structure Function and Bioinformatics, 69, 394-408.
Maurin, C., Bailly, F., Buisine, E., Vezin, H., Mbemba, G., Mouscadet, J. F. et al. (2004). Spectroscopic studies of diketoacids-metal interactions. A probing tool for the pharmacophoric intermetallic distance in the HIV-1 integrase active site. J.Med.Chem., 47, 5583-5586.
Mazumder A, Wang S, Neamati N, Nicklaus M, Sunder S, Chen J, et al. Antiretroviral agents as inhibitors of both human immunodeficiency virus type 1 integrase and protease. J Med Chem. 1996 Jun 21;39(13):2472-81.
171
McCammon, J. A., Gelin, B. R., & Karplus, M. (1977). Dynamics of folded proteins. Nature, 267, 585-590.
Mccoll, D. J., Fransen, S., Gupta, S., Parkin, N., Margot, N., Chuck, S. et al. (2007). Resistance and cross-resistance to first generation integrase inhibitors: insights from a Phase II study of elvitegravir (GS-9137). Antiviral Therapy, 12, S11.
McGuffin, L. J., Bryson, K., & Jones, D. T. (2000). The PSIPRED protein structure prediction server.
Bioinformatics, 16, 404-405.
Metifiot, M., Maddali, K., Naumova, A., Zhang, X., Marchand, C., & Pommier, Y. (2010). Biochemical and pharmacological analyses of HIV-1 integrase flexible loop mutants resistant to raltegravir. Biochemistry, 49, 3715-3722.
Michel, F., Crucifix, C., Granger, F., Eiler, S., Mouscadet, J. F., Korolev, S. et al. (2009). Structural basis for HIV-1 DNA integration in the human genome, role of the LEDGF/P75 cofactor. EMBO J,
28, 980-991.
Miller, M. D. & Hazuda, D. J. (2004). HIV resistance to the fusion inhibitor enfuvirtide: mechanisms and clinical implications. Drug Resist.Updat., 7, 89-95.
Miranker, A. & Karplus, M. (1991). Functionality maps of binding sites: a multiple copy simultaneous search method. Proteins, 11, 29-34.
Molteni, V., Greenwald, J., Rhodes, D., Hwang, Y., Kwiatkowski, W., Bushman, F. D. et al. (2001). Identification of a small-molecule binding site at the dimer interface of the HIV integrase catalytic domain. Acta Crystallographica Section D-Biological Crystallography, 57, 536-544.
Morgan, D. A., Ruscetti, F. W., & Gallo, R. (1976). Selective in vitro growth of T lymphocytes from normal human bone marrows. Science, 193, 1007-1008.
Morris, G. M., Huey, R., Lindstrom, W., Sanner, M. F., Belew, R. K., Goodsell, D. S. et al. (2009). AutoDock4 and AutoDockTools4: Automated Docking with Selective Receptor Flexibility. Journal of Computational Chemistry, 30, 2785-2791.
Mouscadet, J. F., Arora, R., Andre, J., Lambry, J. C., Delelis, O., Malet, I. et al. (2009). HIV-1 IN alternative molecular recognition of DNA induced by raltegravir resistance mutations. J.Mol.Recognit., 22, 480-494.
Mouscadet, J. F., Delelis, O., Marcelin, A. G., & Tchertanov, L. (2010). Resistance to HIV-1 integrase inhibitors: A structural perspective. Drug Resist.Updat., 13, 139-150.
Mouscadet, J. F. & Tchertanov, L. (2009). Raltegravir: molecular basis of its mechanism of action. Eur.J.Med.Res., 14 Suppl 3, 5-16.
Myers, R. E. & Pillay, D. (2008). Analysis of natural sequence variation and covariation in human immunodeficiency virus type 1 integrase. Journal of Virology, 82, 9228-9235.
Neamati, N., Lin, Z. W., Karki, R. G., Orr, A., Cowansage, M., Strumberg, D. et al. (2002). Metal-dependent inhibition of HIV-1 integrase. Journal of Medicinal Chemistry, 45, 5661-5670.
Ni, H. H., Sotriffer, C. A., & McCammon, J. A. (2001). Ordered water and ligand mobility in the HIV-1 integrase-5CITEP complex: A molecular dynamics study. Journal of Medicinal Chemistry, 44, 3043-3047.
172
Ni, X., Abdel-Azeim, S., Laine, E., Arora, R., Osemwota, O., Marcelin, A. G. et al. (2012). In Silico and In Vitro Comparison of HIV-1 Subtypes B and CRF02_AG Integrases Susceptibility to Integrase Strand Transfer Inhibitors. Adv.Virol., 2012, 548657.
Nijhuis, M., van Maarseveen, N. M., Lastere, S., Schipper, P., Coakley, E., Glass, B. et al. (2007). A novel substrate-based HIV-1 protease inhibitor drug resistance mechanism. PLoS.Med., 4, e36.
Njai, H. F., Gali, Y., Vanham, G., Clybergh, C., Jennes, W., Vidal, N. et al. (2006). The predominance of Human Immunodeficiency Virus type 1 (HIV-1) circulating recombinant form 02 (CRF02_AG) in West Central Africa may be related to its replicative fitness. Retrovirology, 3, 40.
Nunthaboot, N., Pianwanit, S., Parasuk, V., Ebalunode, J. O., Briggs, J. M., & Kokpol, S. (2007). Hybrid quantum mechanical/molecular mechanical molecular dynamics simulations of HIV-1 integrase/inhibitor complexes. Biophysical Journal, 93, 3613-3626.
Nunthaboot, N., Planwanit, S., Parasuk, V., Kokpol, S., & Wolschann, P. (2007). Theoretical study on the HIV-1 integrase inhibitor 1-(5-chloroindol-3-yl)-3-hydroxy-3-(2H-tetrazol-5-yl)-propenone (5CITEP). Journal of Molecular Structure, 844, 208-214.
Pace, P., Di Francesco, M. E., Gardelli, C., Harper, S., Muraglia, E., Nizi, E. et al. (2007). Dihydroxypyrimidine-4-carboxamides as novel potent and selective HIV integrase inhibitors. Journal of Medicinal Chemistry, 50, 2225-2239.
Pannecouque, C., Pluymers, W., Van, Maele B., Tetz, V., Cherepanov, P., De, Clercq E., Witvrouw, M., and Debyser, Z. (2002). New class of HIV integrase inhibitors that block viral replication in cell culture. Curr.Biol. 12(14), 1169-1177.
Pasquini, S., Mugnaini, C., Tintori, C., Botta, M., Trejos, A., Arvela, R. K. et al. (2008). Investigations
on the 4-quinolone-3-carboxylic acid motif. 1. Synthesis-activity relationship of a class of human immunodeficiency virus type 1 integrase inhibitors. Journal of Medicinal Chemistry, 51, 5125-5129.
Perryman, A. L., Forli, S., Morris, G. M., Burt, C., Cheng, Y. H., Palmer, M. J. et al. (2010). A Dynamic Model of HIV Integrase Inhibition and Drug Resistance. Journal of Molecular Biology,
397, 600-615.
Pettit, S. C., Everitt, L. E., Choudhury, S., Dunn, B. M., & Kaplan, A. H. (2004). Initial cleavage of the human immunodeficiency virus type 1 GagPol precursor by its activated protease occurs by an intramolecular mechanism. J.Virol., 78, 8477-8485.
Plantier, J. C., Leoz, M., Dickerson, J. E., De, O. F., Cordonnier, F., Lemee, V. et al. (2009). A new human immunodeficiency virus derived from gorillas. Nat.Med., 15, 871-872.
Podtelezhnikov, A. A., Gao, K., Bushman, F. D., & McCammon, J. A. (2003). Modeling HIV-1 integrase complexes based on their hydrodynamic properties. Biopolymers, 68, 110-120.
Pollastri, G., Przybylski, D., Rost, B., & Baldi, P. (2002). Improving the prediction of protein secondary structure in three and eight classes using recurrent neural networks and profiles. Proteins-Structure Function and Genetics, 47, 228-235.
Pommier, Y., Johnson, A. A., & Marchand, C. (2005). Integrase inhibitors to treat HIV/AIDS. Nature
Reviews Drug Discovery, 4, 236-248.
Popovic, M., Sarngadharan, M. G., Read, E., & Gallo, R. C. (1984). Detection, isolation, and continuous production of cytopathic retroviruses (HTLV-III) from patients with AIDS and pre-AIDS. Science, 224, 497-500.
173
Raghava, G. P. S. (2002). APSSP2 : A combination method for protein secondary structure prediction based on neural network and example based learning. CASP5. A-132. [Computer software].
Ratner, L., Haseltine, W., Patarca, R., Livak, K. J., Starcich, B., Josephs, S. F. et al. (1985). Complete nucleotide sequence of the AIDS virus, HTLV-III. Nature, 313, 277-284.
Ren, G., Gao, K., Bushman, F. D., & Yeager, M. (2007). Single-particle image reconstruction of a tetramer of HIV integrase bound to DNA. Journal of Molecular Biology, 366, 286-294.
Rhee, S. Y., Liu, T. F., Kiuchi, M., Zioni, R., Gifford, R. J., Holmes, S. P. et al. (2008). Natural variation of HIV-1 group M integrase: Implications for a new class of antiretroviral inhibitors. Retrovirology, 5.
Robertson, D. L., Anderson, J. P., Bradac, J. A., Carr, J. K., Foley, B., Funkhouser, R. K. et al. (2000). HIV-1 nomenclature proposal. Science, 288, 55-56.
Roquebert, B., Damond, F., Collin, G., Matheron, S., Peytavin, G., Benard, A. et al. (2008). HIV-2 integrase gene polymorphism and phenotypic susceptibility of HIV-2 clinical isolates to the integrase inhibitors raltegravir and elvitegravir in vitro. J.Antimicrob.Chemother., 62, 914-920.
Rost, B., Sander, C., & Schneider, R. (1994). Phd - An Automatic Mail Server for Protein Secondary Structure Prediction. Computer Applications in the Biosciences, 10, 53-60.
Rowland-Jones, S. L. and Whittle, H. C. (2007). Out of Africa: what can we learn from HIV-2 about protective immunity to HIV-1? Nat.Immunol. 8(4), 329-331.
Saag, M. S., Hahn, B. H., Gibbons, J., Li, Y., Parks, E. S., Parks, W. P. et al. (1988). Extensive variation of human immunodeficiency virus type-1 in vivo. Nature, 334, 440-444.
Sanchez, R. & Sali, A. (1997). Advances in comparative protein-structure modeling. Curr.Opin.Struct.Biol., 7, 206-214.
Sanchez-Pescador, R., Power, M. D., Barr, P. J., Steimer, K. S., Stempien, M. M., Brown-Shimer, S. L. et al. (1985). Nucleotide sequence and expression of an AIDS-associated retrovirus (ARV-2). Science, 227, 484-492.
Sante-Appiah, E. & Skalka, A. M. (1999). HIV-1 integrase: Structural organization, conformational changes, and catalysis. Advances in Virus Research, Vol 52, 52, 351-369.
Sarngadharan, M. G., Popovic, M., Bruch, L., Schupbach, J., & Gallo, R. C. (1984). Antibodies
reactive with human T-lymphotropic retroviruses (HTLV-III) in the serum of patients with AIDS. Science, 224, 506-508.
Sato, M., Motomura, T., Aramaki, H., Matsuda, T., Yamashita, M., Ito, Y. et al. (2006). Novel HIV-1 integrase inhibitors derived from quinolone antibiotics. Journal of Medicinal Chemistry, 49, 1506-1508.
Savarino, A. (2007). In-Silico docking of HIV-1 integrase inhibitors reveals a novel drug type acting on an enzyme/DNA reaction intermediate. Retrovirology, 4.
Savarino, A., Pistello, M., D'Ostilio, D., Zabogli, E., Taglia, F., Mancini, F. et al. (2007). Human
immunodeficiency virus integrase inhibitors efficiently suppress feline immunodeficiency virus replication in vitro and provide a rationale to redesign antiretroviral treatment for feline AIDS. Retrovirology, 4.

174
Schupbach, J., Popovic, M., Gilden, R. V., Gonda, M. A., Sarngadharan, M. G., & Gallo, R. C. (1984). Serological analysis of a subgroup of human T-lymphotropic retroviruses (HTLV-III) associated with AIDS. Science, 224, 503-505.
Schwede, T., Kopp, J., Guex, N., & Peitsch, M. C. (2003). SWISS-MODEL: An automated protein homology-modeling server. Nucleic Acids Res., 31, 3381-3385.
Seki, T. (2010). S/GSK1349572 is a potent next generation HIV integrase inhibitor and demonstrates a superior resistance profile substantiated with 60 integrase mutant molecular clones. Kobayashi, M., Wakasa-Morimoto, C., Yoshinaga, T., Sato, A., Fujiwara, T., Underwood, M. R., Garvey, E. P., and Johns, B. A. . In: 17th Conference on Retroviruses and Opportunistic Infections (CROI), San Fransisco, February 16–19 (abstract #555).
Segall, M. D., Payne, M. C., Ellis, S. W., Tucker, G. T., & Boyes, R. N. (1997). Ab initio molecular
modeling in the study of drug metabolism. Eur.J.Drug Metab Pharmacokinet., 22, 283-289.
Semenova, E. A., Marchand, C., & Pommier, Y. (2008). HIV-1 integrase inhibitors: update and perspectives. Adv.Pharmacol., 56, 199-228.
Sension, M. G. (2007). Long-Term suppression of HIV infection: benefits and limitations of current treatment options. J.Assoc.Nurses AIDS Care 18(1 Suppl), S2-10.
Serrao, E., Odde, S., Ramkumar, K., & Neamati, N. (2009). Raltegravir, elvitegravir, and metoogravir: the birth of "me-too" HIV-1 integrase inhibitors. Retrovirology, 6, 25.
Setny, P., Bahadur, R. P., & Zacharias, M. (2012). Protein-DNA docking with a coarse-grained force field. BMC Bioinformatics, 13, 228.
Shaw, G. M., Hahn, B. H., Arya, S. K., Groopman, J. E., Gallo, R. C., & Wong-Staal, F. (1984). Molecular characterization of human T-cell leukemia (lymphotropic) virus type III in the acquired immune deficiency syndrome. Science, 226, 1165-1171.
Shaw, G. M., Harper, M. E., Hahn, B. H., Epstein, L. G., Gajdusek, D. C., Price, R. W. et al. (1985). HTLV-III infection in brains of children and adults with AIDS encephalopathy. Science, 227, 177-182.
Shehu-Xhilaga, M., Crowe, S. M., & Mak, J. (2001). Maintenance of the Gag/Gag-Pol ratio is important for human immunodeficiency virus type 1 RNA dimerization and viral infectivity. J.Virol., 75, 1834-1841.
Shen, M. Y. & Sali, A. (2006). Statistical potential for assessment and prediction of protein structures. Protein Science, 15, 2507-2524.
Shimura, K., Kodama, E., Sakagami, Y., Matsuzaki, Y., Watanabe, W., Yamataka, K. et al. (2008). Broad Antiretroviral activity and resistance profile of the novel human immunodeficiency virus integrase inhibitor elvitegravir (JTK-303/GS-9137). Journal of Virology, 82, 764-774.
Shuker, S. B., Hajduk, P. J., Meadows, R. P., & Fesik, S. W. (1996). Discovering high-affinity ligands for proteins: SAR by NMR. Science, 274, 1531-1534.
Sichtig, N., Sierra, S., Kaiser, R., Daumer, M., Reuter, S., Schulter, E. et al. (2009). Evolution of raltegravir resistance during therapy. Journal of Antimicrobial Chemotherapy, 64, 25-32.
Smolov, M., Gottikh, M., Tashlitskii, V., Korolev, S., Demidyuk, I., Brochon, J. C. et al. (2006). Kinetic study of the HIV-1 DNA 3 '-end processing - Single-turnover property of integrase. Febs
Journal, 273, 1137-1151.
175
Steigbigel, R. T., Cooper, D. A., Kumar, P. N., Eron, J. E., Schechter, M., Markowitz, M. et al. (2008). Raltegravir with optimized background therapy for resistant HIV-1 infection. N.Engl.J.Med., 359, 339-354.
Street, T. O., Fitzkee, N. C., Perskie, L. L., & Rose, G. D. (2007). Physical-chemical determinants of turn conformations in globular proteins. Protein Science, 16, 1720-1727.
Strobel, S. A. & Ryder, S. P. (2001). The hairpin's turn. Nature, 410, 761-763. Summa, V., Petrocchi, A., Bonelli, F., Crescenzi, B., Donghi, M., Ferrara, M. et al. (2008). Discovery
of Raltegravir, a potent, selective orally bioavailable HIV-integrase inhibitor for the treatment of HIV-AIDS infection. Journal of Medicinal Chemistry, 51, 5843-5855.
Sunderland, C. J., Botta, M., Aime, S., & Raymond, K. N. (2001). 6-carboxamido-5,4-hydroxypyrimidinones: A new class of heterocyclic ligands and their evaluation as gadolinium chelating agents. Inorganic Chemistry, 40, 6746-6756.
Taylor, B. S., Sobieszczyk, M. E., McCutchan, F. E., & Hammer, S. M. (2008). Medical progress: The challenge of HIV-1 subtype diversity. New England Journal of Medicine, 358, 1590-1602.
Tchertanov, L., Delelis, O., & Mouscadet, J. (2007). Structural and functional insight into molecular recognition of HIV-1 integrase catalytic loop. Febs Journal, 274, 260.
Tchertanov, L. & Mouscadet, J. F. (2007). Target recognition by catechols and beta-ketoenols: Potential contribution of hydrogen bonding and Mn/Mg chelation to HIV-1 integrase inhibition. Journal of Medicinal Chemistry, 50, 1133-1145.
Thompson, J. D., Higgins, D. G., & Gibson, T. J. (1994). Clustal-W - Improving the Sensitivity of Progressive Multiple Sequence Alignment Through Sequence Weighting, Position-Specific Gap Penalties and Weight Matrix Choice. Nucleic Acids Research, 22, 4673-4680.
Thomsen, R. (2003). Flexible ligand docking using evolutionary algorithms: investigating the effects of variation operators and local search hybrids. Biosystems, 72, 57-73.
Tilton, J. C. and Doms, R. W. (2010) Entry inhibitors in the treatment of HIV-1 infection. Antiviral
Res. 85(1), 91-100.
Tripos Inc. (2007). SYBYL 7.2 [Computer software].
Trott, O. & Olson, A. J. (2010). Software News and Update AutoDock Vina: Improving the Speed and Accuracy of Docking with a New Scoring Function, Efficient Optimization, and Multithreading. Journal of Computational Chemistry, 31, 455-461.
Tsiang M, Jones GS, Hung M, Samuel D, Novikov N, Mukund S, et al. Dithiothreitol causes HIV-1 integrase dimer dissociation while agents interacting with the integrase dimer interface promote dimer formation. Biochemistry. 2011 Mar 15;50(10):1567-81.
Tsiang M, Jones GS, Niedziela-Majka A, Kan E, Lansdon EB, Huang W, Hung M, et al. New Class
of HIV-1 Integrase (IN) Inhibitors with a Dual Mode of Action. Biol Chem. 2012 Jun 15;287(25):21189-203.
Uchil, P. D. & Mothes, W. (2009). HIV Entry Revisited. Cell, 137, 402-404.

176
Valkov, E., Gupta, S. S., Hare, S., Helander, A., Roversi, P., McClure, M. et al. (2009). Functional and structural characterization of the integrase from the prototype foamy virus. Nucleic Acids Research,
37, 243-255.
Van Baelen, K., Van Eygen, V., Rondelez, E., & Stuyver, L. J. (2008). Clade-specific HIV-1 integrase polymorphisms do not reduce raltegravir and elvitegravir phenotypic susceptibility. Aids, 22, 1877-1880.
van der Loeff, M. F., Awasana, A. A., Sarge-Njie, R., van der Sande, M., Jaye, A., Sabally, S., Corrah, T., McConkey, S. J., and Whittle, H. C. (2006). Sixteen years of HIV surveillance in a West African research clinic reveals divergent epidemic trends of HIV-1 and HIV-2. Int.J.Epidemiol.
35(5), 1322-1328.
van der Spoel, D., Lindahl, E., Hess, B., Groenhof, G., Mark, A. E., & Berendsen, H. J. (2005). GROMACS: fast, flexible, and free. J.Comput.Chem., 26, 1701-1718.
van, D. M. & Bonvin, A. M. (2009). 3D-DART: a DNA structure modelling server. Nucleic Acids
Res., 37, W235-W239.
van, D. M. & Bonvin, A. M. (2010). Pushing the limits of what is achievable in protein-DNA docking: benchmarking HADDOCK's performance. Nucleic Acids Res., 38, 5634-5647.
van, D. M., van Dijk, A. D., Hsu, V., Boelens, R., & Bonvin, A. M. (2006). Information-driven protein-DNA docking using HADDOCK: it is a matter of flexibility. Nucleic Acids Res., 34, 3317-3325.
Verdonk, M. L., Cole, J. C., Hartshorn, M. J., Murray, C. W., & Taylor, R. D. (2003). Improved protein-ligand docking using GOLD. Proteins, 52, 609-623.
Verkhivker, G. M., Bouzida, D., Gehlhaar, D. K., Rejto, P. A., Arthurs, S., Colson, A. B. et al. (2000). Deciphering common failures in molecular docking of ligand-protein complexes. J.Comput.Aided
Mol.Des, 14, 731-751.
Wain-Hobson, S., Sonigo, P., Danos, O., Cole, S., & Alizon, M. (1985). Nucleotide sequence of the AIDS virus, LAV. Cell, 40, 9-17. Walker, B. D. & Burton, D. R. (2008). Toward an AIDS vaccine. Science, 320, 760-764.
Wang, J. Y., Ling, H., Yang, W., & Craigie, R. (2001). Structure of a two-domain fragment of HIV-1 integrase: implications for domain organization in the intact protein. EMBO J., 20, 7333-7343.
Wang, L. D., Liu, C. L., Chen, W. Z., & Wang, C. X. (2005). Constructing HIV-1 integrase tetramer and exploring influences of metal ions on forming integrase-DNA complex. Biochemical and
Biophysical Research Communications, 337, 313-319.
Wang, W., Donini, O., Reyes, C. M., & Kollman, P. A. (2001). Biomolecular simulations: recent developments in force fields, simulations of enzyme catalysis, protein-ligand, protein-protein, and protein-nucleic acid noncovalent interactions. Annu.Rev.Biophys.Biomol.Struct., 30, 211-243.
Weber, W., Demirdjian, H., Lins, R. D., Briggs, J. M., Ferreira, R., & McCammon, J. A. (1998). Brownian and essential dynamics studies of the HIV-1 integrase catalytic domain. Journal of
Biomolecular Structure & Dynamics, 16, 733-745. Welch, W., Ruppert, J., & Jain, A. N. (1996). Hammerhead: Fast, fully automated docking of flexible
ligands to protein binding sites. Chemistry & Biology, 3, 449-462.

177
Westbrook, J., Feng, Z., Chen, L., Yang, H., & Berman, H. M. (2003). The Protein Data Bank and structural genomics. Nucleic Acids Res., 31, 489-491.
Wielens, J., Crosby, I. T., & Chalmers, D. K. (2005). A three-dimensional model of the human
immunodeficiency virus type 1 integration complex. Journal of Computer-Aided Molecular
Design, 19, 301-317. Wijitkosoom, A., Tonmunphean, S., Truong, T. N., & Hannongbua, S. (2006). Structural and
dynamical properties of a full-length HIV-1 integrase: Molecular dynamics simulations. Journal of
Biomolecular Structure & Dynamics, 23, 613-624.
Williams, S. L. & Essex, J. W. (2009). Study of the Conformational Dynamics of the Catalytic Loop of WT and G140A/G149A HIV-1 Integrase Core Domain Using Reversible Digitally Filtered Molecular Dynamics. Journal of Chemical Theory and Computation, 5, 411-421.
Wirden, M., Simon, A., Schneider, L., Tubiana, R., Malet, I., Ait-Mohand, H. et al. (2009). Raltegravir has no residual antiviral activity in vivo against HIV-1 with resistance-associated mutations to this drug. J.Antimicrob.Chemother., 64, 1087-1090.
Wong-Staal, F., Shaw, G. M., Hahn, B. H., Salahuddin, S. Z., Popovic, M., Markham, P. et al. (1985). Genomic diversity of human T-lymphotropic virus type III (HTLV-III). Science, 229, 759-762.
Xu, J. D., Whisenhunt, D. W., Veeck, A. C., Uhlir, L. C., & Raymond, K. N. (2003). Thorium(IV) complexes of bidentate hydroxypyridinonates. Inorganic Chemistry, 42, 2665-2674.
Ye, J. R., Yu, S. Q., Lu, H. Y., Wang, W. S., Xin, R. L., & Zeng, Y. (2012). Genetic diversity of HIV type 1 isolated from newly diagnosed subjects (2006-2007) in Beijing, China. AIDS
Res.Hum.Retroviruses, 28, 119-123.
Yin, Z. Q. & Craigie, R. (2010). Modeling the HIV-1 Intasome: A Prototype View of the Target of Integrase Inhibitors. Viruses-Basel, 2, 2777-2781.
Yoder, K. E. & Bushman, F. D. (2000). Repair of gaps in retroviral DNA integration intermediates. J.Virol., 74, 11191-11200.
Zhong, Y. L., Krska, S. W., Zhou, H., Reamer, R. A., Lee, J., Sun, Y. K. et al. (2009). Catalytic Asymmetric Synthesis of an HIV Integrase Inhibitor. Organic Letters, 11, 369-372.
Zhu, T., Korber, B. T., Nahmias, A. J., Hooper, E., Sharp, P. M., & Ho, D. D. (1998). An African HIV-1 sequence from 1959 and implications for the origin of the epidemic. Nature, 391, 594-597.
Zhuang, L. C., Wai, J. S., Embrey, M. W., Fisher, T. E., Egbertson, M. S., Payne, L. S. et al. (2003). Design and synthesis of 8-hydroxy-[1,6]naphthyridines as novel inhibitors of HIV-1 integrase in vitro and in infected cells. Journal of Medicinal Chemistry, 46, 453-456.

178
APPENDIX
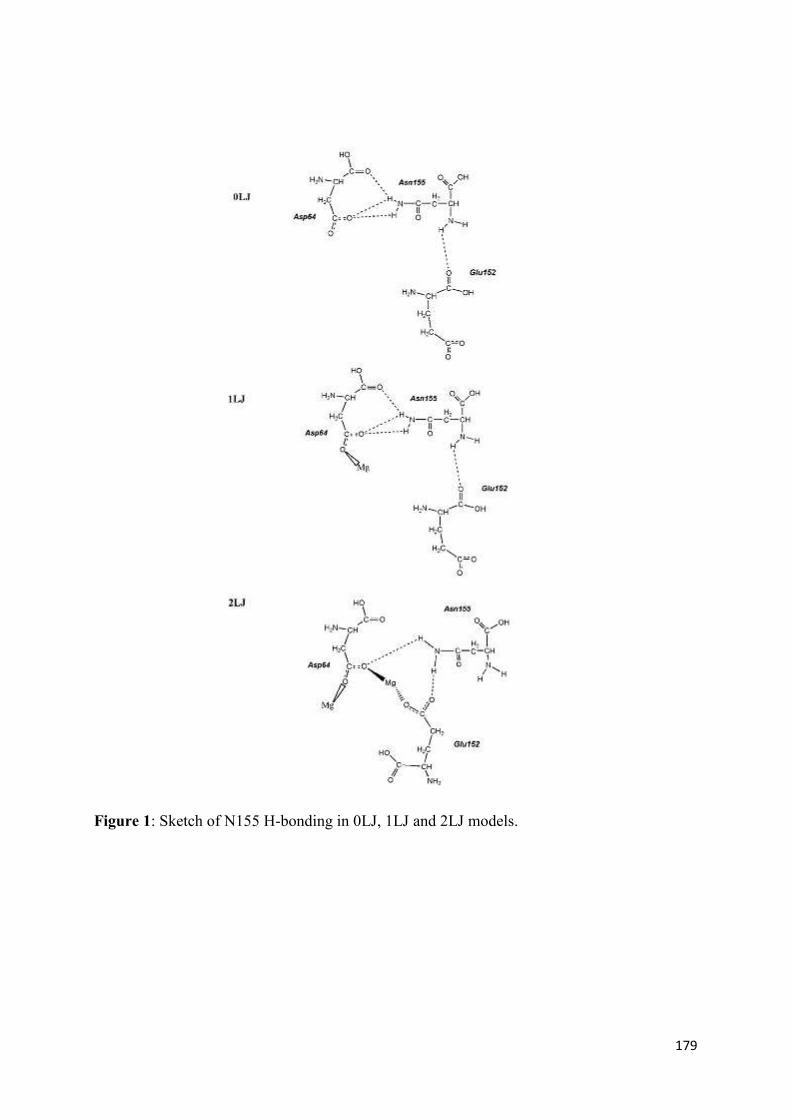
179
Figure 1: Sketch of N155 H-bonding in 0LJ, 1LJ and 2LJ models.
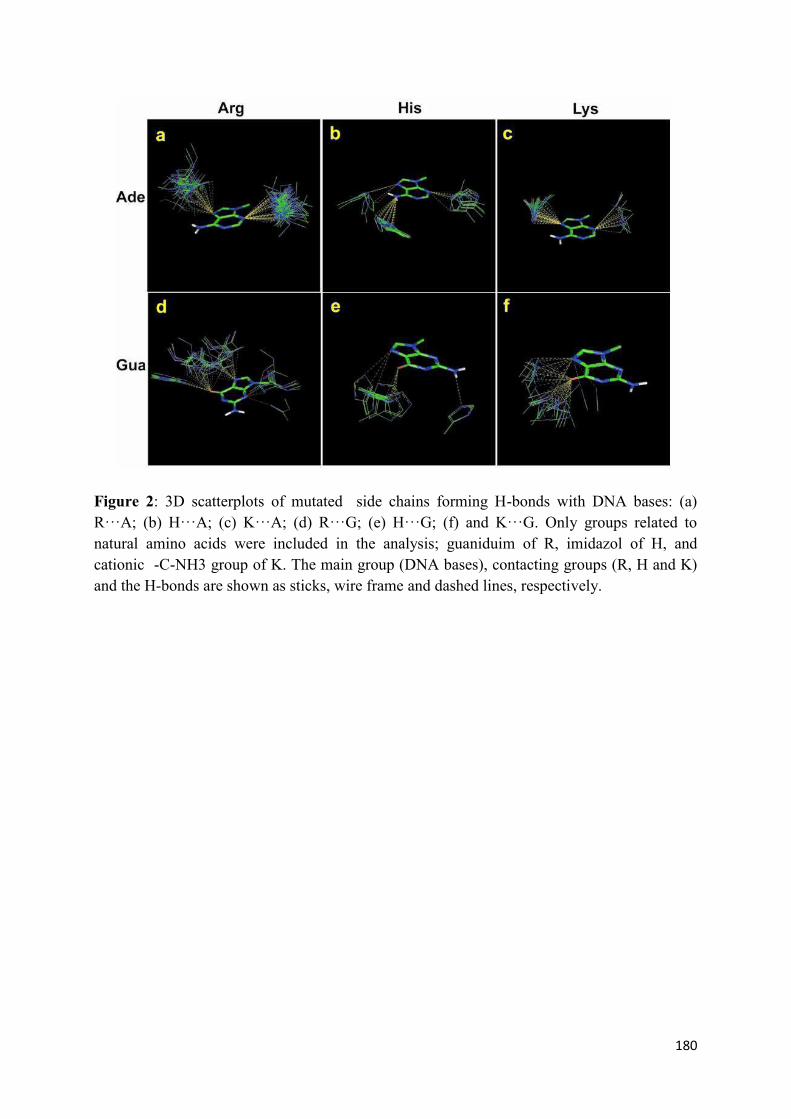
180
Figure 2: 3D scatterplots of mutated side chains forming H-bonds with DNA bases: (a) R···A; (b) H···A; (c) K···A; (d) R···G; (e) H···G; (f) and K···G. Only groups related to natural amino acids were included in the analysis; guaniduim of R, imidazol of H, and cationic -C-NH3 group of K. The main group (DNA bases), contacting groups (R, H and K) and the H-bonds are shown as sticks, wire frame and dashed lines, respectively.

181
Figure 3: Loop structure modeling with PEP-FOLD (Maupetit, Tuffery, & Derreumaux, 2007). Starting from the amino acid sequence GIPYNPQSQGV the PEP-FOLD runs 50 greedy simulations and gives the lowest energy conformation. A snapshot of all clusters lowest energy solution superimposed to the lowest energy conformation (in blue). This gives an idea of the conformational diversity of analysed polypeptide
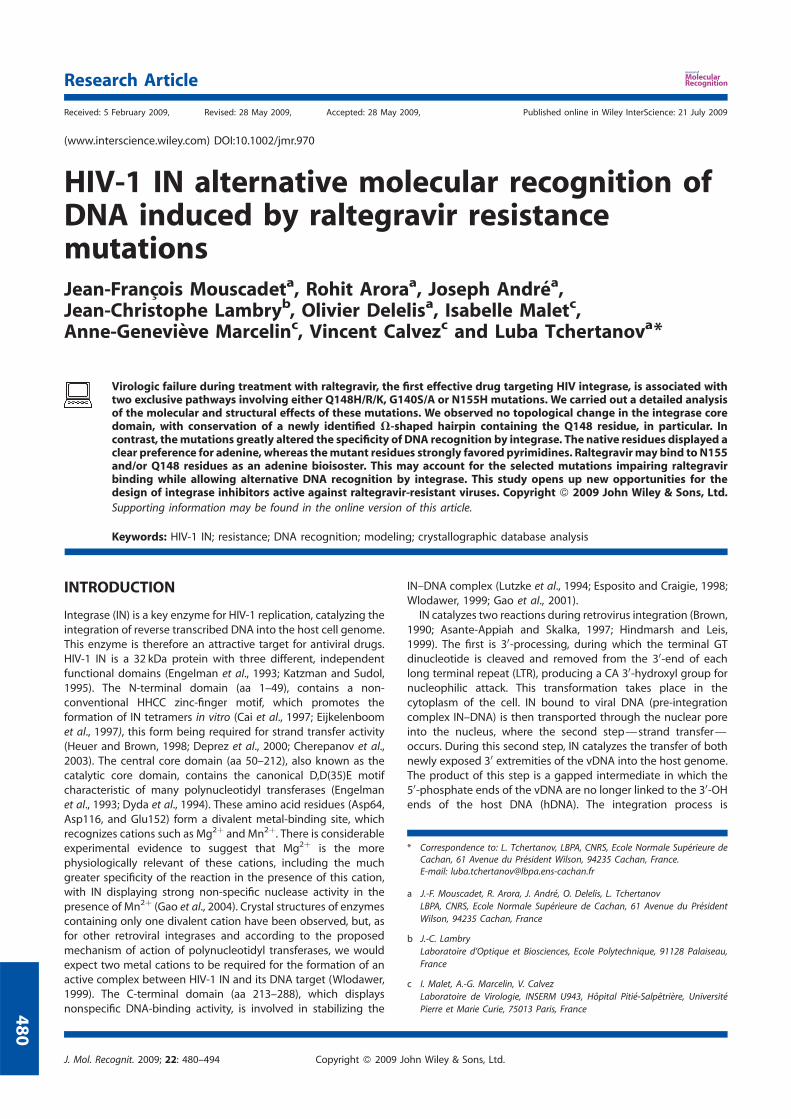
Received: 5 February 2009, Revised: 28 May 2009, Accepted: 28 May 2009, Published online in Wiley InterScience: 21 July 2009
HIV-1 IN alternative molecular recognition ofDNA induced by raltegravir resistancemutationsJean-Francois Mouscadeta, Rohit Aroraa, Joseph Andrea,Jean-Christophe Lambryb, Olivier Delelisa, Isabelle Maletc,Anne-Genevieve Marcelinc, Vincent Calvezc and Luba Tchertanova*
Virologic failure during treatment with raltegravir, the first effective drug targeting HIV integrase, is associated withtwo exclusive pathways involving either Q148H/R/K, G140S/A or N155H mutations. We carried out a detailed analysisof the molecular and structural effects of these mutations. We observed no topological change in the integrase coredomain, with conservation of a newly identified V-shaped hairpin containing the Q148 residue, in particular. Incontrast, themutations greatly altered the specificity of DNA recognition by integrase. The native residues displayed aclear preference for adenine, whereas themutant residues strongly favored pyrimidines. Raltegravirmay bind to N155and/or Q148 residues as an adenine bioisoster. This may account for the selected mutations impairing raltegravirbinding while allowing alternative DNA recognition by integrase. This study opens up new opportunities for thedesign of integrase inhibitors active against raltegravir-resistant viruses. Copyright ß 2009 John Wiley & Sons, Ltd.
Supporting information may be found in the online version of this article.
Keywords: HIV-1 IN; resistance; DNA recognition; modeling; crystallographic database analysis
INTRODUCTION
Integrase (IN) is a key enzyme for HIV-1 replication, catalyzing the
integration of reverse transcribed DNA into the host cell genome.
This enzyme is therefore an attractive target for antiviral drugs.
HIV-1 IN is a 32 kDa protein with three different, independent
functional domains (Engelman et al., 1993; Katzman and Sudol,
1995). The N-terminal domain (aa 1–49), contains a non-
conventional HHCC zinc-finger motif, which promotes the
formation of IN tetramers in vitro (Cai et al., 1997; Eijkelenboom
et al., 1997), this form being required for strand transfer activity
(Heuer and Brown, 1998; Deprez et al., 2000; Cherepanov et al.,
2003). The central core domain (aa 50–212), also known as the
catalytic core domain, contains the canonical D,D(35)E motif
characteristic of many polynucleotidyl transferases (Engelman
et al., 1993; Dyda et al., 1994). These amino acid residues (Asp64,
Asp116, and Glu152) form a divalent metal-binding site, which
recognizes cations such as Mg2þ and Mn2þ. There is considerable
experimental evidence to suggest that Mg2þ is the more
physiologically relevant of these cations, including the much
greater specificity of the reaction in the presence of this cation,
with IN displaying strong non-specific nuclease activity in the
presence of Mn2þ (Gao et al., 2004). Crystal structures of enzymes
containing only one divalent cation have been observed, but, as
for other retroviral integrases and according to the proposed
mechanism of action of polynucleotidyl transferases, we would
expect two metal cations to be required for the formation of an
active complex between HIV-1 IN and its DNA target (Wlodawer,
1999). The C-terminal domain (aa 213–288), which displays
nonspecific DNA-binding activity, is involved in stabilizing the
IN–DNA complex (Lutzke et al., 1994; Esposito and Craigie, 1998;
Wlodawer, 1999; Gao et al., 2001).
IN catalyzes two reactions during retrovirus integration (Brown,
1990; Asante-Appiah and Skalka, 1997; Hindmarsh and Leis,
1999). The first is 30-processing, during which the terminal GT
dinucleotide is cleaved and removed from the 30-end of each
long terminal repeat (LTR), producing a CA 30-hydroxyl group for
nucleophilic attack. This transformation takes place in the
cytoplasm of the cell. IN bound to viral DNA (pre-integration
complex IN–DNA) is then transported through the nuclear pore
into the nucleus, where the second step—strand transfer—
occurs. During this second step, IN catalyzes the transfer of both
newly exposed 30 extremities of the vDNA into the host genome.
The product of this step is a gapped intermediate in which the
50-phosphate ends of the vDNA are no longer linked to the 30-OH
ends of the host DNA (hDNA). The integration process is
(www.interscience.wiley.com) DOI:10.1002/jmr.970
Research Article
* Correspondence to: L. Tchertanov, LBPA, CNRS, Ecole Normale Superieure de
Cachan, 61 Avenue du President Wilson, 94235 Cachan, France.
E-mail: [email protected]
a J.-F. Mouscadet, R. Arora, J. Andre, O. Delelis, L. Tchertanov
LBPA, CNRS, Ecole Normale Superieure de Cachan, 61 Avenue du President
Wilson, 94235 Cachan, France
b J.-C. Lambry
Laboratoire d’Optique et Biosciences, Ecole Polytechnique, 91128 Palaiseau,
France
c I. Malet, A.-G. Marcelin, V. Calvez
Laboratoire de Virologie, INSERM U943, Hopital Pitie-Salpetriere, Universite
Pierre et Marie Curie, 75013 Paris, France
J. Mol. Recognit. 2009; 22: 480–494 Copyright ß 2009 John Wiley & Sons, Ltd.
480
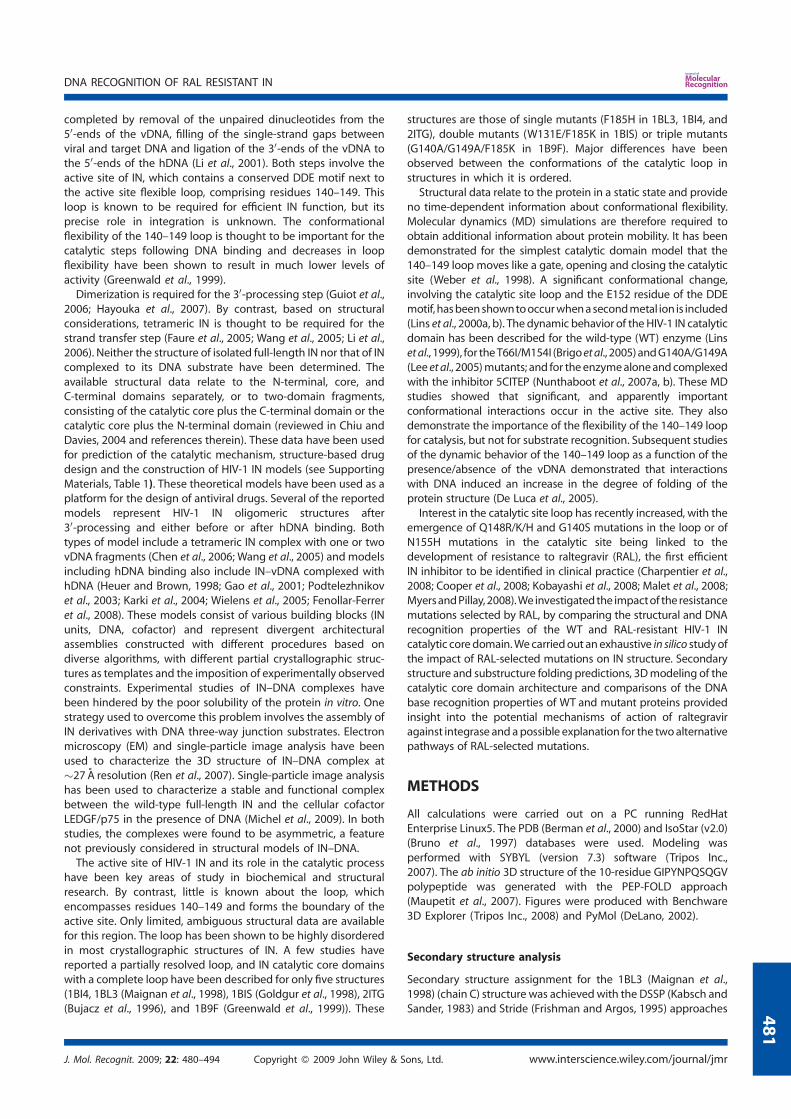
completed by removal of the unpaired dinucleotides from the
50-ends of the vDNA, filling of the single-strand gaps between
viral and target DNA and ligation of the 30-ends of the vDNA to
the 50-ends of the hDNA (Li et al., 2001). Both steps involve the
active site of IN, which contains a conserved DDE motif next to
the active site flexible loop, comprising residues 140–149. This
loop is known to be required for efficient IN function, but its
precise role in integration is unknown. The conformational
flexibility of the 140–149 loop is thought to be important for the
catalytic steps following DNA binding and decreases in loop
flexibility have been shown to result in much lower levels of
activity (Greenwald et al., 1999).
Dimerization is required for the 30-processing step (Guiot et al.,
2006; Hayouka et al., 2007). By contrast, based on structural
considerations, tetrameric IN is thought to be required for the
strand transfer step (Faure et al., 2005; Wang et al., 2005; Li et al.,
2006). Neither the structure of isolated full-length IN nor that of IN
complexed to its DNA substrate have been determined. The
available structural data relate to the N-terminal, core, and
C-terminal domains separately, or to two-domain fragments,
consisting of the catalytic core plus the C-terminal domain or the
catalytic core plus the N-terminal domain (reviewed in Chiu and
Davies, 2004 and references therein). These data have been used
for prediction of the catalytic mechanism, structure-based drug
design and the construction of HIV-1 IN models (see Supporting
Materials, Table 1). These theoretical models have been used as a
platform for the design of antiviral drugs. Several of the reported
models represent HIV-1 IN oligomeric structures after
30-processing and either before or after hDNA binding. Both
types of model include a tetrameric IN complex with one or two
vDNA fragments (Chen et al., 2006; Wang et al., 2005) and models
including hDNA binding also include IN–vDNA complexed with
hDNA (Heuer and Brown, 1998; Gao et al., 2001; Podtelezhnikov
et al., 2003; Karki et al., 2004; Wielens et al., 2005; Fenollar-Ferrer
et al., 2008). These models consist of various building blocks (IN
units, DNA, cofactor) and represent divergent architectural
assemblies constructed with different procedures based on
diverse algorithms, with different partial crystallographic struc-
tures as templates and the imposition of experimentally observed
constraints. Experimental studies of IN–DNA complexes have
been hindered by the poor solubility of the protein in vitro. One
strategy used to overcome this problem involves the assembly of
IN derivatives with DNA three-way junction substrates. Electron
microscopy (EM) and single-particle image analysis have been
used to characterize the 3D structure of IN–DNA complex at
27 A resolution (Ren et al., 2007). Single-particle image analysis
has been used to characterize a stable and functional complex
between the wild-type full-length IN and the cellular cofactor
LEDGF/p75 in the presence of DNA (Michel et al., 2009). In both
studies, the complexes were found to be asymmetric, a feature
not previously considered in structural models of IN–DNA.
The active site of HIV-1 IN and its role in the catalytic process
have been key areas of study in biochemical and structural
research. By contrast, little is known about the loop, which
encompasses residues 140–149 and forms the boundary of the
active site. Only limited, ambiguous structural data are available
for this region. The loop has been shown to be highly disordered
in most crystallographic structures of IN. A few studies have
reported a partially resolved loop, and IN catalytic core domains
with a complete loop have been described for only five structures
(1BI4, 1BL3 (Maignan et al., 1998), 1BIS (Goldgur et al., 1998), 2ITG
(Bujacz et al., 1996), and 1B9F (Greenwald et al., 1999)). These
structures are those of single mutants (F185H in 1BL3, 1BI4, and
2ITG), double mutants (W131E/F185K in 1BIS) or triple mutants
(G140A/G149A/F185K in 1B9F). Major differences have been
observed between the conformations of the catalytic loop in
structures in which it is ordered.
Structural data relate to the protein in a static state and provide
no time-dependent information about conformational flexibility.
Molecular dynamics (MD) simulations are therefore required to
obtain additional information about protein mobility. It has been
demonstrated for the simplest catalytic domain model that the
140–149 loop moves like a gate, opening and closing the catalytic
site (Weber et al., 1998). A significant conformational change,
involving the catalytic site loop and the E152 residue of the DDE
motif, hasbeenshowntooccurwhenasecondmetal ion is included
(Lins et al., 2000a, b). The dynamic behavior of the HIV-1 IN catalytic
domain has been described for the wild-type (WT) enzyme (Lins
etal., 1999), for theT66I/M154I (Brigoetal., 2005)andG140A/G149A
(Lee et al., 2005)mutants; and for theenzymealoneandcomplexed
with the inhibitor 5CITEP (Nunthaboot et al., 2007a, b). These MD
studies showed that significant, and apparently important
conformational interactions occur in the active site. They also
demonstrate the importance of the flexibility of the 140–149 loop
for catalysis, but not for substrate recognition. Subsequent studies
of the dynamic behavior of the 140–149 loop as a function of the
presence/absence of the vDNA demonstrated that interactions
with DNA induced an increase in the degree of folding of the
protein structure (De Luca et al., 2005).
Interest in the catalytic site loop has recently increased, with the
emergence of Q148R/K/H and G140S mutations in the loop or of
N155H mutations in the catalytic site being linked to the
development of resistance to raltegravir (RAL), the first efficient
IN inhibitor to be identified in clinical practice (Charpentier et al.,
2008; Cooper et al., 2008; Kobayashi et al., 2008; Malet et al., 2008;
MyersandPillay, 2008).We investigated the impactof the resistance
mutations selected by RAL, by comparing the structural and DNA
recognition properties of the WT and RAL-resistant HIV-1 IN
catalytic coredomain.Wecarriedout anexhaustive in silico studyof
the impact of RAL-selected mutations on IN structure. Secondary
structure and substructure folding predictions, 3Dmodeling of the
catalytic core domain architecture and comparisons of the DNA
base recognition properties of WT and mutant proteins provided
insight into the potential mechanisms of action of raltegravir
against integrase and apossible explanation for the twoalternative
pathways of RAL-selected mutations.
METHODS
All calculations were carried out on a PC running RedHat
Enterprise Linux5. The PDB (Berman et al., 2000) and IsoStar (v2.0)
(Bruno et al., 1997) databases were used. Modeling was
performed with SYBYL (version 7.3) software (Tripos Inc.,
2007). The ab initio 3D structure of the 10-residue GIPYNPQSQGV
polypeptide was generated with the PEP-FOLD approach
(Maupetit et al., 2007). Figures were produced with Benchware
3D Explorer (Tripos Inc., 2008) and PyMol (DeLano, 2002).
Secondary structure analysis
Secondary structure assignment for the 1BL3 (Maignan et al.,
1998) (chain C) structure was achievedwith the DSSP (Kabsch and
Sander, 1983) and Stride (Frishman and Argos, 1995) approaches
J. Mol. Recognit. 2009; 22: 480–494 Copyright ß 2009 John Wiley & Sons, Ltd. www.interscience.wiley.com/journal/jmr
DNA RECOGNITION OF RAL RESISTANT IN
481
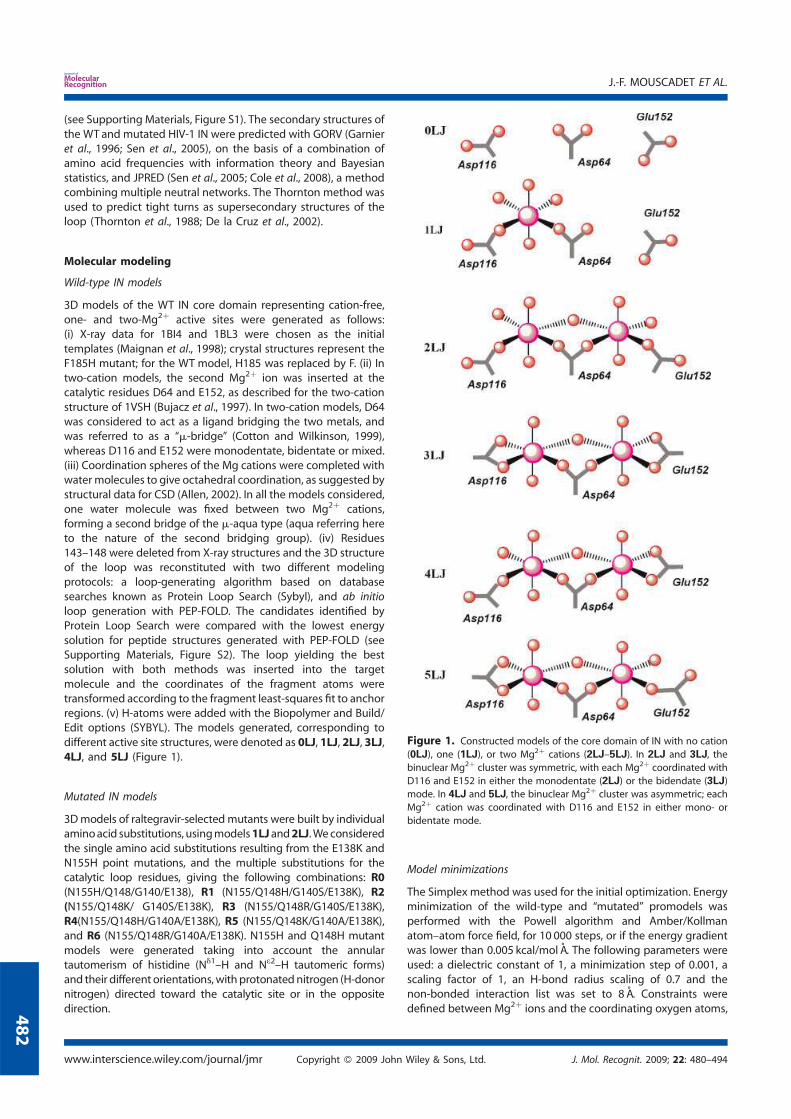
(see Supporting Materials, Figure S1). The secondary structures of
the WT and mutated HIV-1 IN were predicted with GORV (Garnier
et al., 1996; Sen et al., 2005), on the basis of a combination of
amino acid frequencies with information theory and Bayesian
statistics, and JPRED (Sen et al., 2005; Cole et al., 2008), a method
combining multiple neutral networks. The Thornton method was
used to predict tight turns as supersecondary structures of the
loop (Thornton et al., 1988; De la Cruz et al., 2002).
Molecular modeling
Wild-type IN models
3D models of the WT IN core domain representing cation-free,
one- and two-Mg2þ active sites were generated as follows:
(i) X-ray data for 1BI4 and 1BL3 were chosen as the initial
templates (Maignan et al., 1998); crystal structures represent the
F185H mutant; for the WT model, H185 was replaced by F. (ii) In
two-cation models, the second Mg2þ ion was inserted at the
catalytic residues D64 and E152, as described for the two-cation
structure of 1VSH (Bujacz et al., 1997). In two-cation models, D64
was considered to act as a ligand bridging the two metals, and
was referred to as a ‘‘m-bridge’’ (Cotton and Wilkinson, 1999),
whereas D116 and E152 were monodentate, bidentate or mixed.
(iii) Coordination spheres of the Mg cations were completed with
water molecules to give octahedral coordination, as suggested by
structural data for CSD (Allen, 2002). In all the models considered,
one water molecule was fixed between two Mg2þ cations,
forming a second bridge of the m-aqua type (aqua referring here
to the nature of the second bridging group). (iv) Residues
143–148 were deleted from X-ray structures and the 3D structure
of the loop was reconstituted with two different modeling
protocols: a loop-generating algorithm based on database
searches known as Protein Loop Search (Sybyl), and ab initio
loop generation with PEP-FOLD. The candidates identified by
Protein Loop Search were compared with the lowest energy
solution for peptide structures generated with PEP-FOLD (see
Supporting Materials, Figure S2). The loop yielding the best
solution with both methods was inserted into the target
molecule and the coordinates of the fragment atoms were
transformed according to the fragment least-squares fit to anchor
regions. (v) H-atoms were added with the Biopolymer and Build/
Edit options (SYBYL). The models generated, corresponding to
different active site structures, were denoted as 0LJ, 1LJ, 2LJ, 3LJ,
4LJ, and 5LJ (Figure 1).
Mutated IN models
3Dmodels of raltegravir-selected mutants were built by individual
aminoacid substitutions, usingmodels1LJ and2LJ.We considered
the single amino acid substitutions resulting from the E138K and
N155H point mutations, and the multiple substitutions for the
catalytic loop residues, giving the following combinations: R0
(N155H/Q148/G140/E138), R1 (N155/Q148H/G140S/E138K), R2
(N155/Q148K/ G140S/E138K), R3 (N155/Q148R/G140S/E138K),
R4(N155/Q148H/G140A/E138K), R5 (N155/Q148K/G140A/E138K),
and R6 (N155/Q148R/G140A/E138K). N155H and Q148H mutant
models were generated taking into account the annular
tautomerism of histidine (Nd1–H and Ne2–H tautomeric forms)
and their different orientations, withprotonatednitrogen (H-donor
nitrogen) directed toward the catalytic site or in the opposite
direction.
Model minimizations
The Simplex method was used for the initial optimization. Energy
minimization of the wild-type and ‘‘mutated’’ promodels was
performed with the Powell algorithm and Amber/Kollman
atom–atom force field, for 10 000 steps, or if the energy gradient
was lower than 0.005 kcal/mol A. The following parameters were
used: a dielectric constant of 1, a minimization step of 0.001, a
scaling factor of 1, an H-bond radius scaling of 0.7 and the
non-bonded interaction list was set to 8 A. Constraints were
defined between Mg2þ ions and the coordinating oxygen atoms,
Figure 1. Constructed models of the core domain of IN with no cation
(0LJ), one (1LJ), or two Mg2þ cations (2LJ–5LJ). In 2LJ and 3LJ, the
binuclear Mg2þ cluster was symmetric, with each Mg2þ coordinated with
D116 and E152 in either the monodentate (2LJ) or the bidendate (3LJ)
mode. In 4LJ and 5LJ, the binuclear Mg2þ cluster was asymmetric; each
Mg2þ cation was coordinated with D116 and E152 in either mono- or
bidentate mode.
www.interscience.wiley.com/journal/jmr Copyright ß 2009 John Wiley & Sons, Ltd. J. Mol. Recognit. 2009; 22: 480–494
J.-F. MOUSCADET ET AL.
482
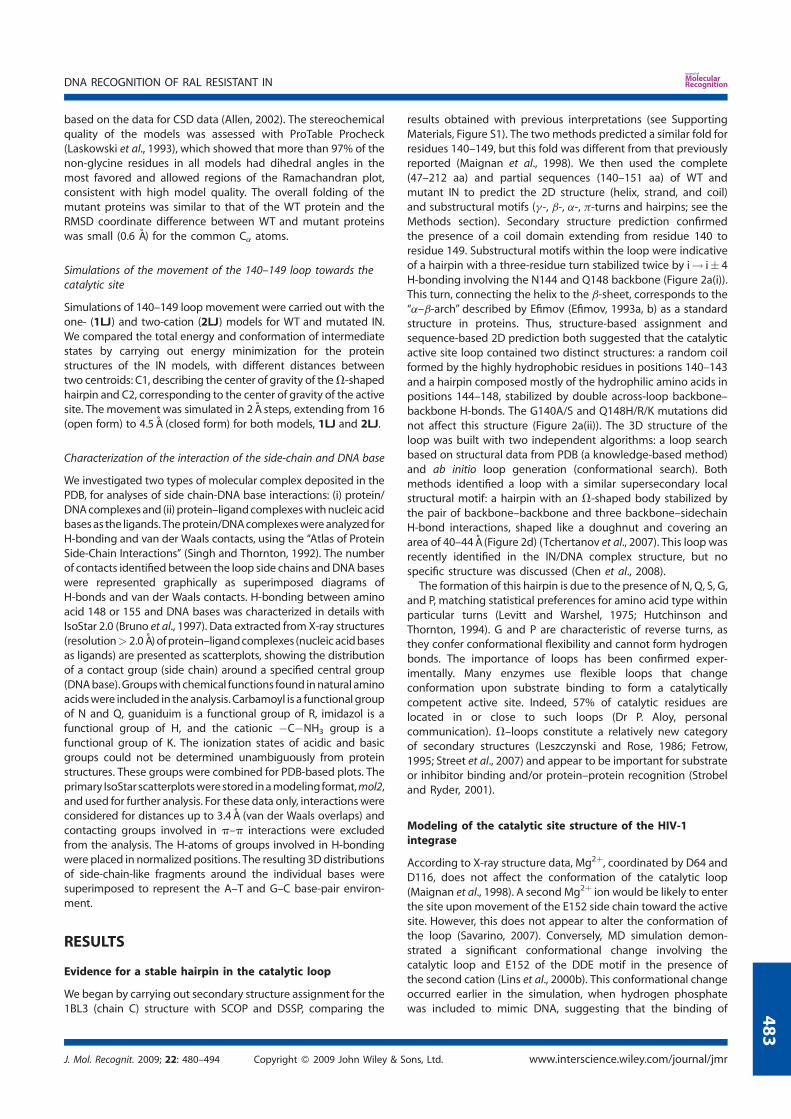
based on the data for CSD data (Allen, 2002). The stereochemical
quality of the models was assessed with ProTable Procheck
(Laskowski et al., 1993), which showed that more than 97% of the
non-glycine residues in all models had dihedral angles in the
most favored and allowed regions of the Ramachandran plot,
consistent with high model quality. The overall folding of the
mutant proteins was similar to that of the WT protein and the
RMSD coordinate difference between WT and mutant proteins
was small (0.6 A) for the common Ca atoms.
Simulations of the movement of the 140–149 loop towards the
catalytic site
Simulations of 140–149 loop movement were carried out with the
one- (1LJ) and two-cation (2LJ) models for WT and mutated IN.
We compared the total energy and conformation of intermediate
states by carrying out energy minimization for the protein
structures of the IN models, with different distances between
two centroids: C1, describing the center of gravity of theV-shaped
hairpin and C2, corresponding to the center of gravity of the active
site. Themovement was simulated in 2 A steps, extending from 16
(open form) to 4.5 A (closed form) for both models, 1LJ and 2LJ.
Characterization of the interaction of the side-chain and DNA base
We investigated two types of molecular complex deposited in the
PDB, for analyses of side chain-DNA base interactions: (i) protein/
DNAcomplexesand (ii) protein–ligandcomplexeswithnucleic acid
basesas the ligands. Theprotein/DNAcomplexeswereanalyzed for
H-bonding and van der Waals contacts, using the ‘‘Atlas of Protein
Side-Chain Interactions’’ (Singh and Thornton, 1992). The number
of contacts identified between the loop side chains andDNAbases
were represented graphically as superimposed diagrams of
H-bonds and van der Waals contacts. H-bonding between amino
acid 148 or 155 and DNA bases was characterized in details with
IsoStar 2.0 (Bruno et al., 1997). Data extracted from X-ray structures
(resolution> 2.0 A) ofprotein–ligandcomplexes (nucleicacidbases
as ligands) are presented as scatterplots, showing the distribution
of a contact group (side chain) around a specified central group
(DNAbase).Groupswith chemical functions found innatural amino
acidswere included in the analysis. Carbamoyl is a functional group
of N and Q, guaniduim is a functional group of R, imidazol is a
functional group of H, and the cationic ÿCÿNH3 group is a
functional group of K. The ionization states of acidic and basic
groups could not be determined unambiguously from protein
structures. These groups were combined for PDB-based plots. The
primary IsoStar scatterplotswerestored inamodeling format,mol2,
and used for further analysis. For these data only, interactionswere
considered for distances up to 3.4 A (van der Waals overlaps) and
contacting groups involved in p–p interactions were excluded
from the analysis. The H-atoms of groups involved in H-bonding
were placed in normalized positions. The resulting 3Ddistributions
of side-chain-like fragments around the individual bases were
superimposed to represent the A–T and G–C base-pair environ-
ment.
RESULTS
Evidence for a stable hairpin in the catalytic loop
We began by carrying out secondary structure assignment for the
1BL3 (chain C) structure with SCOP and DSSP, comparing the
results obtained with previous interpretations (see Supporting
Materials, Figure S1). The twomethods predicted a similar fold for
residues 140–149, but this fold was different from that previously
reported (Maignan et al., 1998). We then used the complete
(47–212 aa) and partial sequences (140–151 aa) of WT and
mutant IN to predict the 2D structure (helix, strand, and coil)
and substructural motifs (g-, b-, a-, p-turns and hairpins; see the
Methods section). Secondary structure prediction confirmed
the presence of a coil domain extending from residue 140 to
residue 149. Substructural motifs within the loop were indicative
of a hairpin with a three-residue turn stabilized twice by i! i 4
H-bonding involving the N144 and Q148 backbone (Figure 2a(i)).
This turn, connecting the helix to the b-sheet, corresponds to the
‘‘a–b-arch’’ described by Efimov (Efimov, 1993a, b) as a standard
structure in proteins. Thus, structure-based assignment and
sequence-based 2D prediction both suggested that the catalytic
active site loop contained two distinct structures: a random coil
formed by the highly hydrophobic residues in positions 140–143
and a hairpin composed mostly of the hydrophilic amino acids in
positions 144–148, stabilized by double across-loop backbone–
backbone H-bonds. The G140A/S and Q148H/R/K mutations did
not affect this structure (Figure 2a(ii)). The 3D structure of the
loop was built with two independent algorithms: a loop search
based on structural data from PDB (a knowledge-based method)
and ab initio loop generation (conformational search). Both
methods identified a loop with a similar supersecondary local
structural motif: a hairpin with an V-shaped body stabilized by
the pair of backbone–backbone and three backbone–sidechain
H-bond interactions, shaped like a doughnut and covering an
area of 40–44 A (Figure 2d) (Tchertanov et al., 2007). This loop was
recently identified in the IN/DNA complex structure, but no
specific structure was discussed (Chen et al., 2008).
The formation of this hairpin is due to the presence of N, Q, S, G,
and P, matching statistical preferences for amino acid type within
particular turns (Levitt and Warshel, 1975; Hutchinson and
Thornton, 1994). G and P are characteristic of reverse turns, as
they confer conformational flexibility and cannot form hydrogen
bonds. The importance of loops has been confirmed exper-
imentally. Many enzymes use flexible loops that change
conformation upon substrate binding to form a catalytically
competent active site. Indeed, 57% of catalytic residues are
located in or close to such loops (Dr P. Aloy, personal
communication). V–loops constitute a relatively new category
of secondary structures (Leszczynski and Rose, 1986; Fetrow,
1995; Street et al., 2007) and appear to be important for substrate
or inhibitor binding and/or protein–protein recognition (Strobel
and Ryder, 2001).
Modeling of the catalytic site structure of the HIV-1
integrase
According to X-ray structure data, Mg2þ, coordinated by D64 and
D116, does not affect the conformation of the catalytic loop
(Maignan et al., 1998). A second Mg2þ ion would be likely to enter
the site upon movement of the E152 side chain toward the active
site. However, this does not appear to alter the conformation of
the loop (Savarino, 2007). Conversely, MD simulation demon-
strated a significant conformational change involving the
catalytic loop and E152 of the DDE motif in the presence of
the second cation (Lins et al., 2000b). This conformational change
occurred earlier in the simulation, when hydrogen phosphate
was included to mimic DNA, suggesting that the binding of
J. Mol. Recognit. 2009; 22: 480–494 Copyright ß 2009 John Wiley & Sons, Ltd. www.interscience.wiley.com/journal/jmr
DNA RECOGNITION OF RAL RESISTANT IN
483

the second cation and the resulting conformational change
occurred upon DNA binding. We investigated the effect of
the metal cofactor further, by constructing models of the core
domain with no cation (0LJ), one (1LJ) or two Mg2þ cations
(2LJ–5LJ), starting from the 1BI4 and 1BL3 templates, as
described in the Methods section (Figure 1). In the 2LJ and
3LJmodels, the binuclear Mg2þ cluster was symmetric, with each
Mg2þ ion coordinated by the D116 and E152 residues in either a
monodentate (2LJ) or a bidentate (3LJ) mode. In the 4LJ and 5LJ
models, the binuclear Mg2þ cluster was asymmetric, with each
Mg2þ cation coordinated by D116 and E152 in either a mono- or
bidentate mode. All the 3D models had similar topologies
(Figure 2b). The first two models, 0LJ and 1LJ, did not differ from
their templates: Mg2þ was coordinated by D64 and D116 and the
other positions were occupied by water molecules, constituting
pseudo-octahedral Mg coordination. The other models had a
binuclear Mg2þ core with two non-identical bridges, the D64, and
the m-aqua bridge, with the water molecule bridging the gap
between the two coordination centers. These binuclear models
differed in the mode of chelation of D116 and E152. Based on the
total energy values of the complexes modeled, the 3LJ and 5LJ
models were excluded from further analysis due to their low
probability.
D64 andwater stabilize the binuclear complex, with a Mg Mg
distance of 4.2 A for both the 2LJ and 4LJmodels. This distance is
slightly smaller than the equivalent distance in the 1SA model
(4.5 A)(Savarino, 2007) and greater than that in the 1WKN model
(3.9 A)(De Luca et al., 2005). All side chains of the catalytic amino
acids involved in coordination are in a cis-position relative to the
Mg Mg axis, with E152 arranged in the equatorial and D116 in
the axial position (Figure 2c). In two-cation models, the D64
carboxylate group was rotated by about 308 relative to the
Mg O Mg plane, corresponding to the D64 configuration in
the cation-free and one-cation models. Thus, the conformation of
bridged D64 was not affected by the second Mg2þ. By contrast,
the binding of the second Mg2þ ion required a major change in
the conformation of the E152 side chains: the Chi1, Chi2, and Chi3
angles were ÿ167, 169, and ÿ38 in 1LJ and ÿ174, 58, and 568 in
2LJ models. The binding of the second cation also required a
slight alteration to both the D116 side chain and the first Mg2þ
ion relative to its position in the one-cation model. Two modes of
Mg coordination by E152 were possible (monodentate for 2LJ
and mixed for 4LJ), but the type of coordination had no
significant effect on the two-cation model. Finally, the Mg2þ O
distances corresponded to typical coordination bonds in
Mg-containing complexes. Based on the covalent and ionic radii
of the Mg and O atoms, the chelation of Mg2þ was essentially
ionic.
The N155 residue, in the a4 helix, is a primary site of mutation
leading to raltegravir resistance. The position and orientation of
N155 relative to D64 favors ÿ(NH2)N155 O¼D64 H-bonding (see
Supporting Materials, Figure S3). In cation-free and one-cation
models, this H-bond was bifurcated and involved both H atoms of
the 155 NH2 group, which was also H-bonded to a carbonyl
oxygen atom of the D64 backbone. Only the NÿHN155 O¼E152
backbone–backbone interaction was involved in stabilizing the
a4 helix, the distances between the N155 and E152 side chains
being greater than for van der Waals (VdW) contacts. In the
two-cation model, the E152 residue complexed with Mg2þ is
oriented in a position favoring H-bonding with N155. Con-
sequently—unlike the H-bonding involving two partners in
cation-free and one-cation models—a three-partner H-bond is
Figure 2. Structure of the HIV-1 IN core domain: (a) 2D prediction of the
wild-type (i) and mutated (ii) loop of IN comprising residues 140–149. The
first line represents the amino acid sequence; the second line represents
the beta sheet stabilized by H-bonding and the third line indicates the
turn state per residue. (b) Superimposition of the 0LJ, 1LJ, 2LJ and 4LJ
(the wild-type IN) 3D models generated. Ribbon diagram, with the
backbone and catalytic amino acid side chains shown as sticks; Mg2þ
ions are not shown. (c) Active site: side chains of catalytic amino acids and
Mg2þ cations shown as sticks and balls, respectively; coordination dis-
tances shown as dashed lines. Colors: gray (0LJ), orange (1LJ), yellow
(2LJ) and green (4LJ). (d) Top: Catalytic loop structure; residues are
shown as sticks, H-bonds as dashed lines. Colors: gray (0LJ), orange
(1LJ), yellow (2LJ) and green (4LJ). Bottom: H-bonding patterns of
the HIV-1 IN 131–149 domain observed in 3-D models. The residues
140–149 are shown in blue. H-bonds between the residues are shown by
dashed lines.
www.interscience.wiley.com/journal/jmr Copyright ß 2009 John Wiley & Sons, Ltd. J. Mol. Recognit. 2009; 22: 480–494
J.-F. MOUSCADET ET AL.
484
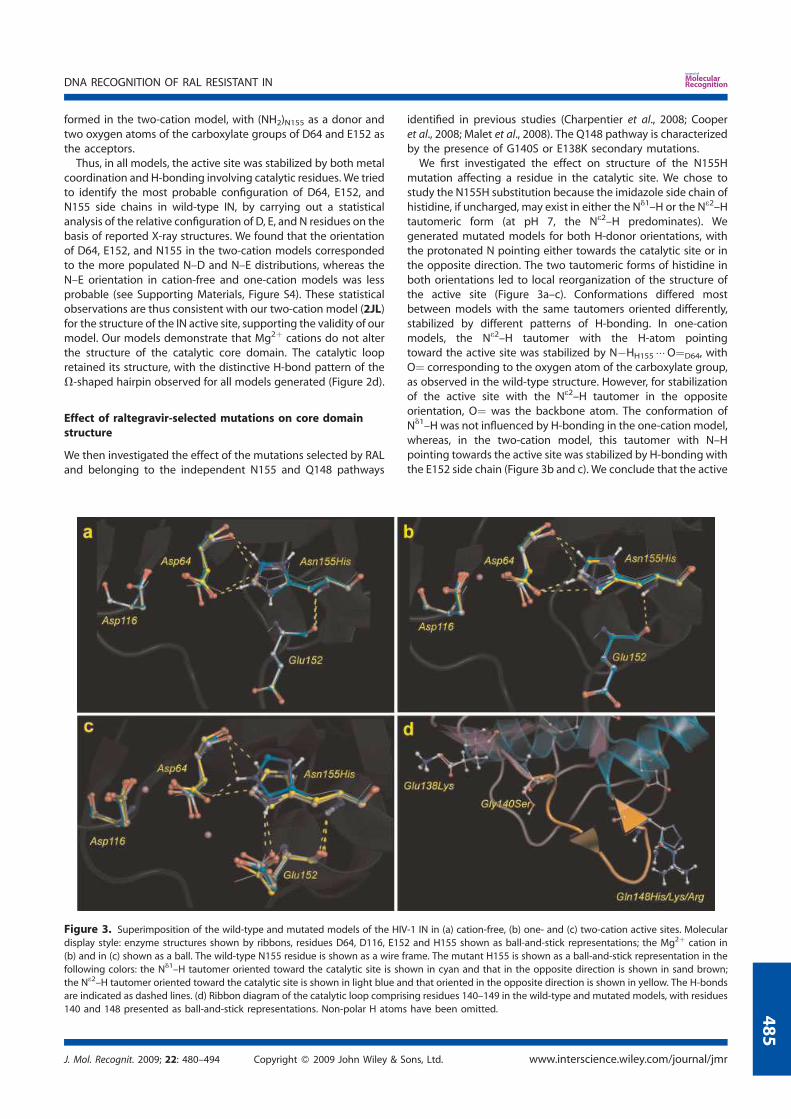
formed in the two-cation model, with (NH2)N155 as a donor and
two oxygen atoms of the carboxylate groups of D64 and E152 as
the acceptors.
Thus, in all models, the active site was stabilized by both metal
coordination and H-bonding involving catalytic residues. We tried
to identify the most probable configuration of D64, E152, and
N155 side chains in wild-type IN, by carrying out a statistical
analysis of the relative configuration of D, E, and N residues on the
basis of reported X-ray structures. We found that the orientation
of D64, E152, and N155 in the two-cation models corresponded
to the more populated N–D and N–E distributions, whereas the
N–E orientation in cation-free and one-cation models was less
probable (see Supporting Materials, Figure S4). These statistical
observations are thus consistent with our two-cation model (2JL)
for the structure of the IN active site, supporting the validity of our
model. Our models demonstrate that Mg2þ cations do not alter
the structure of the catalytic core domain. The catalytic loop
retained its structure, with the distinctive H-bond pattern of the
V-shaped hairpin observed for all models generated (Figure 2d).
Effect of raltegravir-selected mutations on core domain
structure
We then investigated the effect of the mutations selected by RAL
and belonging to the independent N155 and Q148 pathways
identified in previous studies (Charpentier et al., 2008; Cooper
et al., 2008; Malet et al., 2008). The Q148 pathway is characterized
by the presence of G140S or E138K secondary mutations.
We first investigated the effect on structure of the N155H
mutation affecting a residue in the catalytic site. We chose to
study the N155H substitution because the imidazole side chain of
histidine, if uncharged, may exist in either the Nd1–H or the Ne2–H
tautomeric form (at pH 7, the Ne2–H predominates). We
generated mutated models for both H-donor orientations, with
the protonated N pointing either towards the catalytic site or in
the opposite direction. The two tautomeric forms of histidine in
both orientations led to local reorganization of the structure of
the active site (Figure 3a–c). Conformations differed most
between models with the same tautomers oriented differently,
stabilized by different patterns of H-bonding. In one-cation
models, the Ne2–H tautomer with the H-atom pointing
toward the active site was stabilized by NÿHH155 O¼D64, with
O¼ corresponding to the oxygen atom of the carboxylate group,
as observed in the wild-type structure. However, for stabilization
of the active site with the Ne2–H tautomer in the opposite
orientation, O¼ was the backbone atom. The conformation of
Nd1–H was not influenced by H-bonding in the one-cation model,
whereas, in the two-cation model, this tautomer with N–H
pointing towards the active site was stabilized by H-bonding with
the E152 side chain (Figure 3b and c). We conclude that the active
Figure 3. Superimposition of the wild-type and mutated models of the HIV-1 IN in (a) cation-free, (b) one- and (c) two-cation active sites. Molecular
display style: enzyme structures shown by ribbons, residues D64, D116, E152 and H155 shown as ball-and-stick representations; the Mg2þ cation in
(b) and in (c) shown as a ball. The wild-type N155 residue is shown as a wire frame. The mutant H155 is shown as a ball-and-stick representation in the
following colors: the Nd1–H tautomer oriented toward the catalytic site is shown in cyan and that in the opposite direction is shown in sand brown;
the Ne2–H tautomer oriented toward the catalytic site is shown in light blue and that oriented in the opposite direction is shown in yellow. The H-bonds
are indicated as dashed lines. (d) Ribbon diagram of the catalytic loop comprising residues 140–149 in the wild-type and mutated models, with residues
140 and 148 presented as ball-and-stick representations. Non-polar H atoms have been omitted.
J. Mol. Recognit. 2009; 22: 480–494 Copyright ß 2009 John Wiley & Sons, Ltd. www.interscience.wiley.com/journal/jmr
DNA RECOGNITION OF RAL RESISTANT IN
485
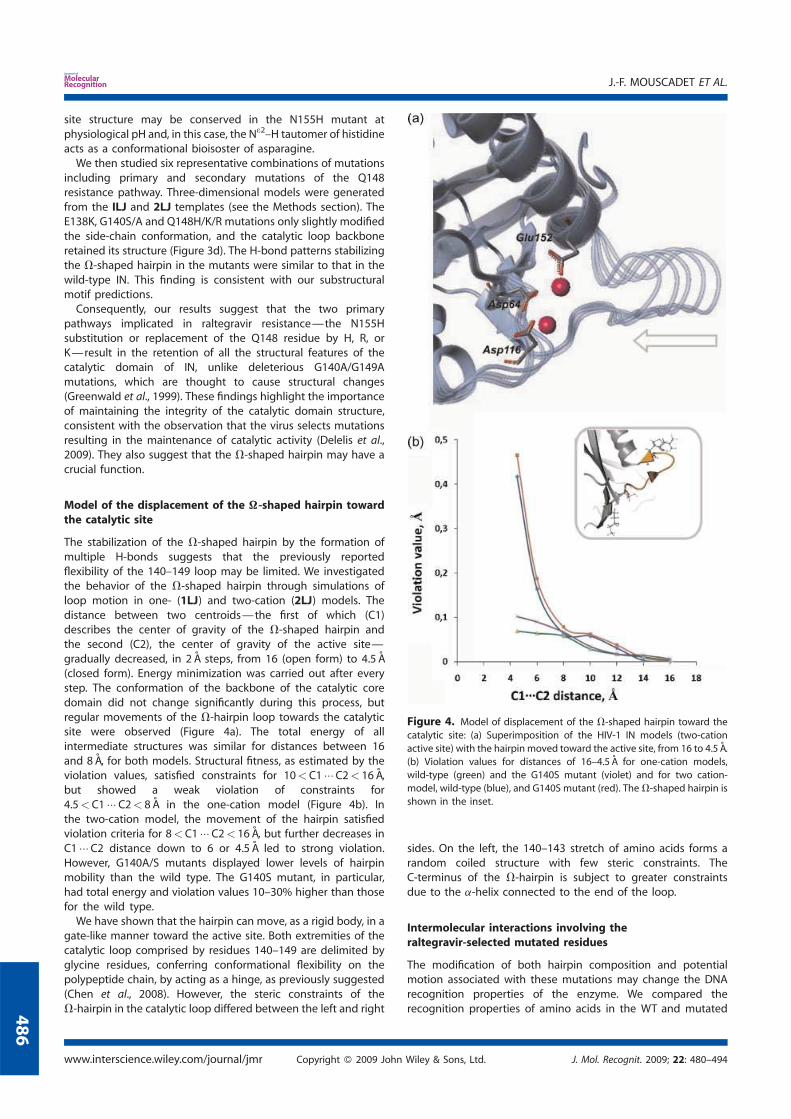
site structure may be conserved in the N155H mutant at
physiological pH and, in this case, the Ne2–H tautomer of histidine
acts as a conformational bioisoster of asparagine.
We then studied six representative combinations of mutations
including primary and secondary mutations of the Q148
resistance pathway. Three-dimensional models were generated
from the ILJ and 2LJ templates (see the Methods section). The
E138K, G140S/A and Q148H/K/R mutations only slightly modified
the side-chain conformation, and the catalytic loop backbone
retained its structure (Figure 3d). The H-bond patterns stabilizing
the V-shaped hairpin in the mutants were similar to that in the
wild-type IN. This finding is consistent with our substructural
motif predictions.
Consequently, our results suggest that the two primary
pathways implicated in raltegravir resistance—the N155H
substitution or replacement of the Q148 residue by H, R, or
K—result in the retention of all the structural features of the
catalytic domain of IN, unlike deleterious G140A/G149A
mutations, which are thought to cause structural changes
(Greenwald et al., 1999). These findings highlight the importance
of maintaining the integrity of the catalytic domain structure,
consistent with the observation that the virus selects mutations
resulting in the maintenance of catalytic activity (Delelis et al.,
2009). They also suggest that the V-shaped hairpin may have a
crucial function.
Model of the displacement of the V-shaped hairpin toward
the catalytic site
The stabilization of the V-shaped hairpin by the formation of
multiple H-bonds suggests that the previously reported
flexibility of the 140–149 loop may be limited. We investigated
the behavior of the V-shaped hairpin through simulations of
loop motion in one- (1LJ) and two-cation (2LJ) models. The
distance between two centroids—the first of which (C1)
describes the center of gravity of the V-shaped hairpin and
the second (C2), the center of gravity of the active site—
gradually decreased, in 2 A steps, from 16 (open form) to 4.5 A
(closed form). Energy minimization was carried out after every
step. The conformation of the backbone of the catalytic core
domain did not change significantly during this process, but
regular movements of the V-hairpin loop towards the catalytic
site were observed (Figure 4a). The total energy of all
intermediate structures was similar for distances between 16
and 8 A, for both models. Structural fitness, as estimated by the
violation values, satisfied constraints for 10< C1 C2< 16 A,
but showed a weak violation of constraints for
4.5<C1 C2< 8 A in the one-cation model (Figure 4b). In
the two-cation model, the movement of the hairpin satisfied
violation criteria for 8< C1 C2< 16 A, but further decreases in
C1 C2 distance down to 6 or 4.5 A led to strong violation.
However, G140A/S mutants displayed lower levels of hairpin
mobility than the wild type. The G140S mutant, in particular,
had total energy and violation values 10–30% higher than those
for the wild type.
We have shown that the hairpin can move, as a rigid body, in a
gate-like manner toward the active site. Both extremities of the
catalytic loop comprised by residues 140–149 are delimited by
glycine residues, conferring conformational flexibility on the
polypeptide chain, by acting as a hinge, as previously suggested
(Chen et al., 2008). However, the steric constraints of the
V-hairpin in the catalytic loop differed between the left and right
sides. On the left, the 140–143 stretch of amino acids forms a
random coiled structure with few steric constraints. The
C-terminus of the V-hairpin is subject to greater constraints
due to the a-helix connected to the end of the loop.
Intermolecular interactions involving the
raltegravir-selected mutated residues
The modification of both hairpin composition and potential
motion associated with these mutations may change the DNA
recognition properties of the enzyme. We compared the
recognition properties of amino acids in the WT and mutated
Figure 4. Model of displacement of the V-shaped hairpin toward the
catalytic site: (a) Superimposition of the HIV-1 IN models (two-cation
active site) with the hairpin moved toward the active site, from 16 to 4.5 A.
(b) Violation values for distances of 16–4.5 A for one-cation models,
wild-type (green) and the G140S mutant (violet) and for two cation-
model, wild-type (blue), and G140S mutant (red). TheV-shaped hairpin is
shown in the inset.
www.interscience.wiley.com/journal/jmr Copyright ß 2009 John Wiley & Sons, Ltd. J. Mol. Recognit. 2009; 22: 480–494
J.-F. MOUSCADET ET AL.
486

IN. We focused on the non-covalent interactions underlying the
recognition properties of the residues at positions 155 and 148,
corresponding to the primary mutations selected by raltegravir.
Based on the known structures of protein/DNA complexes, we
assessed the statistical probability of these residues recognizing
DNA bases (see the Methods section). We found that asparagine
(N) and glutamine (Q) residues preferentially recognized adenine,
as H-bonds formed with this base represented a significant
non-random cluster, whereas the H-bonds formed with cytosine,
guanine, and thymine followed a random distribution. The
replacement of the N residue in position 155 by an H residue led
to the loss of H-bonding with adenine (A), thymine (T), and
cytosine (C) (Figure 5). The replacement of Q148 by a histidine (H)
residue had a similar effect, whereas its replacement with a lysine
(K) or arginine (R) residue strongly favored interactions with
guanine (G), A, and T. Finally, although van der Waals (VdW)
contacts are not generally affected by sequence specificity,
substitutions resulting in an H residue replacing Q148 or N155
also resulted in a complete loss of VdW contacts with adenine.
3D maps of H-bonding between residues 148 and 155 and
DNA bases
We investigated further the DNA recognition properties of the IN
residues implicated in RAL resistance, by characterizing in detail
the H-bonding between residues 148 and 155 and DNA bases, in
particular. We used an IsoStar library, making it possible to
construct 3D profiles describing the spatial orientation of
non-covalently interacting partners (see the Methods section).
This library provides access to information about the preferences
of these amino acids for interaction with particular DNA bases
and the geometry of non-covalent interactions. Despite the lack
of one-to-one specificity, proteins have been shown to
discriminate between A and G, suggesting that they favor a
particular amino acid–base pair (Luscombe et al., 2001; Luscombe
and Thornton, 2002; Cheng et al., 2003): for instance, R, K, serine
(S), and H interact preferentially with guanine, whereas aspartate
(D) and glutamate (E) interact preferentially with adenine.
The profiles of single unpaired bases were characterized, to
construct 3D profiles of the groups around the DNA base pairs
potentially involved in IN/DNA interactions. The 3D distribution
and spatial organization of the side-chain fragments surrounding
DNA bases were constructed, recapitulating the overall geometry
of the DNA bases, and their statistically observed interactions via
the major and minor grooves. The potential hydrogen-bonding
sites of bases and the 3D profiles of H-bonding patterns involved
in binding between DNA bases and the side chains of Q (Q148), N
(N155), and R (Q148R) are shown in Figure 6.
N155 and Q148
Most of the carbamoyl moieties common to N and Q and found in
contact with adenine formed a dense, highly populated cluster in
the major groove (91% of all interacting groups), whereas a small
number of groups interacting with adenine were observed in the
minor groove (Figure 6a and b). Moreover, most of the carbamoyl
groups (67% of all interacting fragments) in the major groove
were coplanar with adenine and formed a pair of strong,
directional H-bonds with N7 and N6H2 in this base (Figure 6a).
Other carbamoyl groups formed only one H-bond with adenine,
with either N6ÿH2 or N7 (Figure 6b). The N/Q side chains in
contact with adenine through the minor groove formed
moderately strong non-linear H-bonds, NH2 N3. Similarly, most
of the carbamoyl groups contacting guanine bases (94%)
clustered in the major groove (Figure 6f and g). Nevertheless,
all contacts were single H-bonds, with either N7 or O6 acceptors,
positioned outside the guanine plane, at a dihedral angle of 458.
Very few occurrences of H-bonded carbamoyl-guanine
(N2H2 O¼) contacts were observed in the minor groove.
Figure 5. Statistical probability of residues 140–155 recognizing DNA bases based on the known structures of protein/DNA complexes. The H-bond
(blue color) and van der Waals (red color) contacts were compiled based on the protein-DNA complexes. Interactions involving residues 148 and 155 are
framed by dashed lines, in green and magenta, respectively.
J. Mol. Recognit. 2009; 22: 480–494 Copyright ß 2009 John Wiley & Sons, Ltd. www.interscience.wiley.com/journal/jmr
DNA RECOGNITION OF RAL RESISTANT IN
487
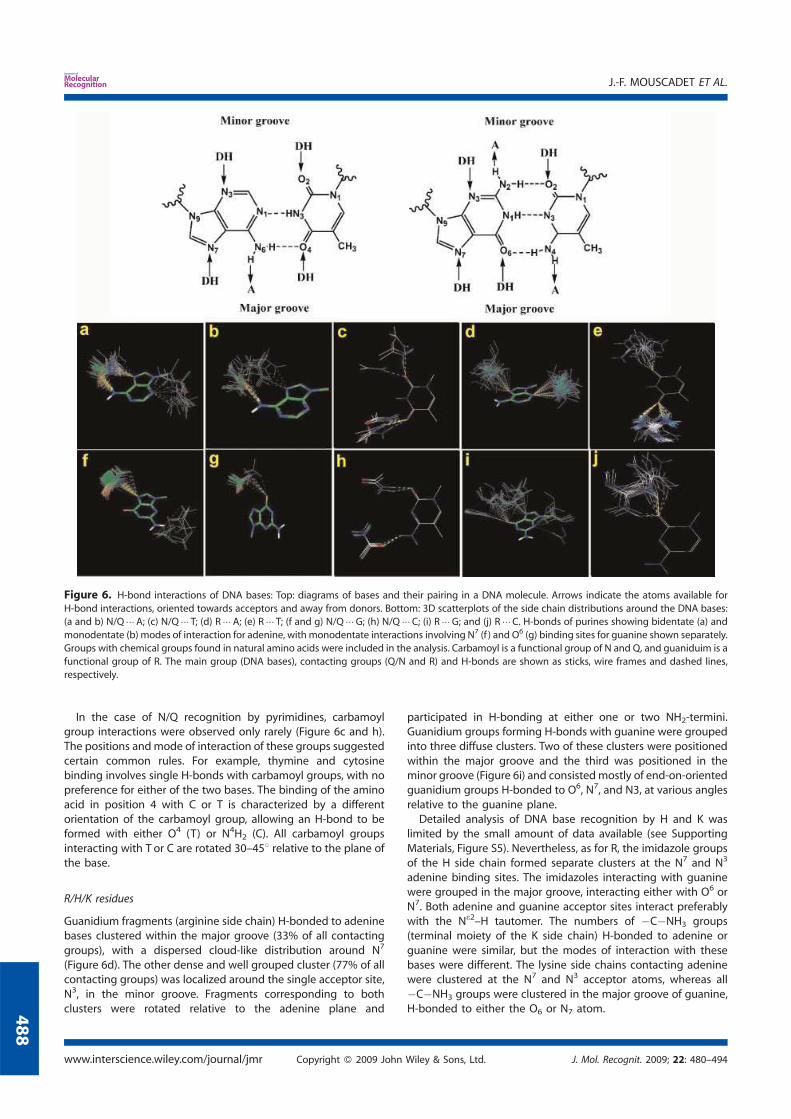
In the case of N/Q recognition by pyrimidines, carbamoyl
group interactions were observed only rarely (Figure 6c and h).
The positions andmode of interaction of these groups suggested
certain common rules. For example, thymine and cytosine
binding involves single H-bonds with carbamoyl groups, with no
preference for either of the two bases. The binding of the amino
acid in position 4 with C or T is characterized by a different
orientation of the carbamoyl group, allowing an H-bond to be
formed with either O4 (T) or N4H2 (C). All carbamoyl groups
interacting with T or C are rotated 30–458 relative to the plane of
the base.
R/H/K residues
Guanidium fragments (arginine side chain) H-bonded to adenine
bases clustered within the major groove (33% of all contacting
groups), with a dispersed cloud-like distribution around N7
(Figure 6d). The other dense and well grouped cluster (77% of all
contacting groups) was localized around the single acceptor site,
N3, in the minor groove. Fragments corresponding to both
clusters were rotated relative to the adenine plane and
participated in H-bonding at either one or two NH2-termini.
Guanidium groups forming H-bonds with guanine were grouped
into three diffuse clusters. Two of these clusters were positioned
within the major groove and the third was positioned in the
minor groove (Figure 6i) and consistedmostly of end-on-oriented
guanidium groups H-bonded to O6, N7, and N3, at various angles
relative to the guanine plane.
Detailed analysis of DNA base recognition by H and K was
limited by the small amount of data available (see Supporting
Materials, Figure S5). Nevertheless, as for R, the imidazole groups
of the H side chain formed separate clusters at the N7 and N3
adenine binding sites. The imidazoles interacting with guanine
were grouped in the major groove, interacting either with O6 or
N7. Both adenine and guanine acceptor sites interact preferably
with the Ne2–H tautomer. The numbers of ÿCÿNH3 groups
(terminal moiety of the K side chain) H-bonded to adenine or
guanine were similar, but the modes of interaction with these
bases were different. The lysine side chains contacting adenine
were clustered at the N7 and N3 acceptor atoms, whereas all
ÿCÿNH3 groups were clustered in the major groove of guanine,
H-bonded to either the O6 or N7 atom.
Figure 6. H-bond interactions of DNA bases: Top: diagrams of bases and their pairing in a DNA molecule. Arrows indicate the atoms available for
H-bond interactions, oriented towards acceptors and away from donors. Bottom: 3D scatterplots of the side chain distributions around the DNA bases:
(a and b) N/Q A; (c) N/Q T; (d) R A; (e) R T; (f and g) N/Q G; (h) N/Q C; (i) R G; and (j) R C. H-bonds of purines showing bidentate (a) and
monodentate (b) modes of interaction for adenine, with monodentate interactions involving N7 (f ) and O6 (g) binding sites for guanine shown separately.
Groups with chemical groups found in natural amino acids were included in the analysis. Carbamoyl is a functional group of N and Q, and guaniduim is a
functional group of R. The main group (DNA bases), contacting groups (Q/N and R) and H-bonds are shown as sticks, wire frames and dashed lines,
respectively.
www.interscience.wiley.com/journal/jmr Copyright ß 2009 John Wiley & Sons, Ltd. J. Mol. Recognit. 2009; 22: 480–494
J.-F. MOUSCADET ET AL.
488
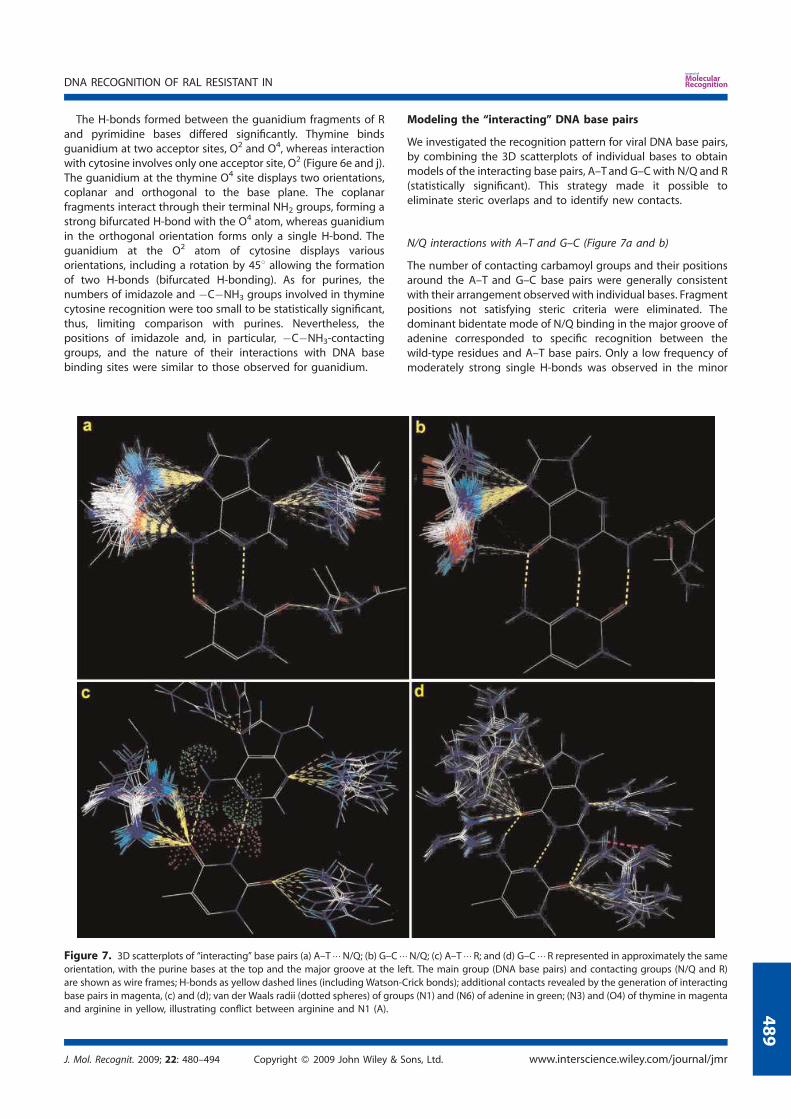
The H-bonds formed between the guanidium fragments of R
and pyrimidine bases differed significantly. Thymine binds
guanidium at two acceptor sites, O2 and O4, whereas interaction
with cytosine involves only one acceptor site, O2 (Figure 6e and j).
The guanidium at the thymine O4 site displays two orientations,
coplanar and orthogonal to the base plane. The coplanar
fragments interact through their terminal NH2 groups, forming a
strong bifurcated H-bond with the O4 atom, whereas guanidium
in the orthogonal orientation forms only a single H-bond. The
guanidium at the O2 atom of cytosine displays various
orientations, including a rotation by 458 allowing the formation
of two H-bonds (bifurcated H-bonding). As for purines, the
numbers of imidazole and ÿCÿNH3 groups involved in thymine
cytosine recognition were too small to be statistically significant,
thus, limiting comparison with purines. Nevertheless, the
positions of imidazole and, in particular, ÿCÿNH3-contacting
groups, and the nature of their interactions with DNA base
binding sites were similar to those observed for guanidium.
Modeling the ‘‘interacting’’ DNA base pairs
We investigated the recognition pattern for viral DNA base pairs,
by combining the 3D scatterplots of individual bases to obtain
models of the interacting base pairs, A–T and G–C with N/Q and R
(statistically significant). This strategy made it possible to
eliminate steric overlaps and to identify new contacts.
N/Q interactions with A–T and G–C (Figure 7a and b)
The number of contacting carbamoyl groups and their positions
around the A–T and G–C base pairs were generally consistent
with their arrangement observedwith individual bases. Fragment
positions not satisfying steric criteria were eliminated. The
dominant bidentate mode of N/Q binding in the major groove of
adenine corresponded to specific recognition between the
wild-type residues and A–T base pairs. Only a low frequency of
moderately strong single H-bonds was observed in the minor
Figure 7. 3D scatterplots of ‘‘interacting’’ base pairs (a) A–T N/Q; (b) G–C N/Q; (c) A–T R; and (d) G–C R represented in approximately the same
orientation, with the purine bases at the top and the major groove at the left. The main group (DNA base pairs) and contacting groups (N/Q and R)
are shown as wire frames; H-bonds as yellow dashed lines (including Watson-Crick bonds); additional contacts revealed by the generation of interacting
base pairs in magenta, (c) and (d); van der Waals radii (dotted spheres) of groups (N1) and (N6) of adenine in green; (N3) and (O4) of thymine in magenta
and arginine in yellow, illustrating conflict between arginine and N1 (A).
J. Mol. Recognit. 2009; 22: 480–494 Copyright ß 2009 John Wiley & Sons, Ltd. www.interscience.wiley.com/journal/jmr
DNA RECOGNITION OF RAL RESISTANT IN
489
groove. By contrast to this marked preference and specificity of
WT side chains for A–T base pairs, the interaction of N/Q side
chains with G–C base pairs was nonspecific, resulting in the
formation of a single H-bond with the N7 or ¼O6 acceptor site in
guanine.
Arginine side chain interactions with A–T and G–C (Figure 7c and d)
Interactions of guanidium fragments with adenine N7 or N3 and
thymine O2 indicated a complete absence of steric overlaps.
However, despite their steric compatibility with A–T geometry,
these interactions did not satisfy specific recognition criteria. By
contrast, fragments interacting with ¼O4 through two H-bonds
formed a dense cluster in the base-pair plane. Their orientation
was not compatible with the adenine NH2 group, but the steric
constraints could be resolved by rotating the guaniduimmoieties
by 45–908. This rotation did not disrupt the pattern of H-bonding
between guanidium and thymidine, revealing a new contact
between the deprotonated N atom of the amino acid side chain
and the NH2 group of adenine. Thus, arginine residues behaved
like wild-type N/Q residues, binding specifically to A–T base pairs
through the major groove, but the sites of R recognition—
thymidine O4 and adenine N6H2 groups—were different.
The arginine side-chain distribution around G–C base pairs
corresponded exactly to that around the individual DNA bases.
Indeed, all side chains avoided steric constraint with base
exocyclic groups. Interestingly, the R fragments H-bonded to
the cytosine O2 binding site were found to be in an appropriate
orientation to form a third H-bond with the guanine ÿN2H2
group. These chains therefore probably interact with both bases
simultaneously, resulting in multidentate H-bonding through the
minor groove of the G–C base pair.
In conclusion, our results demonstrate that one of the key
differences between the wild-type (N/Q) and raltegravir-selected
mutated (R/H/K) residues relates to their DNA base recognition
properties. N155 and Q148 clearly interact preferentially with
adenine, either asa singlebaseor in theA–Tbasepair. Inbothcases,
a strong and specific interaction with adenine is ensured by
linear andhighlydirectional bidendateH-bondingwithin themajor
groove. In contrast, a single, moderately strong and non-linear
H-bond is formed with guanine. The DNA base-pair model
generated by this strategy identifies new possibilities for
H-bonding, demonstrating that the arginine side chain can engage
in multiple and directed H-bond interactions, allowing specific
R A–T (major groove) or R G–C (minor groove) interactions.
DISCUSSION
Raltegravir resistance is associated with two genetic pathways
defined by the N155H or Q148H/R/K primary mutations (Hazuda
et al., 2007; Kobayashi et al., 2008; Malet et al., 2008; Myers and
Pillay, 2008). Secondary G140S/A mutation in the Q148H/R/K
background compensates for replication defects associated with
primary mutations and increases resistance. These substitutions
significantly decrease the binding affinity of the integrase
inhibitor and allow IN to retain its activity. We performed in silico
analyses of the structural features and recognition properties of
wild-type and mutated INs to gain further insight into the
molecular basis of HIV-1 IN resistance. This study focuses on the
active site of IN and the catalytic loop-containing residues in
particular, the mutation of which has been selected by raltegravir
in clinical practice.
This study highlighted the importance of a stable V-shaped
hairpin within the catalytic loop. The importance of this loop has
not previously been reported for the HIV-1 IN, although a related
subsecondary structure had been described (Maignan et al., 1998;
Chen et al., 2008). This hairpin can move toward the active site,
defining open and closed conformations. Movements of the
hairpin opening the active site lead to the formation of a cleft by
the active site and the catalytic loop, which can then
accommodate DNA. G140A/S-mutated forms of IN display
slightly lower levels of hairpin mobility than the wild-type
enzyme. This lower level of mobility is associated with lower
levels of G140S mutant enzyme activity in vitro (Malet et al., 2008)
and slower 30-processing kinetics for both the G140S and G140S/
Q148H mutants (Delelis et al., 2009). Our 3D models of
RAL-selected mutants demonstrated that the two primary
pathways to raltegravir resistance, one involving N155H
mutations and the other involving the replacement of Q148
by H, R, or K, conserve all the structural features of the IN catalytic
domain. They also demonstrated that the specific interactions of
raltegravir-selected amino acids with DNA base pairs differed
from those of the wild-type enzyme, accounting for the observed
differences in efficacy betweenmutant and wild-type integrase in
vitro. Furthermore, the G140S mutation, which occurs after the
primary Q148 mutation in vivo, changes slightly the mobility of
the catalytic loop, thereby possibly modifying the change in base
specificity induced by Q148R/H/K mutation. Although this
modification appears limited in our study, it may provide a
possible basis for the optimizing role of G140S mutation.
Experimental biological data suggest that the core domain
interacts with the terminal CAGT bases of LTR ends (Ellison et al.,
1995; Heuer and Brown, 1997; Esposito and Craigie, 1998; Heuer
and Brown, 1998) required for IN activity. Substitutions
introducing nucleotide analogs stabilizing the double strand
decrease 30-processing activity, whereas those weakening base
pairing in the vicinity of the CA dinucleotide increase activity
(Agapkina et al., 2006). Our data suggest that the A–T pair at the
terminus or in the third position is selectively recognized by the
WT Q148 or N155 residue. A recent biochemical study (Langley
et al., 2008) carried out with a different IN inhibitor concluded that
the terminal adenosine of the viral LTR controlled the binding of
strand transfer inhibitors. This result supports the validity of our
model. A recent theoretical prediction for DNA substrate binding
sites on HIV-1 IN indicated that amino acids 139–152 constitute a
binding site that includes Q148, together with Q137, Q146, and
N144 (Chen et al., 2008; Dolan et al., 2009).
Adenine can be specifically recognized in either its paired (A–T)
or unpaired form. However, we suggest that Q148/N155 residues
interact with the sterically and energetically more favorable
terminal unpaired adenine, consistent with previous data
showing post-30-processing contact between Q148 and the
50-AC overhang (Chiu and Davies, 2004; Esposito and Craigie,
1998) and the theoretical model of the IN–DNA complex (Dolan
et al., 2009). By contrast, the Q148R mutant preferentially
established specific interactions by binding the two bases of a
pair, either A–Tor G–C, simultaneously. This lack of discrimination
for base pair binding implies a loss of strict sequence specificity.
Thus, Q148R, through its long arginine side chain, may interact
either with A–Tat the third position, via themajor groove edge, or
with the next base pair, G–C, across the minor groove. These
www.interscience.wiley.com/journal/jmr Copyright ß 2009 John Wiley & Sons, Ltd. J. Mol. Recognit. 2009; 22: 480–494
J.-F. MOUSCADET ET AL.
490

alternative arrangements are possible due to the flexibility of the
catalytic loop, demonstrated by movement of the hairpin.
Strand transfer inhibitors, such as raltegravir, bind at the
interface of the IN-viral DNA complex, by forming a quaternary
complex with the catalytic metal in the enzyme active site and
the 30-processed donor DNA. Raltegravir has a very flexible
conformation, withmultiple H-bonding sites and E-, Z-conformers
of the two pharmacophores, 1,3,4-oxadiazole-2-carboxamide (F1)
and N-methyl-4-carboxamide-dihydroxy-pyrimidine (F2) (Figure 8).
The conformers of these two fragments constitute alternative
bioisosters of adenine (in Z-) or guanine (in E-). Raltegravir may,
therefore, act as a base analog, competing with the target DNA
for the establishment of specific interactions with IN. We
previously reported stabilization of the b-ketoenol fragment in
the Z-conformation by intramolecular H-bonds, suggesting that
F2 is a bioisoster of adenine (Tchertanov and Mouscadet, 2007).
We have also shown that b-ketoenolate is an excellent chelator of
divalent metals (Tchertanov and Mouscadet, 2007). Thus, F2 can
efficiently coordinate magnesium via the two 1–5 oxygen atoms,
orienting RAL such that its ‘‘adenine-like’’ part, adjacent to
b-ketoenolate, is specifically recognized by N155, which is found
close to the Mg2þ cation. The F1 fragment can mimic adenine or
guanine, depending on its rotational isomer. However, confor-
mational analysis of the isolated compound revealed the adenine
bioisoster to be the most stable conformer. Given the specific
recognition of adenine by Q148 and N155, the adenine
bioisosters of F1 and F2 also constitute targets for these residues.
The three characteristic pharmacophores of RAL—the two
‘‘adenine-like’’ fragments of F1 and F2 and the chelating center of
F2—delineate three distances strikingly similar to those defined
by binding sites in IN: Q148, N155 and the position of the second
Mg2þ cation (Figure 9). Thus, the pharmacophore constituents of
the inhibitor and the binding sites formed by Q148, N155, and
the Mg2þ cation are topologicaly equivalent. Overall, these
findings suggest that the IN-bound raltegravir can be specifically
recognized by either Q148, in the mobile catalytic loop, or N155
in the catalytic site, through one or both of the ‘‘adenine-like’’
pharmacophores. These alternative modes of recognition may
underlie the two different pathways of raltegravir-selected
resistance. They also justify the nature of the selected mutation.
Indeed, our model indicates that IN is blocked by the adenine
bioisoster competing with the terminal bases of the viral DNA
recognized by IN. If they are to block this inhibitory effect, the
selected mutations must allow alternative possibilities for DNA
recognition, while maintaining the integrity of the IN structure
and impairing inhibitor binding (Figure 10). Our findings
demonstrate that the R, K, and H residues were probably
selected because they are the only residues meeting these
criteria.
CONCLUSIONS
We performed a detailed in silico study of the structural and
molecular recognition effects induced by raltegravir-selected
Figure 8. Conformational diversity of raltegravir: The E-, Z- conformers
of the two pharmacophores, 1,3,4-oxadiazole-2-carboxamide (F1) and
N-methyl-4-carboxamide-dihydroxy-pyrimidine (F2) represent alternative
bioisosters of adenine (in Z-) or guanine (in E-).
Figure 9. Schematic model of raltegravir interaction with the wild-type
IN, involving Mg2þ coordination (arrows) and H-bonding (dashed lines) to
N155 and Q148. Raltegravir shows two ‘‘adenine-like’’ fragments (blue)
and oneMg2þ-binding site, forming three pharmacophore sites (asterisks)
connected by jagged lines.
Figure 10. Model representing the alternativemolecular recognition of
the A–T base pair by HIV-1 IN induced by raltegravir resistance mutations.
Molecular display style: the enzyme structure is shown by the ribbon,
Mg2þ cations are shown as balls; the wild-type Q148 and mutated R148
residues, the A–T base pair of DNA and raltegravir are shown as sticks;
H-bonds are shown as green dashed lines and Watson–Crick bonds are
shown as blue dashed cylinders.
J. Mol. Recognit. 2009; 22: 480–494 Copyright ß 2009 John Wiley & Sons, Ltd. www.interscience.wiley.com/journal/jmr
DNA RECOGNITION OF RAL RESISTANT IN
491

mutations. We demonstrated the topological invariance of the
integrase core domain, including the conservation of a recently
identified V-shaped hairpin in the catalytic loop. By contrast, we
showed that the mutations greatly altered the specificity of DNA
recognition by integrase. The native residues displayed a clear
preference for adenine, whereas the mutants strongly favored
pyrimidines.
We propose a hypothetical model, in which raltegravir inhibits
HIV-1 replication by acting as an adenine mimic and establishing
specific interactions with the Q148 and/or N155 residues of the
integrase. We also provide a possible explanation for the
decrease in responsiveness to rategravir when these residues
are replaced by arginine, histidine, or lysine.
One of the obvious applications of our models is as a docking
guide for the placement of the viral DNA within its binding site in
IN. Future studies could focus on the correlation between the
spatial orientation of the side chains around the DNA bases and
their pairs and the mapping of different frames from a Molecular
Dynamics run. Such work might open up new opportunities for
the design of HIV-1 IN inhibitors active against emerging HIV-1
mutants.
Acknowledgements
The authors thank Professor Phillipe Cotelle and Dr Sylvie Rimsky
for helpful scientific discussions, Tripos and CSDC for providing
licences, and Ahmad Fliti for excellent technical assistance. The
LBPA laboratory is funded by the French National Centre for
Scientific Research (CNRS). This work was supported by the TRIoH
European project (FP6 grant 503480), Sidaction and the ANR
IMFOVIR (PCV-0015) program.
REFERENCES
Agapkina J, Smolov M, Barbe S, Zubin E, Zatsepin T, Deprez E, Le Bret M,Mouscadet JF, Gottikh M. 2006. Probing of HIV-1 integrase/DNAinteractions using novel analogs of viral DNA. J. Biol. Chem. 281:11530–11540.
Allen FH. 2002. The Cambridge Structural Database: a quarter of a millioncrystal structures and rising. Acta Crystallogr. B 58: 380–388.
Asante-Appiah E, Skalka AM. 1997. Molecular mechanisms in retrovirusDNA integration. Antivir. Res. 36: 139–156.
Berman HM, Westbrook J, Feng Z, Gilliland G, Bhat TN, Weissig H,Shindyalov IN, Bourne PE. 2000. The Protein Data Bank. Nucleic AcidsRes. 28: 235–242.
Brigo A, Lee KW, Mustata GI, Briggs JM. 2005. Comparison of multiplemolecular dynamics trajectories calculated for the drug-resistantHIV-1 integrase T66I/M154I catalytic domain. Biophys. J. 88:3072–3082. DOI:10.1529/biophysj.104.050286
Brown PO. 1990. Integration of retroviral DNA. Curr. Top. Microbiol.Immunol. 157: 19–48.
Bruno IJ, Cole JC, Lommerse JPM, Rowland RS, Taylor R, Verdonk ML. 1997.IsoStar: a library of information about nonbonded interactions. J.Comput. Aided Mol. Des. 11: 525–537.
Bujacz G, Alexandratos J, Wlodawer A. 1997. Binding of different divalentcations to the active site of avian sarcoma virus integrase and theireffects on enzymatic activity. J. Biol. Chem. 272: 18161–18168.
Bujacz G, Alexandratos J, ZhouLiu Q, ClementMella C, Wlodawer A. 1996.The catalytic domain of human immunodeficiency virus integrase:ordered active site in the F185H mutant. FEBS Lett. 398: 175–178.
Cai ML, Zheng RL, Caffrey M, Craigie R, Clore GM, Gronenborn AM. 1997.Solution structure of the N-terminal zinc binding domain of HIV-1integrase. Nat. Struct. Biol. 4: 567–577.
Charpentier C, Karmochkine M, Laureillard D, Tisserand P, Belec L, Weiss L,Si-Mohamed A, Piketty C. 2008. Drug resistance profiles for the HIVintegrase gene in patients failing raltegravir salvage therapy. HIVMed.9: 765–770. DOI: 10.1111/j.1468-1293.2008.00628.x
Chen AP, Weber IT, Harrison RW, Leis J. 2006. Identification of amino acidsin HIV-1 and avian sarcoma virus integrase subsites required forspecific recognition of the long terminal repeat ends. J. Biol. Chem.281: 4173–4182.
Chen X, Tsiang M, Yu F, Hung M, Jones GS, Zeynalzadegan A, Qi X, Jin H,Kim CU, Swaminathan S, Chen JM. 2008. Modeling, analysis, andvalidation of a novel HIV integrase structure provide insights into thebinding modes of potent integrase inhibitors. J. Mol. Biol. 380:504–519. doi:10.1016/j.jmb.2008.04.054.
Cheng AC, Chen WW, Fuhrmann CN, Frankel AD. 2003. Recognition ofnucleic acid bases and base-pairs by hydrogen bonding to aminoacid side-chains. J. Mol. Biol. 327: 781–796.
Cherepanov P, Maertens G, Proost P, Devreese B, Van Beeumen J, Engel-borghs Y, De Clercq E, Debyser Z. 2003. HIV-1 integrase forms stable
tetramers and associates with LEDGF/p75 protein in human cells. J.Biol. Chem. 278: 372–381. DOI:10.1074/jbc.M209278200
Chiu TK, Davies DR. 2004. Structure and function of HIV-1 integrase. Curr.Top. Med. Chem. 4: 965–977.
Cole C, Barber JD, Barton GJ. 2008. The Jpred 3 secondary structureprediction server. Nucleic Acids Res. 36: W197–W201. DOI:10.1093/nar/gkn238
Cooper DA, Steigbigel RT, Gatell JM, Rockstroh JK, Katlama C, Yeni P,Lazzarin A, Clotet B, Kumar PN, Eron JE, Schechter M, Markowitz M,Loutfy MR, Lennox JL, Zhao J, Chen J, Ryan DM, Rhodes RR, Killar JA,Gilde LR, Strohmaier KM, Meibohm AR, Miller MD, Hazuda DJ, NesslyML, DiNubile MJ, Isaacs RD, Teppler H, Nguyen BY. 2008. Subgroupand resistance analyses of raltegravir for resistant HIV-1 infection.New Engl. J. Med. 359: 355–365.
Cotton FA, Wilkinson G. 1999. Advanced Inorganic Chemistry. 6th edition.Wiley: New York.
De Luca L, Vistoli G, Pedretti A, Barreca ML, Chimirri A. 2005. Moleculardynamics studies of the full-length integrase-DNA complex. Biochem.Biophys. Res. Commun. 336: 1010–1016.
De la Cruz X, Hutchinson EG, Shepherd A, Thornton JM. 2002. Towardpredicting protein topology: an approach to identifying beta hair-pins. Proc. Natl. Acad. Sci. U.S.A. 99: 11157–111162. DOI:10.1073/pnas.162376199. [doi];162376199 [pii]
DeLano WL. 2002. The PyMOL Molecular Grapics System.Delelis O, Malet I, Na L, Tchertanov L, Calvez V, Marcelin AG, Subra F,
Deprez E, Mouscadet JF. 2009. The G140S mutation in HIV integrasesfrom raltegravir-resistant patients rescues catalytic defect due to theresistance Q148H mutation. Nucleic Acids Res. 37: 1193–1201.DOI:10.1093/nar/gkn1050
Deprez E, Tauc P, Leh H, Mouscadet JF, Auclair C, Brochon JC. 2000.Oligomeric states of the HIV-1 integrase as measured by time-resolved fluorescence anisotropy. Biochemistry 39: 9275–9284.
Dolan J, Chen A, Weber IT, Harrison RW, Leis J. 2009. Defining the DNAsubstrate binding sites on HIV-1 integrase. J. Mol. Biol. 385: 568–579.DOI:S0022-2836(08)01396-X. [pii];10.1016/j.jmb.2008.10.083 [doi]
Dyda F, Hickman AB, Jenkins TM, Engelman A, Craigie R, Davies DR.1994. Crystal-structure of the catalytic domain of HIV-1 integrase—similarity to other polynucleotidyl transferases. Science 266:1981–1986.
Efimov AV. 1993a. Patterns of loop regions in proteins. Curr. Opin. Struct.Biol. 3: 379–384.
Efimov AV. 1993b. Standard structures in proteins. Prog. Biophys. Mol. Biol.60: 201–239.
Eijkelenboom APAM, vandenEnt FMI, Vos A, Doreleijers JF, Hard K, TulliusTD, Plasterk RHA, Kaptein R, Boelens R. 1997. The solution structure ofthe amino-terminal HHCC domain of HIV-2 integrase: a three-helixbundle stabilized by zinc. Curr. Biol. 7: 739–746.
www.interscience.wiley.com/journal/jmr Copyright ß 2009 John Wiley & Sons, Ltd. J. Mol. Recognit. 2009; 22: 480–494
J.-F. MOUSCADET ET AL.
492

Ellison V, Gerton J, Vincent KA, Brown PO. 1995. An essential interactionbetween distinct domains of hiv-1 integrase mediates assembly ofthe active multimer. J. Biol. Chem. 270: 3320–3326.
Engelman A, Bushman FD, Craigie R. 1993. Identification of discretefunctional domains of hiv-1 integrase and their organization withinan active multimeric complex. EMBO J. 12: 3269–3275.
Esposito D, Craigie R. 1998. Sequence specificity of viral end DNA bindingby HIV-1 integrase reveals critical regions for protein-DNA interaction.EMBO J. 17: 5832–5843.
Faure A, Calmels C, Desjobert C, Castroviejo M, Caumont-Sarcos A,Tarrago-Litvak L, Litvak S, Parissi V. 2005. HIV-1 integrase crosslinkedoligomers are active in vitro. Nucleic Acids Res. 33: 977–986.DOI:10.1093/nar/gki241
Fenollar-Ferrer C, Carnevale V, Raugei S, Carloni P. 2008. HIV-1 integra-se-DNA interactions investigated by molecular modelling. Comput.Math. Method. Med. 9: 231–243. DOI:10.1080/17486700802167918
Fetrow JS. 1995. Protein motifs .6. omega-loops—nonregular secondarystructures significant in protein function and stability. FASEB J. 9:708–717.
Frishman D, Argos P. 1995. Knowledge-based protein secondary structureassignment. Proteins Struct. Funct. Genet. 23: 566–579.
Gao K, Butler SL, Bushman F. 2001. Human immunodeficiency virus type 1integrase: arrangement of protein domains in active cDNA com-plexes. EMBO J. 20: 3565–3576.
Gao K, Wong S, Bushman F. 2004. Metal binding by the D,DX35E motif ofhuman immunodeficiency virus type I integrase: selective rescue ofCys substitutions by Mn-2 in vitro. J. Virol. 78: 6715–6722 .DOI:10.1128/JVI.78.13.6715-6722.2004
Garnier J, Gibrat JF, Robson B. 1996. GOR method for predicting proteinsecondary structure from amino acid sequence. Comput. Method.Macromol. Sequence Anal. 266: 540–553.
Goldgur Y, Dyda F, Hickman AB, Jenkins TM, Craigie R, Davies DR. 1998.Three new structures of the core domain of HIV-1 integrase: an activesite that binds magnesium. Proc. Natl. Acad. Sci. U.S.A. 95: 9150–9154.
Greenwald J, Le V, Butler SL, Bushman FD, Choe S. 1999. Themobility of anHIV-1 integrase active site loop is correlated with catalytic activity.Biochemistry 38: 8892–8898.
Guiot E, CarayonK,DelelisO, SimonF, TaucP, ZubinE, GottikhM,MouscadetJF, Brochon JC, Deprez E. 2006. Relationship between the oligomericstatus of HIV-1 integrase on DNA and enzymatic activity. J. Biol. Chem.281: 22707–222719. DOI:10.1074/jbc.M602198200
Hayouka Z, Rosenbluh J, Levin A, Loya S, Lebendiker M, Veprintsev D,Kotler M, Hizi A, Loyter A, Friedler A. 2007. Inhibiting HIV-1 integraseby shifting its oligomerization equilibrium. Proc. Natl. Acad. Sci. U.S.A.104: 8316–8321 . DOI:10.1073/pnas.0700781104
Hazuda DJ, Miller MD, Nguyen BY, Zhao J. 2007. Resistance to theHIV-integrase inhibitor raltegravir: analysis of protocol 005, a PhaseII study in patients with triple-class resistant HIV-1 infection. Antivir.Ther. 12: S10.
Heuer TS, Brown PO. 1997. Mapping features of HIV-1 integrase nearselected sites on viral and target DNA molecules in an activeenzyme-DNA complex by photo-cross-linking. Biochemistry 36:10655–10665.
Heuer TS, Brown PO. 1998. Photo-cross-linking studies suggest a modelfor the architecture of an active human immunodeficiency virus type1 integrase-DNA complex. Biochemistry 37: 6667–6678.
Hindmarsh P, Leis J. 1999. Retroviral DNA integration. Microbiol. Mol. Biol.Rev. 63: 836–843.
Hutchinson EG, Thornton JM. 1994. A revised set of potentials forbeta-turn formation in proteins. Protein Sci. 3: 2207–2216 .DOI:10.1002/pro.5560031206 [doi]
Kabsch W, Sander C. 1983. Dictionary of protein secondary structure—pattern-recognition of hydrogen-bonded and geometrical features.Biopolymers 22: 2577–2637.
Karki RG, Tang Y, Burke TR, Nicklaus MC. 2004. Model of full-length HIV-1integrase complexed with viral DNA as template for anti-HIV drugdesign. J. Comput. Aided Mol. Des. 18: 739–760. DOI:10.1007/s10822-005-0365-5
Katzman M, Sudol M. 1995. Mapping domains of retroviral integraseresponsible for viral-DNA specificity and target site selection byanalysis of chimeras between human-immunodeficiency-virus type-1and visna virus integrases. J. Virol. 69: 5687–5696.
Kobayashi M, Nakahara K, Seki T, Miki S, Kawauchi S, Suyama A, Waka-sa-Morimoto C, Kodama M, Endoh T, Oosugi E, Matsushita Y, Murai H,Fujishita T, Yoshinaga T, Garvey E, Foster S, Underwood M, Johns B,
Sato A, Fujiwara T. 2008. Selection of diverse and clinically relevantintegrase inhibitor-resistant human immunodeficiency virus type 1mutants. Antivir. Res. 80: 213–222. DOI:10.1016/j.antiviral.2008.06.012
Langley D, Samanta HK, Li ZF, Walker MA, Krystal M, Dicker IB. 2008. Theterminal (catalytic) adenosine of the HIV LTR controls the kinetics ofbinding and dissociation of hiv integrase strand transfer inhibitors.Biochemistry 47(51): 13481–13488.
Laskowski RA, Macarthur MW, Moss DS, Thornton JM. 1993. Procheck—aprogram to check the stereochemical quality of protein structures. J.Appl. Crystallogr. 26: 283–291.
Lee MC, Deng JX, Briggs JM, Duan Y. 2005. Large-scale conformationaldynamics of the HIV-1 integrase core domain and its catalytic loopmutants. Biophys. J. 88: 3133–3146.
Leszczynski JF, Rose GD. 1986. Loops in globular-proteins—a novelcategory of secondary structure. Science 234: 849–855.
Levitt M, Warshel A. 1975. Computer-simulation of protein folding. Nature253: 694–698.
Li L, Olvera JM, Yoder KE, Mitchell RS, Butler SL, Lieber M, Martin SL,Bushman FD. 2001. Role of the non-homologous DNA end joiningpathway in the early steps of retroviral infection. EMBO J. 20:3272–3281.
Li M, Mizuuchi M, Burke TR, Craigie R. 2006. Retroviral DNA integration:reaction pathway and critical intermediates. EMBO J. 25: 1295–1304 .DOI:10.1038/sj.emboj.7601005
Lins RD, Adesokan A, Soares TA, Briggs JM. 2000a. Investigations onhuman immunodeficiency virus type 1 integrase/DNA binding inter-actions via molecular dynamics and electrostatics calculations. Phar-macol. Therapeut. 85: 123–131.
Lins RD, Briggs JM, Straatsma TP, Carlson HA, Greenwald J, Choe S,McCammon JA. 1999. Molecular dynamics studies on the HIV-1integrase catalytic domain. Biophys. J. 76: 2999–3011.
Lins RD, Straatsma TP, Briggs JM. 2000b. Similarities in the HIV-1 and ASVintegrase active sites upon metal cofactor binding. Biopolymers 53:308–315.
Luscombe NM, Laskowski RA, Thornton JM. 2001. Amino acid-baseinteractions: a three-dimensional analysis of protein-DNA inter-actions at an atomic level. Nucleic Acids Res. 29: 2860–2874.
Luscombe NM, Thornton JM. 2002. Protein-DNA interactions: amino acidconservation and the effects of mutations on binding specificity. J.Mol. Biol. 320: 991–1009.
Lutzke RAP, Vink C, Plasterk RHA. 1994. Characterization of the minimaldna-binding domain of the hiv integrase protein. Nucleic Acids Res.22: 4125–4131.
Maignan S, Guilloteau JP, Zhou-Liu Q, Clement-Mella C, Mikol V. 1998.Crystal structures of the catalytic domain of HIV-1 integrase freeand complexed with its metal cofactor: high level of similarity ofthe active site with other viral integrases. J. Mol. Biol. 282: 359–368.
Malet I, Delelis O, ValantinMA, Montes B, Soulie C, WirdenM, Tchertanov L,Peytavin G, Reynes J, Mouscadet JF, Katlama C, Calvez V, Marcelin AG.2008. Mutations associated with failure of raltegravir treatment affectintegrase sensitivity to the inhibitor in vitro. Antimicrob. Agents Che-mother. 52: 1351–1358. DOI:10.1128/AAC.01228-07
Maupetit J, Tuffery P, Derreumaux P. 2007. A coarse-grained protein forcefield for folding and structure prediction. Proteins-Struct. Funct.Bioinformatics 69: 394–408. DOI:10.1002/prot.21505
Michel F, Crucifix C, Granger F, Eiler S, Mouscadet JF, Korolev S, Agapkina J,Ziganshin R, Gottikh M, Nazabal A, Emiliani S, Benarous R, Moras D,Schultz P, Ruff M. 2009. Structural basis for HIV-1 DNA integration inthe human genome, role of the LEDGF/P75 cofactor. EMBO J. 28:980–991. DOI:emboj200941. [pii];10.1038/emboj.2009.41 [doi]
Myers RE, Pillay D. 2008. Analysis of natural sequence variation andcovariation in human immunodeficiency virus type 1 integrase. J.Virol. 82: 9228–9235 . DOI:10.1128/JVI.01535-07
Nunthaboot N, Pianwanit S, Parasuk V, Ebalunode JO, Briggs JM, Kokpol S.2007a. Hybrid quantummechanical/molecular mechanical moleculardynamics simulations of HIV-1 integrase/inhibitor complexes. Bio-phys. J. 93: 3613–3626 . DOI:10.1529/biophysj.107.108464
Nunthaboot N, Planwanit S, Parasuk V, Kokpol S, Wolschann P. 2007b.Theoretical study on the HIV-1 integrase inhibitor 1-(5-chloroindol-3-yl)-3-hydroxy-3-(2H-tetrazol-5-yl)-propenone (5CITEP). J. Mol. Struct.844: 208–214. DOI:10.1016/j.molstruc.2007.06.026
Podtelezhnikov AA, Gao K, Bushman FD, McCammon JA. 2003. ModelingHIV-1 integrase complexes based on their hydrodynamic properties.Biopolymers 68: 110–120. DOI:10.1002/bip.10217
J. Mol. Recognit. 2009; 22: 480–494 Copyright ß 2009 John Wiley & Sons, Ltd. www.interscience.wiley.com/journal/jmr
DNA RECOGNITION OF RAL RESISTANT IN
493
Ren G, Gao K, Bushman FD, Yeager M. 2007. Single-Particle imagereconstruction of a tetramer of HIV integrase bound to DNA. J.Mol. Biol. 366: 286–294.
Savarino A. 2007. In silico docking of HIV-1 integrase inhibitors reveals anovel drug type acting on an enzyme/DNA reaction intermediate.Retrovirology 4(21): DOI:10.1186/1742-4690-4-21
Sen TZ, Jernigan RL, Garnier J, Kloczkowski A. 2005. GOR V server forprotein secondary structure prediction. Bioinformatics 21: 2787–2788.
Singh J, Thornton JM. 1992. Atlas of Protein Side-Chain Interactions. IRLPress: Oxford.
Street TO, Fitzkee NC, Perskie LL, Rose GD. 2007. Physical-chemicaldeterminants of turn conformations in globular proteins. ProteinSci. 16: 1720–1727. DOI:10.1110/ps.072898507
Strobel SA, Ryder SP. 2001. The hairpin’s turn. Nature 410: 761–763.Tchertanov L, Delelis O, Mouscadet J. 2007. Structural and functional
insight into molecular recognition of HIV-1 integrase catalytic loop.FEBS J. 274: 260.
Tchertanov L, Mouscadet JF. 2007. Target recognition by catecholsand beta-ketoenols: potential contribution of hydrogen bonding
and Mn/Mg chelation to HIV-1 integrase inhibition. J. Med. Chem. 50:1133–1145.
Thornton JM, Singh J, Campbell S, Blundell TL. 1988. Protein proteinrecognition via side-chain interactions. Biochem. Soc. Trans. 16: 927–930.
Tripos Inc. 2007. SYBYL 7.2.Tripos Inc. 2008. Benchware 3D Explorer.Wang Y, Klock H, Yin H, Wolff K, Bieza K, Niswonger K, Matzen J, Gunderson
D, Hale J, Lesley S, Kuhen K, Caldwell J, Brinker A. 2005. Homogeneoushigh-throughput screening assays for HIV-1 integrase 3 ’-processingand strand transfer activities. J. Biomol. Screen. 10: 456–462.DOI:10.1177/108705710275212
Weber W, Demirdjian H, Lins RD, Briggs JM, Ferreira R, McCammon JA.1998. Brownian and essential dynamics studies of the HIV-1 integrasecatalytic domain. J. Biomol. Struct. Dynam. 16: 733–745.
Wielens J, Crosby IT, Chalmers DK. 2005. A three-dimensional model of thehuman immunodeficiency virus type 1 integration complex. J. Com-put. Aided Mol. Des. 19: 301–317.
Wlodawer A. 1999. Crystal structures of catalytic core domains of retroviralintegrases and role of divalent cations in enzymatic activity. Advancesin Virus Research 52: 335–350.
www.interscience.wiley.com/journal/jmr Copyright ß 2009 John Wiley & Sons, Ltd. J. Mol. Recognit. 2009; 22: 480–494
J.-F. MOUSCADET ET AL.
494
Hindawi Publishing CorporationAdvances in VirologyVolume 2012, Article ID 548657, 13 pagesdoi:10.1155/2012/548657
Research Article
In Silico and In Vitro Comparison ofHIV-1 Subtypes B and CRF02 AG Integrases Susceptibility toIntegrase Strand Transfer Inhibitors
Xiaoju Ni,1, 2 Safwat Abdel-Azeim,1 Elodie Laine,1 Rohit Arora,1
Osamuede Osemwota,1 Anne-Genevieve Marcelin,3 Vincent Calvez,3
Jean-Francois Mouscadet,1 and Luba Tchertanov1
1 LBPA, CNRS, LabEx LERMIT, Ecole Normale Superieure de Cachan, 61 Avenue du President Wilson, 94235 Cachan, France2 School of Life Science, East China Normal University, Shanghai 200062, China3 Laboratoire de Virologie, AP-HP, Hopital Pitie-Salpetriere, EA 2387, UPMC Universite Paris VI, 75013 Paris, France
Correspondence should be addressed to Luba Tchertanov, [email protected]
Received 3 January 2012; Revised 16 April 2012; Accepted 30 April 2012
Academic Editor: Domenico Genovese
Copyright © 2012 Xiaoju Ni et al. This is an open access article distributed under the Creative Commons Attribution License,which permits unrestricted use, distribution, and reproduction in any medium, provided the original work is properly cited.
Most antiretroviral medical treatments were developed and tested principally onHIV-1 B nonrecombinant strain, which representsless than 10% of the worldwide HIV-1-infected population. HIV-1 circulating recombinant form CRF02 AG is prevalent in WestAfrica and is becoming more frequent in other countries. Previous studies suggested that the HIV-1 polymorphisms might beassociated to variable susceptibility to antiretrovirals. This study is pointed to compare the susceptibility to integrase (IN) inhibitorsof HIV-1 subtype CRF02 AG IN respectively to HIV-1 B. Structural models of B and CRF02 AG HIV-1 INs as unbound enzymesand in complex with the DNA substrate were built by homology modeling. IN inhibitors—raltegravir (RAL), elvitegravir (ELV)and L731,988—were docked onto the models, and their binding affinity for both HIV-1 B and CRF02 AG INs was compared.CRF02 AG INs were cloned and expressed from plasma of integrase strand transfer inhibitor (INSTI)-naıve infected patients. Ourin silico and in vitro studies showed that the sequence variations between the INs of CRF02 AG and B strains did not lead to anynotable difference in the structural features of the enzyme and did not impact the susceptibility to the IN inhibitors. The bindingmodes and affinities of INSTI inhibitors to B and CRF02 AG INs were found to be similar. Although previous studies suggestedthat several naturally occurring variations of CRF02 AG INmight alter either IN/vDNA interactions or INSTIs binding, our studydemonstrate that these variations do affect neither IN activity nor its susceptibility to INSTIs.
1. Introduction
The pol-encoded HIV-1 integrase (IN) is a key enzyme inthe replication mechanism of retroviruses. It catalyses thecovalent insertion of the viral cDNA into the chromosomesof the infected cells [1]. Two reactions are required for co-valent integration of viral DNA. First, IN binds to a shortsequence located at either end of the long terminal repeat(LTR) of the vDNA and catalyzes an endonucleotide cleavage,3′-processing reaction, resulting in the removal of two nu-cleotides from each of the 3′-ends of LTR and the delivery ofhydroxy groups for nucleophilic attacks. The trimmed DNAis then used as a substrate for strand transfer (ST) reaction,leading to the covalent insertion of the DNA into the host
genome [1]. Inhibitors of the strand transfer reaction—INSTIs—constitute a novel family of antiretroviral (ARV)drugs, with raltegravir (RAL) at the cape, which is a firstINSTI approved for AIDS treatment. Other inhibitors inadvanced phase of development are elvitegravir (ELV) andGSK572.
Human immunodeficiency virus type one (HIV-1)exhibits an exceptional level of genetic variability, which mayinfluence the viral properties such as infectivity, transmis-sibility, or response to antiviral treatment [2]. The mostprevalent HIV-1 group M genetic forms are subtypes A, B,C and circulating recombinant form CRF02 AG.
Analysis of the global distribution of HIV-1 subtypesand recombinants in the two followed three-year periods,

2 Advances in Virology
O
O
O
O
O O
O
O
O
OH OH OH
OH
OH
HN
N NN
N
N
N
F
F
NH
Br
Cl
RAL ELV L731,988
Scheme 1
2000–2003 and 2004–2007, indicated a broadly stable distri-bution of HIV-1 subtypes worldwide with a notable increasein the proportion of circulating recombinant forms (CRFs),a decrease in unique recombinant forms (URFs), and anoverall increase in recombinants [3]. Particularly, in 2004–2007, CRF02 AG accounted for 8% of all global infections,following subtypes C (48%), A (12%), and B (11%).CRF02 AG is the predominant HIV strain circulating inWestand West Central Africa [4–6]. Recently the recombinantCRF02 AG form was identified in the Amazon region ofBrazil [7] and in China [8].
In France the frequency of antiretroviral-naive chroni-cally HIV-infected patients infected with a non-B subtypereached 42% in 2006/2007, having increased significantlysince 1998 (10%) and 2001 (33%). This evolution in subtypedistribution was mainly due to a higher proportion ofpatients originating from sub-Saharan countries. Amongthese non-B subtypes, the most prevalent was CRF02 AGwith a stable proportion around 20% between 2001 and2006/2007 [9].
Enzymatic and virological data support the conceptthat naturally occurring polymorphisms in different non-Bsubtypes can affect the susceptibility of HIV-1 to differentantiretroviral drugs, the magnitude of resistance conferredby major mutations, and the propensity to acquire someresistance mutations [10]. The genetic variation betweenviral isolates retroviral enzymes is estimated up to 25–35%; particularly the pol gene exhibits high variation, about10–15% for reverse transcriptase (RT) and 8–12% forintegrase (IN) [11]. Integrase inhibitors are active in vivoagainst B and non-B subtypes. Furthermore, in vitro studiessuggested that subtype C integrase is equally susceptible toINSTIs [12]. Similarly, the analysis of pol gene in infectedpatients showed that highly prevalent polymorphisms havelittle effect on INSTIs susceptibility [13]. Nevertheless, thecomparison of IN sequences of B and CRF02 AG strainsshowed that CRF02 AG sequence differs from the B sequenceby 13 residues (K/R14, V/I31, L/I101, T/V112, T/A124,T/A125, G/N134, I/V135, K/T136, V/I201, T/S206, L/I234and S/G283) [14]. Based on a model of the B HIV-1integrase/DNA complex [15], it was suggested that several ofthese variations K/R14, T/V112, T/A125, G/N134, K/T136,and T/S206 may impact IN interaction with DNA or INsusceptibility to INSTIs. Later we compared the geneticbarriers between B and CRF02 AG strains; we found that the
variability between subtypes impacted the genetic barrier forG140C/S and V151I with a higher genetic barrier being cal-culated for subtype CRF02 AG suggesting a great difficulty inselecting these mutations for CR02 AG compared to subtypeB [16].
Integrase is a 288 amino acids enzyme, which consistsin three structurally distinct functional domains [17]. Struc-tures reporting HIV-1 IN single- or two-domain data allowthe generation of biologically relevant models, representingeither unbound dimeric enzyme or IN complexes withviral (vDNA) and/or host DNA (hDNA) [18]. The X-ray structures of full-length prototype foamy virus (PFV)IN complex with its cognate DNA and integrase strandtransfer inhibitors (INSTIs; RAL, ELV, and others first- andsecond-generation INSTIs) were recently solved [19, 20]. Thereported structures were used for homology modeling ofthe unbound IN and IN bound to vDNA from CRF02 AGand B strains. Further, the constructed models were usedto estimate the susceptibility of both INs to strand transferinhibitors, RAL, ELV and L731,988 (Scheme 1). Results frommolecular modeling were compared to experimental dataobtained with B and CRF02 AG INs which were isolatedfrom plasma samples of HIV-1-infected patients and thencloned and expressed in vitro.
2. Results and Discussion
2.1. Analysis of CRF02 AG IN Sequences from INSTI-NaiveInfected Patients. The complete sequence of the IN codingregion of the pol gene was amplified and cloned fromthe plasma samples of CRF02 AG HIV-1-infected patients.Four IN sequences, N1 to N4, harbored several variationsamong the thirteen residues that were shown to be subjectedto polymorphic substitutions between CRF02 AG and BHIV-1 sequences (K/R14, V/I31, L/I101, T/V112, T/A124,T/A125, G/N134, I/V135, K/T136, V/I201, T/S206, L/I234and S/G283; Table 1) [14]. Sequence N1 (CRF02 AG 33CR)displayed the seven variations K14R, T112V, T125A, G134N,K136T, T206S, S283G; N2CRF02 AG 49CR the five varia-tions T112V, T125A, G134N, K136T, S283G; N3 (CRF02 AG68CR) the five variations K14R, T112V, T125A, K136T,T206S; N4 (CRF02 AG 52CR Q148K) the two variationsT125A and T206S, along with the INSTI resistance mutationQ148K. Although Q148K is involved in INSTIs resistance,the patient from whom the IN coding DNA was derived was
Advances in Virology 3
Table 1: Amino acid variations at the positions putatively affecting the susceptibility to INSTI in 4 isolated HIV-1 subtype CRF02 AG INcoding sequences.
Position B consensusSubtype CRF02 AG
N1 (33CR) N2 (49CR) N4 (52CR Q148K) N3 (68CR)
14 K R K K R
112 T V V R V
125 T A A A A
134 G N N G G
136 K T T K T
206 T S T S S
283 S G G S S
Compared with HIV-1 subtype B IN, seven variations present at positions 14, 112, 125, 134, 136, 206, and 283 of CRF02 AG 33CR IN; five variations atpositions 112, 125, 134, 136, and 283 of CRF02 AG 49CR IN; five variations at positions 14, 112, 125, 136, and 206 of CRF02 AG 68CR IN; CRF02 AG 52CRQ148K has two variations at positions 125 and 206, and an INSTI-resistant mutation Q148K, the R112 was not considered.
not exposed to the INSTI-containing treatment. Thereby wepresume that Q148K may be a naturally occurring aminoacid substitution.
2.2. Structural Comparison of HIV-1 B and CRF02 AGIntegrases. In order to determine the potential impact of thenatural variations on the protein activity and susceptibility toINSTIs, we built models of the IN structures correspondingto the consensus B sequence and the CRF02 AG variantdiffering from B subtype by twelve residues. The 18-aas C-terminal end containing the S283G was omitted since thestructure of this domain was not resolved by X-ray analysisand the folding of this part of protein is extremely difficultto predict in the apo state, due to its essential length and itshighly solvent-exposed position.
Comparative structural analysis were performed con-sidering 6 IN models generated by homology modeling(Figure 1). Models 1(B) and 2 (CRF02 AG) (Figure 1(a))represent the unbound homodimer of integrase (IN1−270),which depicts the conformational state of the enzyme justbefore the 3′-processing of vDNA (apo state); models 3′(B)and 4 (CRF02 AG) (Figure 1(b)) represent the IN dimer incomplex with vDNA (holo state), which depicts the activeunit of the IN·vDNA strand transfer intasome; models 5 (B)and 6 (CRF02 AG) (not shown) were derived from models 3and 4 by removing vDNA.
Models 1 and 2 were constructed from the crystallo-graphic structures of HIV-1 IN-isolated domains or pairsof domains. Overall, the analysis of the models representingthe HIV-1 IN conformational state before 3′-processing (apostate) did not show any significant structural change betweenthe two subtypes (Figures 1(a) and 1(c)).
Models 3 and 4 were constructed from the crystallo-graphic structure of the IN·vDNA complex of the PFV inta-some [19, 20]. Although the sequence identity between HIV-1 and PFV INs is low (22%), the structure-based alignmentof the two proteins demonstrates high conservation of keysecondary structural elements and the three PFV IN domainsshared with HIV-1 IN have essentially the same structureas the isolated HIV-1 domains. Moreover, the structure ofthe PFV intasome displays a distance between the reactive
3′ ends of vDNA that corresponds to the expected distancebetween the integration sites of HIV-1 IN target DNA (4 basepairs). Consequently, we are confident that the PFV IN X-raystructure represents a good template for the HIV-1 INmodelgeneration [21]. To obtain a robust alignment, we adjustedthe targets (HIV-1 INs from B and CRF02 AG subtypes) andtemplate (PFV IN) sequences manually, considering eachstructural domain separately, in order to take into accountthe conservation of the secondary structure (see Section 4).
Again, models 3 and 4, representing the IN·vDNAintasomes of both strains, superimposed perfectly and nostructural dissimilarity was observed (Figures 1(b) and 1(d)).Most of the variations are located far from the activesites, and the nearest two mutated residues to the activesite, at positions 134 and 136, are exposed to the solventand apparently did not affect significantly the structure.Similarly for 3′-processing, strand transfer activities of Band CRF02 AG recombinant proteins were assayed andcompared. In agreement with the modeling results, activitiesof both INs were comparable (Figure 2(c)).
It is worth noting that large structural and conforma-tional changes are observed between the apo (models 1 and2) and holo (3 and 4) states regarding the relative positions ofthe IN domains (RMSD, root mean square deviation, of 31 A,based on Cα) (Figure 1(e)). These structural modificationsresult in different contacts between IN domains, N-terminaldomain (NTD), catalytic core domain (CCD), and C-terminal domain (CDD). As such, in models 1 and 2(apo state) no interaction was detected between CTD andCCD, whereas the two domains interact tightly in models3 and 4 (holo state). The NTD-CCD interface also exhibitssubstantial changes: in the apo form the NTD-CCD interfacebelongs to the same monomer subunit whereas in the holoform the interface is from two different subunits. Moreover,IN undergoes important structural transformation leadingto structural reorganization of the catalytic site loop uponvDNA binding; the coiled portion of the loop reduces from10 residues (140–149 aas) in the apo form to 5 residues (140–144 aas) in the holo form (Figure 1(f)). This partial foldingof the catalytic loop is probably stabilized through intra-INdomain-domain interactions and interactions with vDNAwhich contribute in the helix α4 elongation.
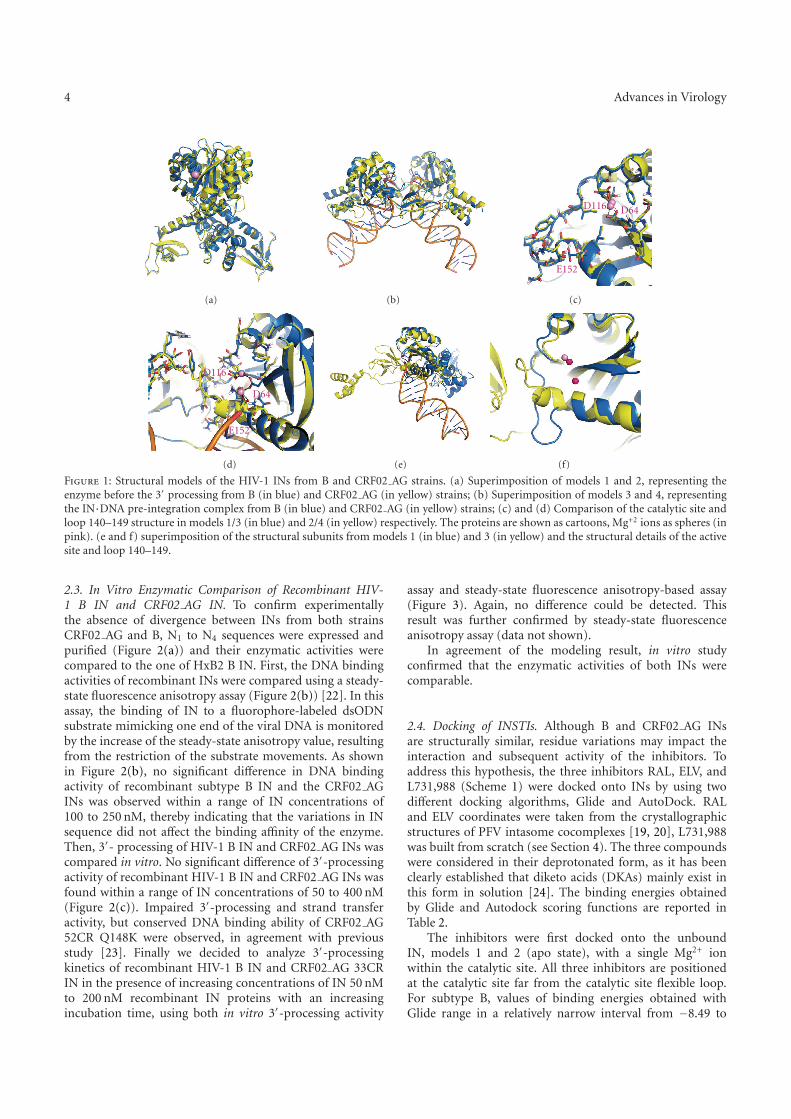
4 Advances in Virology
(a) (b)
D116
E152
D64
(c)
D116
E152
D64
(d) (e) (f)
Figure 1: Structural models of the HIV-1 INs from B and CRF02 AG strains. (a) Superimposition of models 1 and 2, representing theenzyme before the 3′ processing from B (in blue) and CRF02 AG (in yellow) strains; (b) Superimposition of models 3 and 4, representingthe IN·DNA pre-integration complex from B (in blue) and CRF02 AG (in yellow) strains; (c) and (d) Comparison of the catalytic site andloop 140–149 structure in models 1/3 (in blue) and 2/4 (in yellow) respectively. The proteins are shown as cartoons, Mg+2 ions as spheres (inpink). (e and f) superimposition of the structural subunits from models 1 (in blue) and 3 (in yellow) and the structural details of the activesite and loop 140–149.
2.3. In Vitro Enzymatic Comparison of Recombinant HIV-1 B IN and CRF02 AG IN. To confirm experimentallythe absence of divergence between INs from both strainsCRF02 AG and B, N1 to N4 sequences were expressed andpurified (Figure 2(a)) and their enzymatic activities werecompared to the one of HxB2 B IN. First, the DNA bindingactivities of recombinant INs were compared using a steady-state fluorescence anisotropy assay (Figure 2(b)) [22]. In thisassay, the binding of IN to a fluorophore-labeled dsODNsubstrate mimicking one end of the viral DNA is monitoredby the increase of the steady-state anisotropy value, resultingfrom the restriction of the substrate movements. As shownin Figure 2(b), no significant difference in DNA bindingactivity of recombinant subtype B IN and the CRF02 AGINs was observed within a range of IN concentrations of100 to 250 nM, thereby indicating that the variations in INsequence did not affect the binding affinity of the enzyme.Then, 3′- processing of HIV-1 B IN and CRF02 AG INs wascompared in vitro. No significant difference of 3′-processingactivity of recombinant HIV-1 B IN and CRF02 AG INs wasfound within a range of IN concentrations of 50 to 400 nM(Figure 2(c)). Impaired 3′-processing and strand transferactivity, but conserved DNA binding ability of CRF02 AG52CR Q148K were observed, in agreement with previousstudy [23]. Finally we decided to analyze 3′-processingkinetics of recombinant HIV-1 B IN and CRF02 AG 33CRIN in the presence of increasing concentrations of IN 50 nMto 200 nM recombinant IN proteins with an increasingincubation time, using both in vitro 3′-processing activity
assay and steady-state fluorescence anisotropy-based assay(Figure 3). Again, no difference could be detected. Thisresult was further confirmed by steady-state fluorescenceanisotropy assay (data not shown).
In agreement of the modeling result, in vitro studyconfirmed that the enzymatic activities of both INs werecomparable.
2.4. Docking of INSTIs. Although B and CRF02 AG INsare structurally similar, residue variations may impact theinteraction and subsequent activity of the inhibitors. Toaddress this hypothesis, the three inhibitors RAL, ELV, andL731,988 (Scheme 1) were docked onto INs by using twodifferent docking algorithms, Glide and AutoDock. RALand ELV coordinates were taken from the crystallographicstructures of PFV intasome cocomplexes [19, 20], L731,988was built from scratch (see Section 4). The three compoundswere considered in their deprotonated form, as it has beenclearly established that diketo acids (DKAs) mainly exist inthis form in solution [24]. The binding energies obtainedby Glide and Autodock scoring functions are reported inTable 2.
The inhibitors were first docked onto the unboundIN, models 1 and 2 (apo state), with a single Mg2+ ionwithin the catalytic site. All three inhibitors are positionedat the catalytic site far from the catalytic site flexible loop.For subtype B, values of binding energies obtained withGlide range in a relatively narrow interval from −8.49 to
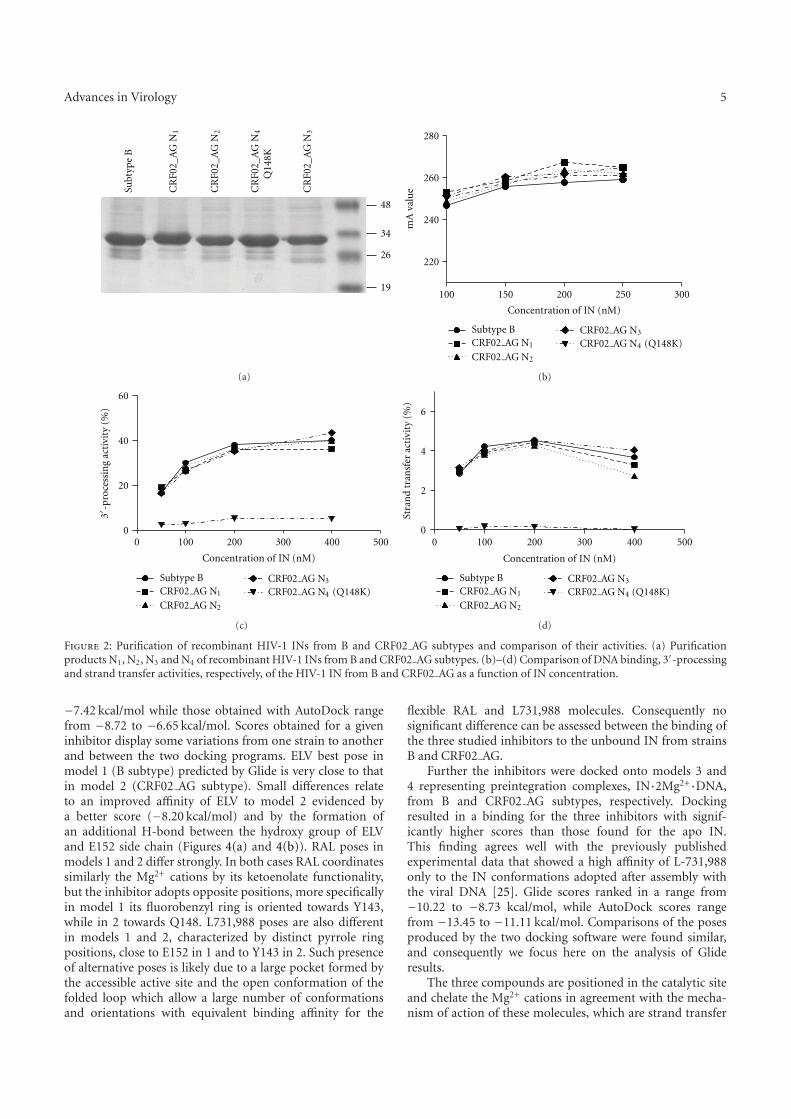
Advances in Virology 5
26
34
48
19
CR
F0
2_
AG
N1
Sub
typ
e B
CR
F0
2_
AG
N2
CR
F0
2_
AG
N3
CR
F0
2_
AG
N4
Q1
48
K
(a)
100 150 200 250 300
220
240
260
280
Concentration of IN (nM)
mA
val
ue
Subtype B
CRF02 AG N1
CRF02 AG N2
CRF02 AG N4 (Q148K)
CRF02 AG N3
(b)
0 100 200 300 400 5000
20
40
60
Concentration of IN (nM)
Subtype B
CRF02 AG N1
CRF02 AG N2
CRF02 AG N4 (Q148K)
CRF02 AG N3
3-p
roce
ssin
g ac
tivi
ty (
%)
(c)
0 100 200 300 400 5000
2
4
6
Concentration of IN (nM)
Str
and
tra
nsf
er a
ctiv
ity
(%)
Subtype B
CRF02 AG N1
CRF02 AG N2
CRF02 AG N4 (Q148K)
CRF02 AG N3
(d)
Figure 2: Purification of recombinant HIV-1 INs from B and CRF02 AG subtypes and comparison of their activities. (a) Purificationproducts N1, N2, N3 andN4 of recombinant HIV-1 INs from B and CRF02 AG subtypes. (b)–(d) Comparison of DNA binding, 3′-processingand strand transfer activities, respectively, of the HIV-1 IN from B and CRF02 AG as a function of IN concentration.
−7.42 kcal/mol while those obtained with AutoDock rangefrom −8.72 to −6.65 kcal/mol. Scores obtained for a giveninhibitor display some variations from one strain to anotherand between the two docking programs. ELV best pose inmodel 1 (B subtype) predicted by Glide is very close to thatin model 2 (CRF02 AG subtype). Small differences relateto an improved affinity of ELV to model 2 evidenced bya better score (−8.20 kcal/mol) and by the formation ofan additional H-bond between the hydroxy group of ELVand E152 side chain (Figures 4(a) and 4(b)). RAL poses inmodels 1 and 2 differ strongly. In both cases RAL coordinatessimilarly the Mg2+ cations by its ketoenolate functionality,but the inhibitor adopts opposite positions, more specificallyin model 1 its fluorobenzyl ring is oriented towards Y143,while in 2 towards Q148. L731,988 poses are also differentin models 1 and 2, characterized by distinct pyrrole ringpositions, close to E152 in 1 and to Y143 in 2. Such presenceof alternative poses is likely due to a large pocket formed bythe accessible active site and the open conformation of thefolded loop which allow a large number of conformationsand orientations with equivalent binding affinity for the
flexible RAL and L731,988 molecules. Consequently nosignificant difference can be assessed between the binding ofthe three studied inhibitors to the unbound IN from strainsB and CRF02 AG.
Further the inhibitors were docked onto models 3 and4 representing preintegration complexes, IN·2Mg2+·DNA,from B and CRF02 AG subtypes, respectively. Dockingresulted in a binding for the three inhibitors with signif-icantly higher scores than those found for the apo IN.This finding agrees well with the previously publishedexperimental data that showed a high affinity of L-731,988only to the IN conformations adopted after assembly withthe viral DNA [25]. Glide scores ranked in a range from−10.22 to −8.73 kcal/mol, while AutoDock scores rangefrom −13.45 to −11.11 kcal/mol. Comparisons of the posesproduced by the two docking software were found similar,and consequently we focus here on the analysis of Glideresults.
The three compounds are positioned in the catalytic siteand chelate the Mg2+ cations in agreement with the mecha-nism of action of these molecules, which are strand transfer

6 Advances in Virology
Table 2: Docking binding energies of RAL, ELV and L731,988 on the HIV-1 IN from B and CRF02 AG strains predicted by Autodock andGlide. The targets are the IN model with one Mg2+ cation in the active site (apo state, models 1 and 2) and IN·DNA model with two Mg2+
cations (holo state, models 3 and 4).
TargetThe free binding energies (kcal/mol)
Inhibitor Autodock Glide
IN B (apo)
RAL −6.83 −8.05
ELV −8.22 −7.42
L731,988 −7.81 −8.49
IN CRF02 AG (apo)
RAL −6.65 −7.68
ELV −8.72 −8.20
L731,988 −8.31 −7.85
IN·DNA B (holo)
RAL −11.43 −10.22
ELV −12.45 −9.17
L731,988 −11.50 −8.73
IN·DNA CRF02 AG (holo)
RAL −11.11 −9.98
ELV −13.45 −9.16
L731,988 −11.93 −8.82
IN∗ B (holo)
RAL −8.29 −8.36
ELV −11.62 −8.92
L731,988 −12.19 −8.96
IN∗ CRF02 AG (holo)
RAL −7.98 −8.46
ELV −11.80 −8.93
L731,988 −11.58 −8.82
inhibitors [26]. RAL binding mode is characterized by higherscores in both models 3 (B subtype) and 4 (CRF02 AGsubtype), respectively, to the other two inhibitors. RALpredicted poses are identical in models 3 and 4 (Figures 4(a),4(b), 4(c) and 4(d)). It binds bidentaetly bothmetal cofactorsof the active site acting as a 1–5, and 1–4-type ligand, withthe enolic oxygen atom as an oxo-bridge between two Mg2+
cations. Additional stabilization of inhibitor RAL is achievedby π-staking of fluorobenzyl ring upon Cyt16 of DNA sub-strate. Similar to RAL, ELV coordinates the Mg2+ cofactorsbidentantly through the 1–5 type β-ketoenolate moiety and1–3 geminal carboxylic oxygen atoms, with a carboxylicoxygen atom as an oxo-bridge at the bicationic cluster. Afew differences of ELV binding in models 3 and 4 referto slightly different conformation of the chlorofluorobenzylmoiety. L731,988 molecule shows different binding poses inmodels 3 and 4. Inmodel 3 (B subtype) L731,988 coordinatesbidentately one Mg2+ cation by the oxygen atoms fromketo functionality of ketoenolate and carboxylate groups,acting as a ligand of 1-6 type. The second Mg2+ cation iscoordinated only by the carboxylate oxygen atom. In model4 (CRF02 AG) L731,988 inhibitor shows exclusively onecoordination to the one Mg2+ cation (Figures 4(e) and 4(f)).
The predicted binding poses of RAL correlate well withthose observed in the X-ray structure of the PFV intasomecomplex [19, 20]. Undoubtedly, the presence of the secondcatalytic Mg2+ cation, the partial loop folding, and the DNAsubstrate bearing are presumably the driving determinantsfor the tight binding of ST inhibitors in the catalytic site.It was perfectly evidenced by Cherepanov that a series ofINSTIs fixed similarly to the PFV intasome [19]. Apparentlythe crystallographic data or static models derived from these
data are not suitable means to explain the specificity ofinhibitor recognition by a target. Consequently, consideringthe similar scoring values for a given inhibitor and closedposes, no significant dissimilarity can be assessed betweenthe binding of studied inhibitors to the IN·2Mg2+·DNAcomplex from strains B and CRF02 AG.
To validate the in silico predictions regarding the sus-ceptibility of subtypes B and CRF02 AG INs, the efficiencyof INSTIs (RAL, ELV, and L731,988) on recombinant INsproteins was determined by in vitro strand transfer assayin the presence of increasing concentration of INSTI (seeSection 4). As to all of the three studied INSTIs, no significantdifference in IC50 values against recombinant HIV-1 INsfrom B and CRF02 AG strains was observed (Table 3).IC50 of RAL, ELV, and L731,988 against HIV-1 INs fromB and CRF02 AG strains are 41.8, 93.4, 855 nM and 13.7–25.9, 48.9–66.8, 193–291 nM, respectively. The experimentalranking of the three compounds was predicted correctly byGlide scoring function.
The docking calculations evidenced that (i) the IN·DNAcomplex represents the best target for the studied inhibitorsand (ii) the co-complexed vDNA partially shapes theinhibitors binding site. To further explore the role of vDNA,substrate was removed from the IN·vDNA complex andinhibitors were docked again on unbound IN with a foldcorresponding to the holo state, models 5 and 6. The bindingenergies of RAL are depreciated upon vDNA removal in Band CR02 AG subtypes while ELV and L731,988 bindingscores are less affected.
Docking scores are nearly similar between the two strainswhile poses display some variations, as already observedon the apo form. Surprisingly, the AutoDock results show

Advances in Virology 7
30 60 90 120 150 180
−10
0
10
20
30
40
50
Time (min)
50 nM
100 nM
150 nM
200 nM
3-p
roce
ssin
g ac
tivi
ty
(a)
30 60 90 120 150 180
−10
0
10
20
30
40
50
Time (min)
50 nM
100 nM
150 nM
200 nM
3-p
roce
ssin
g ac
tivi
ty
(b)
Figure 3: Kinetic comparison of HIV-1 B and CRF02 AG 33CRIN. (A) The kinetic features of recombinant HIV-1 B IN and (B)CRF02 AG IN (N1) were determined in vitro using 3′-processingactivity assay, in the presence of 50, 100, 150, and 200 nMrecombinant IN proteins with an incubation time of 10, 20, 30, 60,90, 120, and 180 min, respectively.
the lower score for RAL binding to both models 5 and6, while the binding of the two other inhibitors are char-acterized by better scores, closer to those obtained withmodels 3 and 4. In contrast the scores produced by Glide areidentical between the inhibitors and the subtypes. Chelationof the Mg2+ ions by the inhibitors is still maintained but theinteraction patterns differ from those predicted in models3 and 4. Indeed, in model 5 (B subtype) RAL chelatesthe first Mg2+ cation through the nitrogen atom of theoxadiazole ring, and the oxygen atom of the carboxamidemoiety; the second Mg2+ is coordinated by 1–4 oxygenatoms of pyrimidinone fragment. In model 6 RAL mode ofcoordination resembles that observed in model 4; however,stabilizing π-stacking interactions were vanished. Again,the large volume of the binding pocket and the lack ofstabilizing protein-ligand and DNA–ligand interactions canexplain such variety. Consequently, unbound IN in the holoconformation, as unbound IN in the apo conformation, doesnot appear as a suitable target for the inhibitors RAL and
Table 3: IC50 of 3 INSTIs against recombinant HIV-1 B IN andCRF02 AG IN.
IC50 (M)
RAL ELV L731,988
Subtype B 4.185e − 008 9.340e − 008 8.554e − 007
CRF02 AG N1 1.373e − 008 5.562e − 008 2.115e − 007
ELV. L731,988 appears as a weaker binder, as confirmed bythe experimental IC50 values.
Molecular modeling approaches were used to investigatethe effect of the natural variations showed by CRF02 AGstrain on the in vitro activities of the enzyme and itssusceptibility to INSTIs as compared to the ones of theconsensus B integrase. We found that the structural modelsof unbound (apo state) and viral DNA-bound (holo state)integrase showed very similar folding and tertiary structurefor the two studied strains. The structural models of theIN·vDNA complex superimposed perfectly. This similaritywas confirmed by comparable strand transfer activity for INvariants in 14, 112, 125, 134, 136, 206, and 283 positions.Consequently, the naturally occurring variations in the HIV-1 IN subtype CRF02 AG – K14R, V31I, L101I, T112V,T124A, T125A, G134N, I135V, K136T, V201I, T206S, V234I,and S283G, which were suggested to modify IN structure, donot affect significantly in vitro DNA binding activity, either3′-processing or strand transfer reaction. Furthermore,docking results revealed that the modes of binding and dock-ing conformations of three studied inhibitors are comparablefor B and CRF02 AG strains and these INSTIs possessedsimilar IN inhibitory activity against B and CRF02 AG HIV-1 strains. Altogether these results demonstrate the absence ofdifference in susceptibility and confirm previously reportedobservations for subtype B and C HIV-1 INs [12]. Thus, incontrast to the lower baseline susceptibilities of recombinantA/G subtype virus to protease inhibitors (PIs) and reducedsusceptibility of some A/G isolates to abacavir, INSTIspotentially provide an excellent therapeutic options for thetreatment of HIV-1 subtype CRF02 AG-infected patients[10].
In the targets all three molecules are positioned simi-larly with keto-enol moiety in an orientation encouragingcoordination of the two metal cofactors in the active site.Furthermore, independently of the method, the three INSTIsdisplayed a more favorable binding onto the IN·vDNA com-plex (holo state) than on the unbound enzyme (apo state),in good agreement with their mechanism of action [26].Same difference in theoretically predicted modes of RALbinding was reported early by Loizidou [27]. The observedconformational and structural transformation of IN uponDNA binding led to an important change in the folding andconformation of the catalytic site loop which in turn favors aformation of the binding pocket accommodating the INSTIs.The binding modes of ELV and L731,988 were practicallynot altered by the removal of the viral DNA. Converselyremoving vDNA had a significant effect on the dockingresults RAL, thereby highlighting the role of vDNA for RALrecognition most likely due to the halogenated benzyl moiety

8 Advances in Virology
Q148
Y143
D116
D64
E152
(a)
Q148
Y143
D116
D64
E152
N155
(b)
S230
D116
D64
E152
(c)
S230
D116
D64
E152
(d)
N117
S230
D116
D64
E152
(e)
N117
S230
D116
D64
E152
(f)
Figure 4: RAL (green), ELV (magenta), and L731,988 (cyan) best poses predicted by Glide. The inhibitors were docked into the active siteof unbound IN (top) and IN·DNA complex (middle) and IN in holo conformation without DNA (bottom) from of the B (in blue) andCRF02 AG (in yellow). Proteins and DNA are shown as cartoons, inhibitors as sticks, and Mg+2 cations as balls.
that displaces the unpaired 5′-adenine and stacking with theCyt16 through π-π interactions. Although such interaction isthought to be involved in all the IN strand transfer inhibitorsexamined [19], our results suggest that ELV and L731,988binding determinants differed in part from the ones of RAL.
It should be noted that slight differences were observedbetween the results obtained with Glide and AutoDockscores, which can be ascribed to the impact of electrostaticinteractions in the studied molecular systems. Indeed Glideuses higher negative charge localized on the two oxygenatoms of the hydroxypyrimidinone of RAL than AutoDock(−1.22 and −0.5e versus −0.183 and −0.265e). Also, withinthe AutoDock scoring function, the carboxylate charges usedfor ELV (2 ×−0.64e) and L731,988 (2 ×−0.62e) are morethan two oxygen atoms attached to the pyrimidine cycleof RAL. To verify this hypothesis, we repeated the dockingcalculations of ELV and L731,988 using the charges of twooxygen atoms attached to the pyrimidine ring of RAL insteadof those assigned by Gasteiger charges. The new bindingenergies of both inhibitors increased from −12.45 and−11.50 to −7.95 and −7.80 kcal/mol for ELV and L731,988,respectively. Since these atomic charges contribute highly inthe binding energy as the atoms coordinate Mg2+ ions, theyare likely responsible for the discrepancies found between
the theoretical binding energies and the experimental IC50values. The experimental ranking of the three inhibitorsbased on IC50 is RAL > ELV > L731,988, as predictedby Glide while the ranking predicted by the AutoDock isELV > L731,988 ≥ RAL. The high negative charges of thecarboxylate oxygen atoms of ELV and L731,988 may be theobstacle to have inhibitory actions on integrase, as efficient asRAL, since these charges increase the desolvation free energyand so increase the binding penalty for these inhibitors.
Studies investigating the presence and frequency of poly-morphisms in the HIV-1 gene of treatment-native patientsare extremely important for tracing the virus evolution andthe epidemiology of HIV infections worldwide. Associatedcrucial questions concern the effect of polymorphisms onviral enzymatic activities, susceptibility towards inhibitors,and inhibitor resistance pathways. The absence of accurateexperimental data characterising the IN and/or IN·vDNAcomplex structures essentially perplexes an exploration ofthese essential topics. Since the beginning of clinical AIDStreatment with RAL in 2007, only a few attempts to probeRAL binding to integrase from different retroviral strainshave been reported. Particularly, molecular docking of RALinto the IN catalytic core domain structure with the inhibitor5CITEP as a viral DNA mimic has depicted different

Advances in Virology 9
binding modes and affinities of RAL to IN from B and Csubtypes [27]. Differences between the binding modes ofseveral compounds to IN from B and C subtypes were alsocommunicated [28].
In this context, our combined theoretical (structuralmodeling) and experimental (biochemical) evaluation ofsubtype CRF02 AG variation impact/effect on IN interactionwith DNA or IN susceptibility to INSTIs contribute to theunderstanding of polymorphism effects at the molecular andstructural level. Our experiments have revealed that IN fromsubtype CRF02 AG has similar enzymatic activity to IN fromsubtype B, and the susceptibility of the two INs to strandtransfer inhibitors is comparable. Results from molecularmodeling and inhibitor docking were found in agreementwith in vitro observations.
Biochemical studies have revealed the impact of HIV-1 natural polymorphism on the susceptibility of protease(PR)—the other retroviral enzyme—to inhibitors [29].Recent structural and biophysical studies have also shownthat sequence polymorphisms of B and CRF01 AE strainscan alter protease activity and PR inhibitors binding [30]. Inthis protein, the variations between the two strains directlyimpact the conformation of the flap hinge region and theprotease core region that play crucial roles for the enzymefunctions.
By contrast, the residues showing natural variations inthe HIV-1 integrases from B and CRF02 AG strains arelocated outside the catalytic region and outer to the bindingsite of the strand transfer inhibitors. Such type of polymor-phismmay allow the virus to preserve the integrase structuraland functional properties as observed in this study.
The methods we applied could be used for the study ofother retroviral substrains emerging at the moment or toappear in the future in order to evaluate and optimize theefficiency of novel specific antiretrovirals. Consequently, ourstudy contributes particularly to this topic and closely relatesto a clinically and therapeutically—significant question—does the HIV-1 integrase polymorphisms influence thesusceptibility towards integrase inhibitors?
3. Conclusions
The naturally occurring variations in HIV-1 subtypeCRF02 AG IN, such as K14R, V31I, L101I, T112V, T124A,T125A, G134N, I135V, K136T, V201I, T206S, V234I, andS283G, do not affect notably integrase structure, neither invitro enzymatic activity, 3′-processing, nor strand transferreaction. Docking results of all the considered inhibitors intothe unbound IN model show the considerably low scoresrespectively, to docking into the pre integration IN·DNAcomplex. The docking scores and inhibitor poses confirmthat the generated structure of the HIV IN·DNA complexis the appropriate biologically relevant model used to explainthe inhibition mechanism of the strand transfer inhibitors.All the three studied molecules are polydentate ligands ableto wrap around the metal cations in the active site. Theresults of the docking are in perfect agreement with theproposed mechanism of action for INSTIs. Docking resultsreveal that the modes of binding and docking conformations
of three studied molecules are identical for the HIV-1 INfrom B and CRF02 AG strains. The proposed mechanismof the integrase inhibition based on considering of differentconformational states, unbound IN, and IN·vDNA complexholds for the two studied strains.
4. Methods
4.1. Molecular Modeling. All calculations were carried out ona Linux station (4×2 cores) running Centos 5.4. The INmod-els were constructed using Modeller package 9V8 [31]. Thesequence alignment was performed using ClustalW server[32, 33] (http://www.ebi.ac.uk/Tools/clustalw2/index.html).The docking of ST inhibitors, RAL, ELV and L731,988(Scheme 1), onto the IN models 1–6 was performed usingtwo algorithms, GLIDE [34] incorporated in the Schrodingersuite (Schrodinger Inc.) and Autodock 4.2 [35]. Figures wereproduced with PyMol [36].
4.2. Models of the HIV-1 IN from B and CRF02 AG Strains.3D models of the full-length IN homodimer, IN1−270
(unbound IN, or apo state, resp. to DNA) containing oneMg2+ cation in each active site were generated by homologymodeling from crystallographic structures of isolated pairsof IN domains. Two structures of the HIV-1 IN, one con-taining the N-terminal domain (NTD) and the catalyticcore domain (CCD) (IN1−210, PDB code: 1K6Y) [37] andthe other containing the CCD and the C-terminal domain(CTD) (IN56−270, PDB code: 1EX4) [38], were chosen asthe initial templates. These structures represent multiplemutants of the HIV-1 subtype B IN, the mutations beingW131D/F139D/F185K in 1K6Y and C56S/W131D/F139/F185K/C180S in 1EX4. Both structures were superimposedand CCD domain (IN56−210) of 1EX4, determined at lowerresolution (2.8 A) than 1K6Y (2.4 A), was deleted. Thedisordered residues 271–288 were also omitted. Sequencesof the WT HIV-1 INs from B and CRF02 AG strains, whichdiffer by 13 amino acids (K/R14, V/I31, L/I101, T/V112,T/A124, T/A125, G/N134, I/V135, K/T136, V/I201, T/S206,V/I234 and S/G283), were aligned to the templates sequencesusing ClustalW. The missing CCD-NTD linker (47–55 aas)was constructed by an ab initio approach with Modeller9V8, based on, discrete optimized protein energy (DOPE)scoring function [39]. 100 models were generated for eachIN, from B and CRF02 AG strains. The conformation of thefolded loop IN140−149 with a well-shaped hairpin structure[40] was reconstructed by a loop-generating algorithm basedon database searches (Protein Loop Search). Mg2+ cationwas inserted into the active site (D64, D116, and E152) asreported in structure 1BI4 [41] and minimized by molecularmechanics (MM) under constrains using CHARMM [42].We shall refer to these generatedmodels as model 1 (B strain)and model 2 (CRF02 AG strain).
4.3. Models of the HIV-1 IN from B and CRF0 AG Strainsin Complex with vDNA. 3D models of the IN·vDNA preintegration complex (holo state respectively to DNA) fromB and CRF02 AG strains were generated by homology
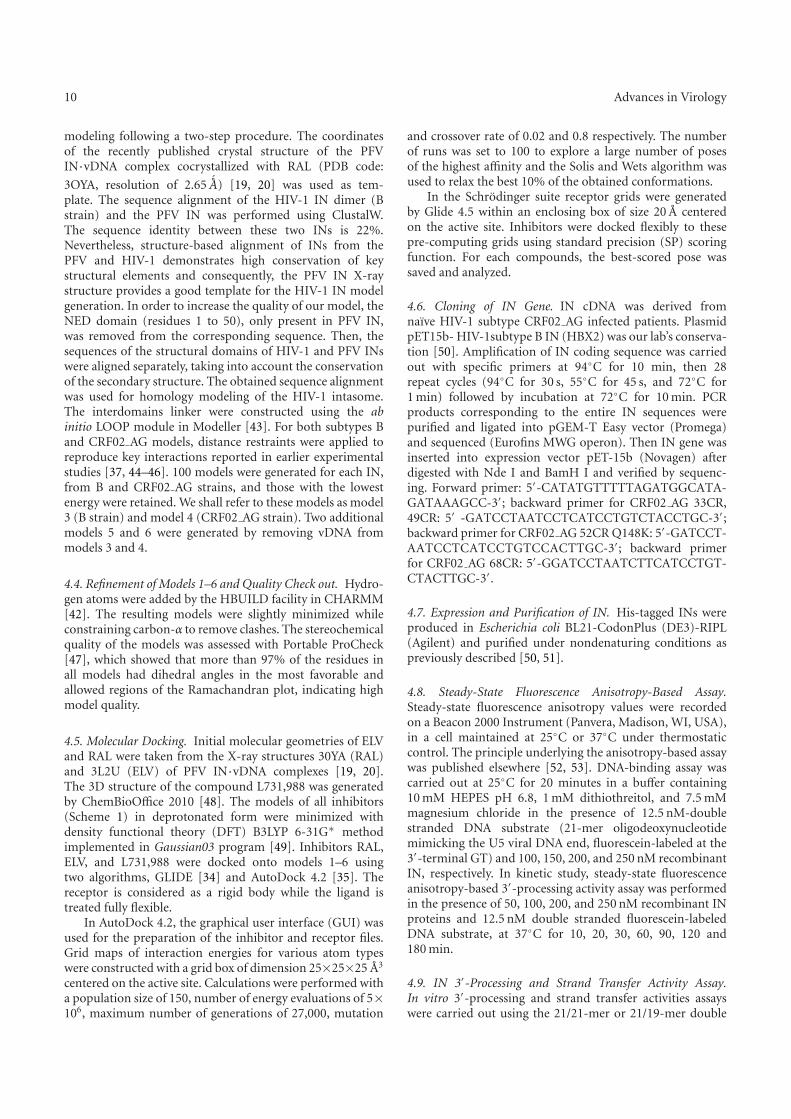
10 Advances in Virology
modeling following a two-step procedure. The coordinatesof the recently published crystal structure of the PFVIN·vDNA complex cocrystallized with RAL (PDB code:
3OYA, resolution of 2.65 ´A) [19, 20] was used as tem-plate. The sequence alignment of the HIV-1 IN dimer (Bstrain) and the PFV IN was performed using ClustalW.The sequence identity between these two INs is 22%.Nevertheless, structure-based alignment of INs from thePFV and HIV-1 demonstrates high conservation of keystructural elements and consequently, the PFV IN X-raystructure provides a good template for the HIV-1 IN modelgeneration. In order to increase the quality of our model, theNED domain (residues 1 to 50), only present in PFV IN,was removed from the corresponding sequence. Then, thesequences of the structural domains of HIV-1 and PFV INswere aligned separately, taking into account the conservationof the secondary structure. The obtained sequence alignmentwas used for homology modeling of the HIV-1 intasome.The interdomains linker were constructed using the abinitio LOOP module in Modeller [43]. For both subtypes Band CRF02 AG models, distance restraints were applied toreproduce key interactions reported in earlier experimentalstudies [37, 44–46]. 100 models were generated for each IN,from B and CRF02 AG strains, and those with the lowestenergy were retained. We shall refer to these models as model3 (B strain) and model 4 (CRF02 AG strain). Two additionalmodels 5 and 6 were generated by removing vDNA frommodels 3 and 4.
4.4. Refinement of Models 1–6 and Quality Check out. Hydro-gen atoms were added by the HBUILD facility in CHARMM[42]. The resulting models were slightly minimized whileconstraining carbon-α to remove clashes. The stereochemicalquality of the models was assessed with Portable ProCheck[47], which showed that more than 97% of the residues inall models had dihedral angles in the most favorable andallowed regions of the Ramachandran plot, indicating highmodel quality.
4.5. Molecular Docking. Initial molecular geometries of ELVand RAL were taken from the X-ray structures 30YA (RAL)and 3L2U (ELV) of PFV IN·vDNA complexes [19, 20].The 3D structure of the compound L731,988 was generatedby ChemBioOffice 2010 [48]. The models of all inhibitors(Scheme 1) in deprotonated form were minimized withdensity functional theory (DFT) B3LYP 6-31G∗ methodimplemented in Gaussian03 program [49]. Inhibitors RAL,ELV, and L731,988 were docked onto models 1–6 usingtwo algorithms, GLIDE [34] and AutoDock 4.2 [35]. Thereceptor is considered as a rigid body while the ligand istreated fully flexible.
In AutoDock 4.2, the graphical user interface (GUI) wasused for the preparation of the inhibitor and receptor files.Grid maps of interaction energies for various atom typeswere constructed with a grid box of dimension 25×25×25 A3
centered on the active site. Calculations were performed witha population size of 150, number of energy evaluations of 5×10⁶, maximum number of generations of 27,000, mutation
and crossover rate of 0.02 and 0.8 respectively. The numberof runs was set to 100 to explore a large number of posesof the highest affinity and the Solis and Wets algorithm wasused to relax the best 10% of the obtained conformations.
In the Schrodinger suite receptor grids were generatedby Glide 4.5 within an enclosing box of size 20 A centeredon the active site. Inhibitors were docked flexibly to thesepre-computing grids using standard precision (SP) scoringfunction. For each compounds, the best-scored pose wassaved and analyzed.
4.6. Cloning of IN Gene. IN cDNA was derived fromnaıve HIV-1 subtype CRF02 AG infected patients. PlasmidpET15b- HIV-1subtype B IN (HBX2) was our lab’s conserva-tion [50]. Amplification of IN coding sequence was carriedout with specific primers at 94C for 10 min, then 28repeat cycles (94C for 30 s, 55C for 45 s, and 72C for1min) followed by incubation at 72C for 10min. PCRproducts corresponding to the entire IN sequences werepurified and ligated into pGEM-T Easy vector (Promega)and sequenced (Eurofins MWG operon). Then IN gene wasinserted into expression vector pET-15b (Novagen) afterdigested with Nde I and BamH I and verified by sequenc-ing. Forward primer: 5′-CATATGTTTTTAGATGGCATA-GATAAAGCC-3′; backward primer for CRF02 AG 33CR,49CR: 5′ -GATCCTAATCCTCATCCTGTCTACCTGC-3′;backward primer for CRF02 AG 52CRQ148K: 5′-GATCCT-AATCCTCATCCTGTCCACTTGC-3′; backward primerfor CRF02 AG 68CR: 5′-GGATCCTAATCTTCATCCTGT-CTACTTGC-3′.
4.7. Expression and Purification of IN. His-tagged INs wereproduced in Escherichia coli BL21-CodonPlus (DE3)-RIPL(Agilent) and purified under nondenaturing conditions aspreviously described [50, 51].
4.8. Steady-State Fluorescence Anisotropy-Based Assay.Steady-state fluorescence anisotropy values were recordedon a Beacon 2000 Instrument (Panvera, Madison, WI, USA),in a cell maintained at 25C or 37C under thermostaticcontrol. The principle underlying the anisotropy-based assaywas published elsewhere [52, 53]. DNA-binding assay wascarried out at 25C for 20 minutes in a buffer containing10mM HEPES pH 6.8, 1mM dithiothreitol, and 7.5mMmagnesium chloride in the presence of 12.5 nM-doublestranded DNA substrate (21-mer oligodeoxynucleotidemimicking the U5 viral DNA end, fluorescein-labeled at the3′-terminal GT) and 100, 150, 200, and 250 nM recombinantIN, respectively. In kinetic study, steady-state fluorescenceanisotropy-based 3′-processing activity assay was performedin the presence of 50, 100, 200, and 250 nM recombinant INproteins and 12.5 nM double stranded fluorescein-labeledDNA substrate, at 37C for 10, 20, 30, 60, 90, 120 and180min.
4.9. IN 3′-Processing and Strand Transfer Activity Assay.In vitro 3′-processing and strand transfer activities assayswere carried out using the 21/21-mer or 21/19-mer double
Advances in Virology 11
stranded oligodeoxynucleotides marked with [γ-32P] ATP-respectively, as previously described [51]. The duration ofthe assays was 3 hours, at temperature 37C, in a buffercontaining 10 mM HEPES pH 6.8, 1mM dithiothreitol, and7.5mM magnesium chloride in the presence of 12.5 nMdouble stranded DNA substrate and 100 nM recombinantIN. The kinetic study was carried out by testing in vitro3′-processing activity in the presence of 50, 100, 150, and200 nM recombinant IN proteins, at 37C for 10, 20, 30, 60,90, 120 and 180min, respectively.
4.10. Susceptibility to INSTIs. Susceptibility of INs to INSTIwas determined by testing in vitro strand transfer activityin the presence of increasing concentration of INSTI inDMSO. Inhibition by the drug was expressed as a fractionalproduct (percentage of the activity of the control withoutdrug). The 50% inhibitory concentration (IC50), defined asthe concentration of drug that results in 50% inhibition, wascalculated from inhibition curves fitted to experimental datawith Prism software, version 5.0 (GraphPad Software, Inc.,San Diego, CA, USA).
Abbreviations
HIV-1: Human immunodeficiency virusvDNA: Viral DNAhDNA: Host DNAIN: IntegraseCRF02 AG: Circulating recombinant formLTR: Long terminal repeatPFV: Prototype foamy virusNTD: N-terminal domainCCD: Catalytic core domainCTD: C-terminal domainST: Strand transferINSTI: Integrase strand transfer inhibitorDKAs: Diketo acidsRAL: RaltegravirELV: ElvitegravirPI: Protease inhibitorsRMSD: Root mean square deviation.
Conflict of Interests
The authors have declared no competing interests.
Authors’ Contribution
X. Ni, S. Abdel-Azeim, and E. Laine contributed equally inthis work. J.-F. Mouscadet and L.Tchertanov conceived anddesigned the experiments. X. Ni, S. Abdel-Azeim, E. Laine,R. Arora, and O. Osemwota performed the experiments. X.Ni, S. Abdel-Aziem, and E. Laine analysed the data. A.-G.Marcelin and V. Calvez contributed with reagents/materials/analysis tools. E. Laine, J.-F. Mouscadet, and L. Tchertanovwrote the paper.
Funding
This work was funded by the Ecole Normale Superieure deCachan, the Centre National de la Recherche Scientifique(CNRS), and SIDACTION.
Acknowledgments
The authors acknowledge Schrodinger for proving licenses.
References
[1] P. O. Brown, “Integration of retroviral DNA,” Current Topicsin Microbiology and Immunology, vol. 157, pp. 19–48, 1990.
[2] S. Y. Rhee, T. F. Liu, M. Kiuchi et al., “Natural variation ofHIV-1 group M integrase: implications for a new class ofantiretroviral inhibitors,” Retrovirology, vol. 5, article 74, 2008.
[3] J. Hemelaar, E. Gouws, P. D. Ghys, and S. Osmanov, “Globaltrends in molecular epidemiology of HIV-1 during 2000–2007,” AIDS, vol. 25, no. 5, pp. 679–689, 2011.
[4] L. Fischetti, O. Opare-Sem, D. Candotti, F. Sarkodie, H. Lee,and J. P. Allain, “Molecular epidemiology of HIV in Ghana:dominance of CRF02 AG,” Journal of Medical Virology, vol. 73,no. 2, pp. 158–166, 2004.
[5] L. Fischetti, O. Opare-Sem, D. Candotti, H. Lee, and J. P.Allain, “Higher viral load may explain the dominance ofCRF02 AG in the molecular epidemiology of HIV in Ghana,”AIDS, vol. 18, no. 8, pp. 1208–1210, 2004.
[6] H. F. Njai, Y. Gali, G. Vanham et al., “The predominance ofHuman Immunodeficiency Virus type I (HIV-1) circulatingrecombinant form 02 (CRF02 AG) inWest Central Africa maybe related to its replicative fitness,” Retrovirology, vol. 3, article40, 2006.
[7] L. F. A. MacHado, M. O. G. Ishak, A. C. R. Vallinoto et al.,“Molecular epidemiology of HIV type 1 in Northern Brazil:identification of subtypes C and D and the introduction ofCRF02-AG in the amazon region of Brazil,”AIDS Research andHuman Retroviruses, vol. 25, no. 10, pp. 961–966, 2009.
[8] J. R. Ye, S. Q. Yu, H. Y. Lu, W. S. Wang, R. L. Xin, and Y.Zeng, “Genetic diversity of HIV type 1 isolated from newlydiagnosed subjects (2006-2007) in Beijing, China,” AIDSResearch and Human Retroviruses, vol. 28, no. 1, pp. 119–123,2012.
[9] D. Descamps, M. L. Chaix, B. Montes et al., “Increasingprevalence of transmitted drug resistance mutations and non-B subtype circulation in antiretroviral-naive chronically HIV-infected patients from 2001 to 2006/2007 in France,” Journalof Antimicrobial Chemotherapy, vol. 65, no. 12, Article IDdkq380, pp. 2620–2627, 2010.
[10] J. L. Martınez-Cajas, N. Pant-Pai, M. B. Klein, and M. A.Wainberg, “Role of genetic diversity amongst HIV-1 non-Bsubtypes in drug resistance: a systematic review of virologicand biochemical evidence,” AIDS Reviews, vol. 10, no. 4, pp.212–223, 2008.
[11] B. S. Taylor, M. E. Sobieszczyk, F. E. McCutchan, and S. M.Hammer, “Medical progress: the challenge of HIV-1 subtypediversity,” New England Journal of Medicine, vol. 358, no. 15,pp. 1590–1602, 2008.
[12] T. Bar-Magen, R. D. Sloan, V. H. Faltenbacher et al., “Compar-ative biochemical analysis of HIV-1 subtype B and C integraseenzymes,” Retrovirology, vol. 6, article 103, 2009.
[13] A. Low, N. Prada, M. Topper et al., “Natural polymorphismsof human immunodeficiency virus type 1 integrase and

12 Advances in Virology
inherent susceptibilities to a panel of integrase inhibitors,”Antimicrobial Agents and Chemotherapy, vol. 53, no. 10, pp.4275–4282, 2009.
[14] I. Malet, C. Soulie, L. Tchertanov et al., “Structural effects ofamino acid variations between B and CRF02-AG HIV-1 inte-grases,” Journal of Medical Virology, vol. 80, no. 5, pp. 754–761,2008.
[15] C. Fenollar-Ferrer, V. Carnevale, S. Raugei, and P. Carloni,“HIV-1 integrase-DNA interactions investigated by molecularmodelling,” Computational and Mathematical Methods inMedicine, vol. 9, no. 3-4, pp. 231–243, 2008.
[16] A. I. Maıga, I. Malet, C. Soulie et al., “Genetic barriers forintegrase inhibitor drug resistance in HIV type-1 B andCRF02 AG subtypes,” Antiviral Therapy, vol. 14, no. 1, pp.123–129, 2009.
[17] E. Asante-Appiah and A. M. Skalka, “A metal-induced confor-mational change and activation of HIV-1 integrase,” Journal ofBiological Chemistry, vol. 272, no. 26, pp. 16196–16205, 1997.
[18] J. F. Mouscadet, O. Delelis, A. G. Marcelin, and L. Tchertanov,“Resistance to HIV-1 integrase inhibitors: a structural per-spective,” Drug Resistance Updates, vol. 13, no. 4-5, pp. 139–150, 2010.
[19] S. Hare, A. M. Vos, R. F. Clayton, J. W. Thuring, M. D.Cummings, and P. Cherepanov, “Molecular mechanisms ofretroviral integrase inhibition and the evolution of viral resist-ance,” Proceedings of the National Academy of Sciences of theUnited States of America, vol. 107, no. 46, pp. 20057–20062,2010.
[20] S. Hare, S. S. Gupta, E. Valkov, A. Engelman, and P.Cherepanov, “Retroviral intasome assembly and inhibition ofDNA strand transfer,” Nature, vol. 464, no. 7286, pp. 232–236,2010.
[21] Z. Yin and R. Craigie, “Modeling the HIV-1 intasome: a pro-totype view of the target of integrase inhibitors,” Viruses, vol.2, no. 12, pp. 2777–2781, 2010.
[22] E. Guiot, K. Carayon, O. Delelis et al., “Relationship betweenthe oligomeric status of HIV-1 integrase on DNA and enzy-matic activity,” Journal of Biological Chemistry, vol. 281, no.32, pp. 22707–22719, 2006.
[23] O. Delelis, I. Malet, L. Na et al., “The G140S mutation in HIVintegrases from raltegravir-resistant patients rescues catalyticdefect due to the resistance Q148H mutation,” Nucleic AcidsResearch, vol. 37, no. 4, pp. 1193–1201, 2009.
[24] C. Maurin, F. Bailly, E. Buisine et al., “Spectroscopic studiesof diketoacids-metal interactions. A probing tool for thepharmacophoric intermetallic distance in the HIV-1 integraseactive site,” Journal of Medicinal Chemistry, vol. 47, no. 22, pp.5583–5586, 2004.
[25] A. S. Espeseth, P. Felock, A. Wolfe et al., “HIV-1 integraseinhibitors that compete with the target DNA substrate definea unique strand transfer conformation for integrase,” Proceed-ings of the National Academy of Sciences of the United States ofAmerica, vol. 97, no. 21, pp. 11244–11249, 2000.
[26] T. Kawasuji, T. Yoshinaga, A. Sato, M. Yodo, T. Fujiwara, andR. Kiyama, “A platform for designingHIV integrase inhibitors.Part 1: 2-Hydroxy-3-heteroaryl acrylic acid derivatives asnovel HIV integrase inhibitor and modeling of hydrophilicand hydrophobic pharmacophores,” Bioorganic and MedicinalChemistry, vol. 14, no. 24, pp. 8430–8445, 2006.
[27] E. Z. Loizidou, I. Kousiappa, C. D. Zeinalipour-Yazdi, D. A.M. C. Van De Vijver, and L. G. Kostrikis, “Implications ofHIV-1M group polymorphisms on integrase inhibitor efficacyand resistance: genetic and structural in silico analyses,”Biochemistry, vol. 48, no. 1, pp. 4–6, 2009.
[28] R. Hewer, T. Traut, J. Coates, and B. Williams, “Predictedmodes of resistance and hypersensensivity confered by naturalpolymorphisms of HIV-1 integrase,” Antiviral Research, vol.82, no. 2, article A24, 2009.
[29] A. Ali, R. M. Bandaranayake, Y. Cai et al., “Molecular basis fordrug resistance in HIV-1 protease,” Viruses, vol. 2, no. 11, pp.2509–2535, 2010.
[30] R. M. Bandaranayake, M. Kolli, N. M. King et al., “The effectof clade-specific sequence polymorphisms on HIV-1 proteaseactivity and inhibitor resistance pathways,” Journal of Virology,vol. 84, no. 19, pp. 9995–10003, 2010.
[31] N. Eswar, B. John, N. Mirkovic et al., “Tools for comparativeprotein structure modeling and analysis,” Nucleic Acids Re-search, vol. 31, no. 13, pp. 3375–3380, 2003.
[32] M. A. Larkin, G. Blackshields, N. P. Brown et al., “Clustal Wand Clustal X version 2.0,” Bioinformatics, vol. 23, no. 21, pp.2947–2948, 2007.
[33] J. D. Thompson, D. G. Higgins, and T. J. Gibson, “CLUSTALW: improving the sensitivity of progressive multiple sequencealignment through sequence weighting, position-specific gappenalties and weight matrix choice,” Nucleic Acids Research,vol. 22, no. 22, pp. 4673–4680, 1994.
[34] R. A. Friesner, J. L. Banks, R. B. Murphy et al., “Glide: a newapproach for rapid, accurate docking and scoring. 1. Methodand assessment of docking accuracy,” Journal of MedicinalChemistry, vol. 47, no. 7, pp. 1739–1749, 2004.
[35] G. M. Morris, H. Ruth, W. Lindstrom et al., “Software newsand updates AutoDock4 and AutoDockTools4: automateddocking with selective receptor flexibility,” Journal of Compu-tational Chemistry, vol. 30, no. 16, pp. 2785–2791, 2009.
[36] The PyMOL Molecular Grapics System, 2002.
[37] J. Y. Wang, H. Ling, W. Yang, and R. Craigie, “Structure ofa two-domain fragment of HIV-1 integrase: implications fordomain organization in the intact protein,” EMBO Journal,vol. 20, no. 24, pp. 7333–7343, 2002.
[38] J. C. H. Chen, J. Krucinski, L. J. W. Miercke et al., “Crystalstructure of the HIV-1 integrase catalytic core and C-terminaldomains: a model for viral DNA binding,” Proceedings of theNational Academy of Sciences of the United States of America,vol. 97, no. 15, pp. 8233–8238, 2000.
[39] M. Y. Shen and A. Sali, “Statistical potential for assessment andprediction of protein structures,” Protein Science, vol. 15, no.11, pp. 2507–2524, 2006.
[40] J. F. Mouscadet, R. Arora, J. Andre et al., “HIV-1 IN alternativemolecular recognition of DNA induced by raltegravir resis-tance mutations,” Journal of Molecular Recognition, vol. 22, no.6, pp. 480–494, 2009.
[41] S. Maignan, J. P. Guilloteau, Q. Zhou-Liu, C. Clement-Mella,and V. Mikol, “Crystal structures of the catalytic domain ofHIV-1 integrase free and complexed with its metal cofactor:high level of similarity of the active site with other viral inte-grases,” Journal of Molecular Biology, vol. 282, no. 2, pp. 359–368, 1998.
[42] B. R. Brooks, C. L. Brooks, A. D. Mackerell et al., “CHARMM:the biomolecular simulation program,” Journal of Computa-tional Chemistry, vol. 30, no. 10, pp. 1545–1614, 2009.
[43] A. Sali and T. L. Blundell, “Comparative protein modelling bysatisfaction of spatial restraints,” Journal of Molecular Biology,vol. 234, no. 3, pp. 779–815, 1993.
[44] S. Hare, F. Di Nunzio, A. Labeja, J. Wang, A. Engelman, and P.Cherepanov, “Structural basis for functional tetramerizationof lentiviral integrase,” PLoS Pathogens, vol. 5, no. 7, Article IDe1000515, 2009.

Advances in Virology 13
[45] L. Du, L. Shen, Z. Yu et al., “Hyrtiosal, from themarine spongeHyrtios erectus, inhibits HIV-1 integrase binding to viral DNAby a new inhibitor binding site,” ChemMedChem, vol. 3, no. 1,pp. 173–180, 2008.
[46] R. Lu, H. Z. Ghory, and A. Engelman, “Genetic analyses ofconserved residues in the carboxyl-terminal domain of humanimmunodeficiency virus type 1 integrase,” Journal of Virology,vol. 79, no. 16, pp. 10356–10368, 2005.
[47] R. A. Laskowski, M. W. Macarthur, D. S. Moss, and J. M.Thornton, “Procheck—a program to check the stereochemicalquality of protein structures,” Journal of Applied Crystallogra-phy, vol. 26, pp. 283–291, 1993.
[48] S. M. Kerwin, “ChemBioOffice Ultra 2010 suite,” Journal ofthe American Chemical Society, vol. 132, no. 7, pp. 2466–2467,2010.
[49] Gaussian 03, Gaussian, Wallingford, UK, 2003.
[50] H. Leh, P. Brodin, J. Bischerour et al., “Determinants of Mg2+-dependent activities of recombinant human immunodeficien-cy virus type 1 integrase,” Biochemistry, vol. 39, no. 31, pp.9285–9294, 2000.
[51] I.Malet, O. Delelis, M. A. Valantin et al., “Mutations associatedwith failure of raltegravir treatment affect integrase sensitivityto the inhibitor in vitro,” Antimicrobial Agents and Chemother-apy, vol. 52, no. 4, pp. 1351–1358, 2008.
[52] J. Agapkina, M. Smolov, S. Barbe et al., “Probing of HIV-1 in-tegrase/DNA interactions using novel analogs of viral DNA,”Journal of Biological Chemistry, vol. 281, no. 17, pp. 11530–11540, 2006.
[53] M. Smolov, M. Gottikh, V. Tashlitskii et al., “Kinetic study ofthe HIV-1 DNA 3′-end processing: single-turnover propertyof integrase,” FEBS Journal, vol. 273, no. 6, pp. 1137–1151,2006.


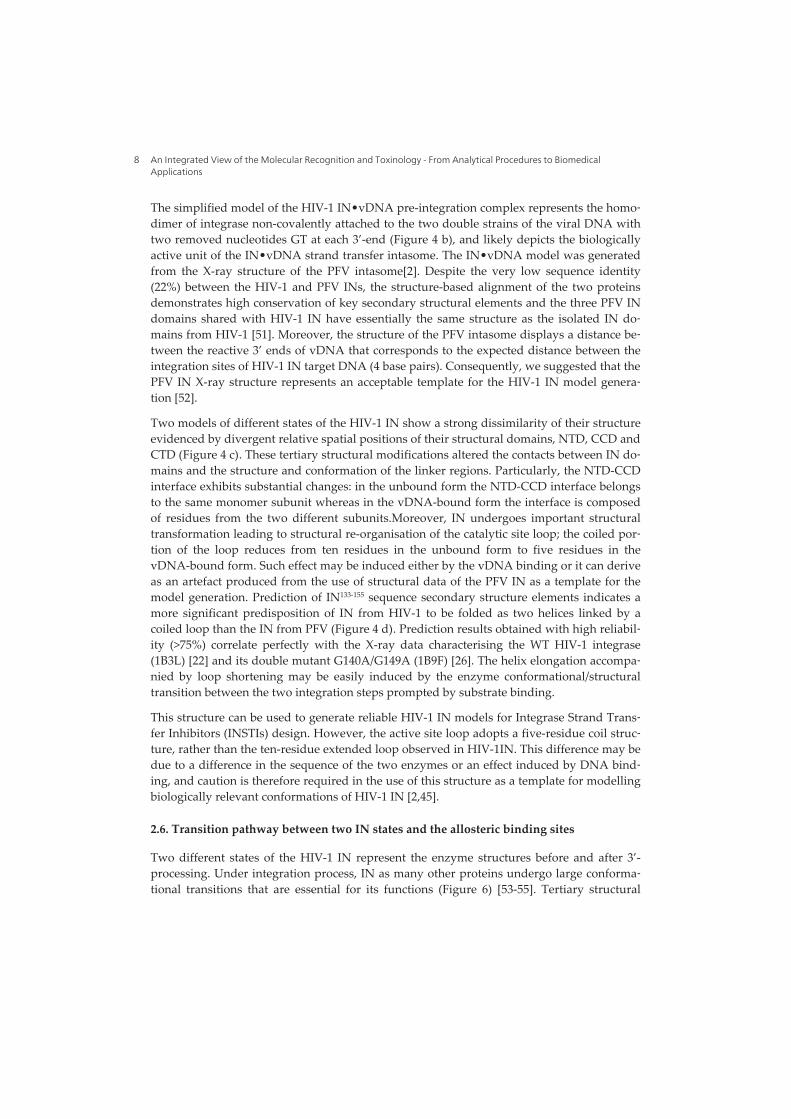

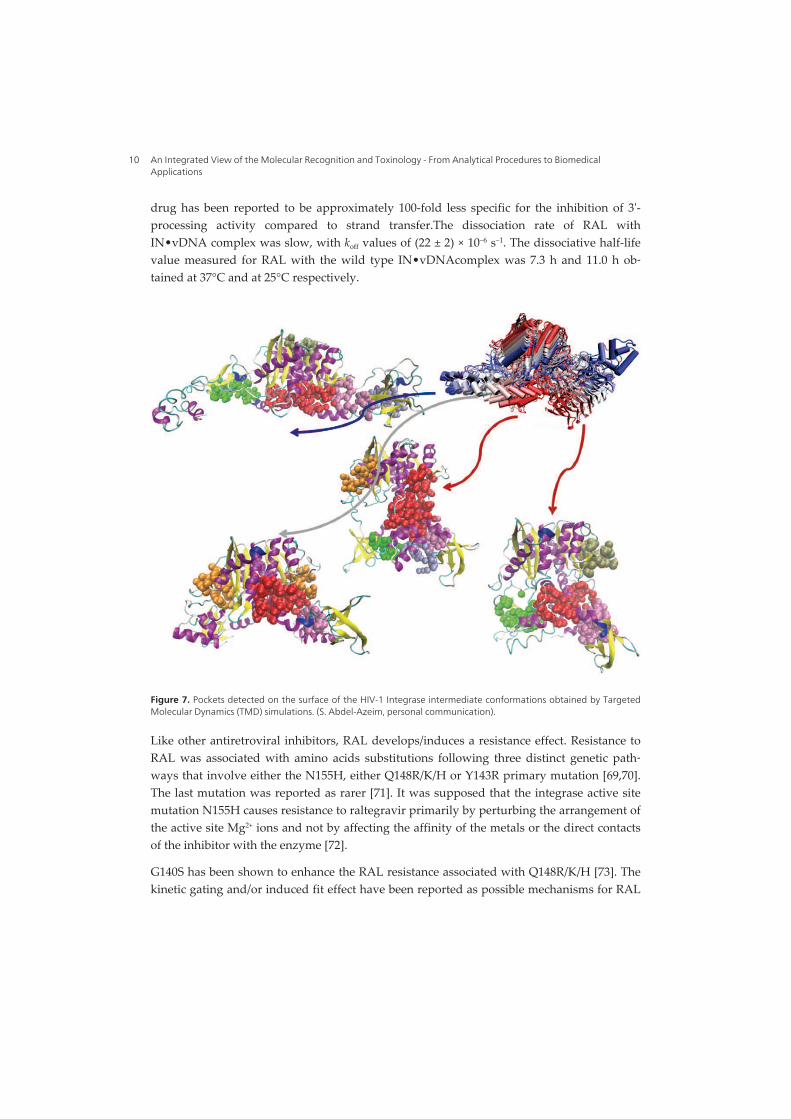
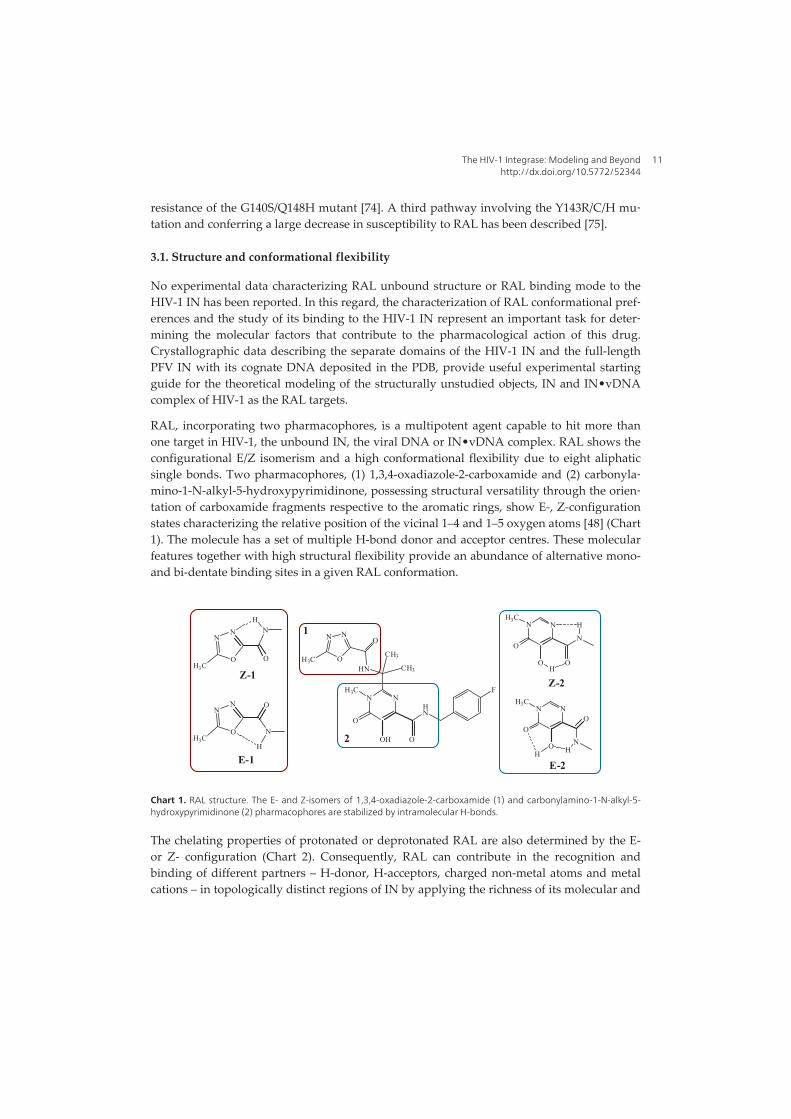
N N
O
H3C
O
N
OH
H
N N
O
H3C
O
OH
NH
N
O
O
NN
H3CH
N
OO
NN
H3C
H
N N
O
HN
O
O
N N
H3C
H3C
O
HN
F
OH
CH3
CH3Z-1
E-1
Z-2
E-2
1
2
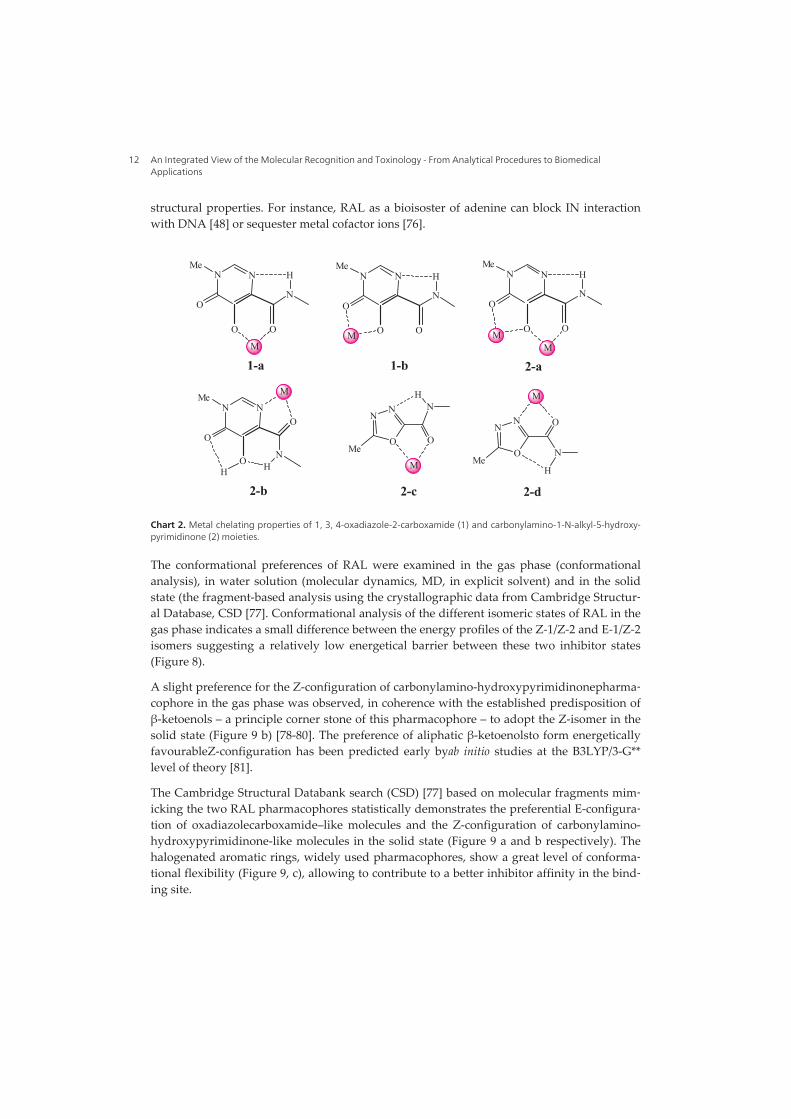
N
O
O
NN
MeH
N
OO
NN
Me
H
N N
O
Me
O
N
O
H
N N
O
Me
O
OH
NH
N N
O
Me
O
N
O
H N N
O
Me
O
N
O
H
M
M
MM M
M
M
1-a 1-b 2-a
2-b 2-c 2-d
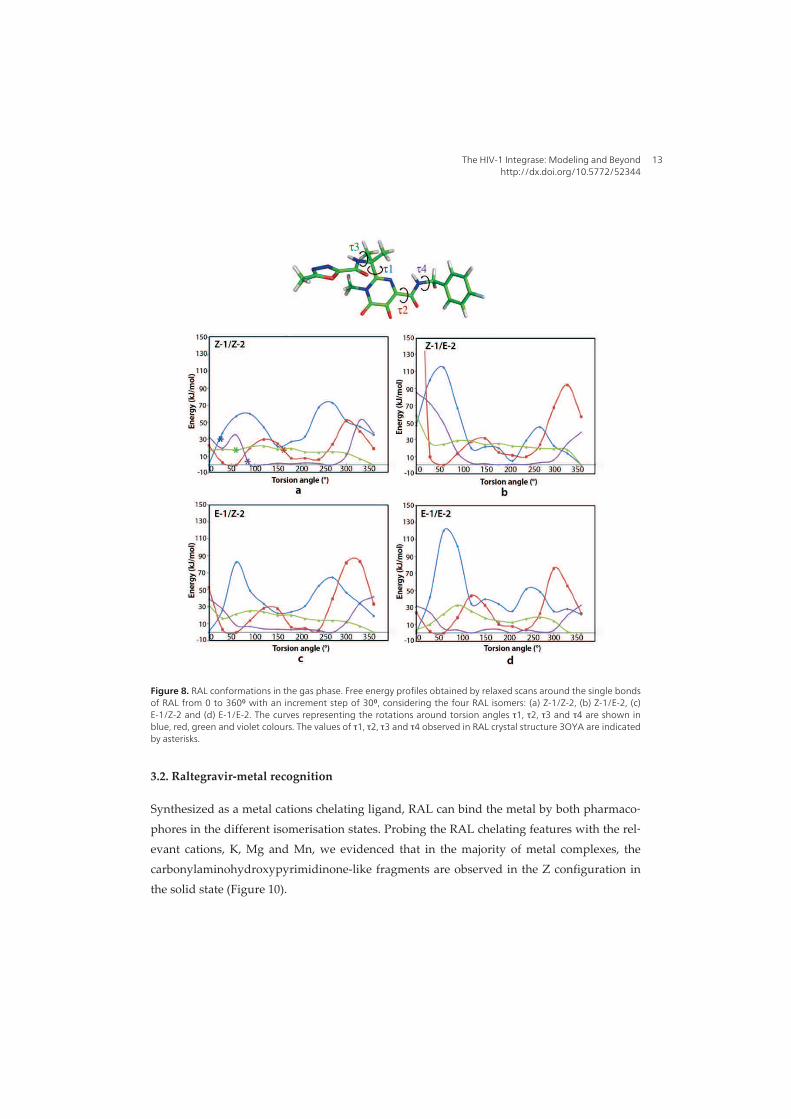
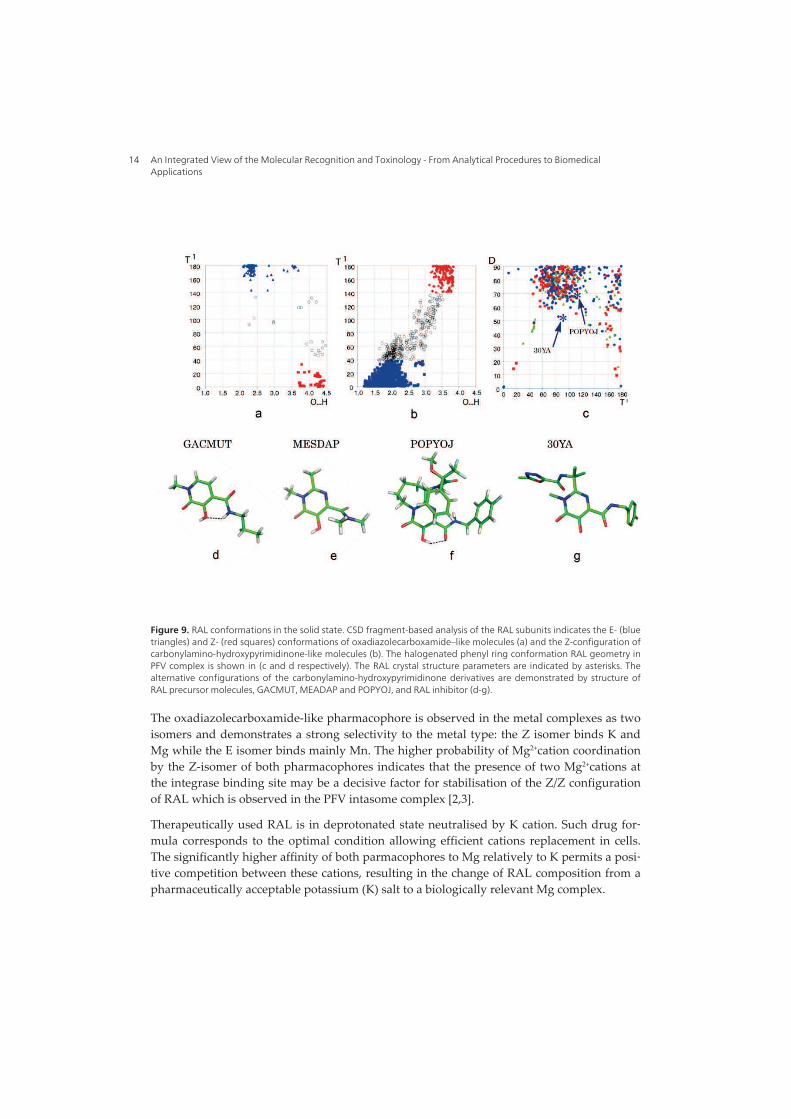
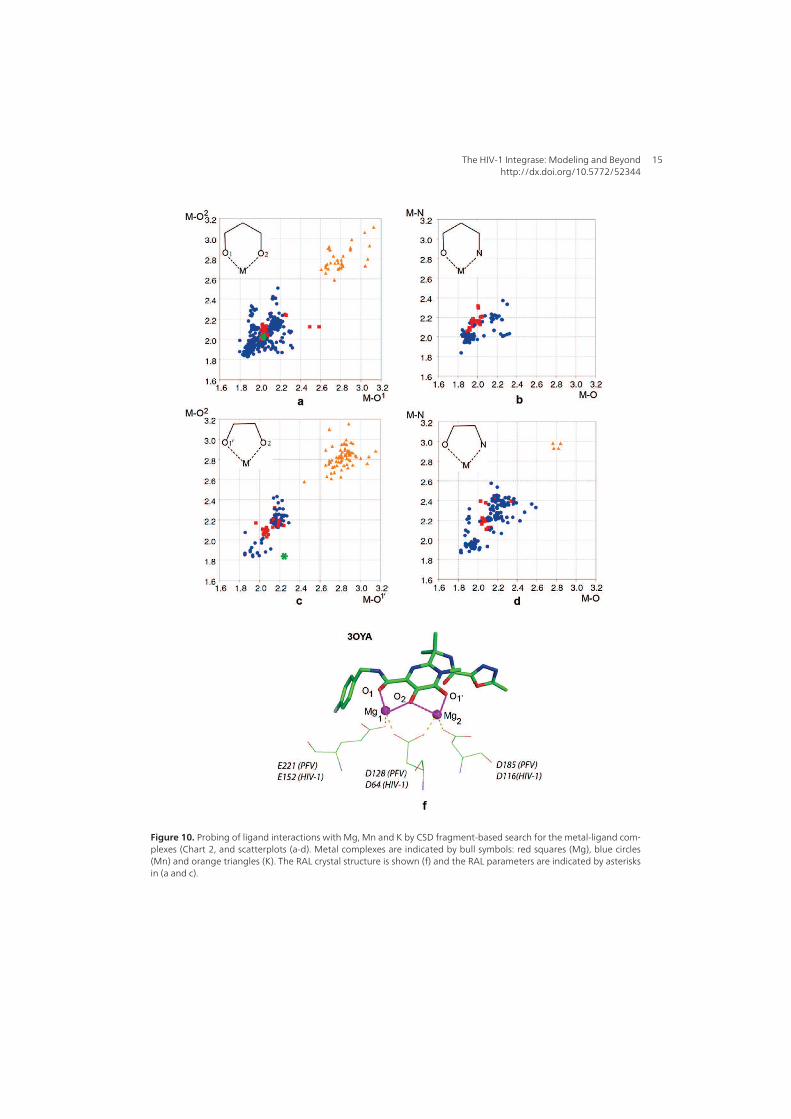

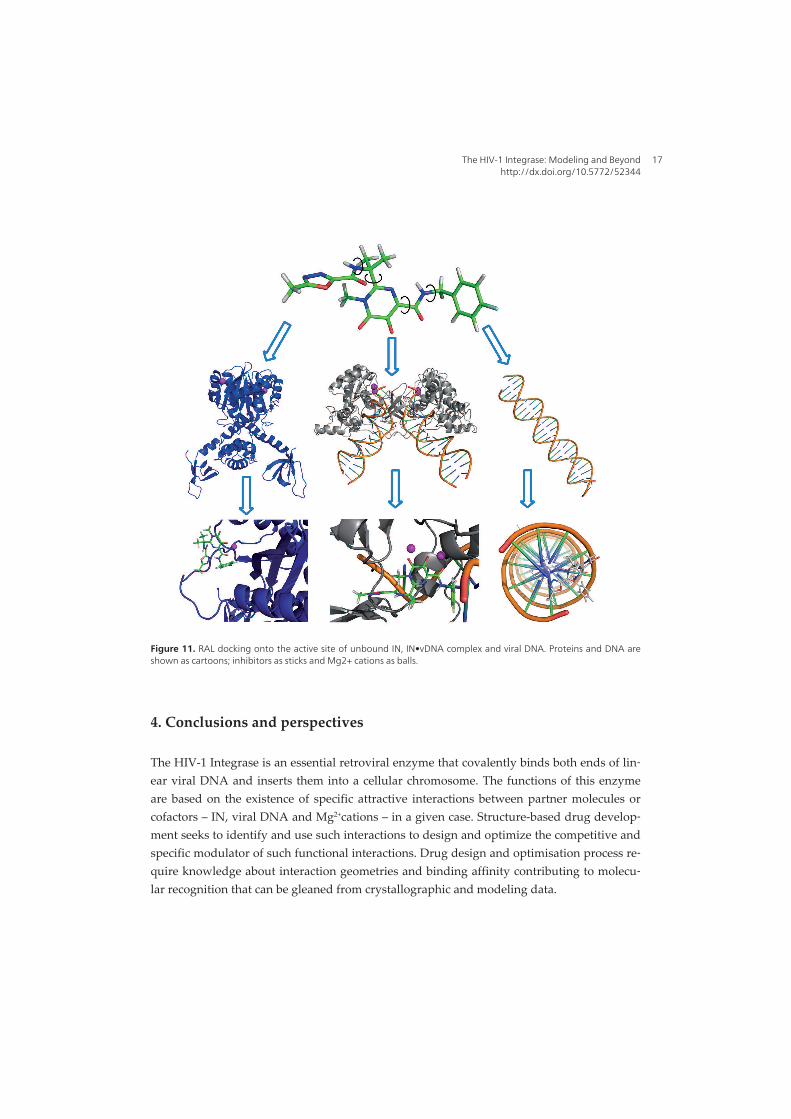


1
Raltegravir flexibility and its impact on recognition by the HIV-1 IN targets
Rohit ARORA1, Isaure CHAUVOT de BEAUCHENE1,
Jaroslaw POLANSKI2, Elodie LAINE1 and Luba TCHERTANOV1*
1 BiMoDyM, LBPA, CNRS -ENS de Cachan, LabEx LERMIT, 61 avenue du Président
Wilson, Cachan, France
2 Institute of Chemistry, University of Silesia, PL-40006 Katowice, Poland
* Correspondance to: L. Tchertanov, BiMoDyM, LBPA, CNRS-ENS de Cachan, 61 Avenue du Président Wilson, 94235 Cachan, France; e-mail : [email protected]
2
Abstract
HIV-1 integrase (IN) is a pertinent target for the development of AIDS chemotherapy. The
first IN specific inhibitor approved for the treatment of HIV/AIDS, Raltegravir (RAL), was
designed to block the strand transfer reaction. To date no experimental data characterising
RAL structure or/and RAL binding to its target has been reported. We characterized the
structural and conformational features of RAL and its recognition by putative HIV-1 targets –
the unbound IN, the viral DNA (vDNA) and the IN·vDNA complex– mimicking the integrase
states over the integration process. The obtained data evidenced that (i) a large binding pocket
delimited by the active site and an extended loop in the unbound IN accommodates RAL in
distinct conformational states all lacking specific interactions with the target; (ii) a well-
defined cavity formed by the active site, the vDNA and the shortened loop in the IN·vDNA
complex provides a more optimised inhibitor binding site in which RAL chelates Mg2+
cations; (iii) a specific recognition between RAL and the unpaired cytosine of the processed
DNA is governed by a pair of strong H-bonds similar to those observed in DNA bases pair G-
C. The identified RAL pose at the cleaved vDNA shed light on a putative step of the RAL
inhibition mechanism. This modeling study indicates that the inhibition process may include
as a first step RAL recognition by the processed vDNA bound to a transient intermediate IN
state, and thus provides a possible route to the design of IN inhibitors with improved affinity
and selectivity.
Keywords: HIV-1 IN, vDNA, IN·vDNA complex, Raltegravir, molecular recognition, Z/E
isomerism, modeling, docking
3
INTRODUCTION
The pol-encoded HIV-1 integrase (IN) is a key enzyme in the replication mechanism of
retroviruses. It catalyzes the covalent insertion of the viral cDNA into the host DNA (hDNA)
of the infected cells (Brown, 1990). A two-step reaction is required for covalent integration of
viral DNA. First, IN binds to a short sequence located at each end of the long terminal repeat
(LTR) of the viral DNA (vDNA) and catalyzes an endonucleotide cleavage, 3'-processing
reaction (3’-P), resulting in the removal of two nucleotides from each of the 3'-ends of LTR
and the delivery of hydroxy groups for nucleophilic attacks. The pre-processed DNA is then
used as a substrate for the strand transfer (ST) reaction, leading to the covalent insertion of the
vDNA into the host genome (hDNA) (Brown, 1990; Chiu and Davies, 2004).
These two reactions are spatially and temporally separated and energetically independent:
the 3’-processing takes place in the cytoplasm of the infected cells, whereas the strand transfer
occurs in the nuclei. They are catalyzed by the enzyme in different oligomerisation states :
dimerization is required for the 3′-processing step (Hayouka et al., 2007) (Guiot et al., 2006),
while tetrameric IN is believed to be required for the strand transfer (Faure et al., 2005), (Li et
al., 2006; Wang et al., 2005).
The integrase activities require the presence of metallic cofactor(s), the Mg2+ or Mn2+
ion(s). IN displays non specific nuclease activity in the presence of Mn2+ and the Mg2+
containing enzyme is much less tolerant of sequence variations at the ends of the LTR than
the Mn2+ enzyme (Esposito and Craigie, 1998), then the Mg2+ cation is considered as the most
physiologically relevant of these cations (Gao et al., 2004). The number of Mg2+ cations is
different for the distinct enzymatic reactions, and consequently for the different IN states: a
single Mg2+ cation in non-processed IN and two cations in processed one.
Integrase is a 288 amino acids enzyme that consists in three structurally distinct functional
domains: (i) the N-terminal domain (NTD, IN1-49) with a non-conventional HHCC Zn-finger
motif, promoting protein multimerization; (ii) the central core domain (CCD, IN50-212) with a
canonical DDE triad performing catalysis and involved in DNA substrate recognition; (iii) the
C-terminal domain (CTD, IN213-288) which binds DNA non specifically and contributes in
stabilising the IN•vDNA complex (Asante-Appiah and Skalka, 1997). Both integration steps,
3’-P and ST, involve the active site D64-D116-E152 motif, and the active site flexible loop
IN140-149 formed by 10 residues. Neither the structure of isolated full-length IN nor that of IN
complexed with its DNA substrate have been determined. Nevertheless, structures of the
4
HIV-1 IN single or two-domains allowed the generation of biologically relevant models
reviewed in (Mouscadet et al., 2010; Arora and Tchertanov, 2012), representing either the
unbound dimeric enzyme or IN complexed with the viral or/and host DNA. The X-ray
structure of full-length Prototype Foamy Virus (PFV) IN·DNA complex (or PFV intasome)
was reported by Cherepanov group (Hare et al., 2010a; Hare et al., 2010b).
The integrase inhibitors were developed to block either the 3’-P or the ST reaction
(Cotelle, 2006; Pommier et al., 2005; Semenova et al., 2008). Raltegravir (RAL), also known
as IsentressTM, the first IN inhibitor approved for AIDS treatment (Marchand et al., 2009)
specifically inhibits the ST activity and was confirmed as IN ST inhibitor (INSTI), whereas
the 3’-P activity was inhibited only up to a certain concentration (Hazuda et al., 2000;
Mouscadet and Tchertanov, 2009). The potency of RAL has been described at the level of
half-maximal inhibitory concentration (IC50 values) in cellular antiviral and recombinant
enzyme assays, kinetic analysis and slow-binding inhibition of IN-catalyzed ST reaction
(Copeland et al., 2006; Dicker et al., 2008; Garvey et al., 2009; Grobler et al., 2002; Hazuda
et al., 2000; Hightower et al., 2011; Markowitz et al., 2006).
Like other antiretroviral inhibitors, RAL induces a resistance effect. Resistance to RAL
was associated with amino acids substitutions following three distinct genetic pathways that
involve either N155H, either Q148R/K/H or Y143R primary mutation (Cooper et al., 2008;
Steigbigel et al., 2008). The last mutation was reported as rarer (Sichtig et al., 2009). G140S
has been shown to enhance the RAL resistance associated with Q148R/K/H (Delelis et al.,
2009). The kinetic gating and/or induced fit effect has been reported as possible mechanisms
for RAL resistance of the G140S/Q148H mutant (Perryman et al., 2010). A third pathway
involving the Y143R/C/H mutation and conferring a large decrease in susceptibility to RAL
has been described (Delelis et al., 2010).
No experimental data characterizing RAL unbound structure or RAL binding mode to the
HIV-1 IN has been reported. In this regard, the characterization of RAL conformational
preferences and the study of its binding to the HIV-1 IN represent an important task for
determining the molecular factors that contribute to the pharmacological action of this drug.
RAL, incorporating three pharmacophores, is a multipotent agent capable to hit more than
one target in HIV-1 ‒ the unbound IN, the viral DNA or IN·vDNA complex. The aromatic
cycles of RAL are connected by aliphatic linkers, each of that contains a planar peptide-like

5
carboxamide moiety connected to pharmacophores by single bonds providing a large
conformational flexibility of the inhibitor. Two pharmacophores, (1) 1,3,4-oxadiazole-2-
carboxamide and (2) carbonylamino-1-N-alkyl-5-hydroxypyrimidinone, possessing structural
versatility through the orientation of the carboxamide fragments respective to the aromatic
rings, show Z- or E- configurational states characterizing the relative position of the vicinal
1‒4 &nd 1‒5 oxygen atoms (Chart 1) (Mouscadet et al., 2009).
Chart 1. RAL structure. The E- and Z-isomers of carbonylamino-1-N-alkyl-5-
hydroxypyrimidinone (1) and 1,3,4-oxadiazole-2-carboxamide (2) pharmacophores are
stabilized by intramolecular H-bonds.
RAL contains a set of multiple H-bond donor (HBD) and H-bond acceptor (HBA) groups,
which may affect RAL affinity for its target 3 HBD and 8 HBA in the protonated state and 2
HBD and 9 HBA in the deprotonated RAL in a pharmaceutically acceptable potassium (K)
salt.
These molecular features together with high structural flexibility provide an abundance of
alternative mono- and bidentate binding sites in a given RAL conformation. The chelating
properties of protonated or deprotonated RAL are also determined by the E- or Z-
configuration (Chart 2). Consequently, RAL can contribute in the recognition and binding of
different partners – H-donor, H-acceptors, charged non-metal atoms and metal cations – in
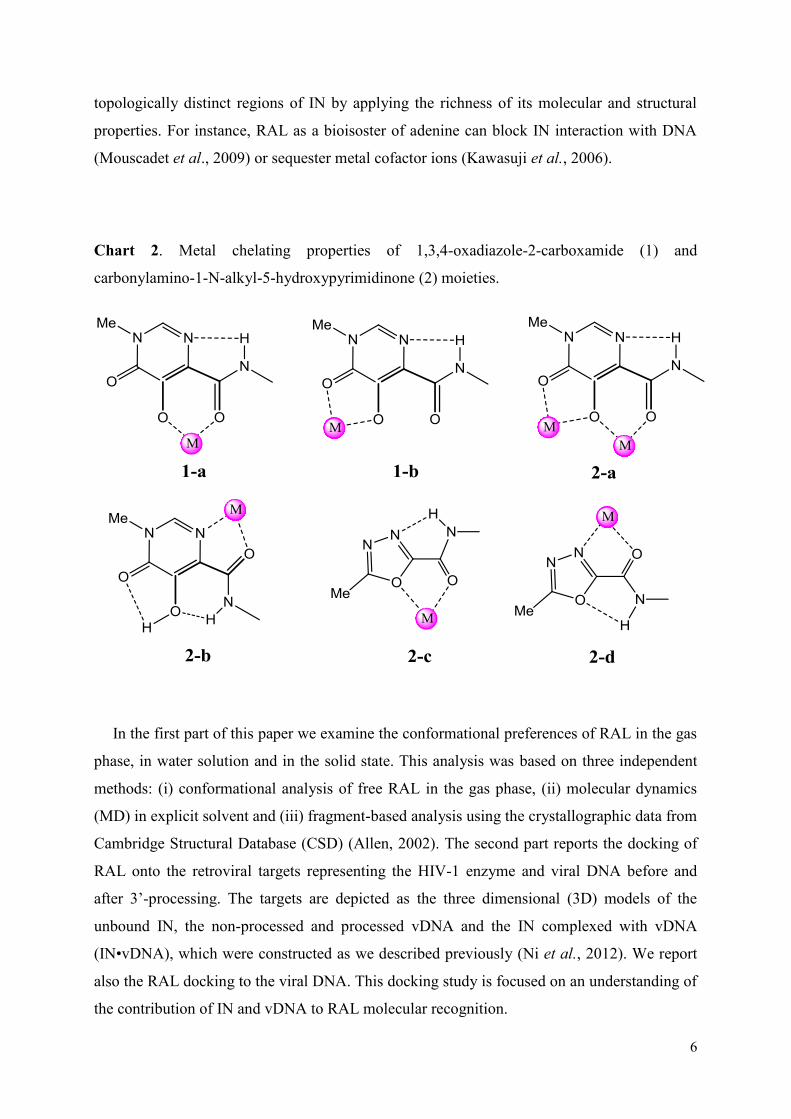
6
topologically distinct regions of IN by applying the richness of its molecular and structural
properties. For instance, RAL as a bioisoster of adenine can block IN interaction with DNA
(Mouscadet et al., 2009) or sequester metal cofactor ions (Kawasuji et al., 2006).
Chart 2. Metal chelating properties of 1,3,4-oxadiazole-2-carboxamide (1) and
carbonylamino-1-N-alkyl-5-hydroxypyrimidinone (2) moieties.
In the first part of this paper we examine the conformational preferences of RAL in the gas
phase, in water solution and in the solid state. This analysis was based on three independent
methods: (i) conformational analysis of free RAL in the gas phase, (ii) molecular dynamics
(MD) in explicit solvent and (iii) fragment-based analysis using the crystallographic data from
Cambridge Structural Database (CSD) (Allen, 2002). The second part reports the docking of
RAL onto the retroviral targets representing the HIV-1 enzyme and viral DNA before and
after 3’-processing. The targets are depicted as the three dimensional (3D) models of the
unbound IN, the non-processed and processed vDNA and the IN complexed with vDNA
(IN•vDNA), which were constructed as we described previously (Ni et al., 2012). We report
also the RAL docking to the viral DNA. This docking study is focused on an understanding of
the contribution of IN and vDNA to RAL molecular recognition.
7
METHODS
All calculations were carried out on a Linux station (4x2 cores) running Centos 5.4.
Figures were produced with PyMol (DeLano, 2002) and Chimera (Pettersen et al., 2004). The
crystallographic structures were retrieved from Protein Data Base (PDB) (Berman et al.,
2000) and Cambridge Structural Database (CSD) (Allen, 2002) and reported with their
reference codes.
1. RAL structure
Conformational analysis: RAL in Z-1/Z-2 configuration was taken from the X-ray structure
of the Prototype Foamy Virus (PFV) integrase co-crystallised with RAL (PDB code: 3OYA,
2.65 Å resolution) (Hare et al., 2010b). Alternative RAL configurations (or isomers) – Z-1/E-
2, E-1/Z-2 and E-1/E-2 (Chart 1) – were generated using the SYBYL package (Tripos Inc.,
2009) by employing simple carbon-carbon bond rotation to achieve the desired configuration,
followed by minimization. Further, the conformational space of each RAL isomer was
characterized by relaxed rotation of molecular fragments around four single bonds using the
Jaguar program of MAESTRO molecular modeling package (Schrödinger, 2007). In each
case, rotation was performed from 0 to 360⁰ with an increment step of 30⁰ for each particular
single bond while the others were kept fixed. All the rotation scans were performed with 6-
31g(d) basis set at the Hartree-Fock (HF) level of theory (Friesner, 1987). Each rotation scan
was analyzed and corresponding potential energy plot and the RAL conformations were
characterized for each isomer.
Molecular Dynamics simulations : The initial molecular geometry of RAL was taken from
the crystallographic coordinates file representing RAL co-crystallized with IN of the PFV
(PDB code: 30YA) (Hare et al., 2010b). The initial model was prepared with pdb2gmx of
GROMACS 4.0 (van der Spoel et al., 2005); The ligand topology was generated by Acpype
using a combination of GAFF and Amber 99sb-ILDN force fields; The charge of the ligand
was -1, generated by Acpype; The hydrogen atoms were then added; In-vacuum minimization
of RAL for 1000 steps was performed using a Steepest-Descent (SD) integrator. The
minimized model of RAL was placed in an octahedral TIP3P water box. The charge of the
solvated system was neutralized by adding Na+ counter ions. The system was then heated up
8
to 300° K at constant volume using a modified Berendsen thermostat (Berendsen et al., 1984)
while restraining the solute atoms by 1 000 kJ/mol/nm2. The system was then equilibrated for
1 ns under constant volume and temperature conditions (NVT). The pressure coupling was
also turned “on” using Parrinello-Rahman barostat (Martonak et al., 2003). Thereafter, three
replicas of MD simulations were produced for the equilibrated system during 10 ns. The
torsion angles t1-t4 were monitored over the MD simulations. The average fraction of
distribution expressed as a probability of the occurrence of t1-t4 is given by (1):
(1)
where m is a mean value and s is a standard deviation.
The H-bonds formed by RAL with water molecules were recovered over the MD simulations.
The contacts D-H×××A, where D and A = O/N, with D×××A distances < 3.4 Å and pseudo valent
angles ÐD-H×××A > 90° were considered as H-bonds.
CSD structural fragment-based analysis: Relevant structures were retrieved from the CSD
(Release 2011, 541,748 entries) (Allen, 2002). Substructural searches, geometry calculations
and data analysis were carried out with the CSD programs ConQuest 1.13 (Bruno et al.,
1997), Vista v2.1 (CSD, 1994) and Mercury 2.4.5 (Macrae et al., 2006). Structures flagged in
the database as being erroneous or disordered were rejected from analysis.
We searched CSD for three groups of molecules based on the 1,3,4-oxadiazole-2-
carboxamide (1), carbonylamino-1-N-alkyl-5-hydroxypyrimidinone (2) and fluorobenzyl
carbamoyl (3) moieties. No structures included moiety (1) and a limited number (3 structures)
of molecules based on moiety (2) was retrieved, therefore the search was performed using the
more general fragments ‒ F1, F2 and F3 (Table 1). The F1 and F2 were investigated to
characterise the molecular geometry, intramolecular H-bonding (D-H…A, where D and A =
O/N) and coordination geometry in metal complexes (M= Mn, Mg and K) as defined in
(Tchertanov and Mouscadet, 2007) and in Table 1. Molecules based on F3 with halogen atom
F, Cl or Br in the para position were analysed for the torsion and dihedral angles. Statistical
univariate and bivariate analysis was applied to quantify the observations and identify the
relationships between the measured parameters. The results obtained for univariate analysis
are presented as numerical values, and those for bivariate analyses are presented as scatter
plots.

9
2. Targets modeling
Secondary structure prediction : Secondary structure assignment for the 1BL3 (Maignan et
al., 1998), 1B9F (Greenwald et al., 1999) ‒ crystallographic structures of the HIV-1 IN
catalytic core domain representing the single F185H mutant and the G140A/G149A/F185K
triple mutant respectively, and 3DLR (Valkov et al., 2009a) and 3OYA (Hare et al., 2010b) ‒
the crystallographic structures of PFV IN, either isolated or in complex with DNA,
respectively, were achieved with the DSSP (Kabsch and Sander, 1983) and Stride (Frishman
and Argos, 1995) algorithms.
The secondary structures of the 23 amino acids (aas) polypeptides IN133-155 of the HIV-1 IN
and IN202-225 of the PFV IN were predicted by combining different methods: GOR4 (Garnier
et al., 1996); SIMPA96 (Levin, 1997); PSIpred (McGuffin et al., 2000); APSSP2 (Raghava,
2002); DSC (King et al., 1997); HNN (NPS@ : CLUSTALW ALIGNMENT); PHD (Rost et
al., 1994); Jnet (Cuff et al., 1998); MLRC (Guermeur et al., 1999) combining GOR4,
SIMPA96 and SOPMA; and SSPRO (Pollastri et al., 2002). A score was assigned to each
predicted secondary structures (β-strand, a-helix, coil and turns) per amino acid by each
method, to further derive a consensus prediction. Two types of consensus predictions were
computed: the first type was derived from the tools that do not perform alignment before
computing predictions (DPM, PREDATOR and GOR4), and the second type was derived
from the tools that are based on multiple alignments (SIMPA96, PHD, SOPMA, Jnet, DSC,
GORV and PSIPRED). The occurrences of each structural element at a given position were
summed over all the predictions for each set resulting as consensus 1 and consensus 2. The
confidence rate of a consensus prediction at one position was considered as “high” when at
least 75% of the predictions of the set converged.
Generation of the models of unbound IN, IN•vDNA complex and vDNA: The IN models
were constructed using Modeller package 9V8 (Eswar et al., 2003) as we reported previously
(Ni et al., 2012). The sequence alignment was performed using ClustalW server
(http://www.ebi.ac.uk/Tools/clustalw2/index.html). Briefly, a 3D model of the full-length IN
homo-dimer, IN1-270 (unbound state respectively to DNA), was generated by homology
modeling from crystallographic structures of isolated pairs of IN domains, IN1-210 (PDB code:
1K6Y) (Wang et al., 2001) and IN56-270 (PDB code: 1EX4) (Chen et al., 2000). The sequence
10
of the native HIV-1 IN was aligned to the templates sequences (non wild-type) using
ClustalW (Larkin et al., 2007; Thompson et al., 1994). The missing regions, namely the linker
from residues 47 to 55 and the catalytic site loop from residues 140 to 148, were constructed
by an ab initio approach as we reported in (Mouscadet et al., 2009). We shall refer to the
model with one Mg+2 cation inserted into the active site as reported in structure 1BI4
(Maignan et al., 1998) as model 1A, and to the model with two Mg+2 cations inserted as
reported in (Mouscadet et al., 2009) as model 1B.
The 3D model of the IN•vDNA pre-integration complex was generated by homology
modeling from the crystal structure of the PFV IN•vDNA complex (PDB code: 3OYA,
resolution of 2.65 Ǻ) (Hare et al., 2010b). Despite the low sequence identity between these
two INs (22%), a high conservation of key structural elements in both integrases allowed us to
use the PFV IN structure as a template for the HIV-1 IN model generation. We shall refer to
the constructed and optimized model as model 2A. The stereochemical quality of the models
was assessed with ProTable Procheck (Laskowski et al., 1993).
A 27 base pair model of the vDNA was constructed using the 3D-DART webserver (van
Dijl and Bonvin, 2009) according to the following sequence: TAGTCAGTGTGGAAAATCT
CTAGCAGT/complement (Hazuda et al., 2000) in B-form (model 3A). A subsequent model
was generated by removing in silico the two nucleotides GT from the 3’-end of the modelled
vDNA, leaving a CA dinucleotide sequence at the terminal end that is required for integration
(model 3B).
3. Procedure of RAL docking onto the targets
Recorded configurational (isomeric) and conformational states of RAL (see
Conformational analysis in METHODS) were used for the inhibitor docking onto the
generated models representing the targets with an extended loop in an open conformation,
unbound IN (models 1A and 1B), and the target with a shortened loop and a well-delimited
binding site, IN•vDNA complex (model 2A). The docking was performed by using four
algorithms: GLIDE (Friesner et al., 2004) incorporated in the Schrödinger suite (Schrödinger
Inc.), AutoDock 4.2 (Morris et al., 2009), VINA (Trott and Olson, 2010) and SurFlex (Jain,
2003). The targets were considered as rigid bodies while the inhibitor was treated as wholly
flexible. Before the docking, the models were prepared (addition of hydrogen atoms, bond
order assignment) according to the given software default requirements.
11
The conformation of RAL determined by X-ray analysis of PFV IN•DNA complex (PDB
code: 3OYA) was optimized and docked onto the vDNA (models 3A and 3B) using GLIDE.
AutoDock: AutoDock (Morris et al., 2009) is based on a hybrid search method that applies a
Lamarckian genetic algorithm. Exploration of the binding site is based on a global search that
uses a Genetic Algorithm (GA) followed by an adaptive local search method derived from the
optimization algorithm of Solis and Wets, that has the advantage of not requiring gradient
computation while it performs torsional angles space search. The graphical user interface
(GUI) of AutoDock 4.2 was used for preparation of ligand and receptor files. Grid maps of
interaction energies for various atom types were carried out with a grid box of dimension
25×25×25 Å3 centred on the active site. Calculations were performed with a population size
of 150, number of energy evaluations of 5x10⁶, maximum number of generations of 27,000
and crossover rate of 0.02 and 0.8, respectively. The number of runs was set to 100 to explore
a large number of poses of the highest affinity, and the Solis and Wets algorithm was used to
relax the best 10 % of the obtained conformations. The active site coordinates were explicitly
defined in the input file.
GLIDE: GLIDE 4.5 (Grid-based Ligand Docking with Energetics) (Friesner et al., 2004)
program uses a hierarchical series of filters to search for possible locations of the ligand in the
binding site region of the receptor. The shape and properties of the receptor are represented on
a grid by several sets of fields that provide progressively more accurate scoring of the ligand
poses. Conformational flexibility of the ligand is handled by an extensive conformational
search. Receptor grids were generated by GLIDE within an enclosing box of size 20 Å
centred on the active site. The inhibitor was docked flexibly to these pre-computing grids
using standard precision (SP) scoring.
VINA: VINA (Trott and Olson, 2010) uses a gradient optimization method in its local
optimization procedure. It uses an Iterated Local Search global optimizer algorithm that
performs a succession of steps consisting of a mutation in the context of a genetic algorithm,
and a local optimization with each step being accepted according to a Metropolis criterion.
The general functional form of the conformation-dependent part of the scoring function VINA
works with the summation over all the pairs of atoms that can move relative to each other
(excluding*1–4 atoms interactions). The binding site for each receptor was explicitly defined.
Grid maps were generated on a grid box with dimensions 25 Å centered over the binding site
of the receptor. The maximum energy difference between the best and worst binding modes

12
was set to 4 kcal/mol, while the exhaustiveness and the maximum number of binding modes
were set to 80 and 100 respectively.
SURFLEX: SurFlex (Jain, 2003) is a relatively new docking algorithm that combines
Hammerhead’s empirical scoring function (Welch et al., 1996) with a molecular similarity to
generate putative poses of ligand fragments. It implements an incremental construction search
approach, as in Hammerhead (Welch et al., 1996), associated to a new fragment assembly
method that is both faster and more accurate. SurFlex employs an idealized active site ligand
(a protomol) as a target to generate putative poses of molecular fragments. These putative
poses are scored using the Hammerhead function. The protomol was generated with a
threshold value of 0.5 and bloat value of 1 Å. The SurFlex package integrated in SYBYL-X
1.1.1 was used for docking.
The binding affinity of RAL-IN complexes was expressed in terms of docking scores. For
each RAL conformation, the lower-scored pose was saved and analyzed.
RESULTS
1. RAL conformations in the gas phase, in water solution and in the
solid state
The intrinsic conformational features/preferences of RAL have been investigated in the gas
phase, in water solution and the solid state.
Raltegravir conformations in the gas phase: First, the geometry and energy of the
protonated RAL were considered in the gas phase. Ab initio calculations were performed at
the Hartree Fock (HF) level of theory as described in METHODS. Full geometry
optimization and energy calculations were carried out for each RAL isomer: Z-1/Z-2, Z-1/E-
2, E-1/Z-2 and E-1/E-2 (Chart 1). Following the geometry optimization, RAL conformations
were generated for each isomer by relaxed rotation (scans) around the four aliphatic single
bonds of the linkers, characterized by torsion angles t1-t4 respectively, with an increment
step of 30°.
The energy profiles of the generated RAL conformations differ in terms of energy value,
while the local minima and maxima are localized within the approximately same ranges of
13
torsion angles in all isomeric states (Figure 1 a-d). The energy profiles of the free rotation
describing the conformational flexibility of RAL substituents relative to the pyrimidine cycle
(torsion angles t1 and t2, in blue and red colours respectively) show high (~120 kJ/mol) and
very high (~500 kJ/mol) energy values at 60° (t1) and at 20° (t2) respectively, while the
corresponding rotation in the Z-1/Z-2 and E-1/Z-2 isomers manifests a moderate energy
barrier, slightly lower in the Z-1/Z-2 isomer. The energy profile describing rotation of the
oxadiazole-carboxamide fragment (torsion angle t3, in green colour) is very similar (Z-1/Z-2
and E-1/Z-2 isomers) or differs only slightly (Z-1/E-2 and E-1/E-2 isomers). All
corresponding curves show that the energy values vary weakly within a large torsion angle
range from 30 to 330°. The max and min values are observed at 0° and 360° respectively. The
energy profile of the fluorobenzyl fragment rotation (torsion angle t4, in violet colour) is
nearly similar in all RAL configurations: its energetical impact is minimal in a wide range
from 100 to 300°; two maxima in the ranges 0-70° and 320-360° are observed.
Analysis of RAL conformational flexibility through the free energy estimation for the
fragments rotation around four aliphatic single bonds of the linkers evidenced that rotations
characterized by torsion angles t1 and t2 are indicative and discriminative for selecting the
energetically favourable RAL configuration(s). We found that, in the gas phase, the Z-1/E-2
and Z-1/Z-2 configurations display energy profiles characterizing the most unstable and the
most energetically favorable RAL conformations, respectively (Figure 1 a, b).
The energies of E-1/E-2 and E-1/Z-2 configurations display intermediate values with
profiles close to those of Z-1/E-2 and Z-1/Z-2, respectively (Figure 1 c, d). The relative
stability of the four RAL isomers may be represented as follows for all considered
conformers: Z-1/Z-2 ³ E-1/Z-2 >> E-1/E-2 >> Z-1/E-2. These results indicate that the Z-1/Z-
2 configuration of RAL is preferable energetically. The energy profile of the deprotonated
species is very similar to that of the neutral molecule (data not shown).
According to the crystallographic data, RAL structure in the PFV IN molecular complex is
stabilised as the Z-1/Z-2 isomer, corresponding to the most stable RAL configuration
observed in the gas phase. The values of torsion angles t1 ‒ t4 observed in the X-ray RAL
structure do not exactly correspond to the minimum on the energy profiles charactering the
free rotation around the single bonds (Figure 1 a). Such conformational difference is probably
caused by RAL interactions with the PFV IN•vDNA complex.
14
Molecular dynamics simulations of Raltegravir in water solution: We supposed that the
calculated conformer energies of RAL with multiple polar functional groups (dipolar moment
of RAL calculated with GAMESS (Fedorov et al., 2003) and CHARMM
(http://yuri.harvard.edu/) is 17.0 and 19.5 D respectively) were solvent-dependent and the
RAL crystallographic structure was further used as initial template for MD simulations in
explicit solvent. Three trajectories of 10 ns of the deprotonated RAL, each following an
equilibration of 2 ns, were run to explore the conformational flexibility of the molecule in
water. The root mean square deviations (RMSDs) of RAL revealed a high degree of atomic
deviations. All three trajectories display comparable conformational drifts with RMSD values
of 0.16 ± 0.06 nm (Figure 2 a). The root mean square fluctuations (RMSFs), measuring the
average atomic mobility of RAL atoms during the MD simulations, as it was expected, shows
that the most fluctuating non-hydrogen atoms are the fluorophenyl fragment and methyl
groups (Figure 2 b).
The four torsion angles τ1 - τ4 describing RAL flexibility were recorded over the MD
simulations. Their occurrences show excellent agreement between the three replicates (Figure
2 c). The torsion angles τ1, τ2 and t3 display Gaussian-like distributions. The torsion angle t3
mostly displays values in a narrow range, from 10 to 30°. Values for the torsion angles τ1 and
τ2 ranged from -190 to -150° and from -25 to 25° respectively. The τ4 values are largely
distributed from -130 to 130⁰.
The RAL H-bonding recorded over the MD trajectories indicates a very high capacity of
the deprotonated molecule to bind water molecules (Figure 2 d). The number of H-bonds
formed by RAL varies from 4 to 15 with a mean value of 11. In the majority of conformations
the nine acceptor (HBA) and two donor (HBD) groups are exposed to the solvent at the same
time, hence each group is capable of forming one or two H-bonds with the water molecules.
Most of these H-bonds are strong in terms of their length. The involvement of RAL in
multiple H-bonds may strongly affect its molecular conformation in solution compared to
those observed in the crystal (PDB code: 3OYA) and in the gas phase (Figure 1 a).
Fragment-based structural analysis: We analyzed the conformational properties of RAL in
the solid state using the structural data available for the building stones or structural blocks of
RAL, the 1,3,4-oxadiazole-2-carboxamide (1), carbonylamino-1-5-hydroxypyrimidinone (2)
and 4-fluorobenzylcarbamoyl (3) derivatives in crystals. The CSD search for the molecules
15
based on each pharmacophore produced no hit, only 3 structures and 83 structures for
fragments 1, 2 and 3 respectively (Table 1). The absence (for 1) or limited data (for the 2 and
3) required the search for the more general fragments ‒ F1, F2 and F3 ; this search resulted in
statistically relevant data (Table 1).
The torsion angle T1 describing the relative position of the O or N vicinal atoms and the
intramolecular contact O···H were used to distinguish the F1 conformations. A scatter plot of
the absolute values of the torsion angle and the O···H-N distance (T1 vs O···H) revealed three
major clusters and a limited number of randomly distributed observations (Figure 3, a).
Torsion angles within the range from 0 to 25° and from 145 to 180° were considered to meet
the criteria for Z- and E-configuration, respectively. Based on this definition, the cluster with
T1 ~ 0° was attributed to the Z- configuration and the two distinct clusters with T1 ~180° to
the E-configuration. The randomly distributed points correspond to intermediate
conformations and were not considered. The populations of the different clusters were not
identical, with most of the F1 fragments in crystals adopting the E-conformation (~75%). The
intramolecular O···H distance was correlated with the F1 conformation. The O···H distance
values in the range from 2.0 to 2.5 Å are indicative of the E-configuration stabilisation by
intramolecular H-bonds (IHB). The small cluster with T1 ~180° and O···H distances from
3.35 to 3.65 Å also represents the E-conformation, although with the H-atom of the amino
group in an unfavourable position to form IHB.
Retrieved carbonylamino-1-5-hydroxypyrimidinone (2) derivatives represent a new class
of heterocyclic ligands (Sunderland et al., 2001; Xu et al., 2003). These ligands synthesised
by a two step procedure to provide the desired flexibility were characterized by X-ray analysis
(CSD codes: GACMUT and MESDAP). GACMUT shows a planar structure stabilized in the
E-configuration by N‒H···O intramolecular H-bonding with H···O distance of 2.02 Å
(Figure 3 d). To avoid the H-bond induced stabilization of the E-configuration, the H atom
was replaced by methyl group. The produced molecule, MESDAP, conserves its E-
conformation but not the planarity : the carbonylamino group is turned at 70° relatively to
the hydroxypyrimidinone ring to resolve the steric constrains (Figure 3 e). A multistep
procedure was applied to synthesized a RAL prototype, the flurobenzyl derivative of
carbonylamino-1-5-hydroxypyrimidinone, POPYOJ (Zhong et al., 2009), leading to RAL
synthesis, which was finalized by a manufacturing route for the synthesis of RAL potassium
salt (Humphrey et al., 2011). Carbonylamino-1-5-hydroxypyrimidinone moiety of POPYOJ is
stabilized in a planar Z-configuration by a strong O‒H···O intramolecular H-bond with H···O
distance of 1.86 Å (Figure 3 f). Consequently in the solid state carbonylamino-1-5-

16
hydroxypyrimidinone moiety shows two different configurational isomers, E- and Z (Chart
1).
To retrieve a statistically significant number of structural data for carbonylamino-1-5-
hydroxypyrimidinone derivatives, we referenced to a more general fragment, the β-ketoenol
moiety, F2, a very important pharmacophore and a corner stone of (1) besides numerous
biologically active molecules. F2 has been previously characterized in detail (Tchertanov &
Mouscadet, 2007). We had shown that the vast majority of β-ketoenols (96%) were stabilized
by a very strong intramolecular H-bonding in Z-configuration. In the present work we took
into account the last update of the data with a recent version of CSD (version 2011) which
enriched considerably the statistical observations (Figure 3, b).
The halogenated aromatic rings are widely present among drugs. The CSD search was
performed for the more generalized fragment F3 based on benzylcarbamoyl derivatives with a
halogen atom (Hal =F/Cl/Br) at the para position. The type of the halogen atom was taken
into consideration. The rotation of the aromatic ring relatively to the carbamoyl fragment was
described with torsion angle T1 and dihedral angle D formed by two planes P1 and P2 defined
in Table 1. A scatter plot of absolute value of torsion angles T1 versus (vs) D reveals a dense
cluster for T1 ranging from 60° to 120° and D from 65° to 90°. The second and diffused
cluster is in the range from 160 to 180° for T1 and from 0° to 90° for D. Such distribution
indicates a very large conformational freedom of benzylcarbamoyl derivatives with a halogen
atom at the para position (blue circles for F, red squares for Cl and green triangles for Br).
Conformation of the benzylcarbamoyl fragment from POPYOJ and 20YA is marked by
asterisks in Figure 3 c. Both structures display T1 values at extremity of the dense cluster.
This structural fragment-based analysis indicates a higher probability of the E-
configuration for the oxadiazole-carboxamide‒like derivatives than of the Z-one. The stability
of such configuration can be attributed to the intramolecular H-bonding or steric and/or other
electronic molecular factors. Nevertheless the Z-isomer is observed in ~20% of related
structures. The β-ketoenol-based derivatives show a clear preference for the Z-configuration
stabilized by a strong or very strong intramolecular O-H···O bond. The molecules stabilised
as E-isomer are relatively rare, as evidenced by the dense cluster at T1 ~180° and illustrated
with two representative structures GACMUT and MESDAP. The benzylcarbamoyl
derivatives with a halogen atom at the para position are characterised by a very high
flexibility. The structural data does not suffice to distinguish between the F, Cl or Br

17
derivatives. These data should be considered together with other physicochemical
characteristics of such molecules.
Probing the RAL coordination of Mg, Mn and K cations: Both partners, inhibitor and its
target, contain metal cations. The pharmaceutically acceptable form of RAL is its potassium
(K) salt. The HIV-1 integrase requires Mn2+ or Mg2+ cations for enzymatic activities in vitro
(Feng et al., 2004) and in vivo (Neamati et al., 2002). The active site conformation of the
HIV-1 integrase may differ depending on whether it contains Mn2+ or Mg2+ ions, which in
turn influence the mode of interaction between the inhibitor and the ion-loaded active site.
We focused here on the interactions of 1,3,4-oxadiazole-2-carboxamide (1) and
carbonylamino-1-N-alkyl-5-hydroxypyrimidinone (2) moieties with K, Mg and Mn. Each
pharmacophore, 1 and 2, is polydentate, and binds metals either via a single atom or through
chelation. Chelation gives more stable complexes and is therefore the only mode of
coordination considered here. 1 and 2 possess chelating fragment(s) differing by the Z- and E-
isomers at the chelating atom types (Chart 2). The vicinal 1‒4 oxygen atoms of
hydroxypyrimidinone and β-ketoenolate can chelate two metal cations simultaneously (Chart
2, 2-d).
The 5- and 4-atom based ligands with either two oxygen ligating atoms (L1 and L3) or
heteroatoms O/N (L2 and L4) were used for retrieving and analysing the M-L complexes (M
= K, Mg and Mn) (Table 2). The number of crystal structures containing both a metal atom
(K, Mg or Mn) and a ligand with identical ligating atoms (L1 and L3) are trice more common
respectively to complexes formed with heteroatomic ligands (L2 and L4). Structures based on
ligand L1 are trice as numerous as structures based on ligand L3, while a quantity of
structures based on ligands L2 and L4 differ slightly (ratio of 1 : 1.5). The proportion of
complexes in which the metal is chelated by ligand L1 or L3 and L2 or L4 is approximately
the same. The metals occurrences show K:Mg:Mn ratio of 8:1:5 for all analysed crystal
structures while the ratio of metals chelated with all ligands L1 – L4 is K:Mg:Mn of 1.5:1:6.
L1 and L4 appears to display preferential binding to Mn, while L4 chelates better K.
The scatter plot of M‒O coordination bond distances in M-L1 complexes shows four
clusters (Figure 4 a). Three dense clusters correspond to MnIII/MnIV (MnIII and MnIV
complexes considered together), MgII and MnII complexes. Mn/Mg···O bond distances were
characterized in detail and correlation between their geometrical parameters and the metal
18
type, oxidation state and size were established (Tchertanov and Mouscadet, 2007). Update of
these data with a recent version of CSD (2011) confirmed the earliest finding. Taken into
consideration the potassium complexes, we identified on the scatter plot a diffuse cluster
composed of K complexes. K···O bond distances range from 2.6 to 3.6 Å, indicating weak or
very weak ionic interactions.
The distribution of the M‒O coordination distances in M‒L3 is generally similar to that
observed in M‒L1 complexes (Figure 4 a and c). However, some difference is manifested :
(i) M‒O distances distribution is more symmetric in M‒L3 complexes, (ii) clusters formed
with different metals are not identical, Mn‒L1 and K‒L3 showing a higher population
density, (iii) Mg‒L3 displays two separated clusters corresponding to six- and seven-
coordinated complexes with Mg‒O bond distance of 2.065 and 2.170 Å, respectively.
M‒O vs M‒N scatter plot characterising M‒L2 complexes contains only two clusters
composed with MnIII/MnIV and MnII separated by a cluster containing the Mg-based
complexes (Figure 4 b). In M‒L4 complexes, M‒O vs M‒N scatter plot is similar to that in
M‒L3, but the density of clusters is higher for Mn and lower for Mg cations (Figure 4 d). A
very limited number of points with M‒O/M‒N bond distances of 2.80/2.90 Å correspond to
K‒L4 complexes.
In RAL co-crystallized with the PFV IN•vDNA complex (PDB code: 30YA), the length of
coordination bonds M‒O correspond very well to statistical observations for M-L1
complexes, whereas these distances are different from the corresponding statistical data for
M‒L3 complexes and shows a strong asymmetry (Figure 4 a, c). The Mg2+ cations in the IN
active site are fixed as a two-atoms cluster by means of the D64 residue establishing a bridge
between two Mg2+ cations (Figure 4 f). Steric constrains in the active site and conjugated
electronic effect in RAL may be the major factors for such distorted coordination geometry.
2. Targets models, representing the HIV-1 integrase before and after 3’-
processing
Four integrase models were generated by homology modeling (Figure 5). Models 1A and
1B (Figure 5a) represent the unbound homodimer of the full-length integrase (IN1-270), which
plausibly depicts the conformational state of the enzyme before the 3’-processing of vDNA
(unbound state of IN). The models differ by the number of Mg2+ atoms localized in the active
site (one and two cations in model 1 and 2 respectively). Model 2A (Figure 5b) represents the

19
IN homodimer in complex with two double-strand vDNA, which likely depicts the active unit
of the IN•vDNA strand transfer intasome; models 2B (not shown) was derived from model
2A by removing vDNA.
The models 1A and 1B did not show any significant structural change induced by the
different number of Mg2+ cations in the active site. This finding is coherent with our early
published results for the catalytic core domain (CCD) where we reported that a second Mg2+
ion would likely enter the active site upon movement of the E152 side chain toward the active
site conserving the overall structure of CCD (Mouscadet et al., 2009). Therefore only the
model 1A is presented on Figure 5 a. It is useful to note that the Normal Modes Analysis
(NMA) shows that in unbound IN with two Mg2+ cations the active site is more rigid, due to
the stabilising role of the coordination of the Mg2+ cations by three active site residues ‒D64,
D116 and E152 ‒, whereas the catalytic site loop flexibility increases significantly (Arora &
Tchertanov, 2012).
Model 2A was generated from the X-ray structure of the PFV intasome (Hare et al.,
2010a). As we reported, despite a very low sequence identity (22%) between the HIV-1 and
PFV INs, the structure-based alignment of the two proteins demonstrates high conservation of
key secondary structural elements, and the three PFV IN domains shared with HIV-1 IN have
essentially the same structure as the isolated IN domains from HIV-1 (Ni et al., 2012).
Moreover, the structure of the PFV intasome displays a distance between the reactive 3’ ends
of vDNA that corresponds to the expected distance between the integration sites of HIV-1 IN
target DNA (4 base pairs) (Yin and Craigie, 2010). Consequently, we suggested that the PFV
IN X-ray structure represents an acceptable template for the HIV-1 IN model generation. We
considered that a simplified dimer model of the IN•vDNA complex (Figure 5 b) is
appropriate for the modeling procedure.
It is worth noting large structural and conformational changes between the unbound (model
1A) and vDNA-bound (model 2A) integrase states regarding the relative positions of the IN
domains (RMSD of 31 Å, based on Cα) (Figure 5 c). These structural modifications result in
different contacts between the IN domains. As such, in the model 1A no interaction was
detected between CTD and CCD whereas the two domains interact tightly in model 2A. The
NTD-CCD interface also exhibits substantial changes: in the unbound form the NTD-CCD
interface belongs to the same monomer subunit whereas in the vDNA-bound form it is
composed of residues from the two different subunits.
20
Moreover, in the homology modelled IN•vDNA complex, IN undergoes important
structural transformation leading to structural re-organisation of the catalytic site loop; the
coiled portion of the loop reduces from 10 residues (140 -149 aas) in the unbound form to 5
residues (140-144 aas) in the vDNA-bound form. Two hypotheses we proposed: (i) such
effect may be induced by the vDNA binding, or (ii) it is an artefact derived from homology
modeling with the structural data of the PFV IN in which the shorter loop may be a natural
fold of the PFV IN sequence.
To explore the influence of the sequence on the loop folding we used a large range of
algorithms designed to predict secondary structure elements. Efficiency of secondary structure
prediction tools has been recently improved by the use of evolutionary information from
multiple alignments: the query sequence is aligned with homologous sequences taken from a
protein structures database (PDB), and the experimental structures of the homologous
sequences are considered in the prediction. Such method can produce biased results,
particularly if an existing structure shows high sequence similarity but its structure is
influenced by the ligand binding. This case correspond to that studied here. To avoid this
discrepancy, we separated the prediction tools based on either multiple alignements or not for
computation of consensus predictions (see METHODS).
Three amino acid sequences IN133-155 of the wild-type (WT) and the double mutant
G140A/G149A IN from HIV-1 and the WT IN from PFV were considered. According to the
secondary structure predictions, the sequence segment IN150-155, a part of the a-helix IN150-166
is preceded by a random coil composed of 10 residues, IN140-149, in the HIV-1 WT, while in
the double mutant G140A/G149A a reduced coil formed by only 7 amino acids, IN141-147, and
an increased a-helix IN148-166 are observed (Figure 5 d). Mutation G140A also influences the
secondary structure of the IN133-139 sequence segment, favouring a β-sheet structure.
Prediction results obtained with high reliability (>75%) correlate perfectly with the X-ray data
characterising the WT HIV-1 integrase (PDB code: 1B3L) (Maignan et al., 1998) and its
double mutant G140A/G149A (PDB code: 1B9F) (Greenwald et al., 1999).
Prediction for the PFV IN indicates a high probability of a two β-strands organisation of
sequence segments IN204-208 and IN220-222 (corresponding to IN135-139 and IN151-153 in the HIV-
1), linked by a random coil including 10 residues, IN209-219, (IN140-152 in the HIV-1) (Figure 5
d). Consequently, the WT IN133-155 segment from HIV-1 and corresponding IN202-224 segment
from PFV should naturally fold in different and unlike structural elements. Crystallographic

21
data characterising the unbound PFV IN reports that IN210-220 residues were not identified
(PDB code: 3DLR) (Valkov et al., 2009b). Apparently this sequence represents a strongly
flexible coiled structure as we observed in our prediction. In contrast, the X-ray structure of
the PFV IN bound to the vDNA shows a shortened coil and a long well-organized a-helix in
IN214-234 sequence (PDB code: 3L2U) (Hare et al., 2010a). This partial folding of the catalytic
site loop is stabilized through intra-IN domain-domain interactions and interactions with
vDNA that probably contribute to stabilisation and elongation of the a4-helix.
To complete the RAL targets definition, structural models representing the non-cleaved
and cleaved HIV-1 viral DNA (model 3A and 3B respectively) were constructed as described
in METHODS section and represent the double strands helix which is slightly distorted at 3’-
end in 3A model.
RAL-targets recognition
Characterization of RAL recognition by its viral targets was performed as follows. First,
RAL in each conformation generated from the crystallographic structure representing the Z-
1/Z-2 isomer (PDB ID: 3OYA) was docked onto the active site of three targets ‒ unbound IN
with one and two Mg2+ cations at the catalytic site (models 1A and 1B) and IN•vDNA pre-
integration complex (model 2A). RAL was considered in its deprotonated form,
corresponding to its pharmaceutically acceptable form. Four different programs, AutoDock,
GLIDE, VINA and SurFlex, were used for the docking procedure. Such routine allows (i) to
optimize the algorithm choice to dock the flexible inhibitor and (ii) to evaluate RAL binding
with different types of targets, flexible (unbound IN with one Mg2+ cations in the catalytic
site), semi-flexible (unbound IN with two Mg2+ cations in the catalytic site) and rather rigid
(IN•vDNA complex).
To distinguish between the RAL conformations we will refer to the crystallographic
structure of RAL as the “crystallographic conformation”, the conformations generated by
relaxed rotation scan from crystallographic structure of RAL as the “generated
conformations” and RAL conformations produced by docking to targets as the “docked
conformations”.

22
The docked conformations of RAL produced by docking the generated conformations onto
the unbound IN with a single Mg2+ cation within the catalytic site are positioned mainly at the
area delimited by the catalytic site loop in an extended (open) conformation (Figure 6, top
panel, snapshots on the left and on the right). They differ strongly from the generated
conformations and their isomeric state is frequently not coincident with the initial Z-1/Z-2
isomer. The binding energy values obtained by all applied scoring functions range from -8.8
to -5.1 kcal/mol (Figure 6, top panel, central graph).
Docking of the same RAL conformations onto the unbound IN with two Mg2+ cations
within the catalytic site shows that the molecule is re-positioned from the loop towards the
active site (Figure 6, middle panel, snapshots on the left and on the right). The binding
energies are slightly lower ranging from -9.5 to -5.6 kcal/mol (Figure 6, middle panel, central
graph). Similarly to the docking of RAL onto the unbound IN with a single Mg2+ cation, a
large variety of sampled isomers/conformers are realized. The RAL is oriented rather
randomly respectively to the active site and the active site loop.
Docking of the RAL generated conformations onto the IN•vDNA model resulted in
binding modes with significantly lower scores (from -11.9 to -6.2 kcal/mol) than those found
for the unbound IN (Figure 6, bottom panel, central graph). In all cases, RAL is positioned in
the catalytic site of the pre-integration complex and chelates the Mg2+ cations by the oxygen
atoms of carbonylamino-1-5-hydroxypyrimidinone pharmacophore (Figure 6, bottom panel,
snapshots on the left and on the right). The oxadiazole-2-carboxamide pharmacophore
demonstrates alternative docking configurational/conformation states and occupies an either
axial or equatorial position relatively to the plane of the carbonylamino-1-5-
hydroxypyrimidinone pharmacophore. In contrast, the fluorobenzyl moiety is favourably
oriented to form a p-staking with Cyt16 of the vDNA in nearly all docked conformations
obtained with the different programs.
The docking calculations with four different docking algorithms evidenced that the lowest
scores and most adequate docking poses were obtained for RAL docked onto the INvDNA
model. Nevertheless, the docked conformations of RAL differ from the generated
conformations and some of them represent alternative isomers different from the initial one
(Z/Z).
We analysed the docking results individually for each docking method and compared the
efficiency of docking algorithms relatively to the chosen target. The score profiles obtained

23
for RAL docking onto the same target by the different programs are significantly altered
(Figure 6, central column). For RAL docked onto the unbound IN with a single Mg2+ cation,
the lowest score values were obtained with VINA and AutoDock (Figure 6, top panel, central
column). Binding energies for all RAL conformations are very similar, with values ranging
from -8.8 to -7.0 kcal/mol. Binding energies obtained with SurFlex and GLIDE are
characterized by more important fluctuations and higher values, from -8.0 to - 5.2 kcal/mol.
The RAL docking onto the unbound IN with two Mg2+ cations with VINA and AutoDock
show very small difference in predicted binding energies (Figure 6, middle panel, central
column). The score profiles superimposed perfectly within the range from -9.5 to -7.4
kcal/mol. Binding energies obtained with GLIDE and SurFlex fluctuate more significantly
and show slightly decreased values ranging from -9.1 to -5.6 kcal/mol.
RMSDs between generated, docked and crystallographic conformations of RAL
complexed to unbound IN with either a single Mg2+ cation or two Mg2+ cations and IN•vDNA
complex revealed a very high degree of RAL average atomic fluctuations between the
different targets for all applied programs, with the exception of few docked conformations
obtained with GLIDE.
As was mentioned above, the RAL docking onto the IN•vDNA model produced the lowest
binding scores with all applied scoring functions. Particularly the best scores were obtained
with AutoDock (from -11.0 to -8.8 kcal/mol) and GLIDE (from -11.3 to -6.2 kcal/mol) as
compared to the other two docking algorithms, VINA (from -10.4 to -9.1 kcal/mol) and
SurFlex (from -8.7 to -5.6 kcal/mol). Regarding the RAL docking poses together with the
scores, we concluded that GLIDE is the most appropriate software to dock the flexible ligand
onto the relevant target.
We generated the others RAL isomers, E-1/Z-2, Z-1/E-2 and E-1/E-2. The RAL
conformations were derived for each isomer similarly to the procedure applied to the Z-1/Z-2
isomer. We used GLIDE to dock the RAL generated conformation onto the IN targets
applying the same strategy as previously. The obtained results show a general similarity with
the docking data observed for Z-1/Z-2 isomer, nevertheless the predicted scores are
significantly lower in the majority of cases and the RAL binding poses rarely show chelation
of the Mg2+ ion(s) in the active site of the IN targets (data not shown).
To provide further information concerning RAL recognition by the viral targets, we
docked the inhibitor onto the non-cleaved and cleaved viral DNA (the terminal GT

24
nucleotides at 3’-end were removed) by using Glide. RAL docked onto the non-cleaved
vDNA is positioned in the minor groove of the substrate (Figure 7 a). The chelating centre of
the molecule are oriented towards the helix centre; no stabilizing interactions between the
partners, RAL and vDNA, were observed. In contrast, RAL docked onto the cleaved vDNA is
located in the area of the removed dinucleotides GT. The best score corresponds to the Z-1/Z-
2 isomer of RAL with all chelating centres oriented outside the vDNA helix (Figure 7 b).
Such RAL orientation is stabilized by H-bonds with the unpaired cytosine. The nitrogen atom
of RAL oxadiazole cycle interacts with amino group of cytosine forming a strong H-bond (N-
H···N distance of 2.85 Å). The NH group from the adjacent (neighbouring) carbonylamine
group interacts with the oxygen atom of cytosine (N-H···O distance of 2.43 Å). These two
strong H-bonds first are indicative of a high affinity and specific recognition between RAL
and the unpaired cytosine, and second are of the same interaction type as those that stabilize
the bases pair G-C. Consequently, RAL plays the role of the removed guanidine and
completes the vacant position at the viral DNA 3’-end. The additional pair of N-H···N
contacts with distances of 3.29 and 3.50 Å contributes to the stability of RAL···Cytosine
interactions.
Finally, to further explore the role of vDNA in RAL recognition prosess, the substrate was
removed from the IN•vDNA complex and RAL was docked again on unbound IN with a fold
corresponding to vDNA-bound, model 2B. The binding energies of RAL are depreciated
significantly upon vDNA removal and range from -8.9 to 8.9 kcal/mol. Consequently,
unbound IN in the conformations representing either IN before 3’-processing or an isolated
component of the IN•vDNA complex does not appear as a suitable RAL target.
DISCUSSION
In the context of drug design, the conformation adopted by an inhibitor when unbound and
bound to a target is of fundamental importance. The variety of inhibitor conformations
observed in different conditions may arise from interactions with a local environment and
frequently differ from the bioactive conformation. Systematic differences may occur between
the solid state conformation and those observed in solution or gas phase.
25
Our conformational analysis of the different isomeric states of RAL in the gas phase
indicates a small difference between the energy profiles of the Z-1/Z-2 and E-1/Z-2 isomers
suggesting a relatively low energetical barrier between these two inhibitor states. A slight
preference for the Z-configuration of carbonylamino-hydroxypyrimidinone pharmacophore in
the gas phase was observed, in coherence with the established predisposition of β-ketoenols –
a principle corner stone of this pharmacophore – to adopt the Z-isomer in the solid state
(Tchertanov & Mouscadet, 2007). The predisposition of aliphatic β-ketoenols to form
energetically favourable Z-configuration has been predicted early by ab initio studies at the
B3LYP/3-G** level of theory (Schiavoni et al, 2001).
Our structural databank search based on molecular fragments mimicking the RAL
pharmacophores statistically demonstrates the preferential Z-configuration of carbonylamino-
hydroxypyrimidinone-like molecules and the E-configuration of oxadiazole carboxamide–like
molecules in the solid state.
Synthesized as a metal cations chelating ligand, RAL can bind the metal by two
pharmacophores in different isomerisation states. Probing the RAL chelating features with
relevant cations, K, Mg and Mn, we evidenced that, in the majority of metal complexes, the
carbonylamino hydroxypyrimidinone-like fragments are observed in the Z configuration in
the solid state. The oxadiazole carboxamide-like pharmacophore is observed in the metal
complexes as two isomers and demonstrates a strong selectivity to the metal type: the Z
isomer binds K and Mg while the E isomer binds mainly Mn. The higher probability of Mg2+
cation coordination by the Z-isomer of both pharmacophores indicates that the presence of
two Mg2+ cations at the integrase binding site may be a decisive factor for stabilisation of the
Z/Z configuration of RAL, which is observed in the PFV intasome complex (Hare et al.,
2010a; Hare et al., 2010b). The significantly higher affinity of both pharmacophores to Mg
relatively to K permits a positive competition between these cations, resulting in the change of
RAL composition from a pharmaceutically acceptable potassium (K) salt to a biologically
relevant Mg complex.
The experimental data describing inhibitors binding at the atomic level (X-ray or NMR
analysis) is presented in only a limited number of target-ligand molecular complexes. Part of
them characterize the binding of therapeutically relevant ligands to biologically non-relevant
and non-pertinent targets. For example, the HIV-1 integrase specific inhibitor RAL was
published as a ligand fixed to the PFV intasome (Hare et al., 2010a; Hare et al., 2010b).
26
Consequently, a large quantity of reliable information on target-ligand binding is based on
molecular docking methods, which generate insights into the interactions of ligands with the
amino acid residues in the binding pockets of the targets and predict the corresponding
binding affinities (Krovat et al., 2005). The first step of a docking calculation consists in the
choice or generation of the therapeutically appropriate target.
The structural models reported here were generated by homology modeling based on the
experimental data characterising either the partial structures of IN from HIV-1 or full-length
IN from PFV. All generated models represent, with a certain level of reliability, different
enzymatic states of the HIV-1 IN that can be explored as RAL biologically relevant targets.
The models of the separated full-length HIV-1 integrase represent the unbound homodimers
of IN (IN1-270) containing either one or two Mg2+ cations in the active site – a plausible
enzymatic state before the 3’-processing. Our simplified model of the HIV-1 IN•vDNA pre-
integration complex represents the homodimer of integrase attached non-covalently to the two
double strains of the viral DNA with two removed nucleotides GT at each 3’-end.
Two models of different states of the HIV-1 IN show a strong dissimilarity of their
structure evidenced by divergent relative spatial positions of their structural domains, NTD,
CCD and CTD. These tertiary structural modifications altere the contacts between IN domains
and the structure and conformation of the linker regions. Moreover, IN undergoes important
structural transformations leading to structural re-organisation of the catalytic site loop; the
coiled portion of the loop reduces from 10 residues in the unbound form to 5 residues in the
vDNA-bound form. Prediction of IN133-155 sequence secondary structure elements indicates a
more significant predisposition of IN from HIV-1 to be folded as two helices linked by a
coiled loop than the IN from PFV. The helix elongation accompanied by loop shortening may
be easily induced over the enzyme conformational/structural transition between the two
integration steps prompted by substrate binding.
The docking calculations of RAL onto each model evidenced that (i) the large binding
pocket delimited by the active site and the extended catalytic site loop in the unbound IN can
accommodate RAL in distinct configurational/conformational states showing a lack of
interaction specificity between inhibitor and target; (ii) the well defined cavity formed by the
active site, vDNA and shortened catalytic site loop provides a more optimised RAL binding
site where the inhibitor is stabilised by coordination bonds with Mg2+ cations in the Z/Z-
configuration. Such binding is in agreement with the generally accepted mechanism of action
27
of the integrase strand transfer inhibitors. Additional stabilisation of RAL is provided by non-
covalent interactions with the environmental residues of IN and the viral DNA bases.
Based on our computing data we suggested earlier the stabilizing role of the vDNA in the
inhibitors recognition by IN•vDNA pre-integration complex (Ni et al., 2012). It was
experimentally evidenced that RAL potently binds only when IN is in a binary complex with
vDNA (Espeseth et al., 2000), possibly binding to a transient intermediate along the
integration pathway (Pandey et al., 2007). Terminal bases of the viral DNA play a role in both
catalytic efficiency (Johnson et al., 2006; Sherman et al., 1992) and inhibitor binding (Dicker
et al., 2007; Johnson et al., 2007; Langley et al., 2008). It was reported recently that
unprocessed viral DNA could be the primary target of RAL (Ammar et al., 2012). This study
is based on the PFV DNA and several oligonucleotides mimicking the HIV-1 DNA probed by
experimental and computing techniques.
Our docking study shows that RAL is positioned in the minor groove of the HIV-1 non-
cleaved vDNA. No stabilising interactions between partners, RAL and vDNA, were observed.
In contrast, in the processed (cleaved) vDNA the Z/Z isomer of RAL takes the place of the
remote GT bases and is stabilised by strong and specific H-bonds with the unpaired cytosine.
These H-bonds characterize the high affinity and specific recognition between RAL and the
unpaired cytosine similarly to those observed in the DNA bases pair G-C. Based on our
docking results, we suggested that the inhibition process may include as a first step the RAL
recognition by the processed viral DNA bound to a transient intermediate IN state. RAL
coupled to vDNA shows an outside orientation of all oxygen atoms, excellent putative
chelating agents of Mg2+ cations, which could facilitate the insertion of RAL into the active
site. The conformational flexibility of RAL further allows the accommodation/adaptation of
the inhibitor in a relatively large binding pocket of the IN•vDNA pre-integration complex
illustrated by various RAL docked conformation. We believe that such variety of RAL
conformations contributing to the alternative enzyme residues recognition may impact the
selection of the clinically observed alternative resistance pathways to the drug.
The other question considered in our work relates to the choice of the most adapted
molecular docking method to study a very flexible inhibitor with flexible or relatively rigid
targets represented here by the HIV-1 IN unbound or bound to the viral DNA respectively.

28
Although the docking problem seems intuitively easy, searching the space of all possible 3-
dimensional protein–ligand conformations and determining the energetically most favorable
solution is a hard computational problem. In case where both the protein and ligand are kept
rigid, (wherein only the translational and rotational degrees of freedom are considered), the
docking problem is six-dimensional (Thomsen, 2003). However, if flexibility in either the
ligand or the receptor or both, is allowed during the search process, the dimensionality of the
problem increases with the number of “rotatable” bonds. This generates an enormous search
space attributed to the possible conformations of the flexible ligand.
The published docking studies report RAL located within the active site of either unbound
IN or IN•vDNA complex. Distinct poses of RAL representing different RAL configuration
and modes of Mg2+ cations chelation were observed (Barreca et al., 2009, Loizidou et al.,
2009, Perryman et al., 2010, Serrao et al., 2009).
Our trials to dock the generated RAL conformations demonstrate that the four used
programs produce different results which depend more on the targets choice than on the initial
configurational/conformational state of the flexible inhibitor. Docking of the flexible RAL
onto a flexible target (the unbound IN) with an extended and poor-defined (deleterious)
binding pocket produced contradictory results with all used algorithms. The programs were
not capable to discriminate between the docked conformations using the scoring functions.
The binding of strand-transfer inhibitors displaces the reactive vDNA end from the active
site, disarming the viral nucleoprotein complex. The early reported data and our results
indicate as “interacting” with the strand-transfer inhibitors a large number of the IN residues
forming the cavity defined as the active site for the strand-transfer reaction (Agapkina et al.,
2006; Dolan et al., 2009; Dhaked et al., 2009; Ni et al., 2012). The identification of IN
residues specifically interacting with RAL by docking algorithms is a very difficult task and
the exact binding modes of this inhibitor remain a matter of debate. Most probably the
flexible nature of RAL results in different conformations and the mode of binding may differ
in terms of the interacting residues of the target, which trigger the alternative resistance
phenomenon.
Conformational flexibility in protein-ligand interactions is a general event in biological
systems; numerous cases have been reported, for example the oestrogen and tyrosine kinases
receptors (Barnett, 2012; Nebel, 2012; Johnson, 2009). Using the model systems presented
29
here, we studied the extent of conformational variability and related this to the RAL-IN
interaction. Clearly, many aspects such a solvation/desolvation or entropic/ethalpic
contributions remain open questions. Further studies of the energetic and dynamics of theses
process will give us a better understanding of what makes a target attractive for an inhibitor,
which in turn may assist the search for novel candidate drugs related with raltegravir for the
AIDS treatment.
Novel drugs, targeting the HIV-1 Integrase, outcome mainly due to the rapid emergence of
RAL analogues (for example, GS-9137 or elvitegravir, MK-2048 and S/GSK 1349572,
currently under clinical trials (Korolev et al., 2011). All these molecules specifically suppress
the IN ST reaction. We conceive that the future HIV-1 integrase drug development will be
mainly oriented to the design of inhibitors with a mechanism of action that differs from that of
RAL and its analogues. Distinct conceptions are potentially conceivable: (i) Design of
allosteric inhibitors able to recognize specifically binding sites that differ from the IN active
site. Inhibitor V-165, belonging to such type inhibitors, prevents IN binding with the viral
DNA such blocking 3’-processing reaction (Pannecouque et al., 2002). (ii) Design of protein-
protein inhibitors (PPIs) acting on interaction interface between either viral components (the
IN monomers upon multimerization or sub-units of the IN·vDNA complex) (Mazumer et al.,
1996; Tsiang et al., 2011), or between viral and cellular proteins (IN/LEDGF) (De Luca et al.,
2010; Tsiang et al., 2012).
CONCLUSIONS
In the current paper, we report the first detailed characterisation of RAL and its putative
HIV-1 targets – the unbound IN, the viral DNA (vDNA) and IN·vDNA complex – mimicking
the integrase states before and after the 3’-processing. The structural features of RAL in three
different states evidenced the most probable inhibitor configuration/conformation in the gas
phase, in water solution and in the solid state.
The generated structural models of the HIV-1 integrase evidence considerable differences
between unbound and vDNA-bound integrases that indicate a global structural and
conformational transformation of enzyme upon substrate binding. The modifications consist
in changes first in the positions of the N- and C-terminal domains relatively to the catalytic

30
core domain, and second in the secondary structures of the inter-domains linkers and of the
catalytic site loop.
The RAL docking onto its putative HIV-1 IN targets shows a large spectrum of RAL
conformational/configurational states, which evidences the complexity inherent in deriving
affinity data of very flexible inhibitor. The docking onto the unbound IN evidenced that RAL
adopts different conformations/configurations within a large binding cavity formed by the
catalytic active site and the adjacent loop RAL. All observed RAL poses show an absence of
specific interactions with the target. The docking onto the IN·vDNA complex systematically
produced the RAL chelated to Mg2+ cations at the active site by the pharmacophores oxygen
atoms. The low docking scores, RAL poses and observed inhibitor-target interactions confirm
that the generated structure of the IN·vDNA complex is the biologically relevant target of the
inhibitor. This finding is consistent with well-documented and commonly accepted inhibition
mechanism of RAL, based on biological, biochemical and structural data. The identified RAL
pose at the cleaved vDNA shed light on a putative even plausible step of RAL inhibition
mechanism. We suggest that the inhibition process may include as a first step RAL
recognition by the processed viral DNA bound to a transient intermediate IN state. Such
statement provides a possible route to the design of IN inhibitors with improved affinity and
selectivity.

31
LIST OF ABBREVIATION USED: HIV-1, Human Immunodeficiency Virus; vDNA, viral
DNA; hDNA, host DNA; LTR, Long Terminal Repeat; IN, integrase; PFV, prototype foamy
virus; NTD, N-terminal domain; CCD, catalytic core domain; CTD, C-terminal domain; ST,
strand transfer; INSTI, integrase strand transfer inhibitor; G, T, C, A – DNA bases; RAL,
raltegravir; RMSD, root mean square deviation; PDB, Protein Data Base; CSD, Cambridge
Structural Database
COMPETING INTERESTS: The authors have declared no competing interests.
AUTHORS’ CONTRIBUTIONS: Conceived and designed the experiments: LT. Performed
the experiments: RA, ICB. Analysed data: RA, ICB, EL, JP. Wrote the paper: RA, LT.
Acknowledgements
The authors thank Tripos, Schrödinger and CSD for providing licences. This work is funded
by the Centre National de la Recherche Scientifique (CNRS) and Ecole Normale Supérieure
(ENS) de Cachan.
32
REFERENCES
Agapkina, J., Smolov, M., Barbe, S., Zubin, E., Zatsepin, T., Deprez, E., Le Bret, M., Mouscadet, J. F., & Gottikh, M. 2006. Probing of HIV-1 integrase/DNA interactions using novel analogs of viral DNA. Journal of Biological Chemistry 281, 11530-11540, doi:DOI 10.1074/jbc.M512271200.
Allen, F. H. 2002. The Cambridge Structural Database: a quarter of a million crystal structures and rising. Acta Crystallogr. B 58, 380-388.
Ammar, F. F., Abdel-Azeim, S., Zargarian, L., Hobaika, Z., Maroun, R. G., & Fermandjian, S. 2012. Unprocessed Viral DNA Could Be the Primary Target of the HIV-1 Integrase Inhibitor Raltegravir. Plos One 7, e40223, doi:10.1371/journal.pone.0040223 [doi];PONE-D-12-11847 [pii].
Arora R., Tchertanov L. 2012. The HIV-1 Integrase: Modeling and Beyond. In An Integrated
View of the Molecular Recognition and Toxinology - From Analytical Procedures to
Biomedical Applications. Dejan Grgur (Ed.). INTECH. ISBN 980-953-307-586-5. In
press Asante-Appiah, E. & Skalka, A. M. 1997. Molecular mechanisms in retrovirus DNA
integration. Antiviral Research 36, 139-156. Barnett, C. M. 2012. Everolimus: targeted therapy on the horizon for the treatment of breast
cancer. Pharmacotherapy 32, 383-396, doi:10.1002/j.1875-9114.2012.01084.x [doi]. Barreca, M. L., Iraci, N., De Luca, L., & Chimirri, A. 2009. Induced-Fit Docking Approach
Provides Insight into the Binding Mode and Mechanism of Action of HIV-1 Integrase Inhibitors. ChemMedChem 4, 1446-1456, doi:DOI 10.1002/cmdc.200900166.
Berendsen, H. J. C., Postma, J. P. M., Vangunsteren, W. F., Dinola, A., & Haak, J. R. 1984. Molecular-Dynamics with Coupling to An External Bath. Journal of Chemical Physics 81, 3684-3690.
Berman, H. M., Westbrook, J., Feng, Z., Gilliland, G., Bhat, T. N., Weissig, H., Shindyalov, I. N., & Bourne, P. E. 2000. The Protein Data Bank. Nucleic Acids Research 28, 235-242.
Brown, P. O. 1990. Integration of Retroviral DNA. Current Topics in Microbiology and
Immunology. 15, 19-48. Bruno, I. J., Cole, J. C., Lommerse, J. P. M., Rowland, R. S., Taylor, R., & Verdonk, M. L.
1997. IsoStar: A library of information about nonbonded interactions. Journal of
Computer-Aided Molecular Design 11, 525-537. Chen, J. C. H., Krucinski, J., Miercke, L. J. W., Finer-Moore, J. S., Tang, A. H., Leavitt, A.
D., & Stroud, R. M. 2000. Crystal structure of the HIV-1 integrase catalytic core and C-terminal domains: A model for viral DNA binding. Proceedings of the National
Academy of Sciences of the United States of America 97, 8233-8238. Chiu, T. K. & Davies, D. R. 2004. Structure and function of HIV-1 integrase. Current Topics
in Medicinal Chemistry 4, 965-977. Cooper, D. A., Steigbigel, R. T., Gatell, J. M., Rockstroh, J. K., Katlama, C., Yeni, P.,
Lazzarin, A., Clotet, B., Kumar, P. N., Eron, J. E., Schechter, M., Markowitz, M., Loutfy, M. R., Lennox, J. L., Zhao, J., Chen, J., Ryan, D. M., Rhodes, R. R., Killar, J. A., Gilde, L. R., Strohmaier, K. M., Meibohm, A. R., Miller, M. D., Hazuda, D. J., Nessly, M. L., DiNubile, M. J., Isaacs, R. D., Teppler, H., & Nguyen, B. Y. 2008. Subgroup and resistance analyses of raltegravir for resistant HIV-1 infection. New
England Journal of Medicine 359, 355-365. Copeland, R. A., Pompliano, D. L., & Meek, T. D. 2006. Drug-target residence time and its
implications for lead optimization. Nat. Rev. Drug Discov. 5, 730-739, doi:nrd2082 [pii];10.1038/nrd2082 [doi].
33
Cotelle, P. 2006. Patented HIV-1 integrase inhibitors (1998-2005). Recent Pat Antiinfect.
Drug Discov. 1, 1-15. CSD. 1994. Vista - A Program for the Analysis and Display of Data Retrieved from the CSD.
Cambridge Crystallographic Data Centre, 12 Union Road, Cambridge, England. Cuff, J. A., Clamp, M. E., Siddiqui, A. S., Finlay, M., & Barton, G. J. 1998. JPred: a
consensus secondary structure prediction server. Bioinformatics 14, 892-893. Delano, W. L. 2002. The PYMOL molecular graphics system. Delelis, O., Malet, I., Na, L., Tchertanov, L., Calvez, V., Marcelin, A. G., Subra, F., Deprez,
E., & Mouscadet, J. F. 2009. The G140S mutation in HIV integrases from raltegravir-resistant patients rescues catalytic defect due to the resistance Q148H mutation. Nucleic
Acids Research 37, 1193-1201, doi:DOI 10.1093/nar/gkn1050. Delelis, O., Thierry, S., Subra, F., Simon, F., Malet, I., Alloui, C., Sayon, S., Calvez, V.,
Deprez, E., Marcelin, A. G., Tchertanov, L., & Mouscadet, J. F. 2010. Impact of Y143 HIV-1 Integrase Mutations on Resistance to Raltegravir In Vitro and In Vivo. Antimicrobial Agents and Chemotherapy 54, 491-501, doi:DOI 10.1128/AAC.01075-09.
De Luca, L., Ferro, S, Gitto, R., Barreca, M. L., Agnello, S., Christ, F., Debyser, Z.,
Chimirri, A. 2010. Small molecules targeting the interaction between HIV-1 integrase and LEDGF/p75 cofactor. Bioorg. Med. Chem. 18(21), 7515-7521.
Dhaked, D. K., Verma, J., Saran, A., & Coutinho, E. C. 2009. Exploring the binding of HIV-1 integrase inhibitors by comparative residue interaction analysis (CoRIA). Journal of
Molecular Modeling 15, 233-245, doi:DOI 10.1007/s00894-008-0399-4. Dicker, I. B., Samanta, H. K., Li, Z. F., Hong, Y., Tian, Y., Banville, J., Remillard, R. R.,
Walker, M. A., Langley, D. R., & Krystal, M. 2007. Changes to the HIV long terminal repeat and to HIV integrase differentially impact HIV integrase assembly, activity, and the binding of strand transfer inhibitors. Journal of Biological Chemistry 282, 31186-31196, doi:DOI 10.1074/jbc.M704935200.
Dicker, I. B., Terry, B., Lin, Z., Li, Z., Bollini, S., Samanta, H. K., Gali, V., Walker, M. A., & Krystal, M. R. 2008. Biochemical analysis of HIV-1 integrase variants resistant to strand transfer inhibitors. J. Biol. Chem. 283, 23599-23609, doi:M804213200 [pii];10.1074/jbc.M804213200 [doi].
Dolan, J., Chen, A. P., Weber, I. T., Harrison, R. W., & Leis, J. 2009. Defining the DNA Substrate Binding Sites on HIV-1 Integrase. Journal of Molecular Biology 385, 568-579, doi:DOI 10.1016/j.jmb.2008.10.083.
Espeseth, A. S., Felock, P., Wolfe, A., Witmer, M., Grobler, J., Anthony, N., Egbertson, M., Melamed, J. Y., Young, S., Hamill, T., Cole, J. L., & Hazuda, D. J. 2000. HIV-1 integrase inhibitors that compete with the target DNA substrate define a unique strand transfer conformation for integrase. Proceedings of the National Academy of Sciences of
the United States of America 97, 11244-11249. Esposito, D. & Craigie, R. 1998. Sequence specificity of viral end DNA binding by HIV-1
integrase reveals critical regions for protein-DNA interaction. EMBO Journal 17, 5832-5843.
Eswar, N., John, B., Mirkovic, N., Fiser, A., Ilyin, V. A., Pieper, U., Stuart, A. C., Marti-Renom, M. A., Madhusudhan, M. S., Yerkovich, B., & Sali, A. 2003. Tools for comparative protein structure modeling and analysis. Nucleic Acids Research 31, 3375-3380, doi:DOI 10.1093/nar/gkg543.
Faure, A., Calmels, C., Desjobert, C., Castroviejo, M., Caumont-Sarcos, A., Tarrago-Litvak, L., Litvak, S., & Parissi, V. 2005. HIV-1 integrase crosslinked oligomers are active in vitro. Nucleic Acids Research 33, 977-986, doi:DOI 10.1093/nar/gki241.
34
Fedorov, D. G., Koseki, S., Schmidt M. W., Gordon, M.S. 2003. Spin-orbit coupling in molecules: chemistry beyond the adiabatic approximation. Int. Rev. Phys. Chem. 22, 551-592.
Feng, M., Patel, D., Dervan, J. J., Ceska, T., Suck, D., Haq, I., & Sayers, J. R. 2004. Roles of divalent metal ions in flap endonuclease-substrate interactions. Nature Structural &
Molecular Biology 11, 450-456, doi:10.1038/nsmb754. Friesner, R.A. 1987. Solution of the Hartree-Fock equations for polyatomic molecules by a
pseudospectral method. Journal of Chemical Physics 86, 3522-3531. Friesner, R. A., Banks, J. L., Murphy, R. B., Halgren, T. A., Klicic, J. J., Mainz, D. T.,
Repasky, M. P., Knoll, E. H., Shelley, M., Perry, J. K., Shaw, D. E., Francis, P., & Shenkin, P. S. 2004. Glide: A new approach for rapid, accurate docking and scoring. 1. Method and assessment of docking accuracy. Journal of Medicinal Chemistry 47, 1739-1749, doi:DOI 10.1021/jm0306430.
Frishman, D. & Argos, P. 1995. Knowledge-based protein secondary structure assignment. Proteins-Structure Function and Genetics 23, 566-579.
Gao, K., Wong, S., & Bushman, F. 2004. Metal binding by the D,DX35E motif of human immunodeficiency virus type I integrase: Selective rescue of Cys substitutions by Mn-2 in vitro. Journal of Virology 78, 6715-6722, doi:DOI 10.1128/JVI.78.13.6715-6722.2004.
Garnier, J., Gibrat, J. F., & Robson, B. 1996. GOR method for predicting protein secondary structure from amino acid sequence. Computer Methods for Macromolecular Sequence
Analysis 266, 540-553. Garvey, E. P., Schwartz, B., Gartland, M. J., Lang, S., Halsey, W., Sathe, G., Carter, H. L.,
III, & Weaver, K. L. 2009. Potent inhibitors of HIV-1 integrase display a two-step, slow-binding inhibition mechanism which is absent in a drug-resistant T66I/M154I mutant. Biochemistry 48, 1644-1653, doi:10.1021/bi802141y [doi];10.1021/bi802141y [pii].
Greenwald, J., Le, V., Butler, S. L., Bushman, F. D., & Choe, S. 1999. The mobility of an HIV-1 integrase active site loop is correlated with catalytic activity. Biochemistry 38, 8892-8898.
Grobler, J. A., Stillmock, K., Hu, B., Witmer, M., Felock, P., Espeseth, A. S., Wolfe, A., Egbertson, M., Bourgeois, M., Melamed, J., Wai, J. S., Young, S., Vacca, J., & Hazuda, D. J. 2002. Diketo acid inhibitor mechanism and HIV-1 integrase: implications for metal binding in the active site of phosphotransferase enzymes. Proc. Natl. Acad. Sci.
U. S A 99, 6661-6666, doi:10.1073/pnas.092056199 [doi];092056199 [pii]. Guermeur, Y., Geourjon, C., Gallinari, P., & Deleage, G. 1999. Improved performance in
protein secondary structure prediction by inhomogeneous score combination. Bioinformatics 15, 413-421.
Guiot, E., Carayon, K., Delelis, O., Simon, F., Tauc, P., Zubin, E., Gottikh, M., Mouscadet, J. F., Brochon, J. C., & Deprez, E. 2006. Relationship between the oligomeric status of HIV-1 integrase on DNA and enzymatic activity. Journal of Biological Chemistry 281, 22707-22719, doi:DOI 10.1074/jbc.M602198200.
Hare, S., Gupta, S. S., Valkov, E., Engelman, A., & Cherepanov, P. 2010a. Retroviral intasome assembly and inhibition of DNA strand transfer. Nature 464, 232-236, doi:DOI 10.1038/nature08784.
Hare, S., Vos, A. M., Clayton, R. F., Thuring, J. W., Cummings, M. D., & Cherepanov, P. 2010b. Molecular mechanisms of retroviral integrase inhibition and the evolution of viral resistance. Proceedings of the National Academy of Sciences of the United States
of America 107, 20057-20062, doi:DOI 10.1073/pnas.1010246107.

35
Hayouka, Z., Rosenbluh, J., Levin, A., Loya, S., Lebendiker, M., Veprintsev, D., Kotler, M., Hizi, A., Loyter, A., & Friedler, A. 2007. Inhibiting HIV-1 integrase by shifting its oligomerization equilibrium. Proceedings of the National Academy of Sciences of the
United States of America 104, 8316-8321, doi:DOI 10.1073/pnas.0700781104. Hazuda, D. J., Felock, P., Witmer, M., Wolfe, A., Stillmock, K., Grobler, J. A., Espeseth, A.,
Gabryelski, L., Schleif, W., Blau, C., & Miller, M. D. 2000. Inhibitors of strand transfer that prevent integration and inhibit HIV-1 replication in cells. Science 287, 646-650.
Hightower, K. E., Wang, R., Deanda, F., Johns, B. A., Weaver, K., Shen, Y., Tomberlin, G. H., Carter, H. L., III, Broderick, T., Sigethy, S., Seki, T., Kobayashi, M., & Underwood, M. R. 2011. Dolutegravir (S/GSK1349572) exhibits significantly slower dissociation than raltegravir and elvitegravir from wild-type and integrase inhibitor-resistant HIV-1 integrase-DNA complexes. Antimicrob. Agents Chemother. 55, 4552-4559, doi:AAC.00157-11 [pii];10.1128/AAC.00157-11 [doi].
Humphrey, G. R., Pye, P. J., Zhong, Y. L., Angelaud, R., Askin, D., Belyk, K. M., Maligres, P. E., Mancheno, D. E., Miller, R. A., Reamer, R. A., & Weissman, S. A. 2011. Development of a Second-Generation, Highly Efficient Manufacturing Route for the HIV Integrase Inhibitor Raltegravir Potassium. Organic Process Research &
Development 15, 73-83, doi:10.1021/op100257r. Jain, A. N. 2003. Surflex: Fully automatic flexible molecular docking using a molecular
similarity-based search engine. Journal of Medicinal Chemistry 46, 499-511, doi:DOI 10.1021/jm.020406h.
Johnson, A. A., Marchand, C., Patil, S. S., Costi, R., Di Santo, R., Burke, T. R., & Pommier, Y. 2007. Probing HIV-1 integrase inhibitor binding sites with position-specific integrase-DNA cross-linking assays. Molecular Pharmacology 71, 893-901, doi:DOI 10.1124/mol.106.030817.
Johnson, A. A., Santos, W., Pais, G. C. G., Marchand, C., Amin, R., Burke, T. R., Verdine, G., & Pommier, Y. 2006. Integration requires a specific interaction of the donor DNA terminal 5 '-cytosine with glutamine 148 of the HIV-1 integrase flexible loop. Journal
of Biological Chemistry 281, 461-467. Johnson, L. N. 2009. Protein kinase inhibitors: contributions from structure to clinical
compounds. Q. Rev. Biophys. 42, 1-40, doi:S0033583508004745. Kabsch, W. & Sander, C. 1983. Dictionary of Protein Secondary Structure - Pattern-
Recognition of Hydrogen-Bonded and Geometrical Features. Biopolymers 22, 2577-2637.
Kawasuji, T., Fuji, M., Yoshinaga, T., Sato, A., Fujiwara, T., & Kiyama, R. 2006. A platform for designing HIV integrase inhibitors. Part 2: A two-metal binding model as a potential mechanism of HIV integrase inhibitors. Bioorganic & Medicinal Chemistry 14, 8420-8429, doi:DOI 10.1016/j.bmc.2006.08.043.
King, R. D., Saqi, M., Sayle, R., & Sternberg, M. J. E. 1997. DSC: public domain protein secondary structure prediction. Computer Applications in the Biosciences 13, 473-474.
Krovat, E. M., Steindl, T., & Langer, T. 2005. Recent Advances in Docking and Scoring. Current Computer-Aided Drug Design 1, 93-102.
Korolev S, Agapkina Yu, Gottikh M. 2011. Clinical Use of Inhibitors of HIV-1 Integration: Problems and Prospects. Acta Naturae, 3,12-28.
Langley, D. R., Samanta, H. K., Lin, Z., Walker, M. A., Krystal, M. R., & Dicker, I. B. 2008. The terminal (catalytic) adenosine of the HIV LTR controls the kinetics of binding and dissociation of HIV integrase strand transfer inhibitors. Biochemistry 47, 13481-13488, doi:10.1021/bi801372d [doi].
Larkin, M. A., Blackshields, G., Brown, N. P., Chenna, R., McGettigan, P. A., McWilliam, H., Valentin, F., Wallace, I. M., Wilm, A., Lopez, R., Thompson, J. D., Gibson, T. J., &
36
Higgins, D. G. 2007. Clustal W and clustal X version 2.0. Bioinformatics 23, 2947-2948, doi:DOI 10.1093/bioinformatics/btm404.
Laskowski, R. A., Macarthur, M. W., Moss, D. S., & Thornton, J. M. (1993). Procheck - A Program to Check the Stereochemical Quality of Protein Structures. Journal of Applied
Crystallography 26, 283-291. Levin, J. M. 1997. Exploring the limits of nearest neighbour secondary structure prediction.
Protein Engineering 10, 771-776. Li, M., Mizuuchi, M., Burke, T. R., & Craigie, R. 2006. Retroviral DNA integration: reaction
pathway and critical intermediates. Embo Journal 25, 1295-1304, doi:DOI 10.1038/sj.emboj.7601005.
Loizidou, E. Z., Zeinalipour-Yazdi, C. D., Christofides, T., & Kostrikis, L. G. 2009. Analysis of binding parameters of HIV-1 integrase inhibitors: Correlates of drug inhibition and resistance. Bioorganic & Medicinal Chemistry 17, 4806-4818, doi:DOI 10.1016/j.bmc.2009.04.058.
Macrae, C. F., Edgington, P. R., McCabe, P., Pidcock, E., Shields, G. P., Taylor, R., Towler, M., & van de Streek, J. 2006. Mercury: visualization and analysis of crystal structures. Journal of Applied Crystallography 39, 453-457, doi:10.1107/S002188980600731X.
Maignan, S., Guilloteau, J. P., Zhou-Liu, Q., Clement-Mella, C., & Mikol, V. 1998. Crystal structures of the catalytic domain of HIV-1 integrase free and complexed with its metal cofactor: High level of similarity of the active site with other viral integrases. Journal of
Molecular Biology 282, 359-368. Marchand, C., Maddali, K., Metifiot, M., & Pommier, Y. 2009. HIV-1 IN Inhibitors: 2010
Update and Perspectives. Current Topics in Medicinal Chemistry 9, 1016-1037. Markowitz, M., Morales-Ramirez, J. O., Nguyen, B. Y., Kovacs, C. M., Steigbigel, R. T.,
Cooper, D. A., Liporace, R., Schwartz, R., Isaacs, R., Gilde, L. R., Wenning, L., Zhao, J., & Teppler, H. 2006. Antiretroviral activity, pharmacokinetics, and tolerability of MK-0518, a novel inhibitor of HIV-1 integrase, dosed as monotherapy for 10 days in treatment-naive HIV-1-infected individuals. J. Acquir. Immune Defic. Syndr. 43, 509-515, doi:10.1097/QAI.0b013e31802b4956 [doi];00126334-200612150-00002 [pii].
Martonak, R., Laio, A., & Parrinello, M. 2003. Predicting crystal structures: the Parrinello-Rahman method revisited. Phys. Rev. Lett. 90, 075503.
Mazumder, A., Wang, S., Neamati, N., Nicklaus, M., Sunder, S., Chen, J., Milne, G. W., Rice, W. G., Burke, T. R. Jr, Pommier, Y. 1996. Antiretroviral agents as inhibitors of both human immunodeficiency virus type 1 integrase and protease. J. Med. Chem. 39(13), 2472-2481.
McGuffin, L. J., Bryson, K., & Jones, D. T. 2000. The PSIPRED protein structure prediction server. Bioinformatics 16, 404-405.
Morris, G. M., Huey, R., Lindstrom, W., Sanner, M. F., Belew, R. K., Goodsell, D. S., & Olson, A. J. 2009. AutoDock4 and AutoDockTools4: Automated Docking with Selective Receptor Flexibility. Journal of Computational Chemistry 30, 2785-2791, doi:DOI 10.1002/jcc.21256.
Mouscadet, J. F., Arora, R., Andre, J., Lambry, J. C., Delelis, O., Malet, I., Marcelin, A. G., Calvez, V., & Tchertanov, L. 2009. HIV-1 IN alternative molecular recognition of DNA induced by raltegravir resistance mutations. Journal of Molecular Recognition 22, 480-494, doi:DOI 10.1002/jmr.970.
Mouscadet, J. F., Delelis, O., Marcelin, A. G., & Tchertanov, L. 2010. Resistance to HIV-1 integrase inhibitors: A structural perspective. Drug Resist. Updat. 13, 139-150, doi:S1368-7646(10)00021-X [pii];10.1016/j.drup.2010.05.001 [doi].
Mouscadet, J. F. & Tchertanov, L. 2009. Raltegravir: molecular basis of its mechanism of action. Eur. J. Med. Res. 14 Suppl 3, 5-16.
37
Neamati, N., Lin, Z. W., Karki, R. G., Orr, A., Cowansage, M., Strumberg, D., Pais, G. C. G., Voigt, J. H., Nicklaus, M. C., Winslow, H. E., Zhao, H., Turpin, J. A., Yi, J. Z., Skalka, A. M., Burke, T. R., & Pommier, Y. 2002. Metal-dependent inhibition of HIV-1 integrase. Journal of Medicinal Chemistry 45, 5661-5670, doi:10.1021/jm0201417.
Nebel, D. 2012. Functional importance of estrogen receptors in the periodontium. Swed. Dent.
J. Suppl 11-66. Ni, X., Abdel-Azeim, S., Laine, E., Arora, R., Osemwota, O., Marcelin, A.-G., Calvez, V.,
Mouscadet, J.-F., & Tchertanov, L. 2012. In silico and in vitro Comparison of HIV-1 Subtypes B and CRF02_AG Integrases Susceptibility to Integrase Strand Transfer Inhibitors. Advances in Virology. Volume 2012, Article ID 548657, 13 pages ; doi:10.1155/2012/548657
Pandey, K. K., Bera, S., Zahm, J., Vora, A., Stillmock, K., Hazuda, D., & Grandgenett, D. P. 2007. Inhibition of human immunodeficiency virus type I concerted integration by strand transfer inhibitors which recognize a transient structural intermediate. Journal of
Virology 81, 12189-12199, doi:DOI 10.1128/JVI.02863-06. Pannecouque, C., Pluymers, W., Van Maele, B., Tetz, V., Cherepanov, P., De Clercq, E.,
Witvrouw, M. and Debyser, Z. 2002. New class of HIV integrase inhibitors that block viral replication in cell culture. Curr. Biol. 12(14), 1169-1177.
Perryman, A. L., Forli, S., Morris, G. M., Burt, C., Cheng, Y. H., Palmer, M. J., Whitby, K., McCammon, J. A., Phillips, C., & Olson, A. J. 2010. A Dynamic Model of HIV Integrase Inhibition and Drug Resistance. Journal of Molecular Biology 397, 600-615, doi:10.1016/j.jmb.2010.01.033.
Pettersen, E. F., Goddard, T. D., Huang, C. C., Couch, G. S., Greenblatt, D. M., Meng, E. C., & Ferrin, T. E. 2004. UCSF Chimera ‒ a visualization system for exploratory research and analysis. J. Comput. Chem. 25, 1605-1612, doi:10.1002/jcc.20084 [doi].
Pollastri, G., Przybylski, D., Rost, B., & Baldi, P. 2002. Improving the prediction of protein secondary structure in three and eight classes using recurrent neural networks and profiles. Proteins-Structure Function and Genetics 47, 228-235, doi:10.1002/prot.10082.
Pommier, Y., Johnson, A. A., & Marchand, C. 2005. Integrase inhibitors to treat HIV/AIDS. Nature Reviews Drug Discovery 4, 236-248, doi:DOI 10.1038/nrd1660.
Raghava, G. P. S. 2002. APSSP2 : A combination method for protein secondary structure prediction based on neural network and example based learning. CASP5. A-132.
Rost, B., Sander, C., & Schneider, R. 1994. Phd - An Automatic Mail Server for Protein Secondary Structure Prediction. Computer Applications in the Biosciences 10, 53-60.
Schiavoni, M. M., Di Loreto, H. E., Hermann, A., Mack, H. G., Ulic, S. E., Della Vedova, C. O. 2001. Keto-enol tautomerism in beta-ketoesters: CH3C(O)CHXC(O)OY (X = H, Cl; Y =CH3, C2H5). Vibrational analyses, NMR spectra and quantum chemical calculations. J. Raman Sp., 32(5), 319-329.
Schrödinger, L. 2007. Jagaur, Version 7.0. Semenova, E. A., Marchand, C., & Pommier, Y. 2008. HIV-1 integrase inhibitors: update and
perspectives. Adv. Pharmacol. 56, 199-228, doi:S1054-3589(07)56007-2 [pii];10.1016/S1054-3589(07)56007-2 [doi].
Serrao, E., Odde, S., Ramkumar, K., & Neamati, N. 2009. Raltegravir, elvitegravir, and metoogravir: the birth of "me-too" HIV-1 integrase inhibitors. Retrovirology 6, 25, doi:1742-4690-6-25 [pii];10.1186/1742-4690-6-25 [doi].
Sherman, P. A., Dickson, M. L., & Fyfe, J. A. 1992. Human immunodeficiency virus type 1 integration protein: DNA sequence requirements for cleaving and joining reactions. J.
Virol. 66, 3593-3601.

38
Sichtig, N., Sierra, S., Kaiser, R., Daumer, M., Reuter, S., Schulter, E., Altmann, A., Fatkenheuer, G., Dittmer, U., Pfister, H., & Esser, S. 2009. Evolution of raltegravir resistance during therapy. Journal of Antimicrobial Chemotherapy 64, 25-32, doi:DOI 10.1093/jac/dkp153.
Steigbigel, R. T., Cooper, D. A., Kumar, P. N., Eron, J. E., Schechter, M., Markowitz, M., Loutfy, M. R., Lennox, J. L., Gatell, J. M., Rockstroh, J. K., Katlama, C., Yeni, P., Lazzarin, A., Clotet, B., Zhao, J., Chen, J., Ryan, D. M., Rhodes, R. R., Killar, J. A., Gilde, L. R., Strohmaier, K. M., Meibohm, A. R., Miller, M. D., Hazuda, D. J., Nessly, M. L., DiNubile, M. J., Isaacs, R. D., Nguyen, B., & Teppler, H. 2008. Raltegravir with optimized background therapy for resistant HIV-1 infection. New England Journal of
Medicine 359, 339-354. Sunderland, C. J., Botta, M., Aime, S., & Raymond, K. N. 2001. 6-carboxamido-5,4-
hydroxypyrimidinones: A new class of heterocyclic ligands and their evaluation as gadolinium chelating agents. Inorganic Chemistry 40, 6746-6756, doi:10.1021/ic010313a.
Tchertanov, L. & Mouscadet, J. F. 2007. Target recognition by catechols and beta-ketoenols: Potential contribution of hydrogen bonding and Mn/Mg chelation to HIV-1 integrase inhibition. Journal of Medicinal Chemistry 50, 1133-1145, doi:DOI 10.1021/jm061375j.
Thompson, J. D., Higgins, D. G., & Gibson, T. J. 1994. Clustal-W - Improving the Sensitivity of Progressive Multiple Sequence Alignment Through Sequence Weighting, Position-Specific Gap Penalties and Weight Matrix Choice. Nucleic Acids Research 22, 4673-4680.
Thomsen, R. 2003. Flexible ligand docking using evolutionary algorithms: investigating the effects of variation operators and local search hybrids. Biosystems 72, 57-73, doi:DOI 10.1016/S0303-2647(03)00135-7.
Tripos Inc. 2009. SYBYL-X 1.1.1. Trott, O. & Olson, A. J. 2010. Software News and Update AutoDock Vina: Improving the
Speed and Accuracy of Docking with a New Scoring Function, Efficient Optimization, and Multithreading. Journal of Computational Chemistry 31, 455-461, doi:DOI 10.1002/jcc.21334.
Tsiang, M., Jones, G. S., Hung, M., Samuel, D., Novikov, N., Mukund, S., Brendza, K. M., Niedziela-Majka, A., Jin, D., Liu, X., Mitchell, M., Sakowicz, R., Geleziunas, R. 2011. Dithiothreitol causes HIV-1 integrase dimer dissociation while agents interacting with the integrase dimer interface promote dimer formation. Biochemistry. 50(10), 1567-1681.
Tsiang, M., Jones, G. S., Niedziela-Majka, A., Kan, E., Lansdon, E. B., Huang, W., Hung, M., Samuel, D., Novikov, N., Xu, Y., Mitchell, M., Guo, H., Babaoglu, K., Liu, X., Geleziunas, R., Sakowicz, R. 2012. New Class of HIV-1 Integrase (IN) Inhibitors with a Dual Mode of Action. Biol Chem. 287(25), 21189-11203.
Valkov, E., Gupta, S. S., Hare, S., Helander, A., Roversi, P., McClure, M., & Cherepanov, P. 2009. Functional and structural characterization of the integrase from the prototype foamy virus. Nucleic Acids Res. 37, 243-255, doi:gkn938 [pii];10.1093/nar/gkn938 [doi].
van der Spoel, D., Lindahl, E., Hess, B., Groenhof, G., Mark, A. E., & Berendsen, H. J. 2005. GROMACS: fast, flexible, and free. J. Comput. Chem. 26, 1701-1718, doi:10.1002/jcc.20291 [doi].
Van Dijk, D. M., Bonvin, A. M. 2009. 3D-DART: a DNA structure modelling server. Nucleic
Acids Res. 37, W235-W239, doi:gkp287 [pii];10.1093/nar/gkp287 [doi].
39
Wang, J. Y., Ling, H., Yang, W., & Craigie, R. 2001. Structure of a two-domain fragment of HIV-1 integrase: implications for domain organization in the intact protein. EMBO
Journal 20, 7333-7343. Wang, Y., Klock, H., Yin, H., Wolff, K., Bieza, K., Niswonger, K., Matzen, J., Gunderson,
D., Hale, J., Lesley, S., Kuhen, K., Caldwell, J., & Brinker, A. 2005. Homogeneous high-throughput screening assays for HIV-1 integrase 3 '-processing and strand transfer activities. Journal of Biomolecular Screening 10, 456-462, doi:DOI 10.1177/108705710275212.
Welch, W., Ruppert, J., & Jain, A. N. 1996. Hammerhead: Fast, fully automated docking of flexible ligands to protein binding sites. Chemistry & Biology 3, 449-462.
Xu, J. D., Whisenhunt, D. W., Veeck, A. C., Uhlir, L. C., & Raymond, K. N. 2003. Thorium(IV) complexes of bidentate hydroxypyridinonates. Inorganic Chemistry 42, 2665-2674, doi:10.1021/ic0259888.
Yin, Z. Q. & Craigie, R. 2010. Modeling the HIV-1 Intasome: A Prototype View of the Target of Integrase Inhibitors. Viruses-Basel 2, 2777-2781, doi:10.3390/v2122777.
Zhong, Y. L., Krska, S. W., Zhou, H., Reamer, R. A., Lee, J., Sun, Y. K., & Askin, D. 2009. Catalytic Asymmetric Synthesis of an HIV Integrase Inhibitor. Organic Letters 11, 369-372, doi:10.1021/ol802604v.
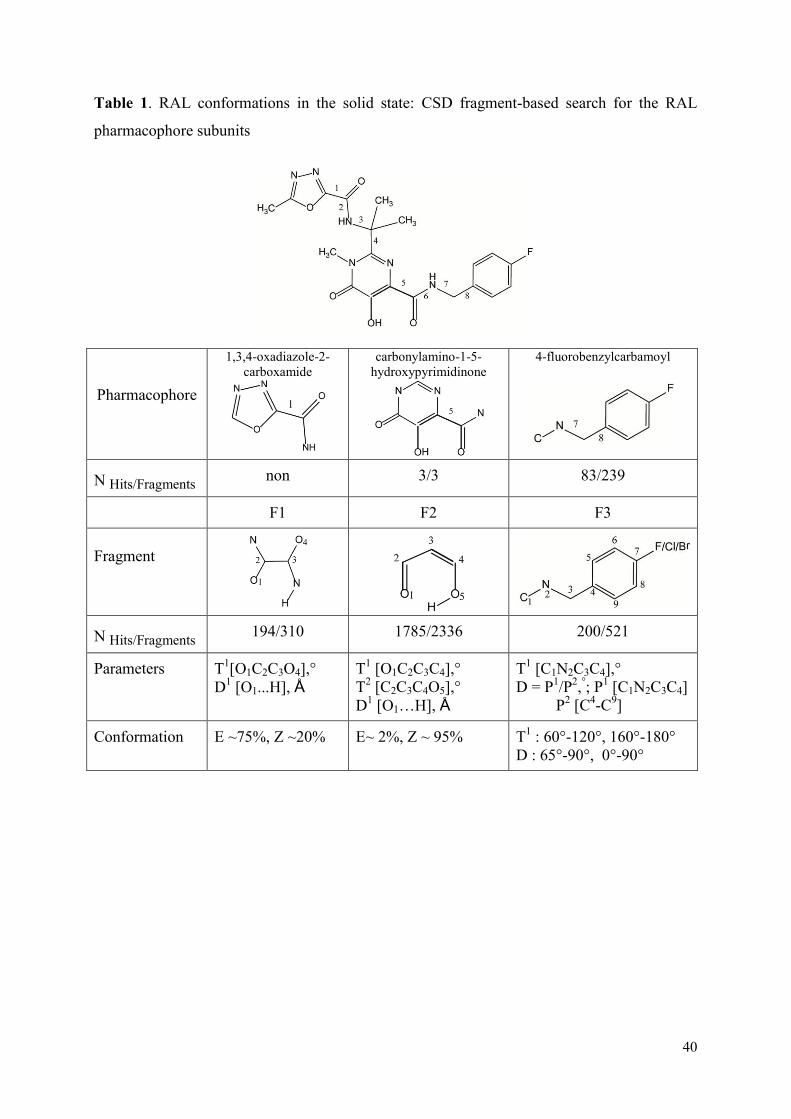
40
Table 1. RAL conformations in the solid state: CSD fragment-based search for the RAL
pharmacophore subunits
Pharmacophore
1,3,4-oxadiazole-2-carboxamide
carbonylamino-1-5-hydroxypyrimidinone
4-fluorobenzylcarbamoyl
N Hits/Fragments
non
3/3
83/239
F1
F2
F3
Fragment
N Hits/Fragments
194/310
1785/2336
200/521
Parameters
T1[O1C2C3O4],° D1 [O1...H], Å
T1 [O1C2C3C4],° T2 [C2C3C4O5],° D1 [O1…H], Å
T1 [C1N2C3C4],° D = P1/P2,°; P1 [C1N2C3C4] P2 [C4-C9]
Conformation
E ~75%, Z ~20%
E~ 2%, Z ~ 95%
T1 : 60°-120°, 160°-180° D : 65°-90°, 0°-90°

41
Table 2. Probing of the RAL coordination to Mg, Mn and K cations: CSD fragment-based
search. NTotal/NFragments represent the total number of crystal structures (hits) where the both
metal cation and ligand are present (NTotal) and the number of fragments corresponding to the
metal-ligand complexes (NFragments) ; metal-ligating atom distance (M – O/N, Å).
M/L
L1
L2
L3
L4
K
3504/36
M – O1 = 2.808 M – O2 = 2.802
452/0
2126/181
M – O1 = 2.830 M – O2 = 2.826
1338/4
M – O = 2.799 M – N = 2.957
Mg
649/74
M – O1= 2.055 M – O2= 2.063
162/26
M – O = 1.958 M – N = 2.136
80/29
M – O1 = 2.129 M – O2 = 2.104
143/14
M – O = 2.099 M – N = 2.240
Mn
2918/469
M – O1 = 2.043 M – O2 = 2.054
753/149
M – O = 1.963 M – N = 2.027
331/82
M – O1 = 2.138 M – O2 = 2.130
543/149
M – O = 2.116 M – N = 2.190

42
Legends to Figures
Figure 1. RAL conformations in the gas phase. Free energy profiles obtained by relaxed
scans around the single bonds of RAL from 0⁰ to 360⁰ with an increment step of 30⁰,
considering the four RAL isomers: (a) Z-1/Z-2, (b) Z-1/E-2, (c) E-1/Z-2 and (d) E-1/E-2. The
curves representing the rotations around torsion angles t1, t2, t3 and t4 are shown in blue,
red, green and violet colours. The values of t1, t2, t3 and t4 observed in RAL crystal
structure are indicated by asterisks.
Figure 2. MD simulations of the Z-1/Z-2 isomer of RAL. (a) The root mean square
deviations (RMSDs in nm), (b) the root mean square fluctuations (RMSFs in nm) and (c) the
normalized probability distributions of the torsion angles were calculated from MD
simulations of RAL. The 10-ns simulations replicas 1, 2 and 3 are shown by red, green and
black colours. (d) The RAL H-bonding with the solvent water molecules recorded during the
MD simulations over the 2 ns equilibration step (in black), common for all of the three
trajectories, is shown by green, blue and brown colours. The representative RAL
conformations forming the maximum and the minimum number of H-bonds are shown as the
inserts.
Figure 3. RAL conformations in the solid state. CSD fragment-based analysis of the RAL
subunits as defined in Table 1. (a) F1: Scatter plots of the absolute value of torsion angle T1
vs intermolecular distance O···H. The E- (blue triangles) and Z- (red squares) conformations
are indicated by closed symbols. Intermediate conformations are shown as hollow symbols.
(b) F2: Absolute value of torsion angle T1 vs intermolecular distance O···H. The E- (red
circles) and Z- (blue squares) conformations are indicated by closed symbols. Intermediate
conformations are shown as hollow symbols. (c) F3: Absolute value of torsion angles T1 vs
T2. The data represent F (blue circles), Cl (red squares) and Br (green triangles) substituent at
the phenyl ring. The RAL and POPYOJ crystal structure parameters are indicated by
asterisks.
Figure 4. Probing of ligand interactions with Mg, Mn and K: CSD fragment-based search
as defined in Table 2. Scatter plots of M ‒ O1 vs M ‒ O2 distances in M‒L1 (a), M‒L2 (c) and
M ‒ O vs M ‒ N distances in M‒L3 (b) and M-L4 (d) complexes. Metal complexes are

43
indicated by bull symbols: red squares (Mg), blue circles (Mn) and orange triangles (K). The
RAL crystal structure parameters are indicated by asterisks.
Figure 5. Structural models of the HIV-1 integrase. (a) Model 1A, representing the
homodimeric enzyme before the 3’-processing; (b) Model 3A, representing the simplified IN-
DNA pre-integration complex (dimeric form); (c) Superimposition of monomeric subunits
from models 1A and 2A. The proteins are shown as cartoons, Mg2+ ions as spheres (in
magenta). (d) Schematic representation of the HIV and PVF active site loop secondary
structure prediction, according to consensus 1 and consensus 2.
Figure 6. RAL ‒ Integrase binding predicted by docking. The docking of RAL generated
conformations for the Z-1/Z-2 isomer onto the unbound IN with a single Mg2+ cation within
active site (model 1A), with two Mg2+ cations within the active site (model 1B), and the
IN•vDNA complex (model 3A) are presented at the top, middle and bottom panels,
respectively. The graphs in the middle column shows the score profiles obtained by docking
with four algorithms ‒ GLIDE (in red, line 1), SurFlex (in violet, line 2), AutoDock (in blue,
line 3), and VINA (in green, line 4). Snapshots on the right and on the left show the
representative poses of RAL obtained by docking onto the targets 1A, 1B and 3A by using the
four different programs. Numeration of the scores curves and snapshots showed on the top
panel is valid for other panels. The proteins are shown as cartoons with a colour coding the
used docking program, Mg2+ ions as spheres (in yellow) and RAL as sticks.
Figure 7. RAL – viral DNA recognition. The inhibitor docked onto the viral non-cleaved (a)
and cleaved DNA (b). The vDNA is shown as cartoons; the guanine and RAL are shown as
thin lines and sticks respectively.
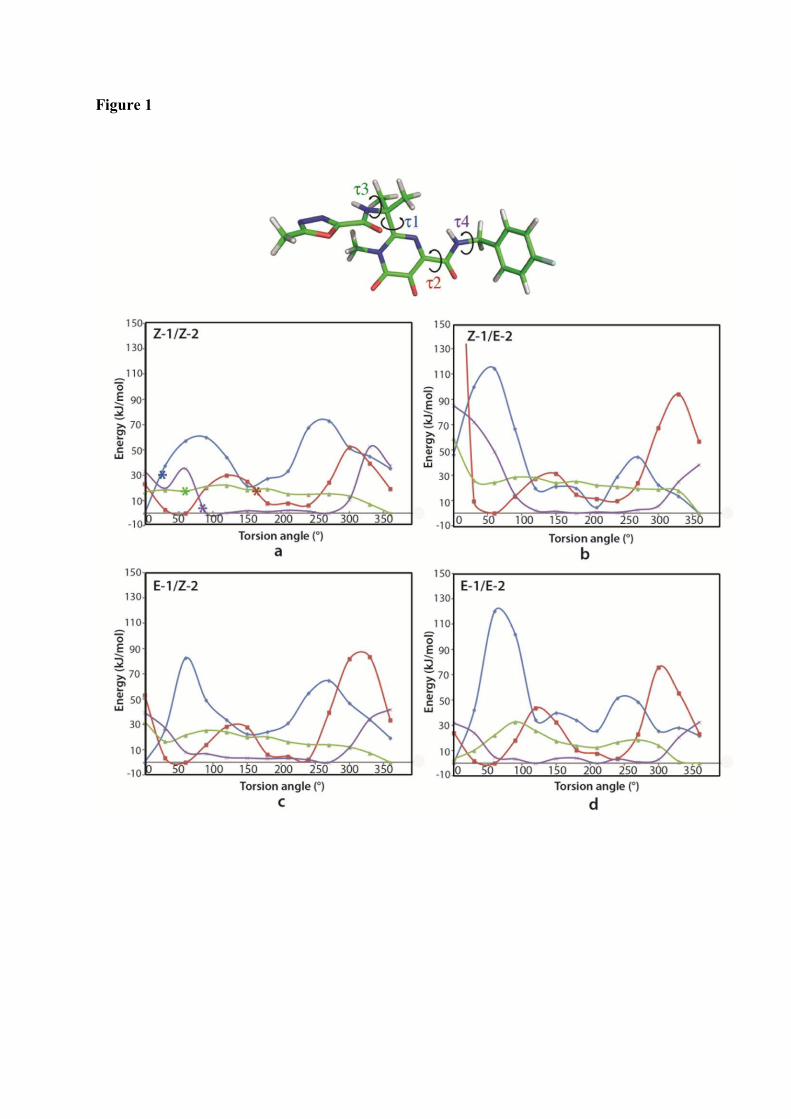
Figure 1
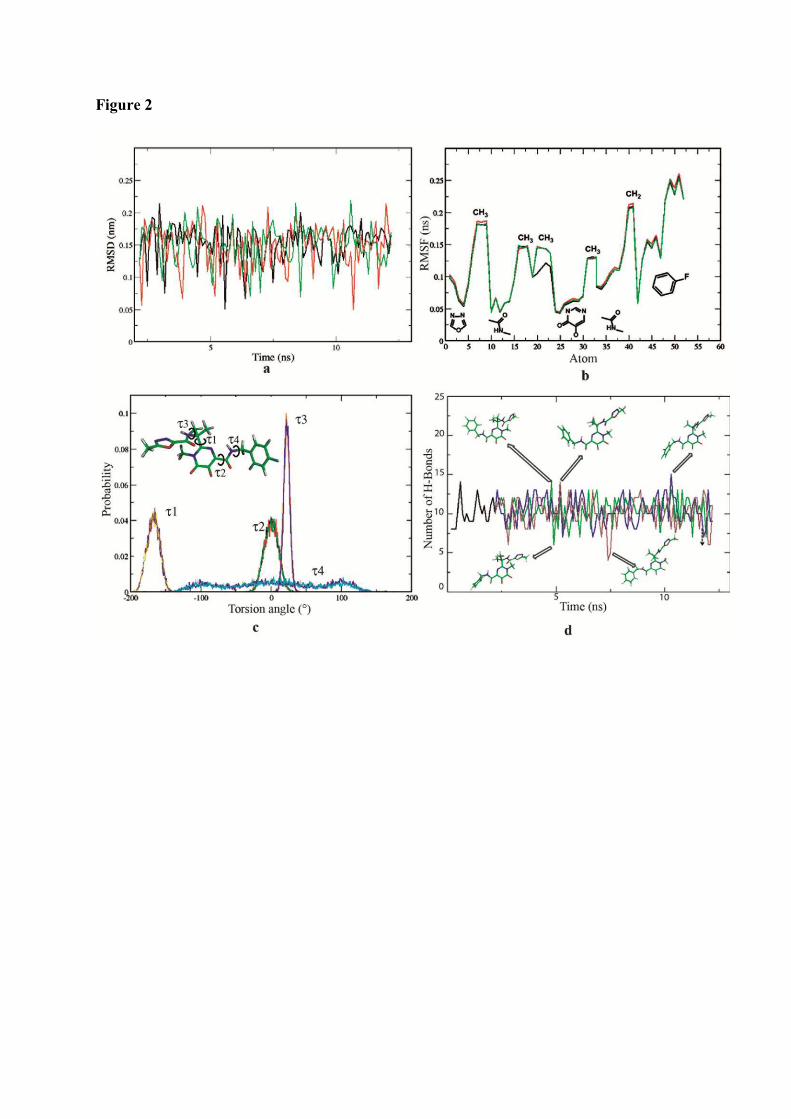
Figure 2

Figure 3
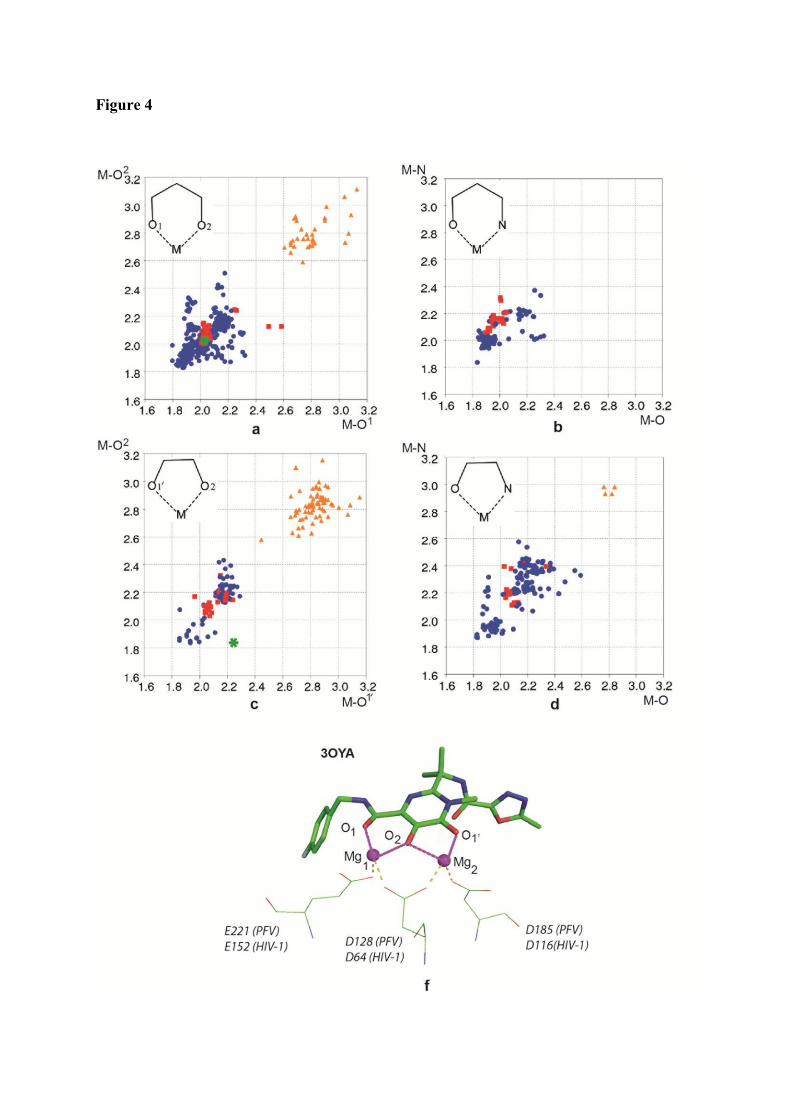
Figure 4
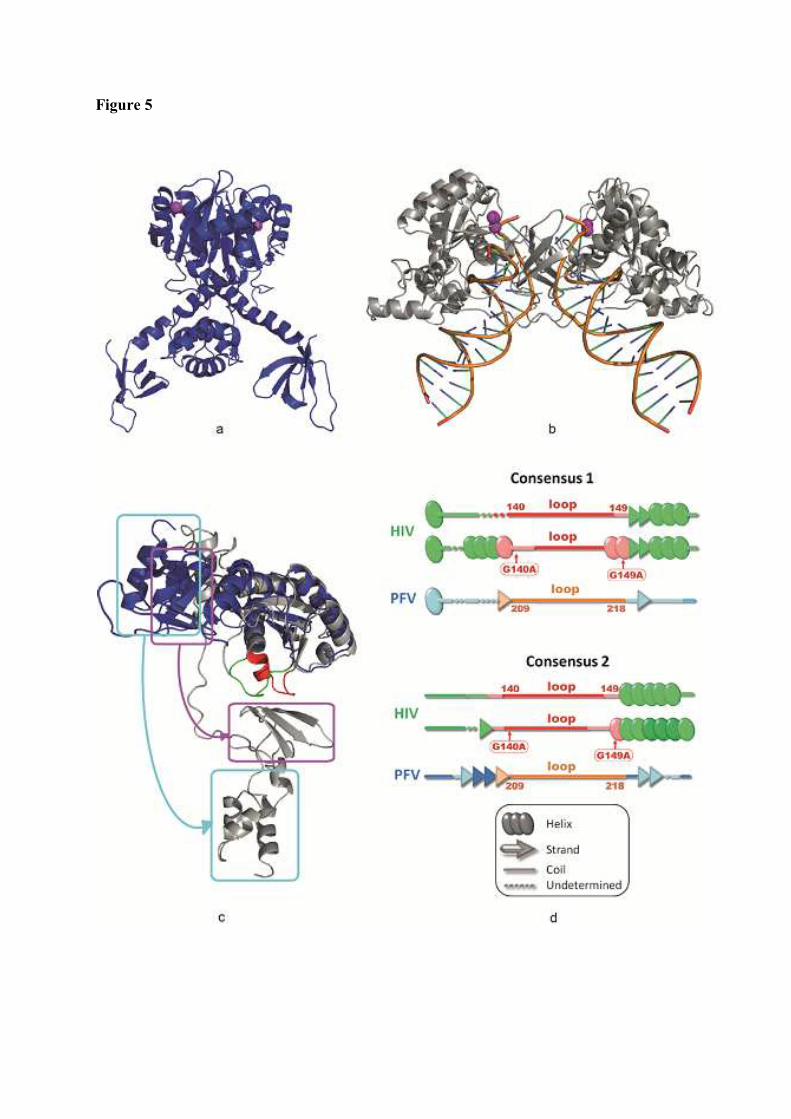
Figure 5
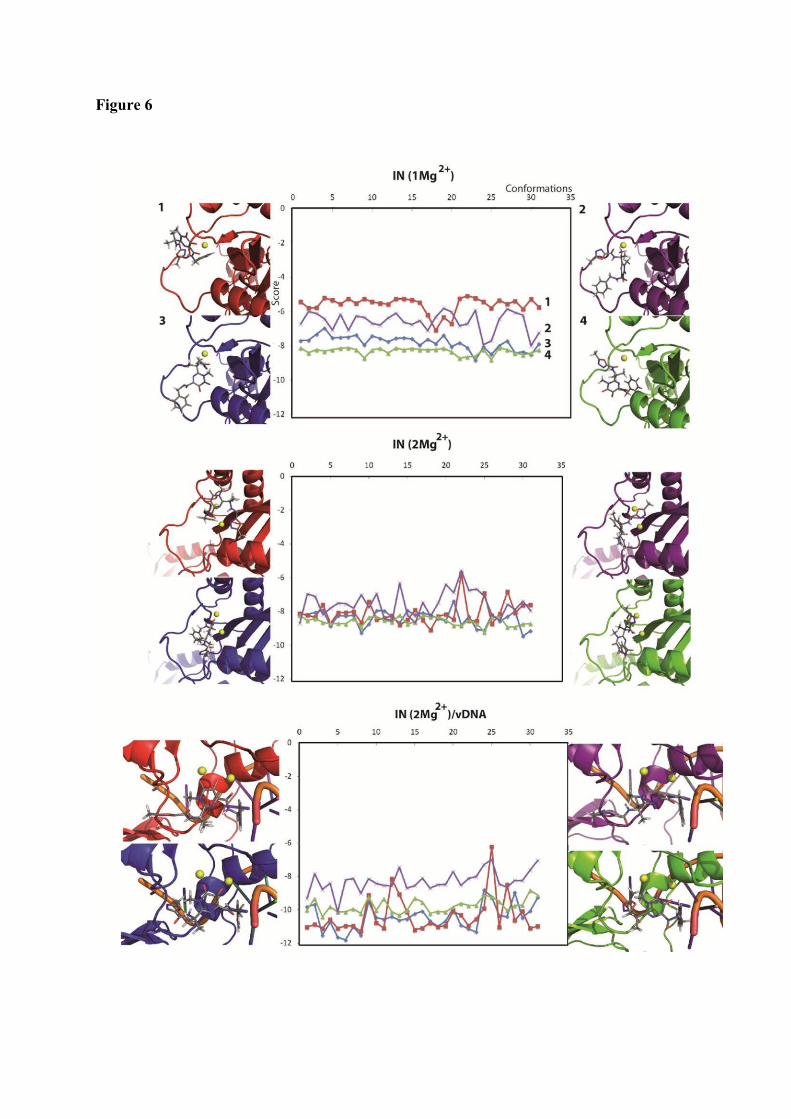
Figure 6
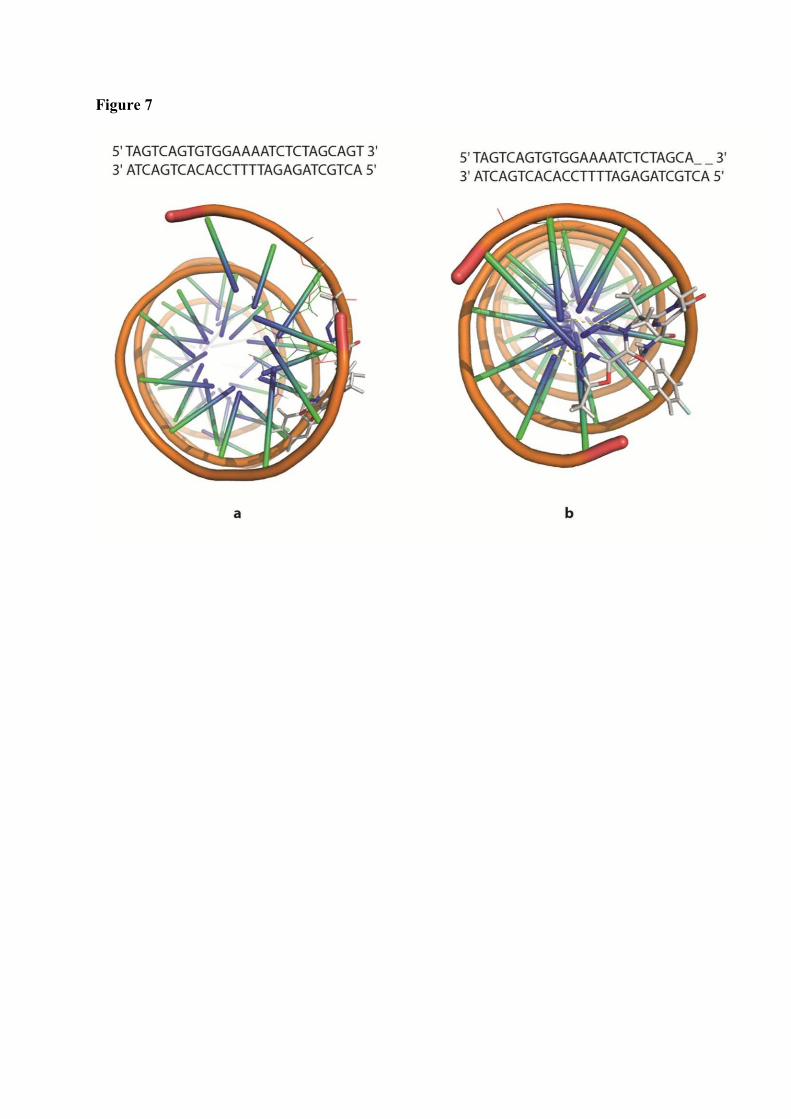
Figure 7