Embed Size (px)
Citation preview

Vol. 6 (4) : 251 - 259 (2004) - aNe ,, #
SUGARCANE BIOTECHNOLOGY
Molecular Marker Application in Sugarcane Mu-Qing Zhang, Xue-Fang Zheng, Ai-Li Yu, Jing-Sheng Xu and Hui Zhou Key Lab. of Eco-Physiology and Genetic Improvement for Sugarcane, Ministry of Agriculture, Fujian Agriculture and Forestry Univ., Fuzhou - 350 002, China
M o l e c u l a r m a r k e r s , such as RAPD, ISSR and ITS, were used to assess genet ic d ivers i ty o f Erian thus and S. spontaneum, to c lar i fy the m o l e c u l a r c las s i f i ca t ion of re la ted Saccharum spec ies and to c h a r a c t e r i z e the genu ine h y b r i d f rom Saccharum and Erianthus . The resul t s were s u m m a r i z e d in this paper.
K E Y W O R D S : Molecular marker analysis, sugarcane, genetic diversity, molecular identification of inter- generic hybrid
The use of DNA markers for the genetic analysis and manipulat ion of important agronomic traits has become an increasingly useful tool in plant breeding. DNA markers have the potent ia l to enhance the operat ion of a plant breeding programme through a number of ways, ranging f rom fingerprinting of elite gene t i c s tocks , a s s e s s i n g of gene t ic d ivers i ty , increasing the eff iciency of selection for difficult t ra i ts , to mak ing e n v i r o n m e n t - n e u t r a l se l ec t ion possible. However, their greatest potential appears to be in accelerat ing the rate of gain from selection for desirable genotypes and in the manipulat ion of quanti tat ive trait loci (QTL) that condition complex economic traits. DNA marke r s also permit plant b reede r s to co r r ec t l y map or place these QTL. Gene t i c m a p p i n g is e s sen t i a l for e f f e c t i v e manipulat ion of important genes. Effect ive use of m a r k e r - b a s e d se l ec t ion or m a r k e r - a s s i s t e d introgression should permit genetic recombinat ion beyond the range possible in traditional breeding. While the possibil i t ies appear limitless, it should be pointed out that the appl icat ion of DNA markers in sugarcane breeding is still in its infancy and in future it will become a routine operat ion in most plant breeding programmes.
At Fujian Agricultural and Forestry University, we have used molecular markers in our p rogramme to assess gene t ic d ive rs i ty of E r i a n t h u s and S. spon taneum, to clarify the molecular classification
A u t h o r for C o r r e s p o n d e n c e : M u - Q i n g Z h a n g e-mail : [email protected]; Tel. : 0591-3789177
of related Saccharum species and to character ize the real hybrid from Saccharum and Erianthus .
M A T E R I A L AND M E T H O D S
P l a n t m a t e r i a l s
Eleven clones of Saccharum and its related genera (Table I) were grown and m a i n t a i n e d in the g reenhouse at the Sugarcane Research Inst i tute , Fujian Agriculture and Forestry University. Thirty Erianthus clones from southern part of China (Table 2), nine F1 plants f rom S a c c h a r u m x Er ian thus
(YC96-45, YC95-41, YC96-69, YC96-40, YC96-41, YC96-43, YC73-557, YC96-46, and YC96-66)?36 BCI from crossing F1 hybrids YC96-66 and YC96- 46 with CP84-1198, 12 BC1 from crossing YC95- 41 with Neijian 57-416, and 15 clones that have been cons idered the hybr ids be tween S a c c h a r u m and Erianthus (Ganzhe 64-137, Ganzhe 65-542, Guitang 83-492, YC62-70, YC64-389, YC73-512, YC73-557, YC88-33 , YC90-11 , YC90-3 , YC90-31 , YC90-4 , YC92-27, YC93-25, and YC93-26) were collected f rom the Ha inan S u g a r c a n e B r e e d i n g Uni t of Guangzhou Cane and Sugar Institute.
DNA e x t r a c t i o n
Genomic DNAs were extracted according to the me thod of D e l l a p o r t a et al. (1992) . DNA concentration was determined spectrophotometr ical ly by averaging three absorbance readings at 260 nm and standardized at 50 ng//al in steeile, nanopure, double distilled H20. Genomic DNA samples were then checked by agarose gel e l e c t ropho re se s to
251

Table - 1 : Genera , species and source of tested materials
Genera Species Name Source
Saccharum S. spontaneum L. S. spontaneum
S. s inense Roxb. Songxi Zhu Zhe Bingxiang Zhu Zhe
S. barberi Jesweit
S. robustum Brandes et. Jesw. ex.
S. c~ff~cinarum L. Fujian Agri. & Forestry Uni.
Miscanthus M. f l o r idu lud Warb. Fujian Agri. & Forestry Uni.
Erianthtis E. rockii Keng Sugarcane Institute of Fujian Academy
E. arund inaceus E. arundinaceus Retz. E. arundinaceus Fujian Agric. & Forestry Univ.
Table - 2 : Names and Sources of tested E r i an t hus accessions
No. Names Sources No. Names Sources No. Names Sources
Chunee
S. robustom from Yunnan S. robustom FI S. robustom from Fujian
Badila
Miscanthus f lor idu lus
Erianthus rockii
Fujian Agri. and Forestry Uni.
Sugarcane Institute of Yunnan Agric. Academy
Sugarcane Institute of Yunnan Agricultural Academy
Sugarcane Institute of Yunnan Agricultural Academy Fujian Agri. & Forestry Uni.
Agri.
1 Jiangxi 79-29 Jiangxi 11 Sichuan 79-I-22 Sichuan 21 Jiangxi 91-4 Jiangxi
2 Guizhou 78-I-8 Guizhou 12 Fujian 79-I-1 Fujian 22 Yunnan 76-I-013 Yunnan
3 Dehong 2 Yunnan 13 Yacheng 3 Hainan 23 Hainan 92-79 Hainan
4 Baishabodabaicao Hainan 14 Guizhou 78-11-06 Guizhou 24 Hainan 92-109 Hainan
5 Yunnan 76-I1-10 Yunnan 15 Sichuan 79-I-29 Sichuan 25 Hainan 92-102 Hainan
6 Sichuan 79-1-9 Sichun 16 Guangdong 15 Guangdong 26 Hainan 92-105 Hainan
7 Yacheng 2 Hainan 17 Meixianbanmao Guangdong 27 Yunnan 82-133 Yunnan
8 Jiangxi 83-4 Jiangxi 18 Guizhou 78-11-10 Guizhou 28 Hainan 92-106 Hainan
9 Yacheng 1 Hainan 19 Guangdong 5t Guangdong 29 Guangxi 87-31 Guangxi
10 Sichuan 79-I-11 Sichun 20 Guizhou 78-11-03 Guizhou 30 Yunnan 82-69 Yunnan
c o n f i r m q u a l i t y and c o n c e n t r a t i o n . F i n a l a d j u s t m e n t s
w e r e m a d e as r e q u i r e d .
P r i m e r s c r e e n i n g a n d s e l e c t i o n
We s c r e e n e d a to t a l o f 100 R A P D p r i m e r s and
100 I S S R p r i m e r s f r o m U n i v e r s i t y o f B r i t i s h
C o l u m b i a B i o t e c h n o l o g y L a b ( U B C B L ) P r i m e r Se t
#9 . I T S p r i m e r pa i r s w e r e d e s i g n e d on ITS r e g i o n s
o f E r i a n t h u s . S e l e c t i o n was b a s e d on n u m b e r o f
p o l y m o r p h i s m s / p r i m e r o b s e r v e d d u r i n g s c r e e n i n g and
the c l a r i t y o f s c o r i n g p o l y m o r p h i c f r a g m e n t s . We did
no t s e l e c t p r i m e r s tha t p r o d u c e d f r a g m e n t s h a v i n g
e i t h e r s i m i l a r s i z e s o r d i f f i c u l t y in s c o r i n g .
P C R p r o g r a m
T h e a m p l i f i c a t i o n s w e r e c o n d u c t e d in E p p e n d o r f
G r a d i e n t C y c l e r s a c c o r d i n g to t he f e l l o w i n g P C R
p r o g r a m s .
Buffer dNTP Primers DNA Taq Total PCR Program
RAPD 1 x Buffer 0.2 M 200 nM 25 ng 1.2 U 30 lal
ISSR 1 x Buffer 0.15 mM 200 nM 25 ng 1.5 U 20 lal
ITS 1 x Buffer 0.15 mM 100 nM 25 ng 1.5 U 25 lal
94, 4 min; 94, 1 min; 38, 1 min; 72, 1.5 min, 40 cycle 72, 7 min and hold at 4 ~
94, 7 rain; 94, 30 S; 50, 45 S; 72, 2 min, 45.cycle 72, 7 min and hold at 4 ~
95, 5 rain; 93, 50 S; 58, 20 S; 72, 40 S, 30 cycle 72, 5min and hold at 4 ~
252
Scor ing of amplif ied products
Ampli f ica t ion products were loaded in a half- length (12.5 cm per tier) 1.5% agarose gel dissolved in 0.5X TBE buffer with ethidium bromide (5 ng/ ml) and electrophoreses were run at 4-5 V per cm for 1 -2 h to obtain opt imal resolution. At the end of e lectrophoreses , gels were photographed under UV l ight us ing V I L B E R LOURMAT. Scor ing of polymorphic fragments was performed independently by at least two scorers (usually three) directly as the posit ive or photographic negatives. When there were discrepancies among the scorers, those lanes were considered missing data. I f there was more than 10% d i s c r e p a n c y be tween i n d e p e n d e n t score rs , the polymorphism was considered unreliable to score and dropped from further analysis.
Statist ical Analys is
All bands were scored 1 if present or 0 if absent with BioLD++ software. The phylogenetic tree was constructed using the unweighted pair-group method of a r i t h m e t i c means and Pt ' incipal C o m p o n e n t Analysis (PCA). Genetic similarity Coefficient : a = 2nxy/(nx+ny) where nxy was the common bands, nx and ny were different bands. To character ize the c a p a c i t y of each p r i m e r to revea l or de t ec t po lymorph i c loci in our ge rmplasm, we use the polymorphic index content (PIC), PIC = l-Epi 2 and the effective number of alleles (Ne), Ne = 1/Epi 2, where Pi is the allele f requency of the i th allele.
R E S U L T S AND ANALYSIS
M o l e c u l a r c la s s i f i ca t ion of Saccharum and i ts related genera
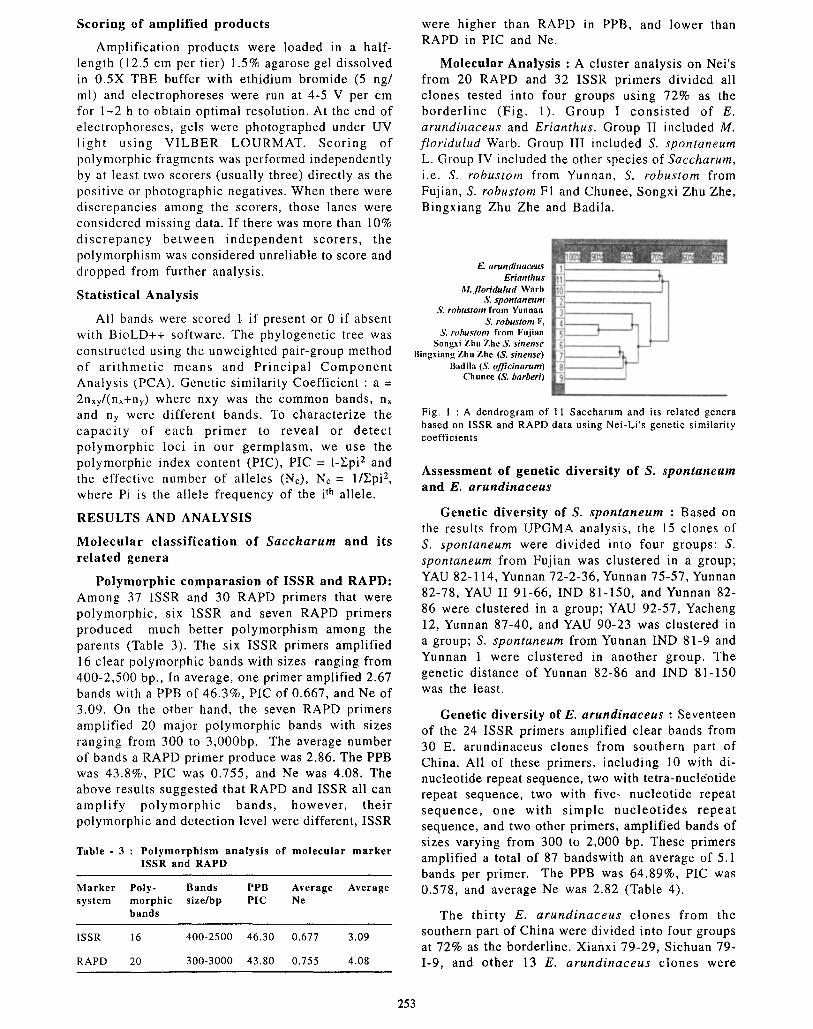
Po lymorphic c o m p a r a s i o n of ISSR and RAPD: Among 37 ISSR and 30 RAPD primers that were po lymorph ic , six ISSR and seven RAPD pr imers produced much bet ter po lymorph i sm among the parents (Table 3). The six ISSR primers amplif ied 16 clear po lymorphic bands with sizes ranging f rom 400-2,500 bp., In average, one primer amplified 2.67 bands with a PPB of 46.3%, PIC of 0.667, and Ne of 3.09. On the other hand, the seven RAPD primers amplified 20 major polymorphic bands with sizes ranging from 300 to 3,000bp. The average number of bands a RAPD pr imer produce was 2.86. The PPB was 43.8%, PIC was 0.755, and Ne was 4.08. The above results suggested that RAPD and ISSR all can a m p l i f y p o l y m o r p h i c bands , however , the i r polymorphic and detection level were different, ISSR
Table - 3 : Polymorphism analysis of molecular marker ISSR and RAPD
Marker Poly- Bands PPB Average Average system morphic size/bp PIC Ne
bands
ISSR 16 400-2500 46.30 0.677 3.09
RAPD 20 300-3000 43.80 0.755 4.08
were higher than RAPD in PPB, and lower than RAPD in PIC and Ne.
Molecular Analys is : A cluster analysis on Nei's f rom 20 RAPD and 32 ISSR pr imers divided all clones tested into four groups using 72% as the bo rde r l i ne (Fig . 1). G r o u p I c o n s i s t e d of E. arundinaceus and Erianthus. Group II included M. f loridulud Warb. Group III included S. spontaneum L. Group IV included the other species of Saccharum, i . e . S , robustom from Yunnan, S. robustom from Fujian, S. robustom F1 and Chunee, Songxi Zhu Zhe, Bingxiang Zhu Zhe and Badila.
Fig. 1 : A dendrogram of I 1 Saccharum and its related genera based on ISSR and RAPD data using Nei-Li's genetic similarity coefficients
Assessment of genetic diversity of S. spontaneum and E. arundinaceus
Genetic diversi ty of S. spontaneum : Based on the results from UPGMA analysis, the 15 clones of S. spontaneum were divided into. four groups: S. spontaneum f rom Fujian was clustered in a group; YAU 82-114, Yunnan 72-2-36, Yunnan 75-57, Yunnan 82-78, YAU II 91-66, IND 81-150, and Yunnan 82- 86 were clustered in a group; YAU 92-57, Yacheng 12, Yunnan 87-40, and YAU 90-23 was clustered in a group; S. spontaneum from Yunnan IND 81-9 and Yunnan 1 were c lus tered in ano ther group. The genetic distance of Yunnan 82-86 and IND 81-150 was the least.
Genetic diversity of E. arundinaceus : Seventeen of the 24 ISSR primers amplif ied clear bands from 30 E. arundinaceus clones from southern part of China. All of these primers, including 10 with di- nucleotide repeat sequence, two with tetra-nucleotide repeat sequence, two with five- nucleot ide repeat sequence , one with s imp le n u c l e o t i d e s r epea t sequence, and two other primers, amplif ied bands of sizes varying from 300 to 2,000 bp. These primers amplified a total of 87 bandswith an average of 5.1 bands per primer. The PPB was 64.89%, PIC was 0.578, and average Ne was 2.82 (Table 4).
The thi r ty E. arund inaceus c lones f rom the southern part of China were divided into four groups at 72% as the borderline. Xianxi 79-29, Sichuan 79- I-9, and o ther 13 E. arundinaceus c lones were
253

Table - 4 : P o l ymorph i s imic analyses for banding patterns amplified by different ISSR primers
ISSR Primer sequences P o l y m o r p h i s m Band P o l y m o r p h i s m primers bands size information
content
Effective number of alleles per locus
UBC#5 AGG TCG CGG CCG C(ACTG) AT G 3 300-800 0.65
UBC#6 AGA GTT GGT AGC TCT TGA TC 1 900-1800 0.40
UBC#10 (ACT)(ACG)(ACT) (TG)7 7 500-1000 0.66
UBC#13 (CGT)(AGT)(CGT) (CA)7 2 600-900 0.52
UBC#20 (GGGTG)3 4 800-1400 0.48
UBC#23 (GGAT)4 6 600-1400 0.56
UBC#28 (GACA)4 11 400-1800 0.82
UBC#46 (AC)8(CT)T 5 800-1400 0.69
UBC#47 (TC)8(AG)G 2 800-1300- 0.42
UBC#49 (TC)8(AG)A 8 900-1400 0.53
UBC#51 (GT)8(CT)C 6 500-1400 0.75
UBC#56 (CT)8(AG)G 8 600-1800 0.69
UBC#61 (GA)8(CT)T 6 400-1200 0.76
UBC#65 (AG)8(CT)A 9 500-1400 0.77
UBC#66 (AG)8(CT)C 0 1031 0.00
UBC#93 (AG)8C 6 400-1100 0.70
UBC#94 (AG)8T 3 500-1300 0.46
Average 5.1 0.58
2.84
1.66
2.92
2.06
1.91
2.26
5.43
3.23
1.71
2.15
4.03
3.2t
4.13
4.26
1.00
3.37
1.85
2.82
c lus tered in Group I; Gu izhou 78- I -8 , Xianxi 83-4, E. a r u n d i n a c e u s of Maix ian , Yacheng 1, and Yacheng 3 were c l u s t e r e d in G r o u p II ; G u a n g x i 87 -31 , Gu izhou 78-11-03, and other seven E. a rund inaceus clones were c lus te red in Group III ; and Yacheng 2 was s imply c lus te red in Group IV. In Group I, the
d i s tance of Xianxi 79-29 and S ichuan 79-1-9 was the least. In Group II, the d i s tance of G u i z hou 78-1-8 and Xianxi 83-4 was the least. In Group III , the d i s tance of Ha inan 92-109 and Ha inan 92-105 was
the least. It is suggested that E. a r u n d i n a c e u s c lones f rom the same geograph ic area were c lus te red into
Fig. 2 : Dendrogram of 15 clones of S. spontaneum based on ISSR using Nei-Li's genetic similarity coefficients
254

the same group, such as Xianxi 79-29 and Xianxi 91-4 in Group III. However, Guandong 15, Meixian E. arund inaceus , and G u a n d o n g 51 were not clustered in the same group. The same was true for Si~huan 79-1-22 and other three clones from Sichuan.
Us ing the SAS sof tware on the s imi la r i ty coefficients, we conducted a PCA analysis among different E. arundinaceus and drew a figure (R analysis) based on fist principal component and second principal component (Fig. 3). Near locus showed a consangu ineous relat ion, far d is tance showed a remote relation. The results of PCA were the same to the results of UPGMA analysis, most c lones which came f rom the same region were clustered in the same group.
M o l e c u l a r I d e n t i f i c a t i o n o f G e n u i n e H y b r i d s f r o m
the C r o s s o f Saccharum a n d E. arundinaceum
Based on ITS sequence from Erianthus, several pairs of primers were designed and used to amplify Saccharum and its related genera. Only Erianthus (Dehong 2) (20) and its progeny Yacheng 96-66(19) could amplify bands, a 317 bp band from the EF1/ ER1 primer pair and a 350bp band from the EF2/ ER2 primer pair. This indicated that these two primer pairs were Erianthus-specific (Fig. 5).
When using EF1/ER1- and EF2/ER2 primer pairs to test the nine progenies of (Badida x Erianthus), Yacheng 95-41, Yacheng 96-41, and Yacheng 96-66 amplified a 317 bp band which was the same to some
Fig. 3 : Dendrogram of 30 Erianthus clones based on ISSR data using Nei-Li's genetic ~imilarity coefficients
Fig. 4. Associations among ISSR-PCR bands from 30 Erianthus clones revealed by principal component analyses (PCA)~ Notes: The numbers in Figure 3 stand for the same Erianthus clones as listed in Table 2 and Fig. 2, Badila was not involved in the cluster and principal component analyses.
255

Fig. 5 : EFI/ERI- and EF2/ER2-amplified PCR products from Saccharum and its related genera Lane designation : (1) Sorghum, (2) Corn, (3) Rice, (4) E. rockii Keng, (5-6) Uba, (7) POJ28-78, (8) 57NG208, (9) S. sinense Roxb, (10) UAHIAPELE, (I 1) S. robustum from Yunan, (12) S. robustum from Fujian, (13) Narenga, (14) S. Spontaneum, (15) Mungo, (16) Pansashi, (17) Badida, (18)YC84-125, (19)YC96-46, (20) Dehong 2 (E. arundinaceus), M - Markers.
E r i a n t h u s c lones (Dehong 2, S ichuan 79-I-11, and Hainan 92-105) . Yacheng 96-45, Yacheng 96-69, and Yacheng 96-40 ampl i f ied two bands of 342 and 308 bp, which were the same from Hainan 92-77; Yacheng 96-43 and Yacheng 73-557 did not ampl i fy any band, ind ica t ing that these two were not real hybr id of E r i a n t h u s (Fig. 6). These resul ts were conf i rmed
with the i sozyme data (Table 5).
Tes t ing of the f o r t y - e i g h t BC1 p rogeny f rom crosses b e t w e e n F1 hybr ids (YC96-66 , YC96-46 , YC95-41) of E. a r u n d i n a c e u m as female parents and
C P 8 4 - 1 1 9 8 or N e i j i a n 5 7 - 4 1 6 as ma le p a r e n t s indica ted that a lot of p rogen ies had the same bands
with its female parents (YC96-66 , YC96-46 , YC95-
41), sugges t ing the g e n u i n e hybr ids from the cross of S a c c h a r u m and E. a r u n d i n a c e u m (Figs. 7, 8 and 9). However, 13, except YC 88-33 and YC 93-25, of the fifteen putat ive FI hybr ids from the cross of ( S a c c h a r u m • E. a r u n d i n a c e u m ) were not hybr ids because they did not ampl i fy the expected Er ian thus -
specif ic bands . (Fig. 10 and Table 6).
S e g r e g a t i o n of I S S R f r a g m e n t in a p r o g e n y populat ion
A 750 bp f r agmen t of ISSR pr imer UBC845 was ampl i f ied from all four parents and segregated 48:32 (1:1 ratio by X 2 test).
Fig. 6 : EFI/ER I- and EF2/ER2-amplified PCR products from 9 progenies of Badida (S. officinarum) x Erianthus and their parents. Lane designation : (1) Badida, (2) Dehong 2, (3) YC96-45, (4) YC95-41, (5) YC96-69, (6) Hainan 92-79, (7) Hainan 92-77, (8) YC 96-40, (9) YC96-41, (10) YC96-43, (11) Sichuan 79-1-11, (12) YC73-557, (13) Hainan 92-105, (14) YC96-46 and (15) YC96-66.
Table - 5 : Idcntification of nine hybrids between Badila and Erianthus using DNA and isozyme markers
Name of F1 Parents EF1/ER1 EF2/ER2 Remark
YC 96-45 Badida, Erianthus True True
YC 95-41 Badida. Hainan 92-105 + Hainan 92-79 + Hainan 92-77 True True
YC 96-69 Badida, Erianthus True True
YC 96-40 Badida, Hainan 92-79 + Hainan 92-77 True True
YC 96-41 Ditto True . True
YC 96-43 Ditto False False
YC 73-557 Ditto False False
YC 96-46 Badida, Haiuan 92-105 True True
YC 96-66 Ditto True True
No Identification
True for isozymeidentification
True for isozyme identification
True for isozyme identification
No Identification
No Identification
No Identification
True for isozyme identification
True for isozyme identification
256

Fig. 7 : EFI/ER t- and EF2/ER2-amplified PCR products from progenies of Ya96-66 x CP84-1198 and their parents. Lane designatioqs : (1) Badida, (2) Hainan 92-105, (3) YC96-66, (4) CP84-1198 and (5 to 13) Progenies of YC96-66 x CP84-1198
Fig. 8 : EFI/ER I- and EF2/ER2-amplified PCR products progenies of Ya 95-41 Neijiang 57-416 and their parents. Lane designations : (1) Badida, (2) Hainan 92-105, (3) Hainan 92-79, (4) Hainan 92-77, (5) YC 95-41, (6) Neijiang 57-41, (7-18) Progenies of YC 95-41, Neijiang 57-416
Fig. 9 : EF~/ER~- and EFz/ER_,-amplified PCR products from progeny of Ya96-40 • CP84-1198 and their parents. Lane designations : (1) Badida, (2) Hainan 92-79, (3) Hainan 92-77, (4)YC 96-40, (5) CP 84-1198, (6-32) Progenies of YC 96-40 x CP 84-1198
Fig. I0 : EFI/ER I- and EFJER2-amplified PCR products from 15 putative genuine hybrids from crosstng of Saccharum with E. arundinaceus. Lane designations : (1) Ganzhe 64-137; (2) Ganzhe 65-542; (3) Guitang 83-492; (4) YC62-70; (5) YC64-389; (6) YC73-512; (7)YC73-557; (8)YC88-33; (9)YC90-11; (10)YC90-3; (11)YC90-31; (12)YC90-4; (13)YC92-27; (14)YC93-25; (15) YC93-26
D I S C U S S I O N
Classi f icat ion of Saccharum and its related genera
The n u m b e r of species recogn ized in the genus Saccharum depend ' s on the c r i t e r i a used for c lass i f ica t ion , such as an tho taxy conf igura t ion , shape cha rac t e r , suga r and f ib re c o n t e n t , c h r o m o s o m e divided strap and flock change. Six old world species of Saccharum are o f t en r e c o g n i z e d (Roach and
Dan ie l s , 1987). Two wild S a c c h a r u m species , S. spontaneum (2n = 36 to 128) and S. robustum B r a n d e s & Jesw. ex G r a s se l (2n = 60 to 170), p robab ly o r ig ina t ed from Ind ia and New Guinea , respect ively. The cul t iva ted species S. officinarum (2n = 70 to 140) is thought to be der ived from S. robustum ( I r v i n e , 1999) . T h e r e m a i n i n g two cul t ivated species , S. barberi Jesw. and S. sinense Roxb., are be l ieved to be na tura l ly hybr ids between
257

T a b l e - 6 : Resu l t s of f i f teen c lones which have been considered as genuine hybrids from crossing of Saccharum with E. arundinaceus
Name Parents Mole- Re- cular mark identi- fication
Ganzhe64-137 NCo310 x YC62-70 False F 2
Ganzhe65-542 NCo310 x YC59-844 False F 2
Guitang83-492 YT63-237 x YC72-351 False F3
YC62-70 S17 x YC57-25 False F l
YC64-389 Co419 x YC62-70 False F 3
YC73-512 YT57-423 x E. arundinaceus False F I
YC73-557 Badida x E. arundinaceus False F I
YC88-33 No detail True
YC90-11 CP72-1210 x E. arundinaceus False Fj
YC90-3 CP57-614 x YC84-125 False
YC90-31 Col001 x E. arundinaceus False F 1
YC90-4 CP72-1210 x E. arundinaceus False F I
YC92-27 No detail True F 2
YC93-25 No detail False
YC93-26 No detail False
S. s p o n t a n e u m and S. o f f i c inarum. The species S. edule Hassk. may be a hybrid between S. o f f ic inarum or S. robus tum and Miscan thus . Results from RAPD and ISSR UPGMA analyses in this study showed that M. f l o r i d u l u d Warb, E. a r u n d i n a c e u s Retz and Erian thus were genetically less related to Saccharum, with M. f l o r i d u l u d Warb being the furthest related genera, our results also indicated that S. spon tane um was gene t i ca l ly dis t inct ive from the other four species, S. robus tum Brandes, S. sinense Roxb, S. o f f i c inarum and S. barber i Jesweit. More detailed taxonomic and molecular analyses led to the same suggestion of considering the six S a c c h a r u m species into two (Irvine, 1999). One species consists only of S. s p o n t a n e u m on the basis of chloroplastic (Sobral et al . , 1994), mitochondrial and ribosomal DNA analyses (Glaszmann et al . , 1990). The other is cons ide red as S. o f f i c i n a r u m , inc luding S. of f i c inarum, S. robus tum, and the other three species that are all postulated to be interspecific hybrids. We could not deduce any relat ionship among S. s inense Roxb, S. barber i Jesweit, and S. spon taneum
based on the UPGMA analysis. However, there might be some connection to sugarcane special genetic background, interspecific or intergeneric hybrids, especial way of breeding. In addition, the S. robustom
F1 had a close relationship to S. robus tum from Fujian, we doubted that these two clones were the~ same material.
A s s e s s m e n t o f g e n e t i c d i v e r s i t y in E r i a n t h u s u s i n g m o l e c u l a r m a r k e r s
Analyses of the extent and distribution of genetic variation in Saccharum are essential in understanding the evolutionary relationships between accessions and to sample genetic resources in a more systematic fashion for breeding and conservat ion purposes. Traditionally, genetic resources in suagrcane were classified by taxonomists based on morphological or biochemical markers. However, these morphological or biochemical traits used in sugarcane classification are condit ioned by a relatively small number of genes. On the other hand, important traits that are related to habitat adaptation and exhibit enormous variability among sugarcane germplasm are complex and quant i ta t ively inher i ted. Hence, c l a ss i fy ing germplasm accessions based solely on a few discrete morphological or biochemical characters may not p rov ide an accura te ind ica t ion of the gene t ic d ive rgence among the cul t iva ted g e n o t y p e s of sugarcane.
Er ian thus is one of Sac c harum -re la t e d genera, it was regarded as genet ic resources for its broad adaptabi l i ty , d rought res is t ing advers i ty , b loom growth and strong root. Seventeen of 32 tested ISSR primers produced clearly scorable bands, including 10 with di-nucleotide repeat sequence, two with tetra- nucleotide repeat sequence, two with five- nucleotide repeat sequence, one with simple nucleotides repeat sequence ; and two other pr imers , The sizes of amplified bands varied from 300 to 2,000 bp with an average of 5.1 bands per primer. The PPB was 64.89%, PIC was 0.578, and average Ne was 2.82.
Thirty Er ian thus accessions were collected from eight different provinces or regions in the southern part of China. Based upon PCA analyses of ISSR and ITS data, the 30 accessions were divided into 4 groups. Erian thus accessions from the same area was c lus te red into one group, took on reg iona l ly distributing rule, such as Guizhou 78-I-06 (13) and Guizhou78-I-10 (16), Baishapodabaicao and YC1. However, there are some exceptions. One example is YC2, the similarity coefficients of YC2 and other E. a rund inaceus accessions from Hainnan were very
Fig. 11 : Electrophoresis products of PCR by ISSR primer UBC845
258

low, this m a y b e due to the fact that these E. a r u n d i n a c e u s c l o n e s w e r e s e l e c t e d by n a t u r e . However , some E. a r u n d i n a c e u s access ions f rom
s a m e area c o u l d not c l u s t e r in to a g roup . We hypo thes ize that both na tu ra l and human se lec t ion e f f o r t s have c o n t r i b u t e d to the c u r r e n t g e n e t i c
d i f fe rences in Erian thus and hence landraces of the same species grown in d i f fe ren t habi ta ts may have grea te r genet ic d i s s imi l a r i t y than those of d i f fe ren t
races from the same habi ta t .
M o l e c u l a r I d e n t i f i c a t i o n o f H y b r i d s f r o m the Cross
b e t w e e n Saccharum a n d E. a rund inaceus u s i n g I T S
Variat ion and evo lu t ion rate of ITS was qu icker a m o n g species and slow wi th in species. Because of
this, we could des ign specif ic pr imers based on ITS s e q u e n c e to d i s t i n g u i s h E r i a n t h u s f rom o t h e r Saccharum re la ted genera . EF1/ER1 and EF2 /ER2 p r i m e r pa i r s were i n d e e d such s p e c i e s - s p e c i f i c p r imers for Erianthus . Thi r ty Erianthus access ions were d iv ided into five sets by E F 1 / E R 1 - P C R and three sets by E F 2 / E R 2 - P C R . We also used these two p r imer pairs to iden t i fy hybr ids f rom the cross of (Saccharum • E. arundinaceus) . This t echno logy of
marke r - a s s i s t ed F1 hyb r id iden t i f i ca t ion has been pa ten ted (Patent number : 03138821 .3) .
R E F E R E N C E S
Dellaport, S.L., Wood, J. and Hicks, J.B. (1983). A plant DNA minipreparation:Version I1 [J]. Plant Molecular Biology Reporter, 1(14) : 19-21.
Smith, J.S.C., Chin, E.C.L. and Shu, H. (1997). An evaluation of the utility of SSR loci as molecular marker in maize (zea mays L.) : comparison with data from RFLPs and pedigree [J]. Theor. Appl. Genet., 95 : 163-173.
Powell, W., Morgante, M. and Andre, C. (1996). The comparision of RFLP, RAPD, AFLP and SSR (microsatellite) markers for germplasm analysis [J]. Mol. Breeding, 2 : 225-238.
Geoff, Der, Brian, S. and Everitt, A. (2001). Handbook of Statistical Analyses Using SAS, Second Edition [M], CRC Press, 398.
Roach, B.T. and Daniels, J. (1987). A review of the origin and improve- ment of sugarcane, p. 1-31. In Copersucar lnt Sugarcane Breed Wkshp, Copersucar, Sao Paulo, Brazil.
Irvine, J.E. (1999). Saccharum species as horticultural classes. Theor. Appl. Genet., 98 : 186-194.
Glaszmann, J.C., Lu, Y.H. and Lanaud, C. (1990). Variation of nuclear ribosomal DNA in sugarcane. J. Genet. Breed., 44 : 191-198.
Sobral, B.W.S., Braga, D.P.V., LaHood, E.S. and Keim, P. (1994). Phylo genetic analysis of chloroplast restriction enzyme site mutations in the Saccharinae Griseb. Subtribe of the Andropogoneae Dumort Tribe. Theor. Appl. Genet., 87 : 843- 853.
259