Embed Size (px)
Citation preview
Molecular evolution
Fredj TekaiaInstitut Pasteur
Institut Pasteur/EMBO/CNPq course,
UFSC, Florianopolis, 2008
The increasing available completely sequenced organisms and the importance of evolutionary processes that affect the species history, have stressed the interest in studying the molecular evolution events at the sequence level.
Molecular evolution
Plan
• Context;
• selection pressure (definitions);
• Genetic code and inherent properties of codons and amino-acids;
• Estimations of synonymous and nonsynomynous substitutions;
• Codons volatility;
• Applications.

Ancestor
species genome
Evolutionary processes include:
Phylogeny*duplication genesis
Expansion*
HGT HGT
Exchange* loss Deletion*
and selection
Large scale comparative genome analysis revealed significant evolutionary processes:

Genomes 2 edition 2002. T.A. Brown
Species tree
A B C
Genes tree
A B C
Time Duplication
Duplication
Speciation
Speciation
A B C
Gene tree - Species tree

Hurles M (2004) Gene Duplication: The Genomic Trade in Spare Parts. PLoS Biol 2(7): e206.
Original version
Actual versions

Homologs - Paralogs - Orthologs
Homologs: A1, B1, A2, B2
Paralogs : A1 vs B1 and A2 vs B2
Orthologs: A1 vs A2 and B1 vs B2
S1 S2
a b
Sequence analysis
Species-1 Species-2
Duplication
Ancestor
Evolution
Speciation
A1 A2
B1 B2
A
B
A
B
A
Time

Molecular evolutionary analysis
• Aim at understanding and modeling evolutionary events;
• Evolutionary modeling extrapolates from the divergence between homologous sequences, the number of events which have occurred since the genes diverged;
• If rate of evolution is known, then a time since divergence can be estimated.

Applications:
Molecular evolution analysis has clarified:
• the evolutionary relationships between humans and other primates;
• the origins of AIDS;
• the origin of modern humans and population migration;
• speciation events;
• genetic material exchange between species;
• origin of some deseases (cancer, etc...)
• .....
Molecular evolution

Molecular evolution
GACGACCATAGACCAGCATAG
GACTACCATAGA-CTGCAAAG
*** ******** * *** **
GACGACCATAGACCAGCATAG
GACTACCATAGACT-GCAAAG
*** ********* *** **
Two possible positions for the indel
GACGACCATAGACCAGCATAG
GACTACCATAGACTGCAAAGAlign:

Molecular evolution
• Mutations arise due to inheritable changes in genomic DNA sequence;
• Mechanisms which govern changes at the protein level are most likely due to nucleotide substitution or insertions/deletions;
• Changes may give rise to new genes which become fixed if they give the organism an advantage in selection;
GACGACCATAGACCAGCATAG
GACTACCATAGA-CTGCAAAG

Molecular evolution: Definitions
• Purifying (negative) selection
• Neutral theory
• Positive selection

Molecular evolution: Definitions
Purifying (negative) selection
• A consequence of “gene drift” through random mutations, is that many mutations will have deleterious effects on fitness.
• “Purifying selective force” prevents accumulation of mutation at important functional sites, resulting in sequence conservation.
-> “Purifying selection” is a natural selection against deleterious mutations.
-> The term is used interchangeably with “negative selection” or “selection constraints”.

Neutral theory
• The majority of evolution at the molecular level is caused by random “genetic drift” through mutations that are selectively neutral or nearly neutral.
• Describes cases in which selection (purifying or positive) is not strong enough to outweigh random events.
• Neutral mutation is an ongoing process which gives rise to genetic polymorphisms; changes in environment can select for certain of these alleles.

Positive selection
• Positive selection is a darwinian selection fixing advantageous mutations.
The term is used interchangeably with “molecular adaptation” and “adaptive molecular evolution”.
• Positive selection can be shown to play a role in some evolutionary events.
• This is demonstrated at the molecular level if the rate of nonsynonymous mutation at a site is greater than the rate of synonymous mutation.
• Most substitution rates are determined by either neutral evolution of purifying selection against deleterious mutations.

Molecular evolution
• We observe and try to decode the process of molecular evolution from the perspective of accumulated differences among related genes from one or diverse organisms.
• The number of mutations that have occurred can only be estimated.
Real individual events are blurred by a long history of changes.

-GGAGCCATATTAGATAGA-
-GGAGCAATTTTTGATAGA-
Gly Ala Ile Leu asp Arg
Gly Ala Ile Phe asp Arg
DNA yields more phylogenetic information than proteins. The nucleotide sequences of a pair of homologous genes have a higher information content than the amino acid sequences of the corresponding proteins, because mutations that result in synonymous changes alter the DNA sequence but do not affect the amino acid sequence.
• 3 different DNA positions but only one different amino acid position:
2 of the nucleotide substitutions are therefore synonymous and one is non-synonymous.
Nucleotide, amino-acid sequences
-> gene
-> protein
Multiple Substitutions can greatly obscure the actual evolutionary history of a pair of sequences.

Kinds of nucleotide substitutionsGiven 2 nucleotide sequences, how their similarities and differences arose from a common ancestor? We assume A the common ancestor:
A
A
C
Single substitution
1 change, 1 difference
T
A
A
C
Multiple substitution
2 changes, 1 difference
A
C
G
Coincidental substitution
2 change, 1 difference
A
C
C
Parallel substitution
2 changes, no difference
A
T
T
C
Convergent substitution
3 changes, no difference
A
A
AC
Back substitution
2 changes, no difference

Substitution: Transition - transversion
transition changes one purine for another or one pyrimidine for another.
transversion changes a purine for a pyrimidine or vice versa.
Nucleotides are either purine or pyrimidines :
G (Guanine) and A (Adenine) are called purine;
C (Cytosine) and T (Thymine) are called pyrimidines.
transitions occur at least 2 times as frequently as transversions
A G
C T

Standard genetic code
• The genetic code is the set of rules by which information encoded in genetic material (DNA or RNA sequences) is translated into proteins (amino acid sequences) by living cells.
• The genetic code specifies how a combination of any of the four bases (A,G,C,T) produces each of the 20 amino acids.
• The triplets of bases are called codons and with four bases, there are 64 possible codons:
(43) possible codons that code for 20 amino acids (and stop signals).

Second position | T | C | A | G | ----+--------------+--------------+--------------+--------------+---- | TTT Phe (F) | TCT Ser (S) | TAT Tyr (Y) | TGT Cys (C) | T T | TTC " | TCC " | TAC " | TGC " | C F | TTA Leu (L) | TCA " | TAA Ter | TGA Ter | A T i | TTG " | TCG " | TAG Ter | TGG Trp (W) | G h r --+--------------+--------------+--------------+--------------+-- i s | CTT Leu (L) | CCT Pro (P) | CAT His (H) | CGT Arg (R) | T r t C | CTC " | CCC " | CAC " | CGC " | C d | CTA " | CCA " | CAA Gln (Q) | CGA " | A P | CTG " | CCG " | CAG " | CGG " | G P o --+--------------+--------------+--------------+--------------+-- o s | ATT Ile (I) | ACT Thr (T) | AAT Asn (N) | AGT Ser (S) | T s i A | ATC " | ACC " | AAC " | AGC " | C i t | ATA " | ACA " | AAA Lys (K) | AGA Arg (R) | A t i | ATG Met (M) | ACG " | AAG " | AGG " | G i o --+--------------+--------------+--------------+--------------+-- o n | GTT Val (V) | GCT Ala (A) | GAT Asp (D) | GGT Gly (G) | T n G | GTC " | GCC " | GAC " | GGC " | C | GTA " | GCA " | GAA Glu (E) | GGA " | A | GTG " | GCG " | GAG " | GGG " | G ----+--------------+--------------+--------------+--------------+----
Ala: Alanine; Cys: Cysteine; Asp: Aspartic acid; Glu: Glutamic acidPhe: Phenylalanine; Gly: Glycine; His: Histidine; Ile: Isoleucine; Lys: Lysine; Leu: Leucine; Met: Methionine; Asn: Asparagine; Pro: Proline; Gln: Glutamine; Arg: Arginine; Ser: Serine; Thr: Threonine; Val: Valine; Trp: Tryptophane; Tyr: Tyrosine

Second position | T | C | A | G | ----+--------------+--------------+--------------+--------------+---- | TTT Phe (F) | TCT Ser (S) | TAT Tyr (Y) | TGT Cys (C) | T T | TTC " | TCC " | TAC | TGC | C F | TTA Leu (L) | TCA " | TAA Ter | TGA Ter | A T i | TTG " | TCG " | TAG Ter | TGG Trp (W) | G h r --+--------------+--------------+--------------+--------------+-- i s | CTT Leu (L) | CCT Pro (P) | CAT His (H) | CGT Arg (R) | T r t C | CTC " | CCC " | CAC " | CGC " | C d | CTA " | CCA " | CAA Gln (Q) | CGA " | A P | CTG " | CCG " | CAG " | CGG " | G P o --+--------------+--------------+--------------+--------------+-- o s | ATT Ile (I) | ACT Thr (T) | AAT Asn (N) | AGT Ser (S) | T s i A | ATC " | ACC " | AAC " | AGC " | C i t | ATA " | ACA " | AAA Lys (K) | AGA Arg (R) | A t i | ATG Met (M) | ACG " | AAG " | AGG " | G i o --+--------------+--------------+--------------+--------------+-- o n | GTT Val (V) | GCT Ala (A) | GAT Asp (D) | GGT Gly (G) | T n G | GTC " | GCC " | GAC " | GGC " | C | GTA " | GCA " | GAA Glu (E) | GGA " | A | GTG " | GCG " | GAG " | GGG " | G ----+--------------+--------------+--------------+--------------+----
Standard genetic code
• Because there are only 20 amino acids, but 64 possible codons, the same amino acid is often encoded by a number of different codons, which usually differ in the third base of the triplet.
Charged(basic; acidic); Hydrophiles; Hydrophobes
M Met Methionine ATG W Trp Tryptophane TGG N Asn Asparagine AAT AAC D Asp Aspartic acid GAT GAC C Cys Cysteine TGT TGC Q Gln Glutam ine CAA CAG E Glu Glutamic acid GAA GAG H His Histidine CAT CAC K Lys Lysine AAA AAG F Phe Phenylalanine TTT TTC Y Tyr Tyrosisne TAT TAC I Ile Isoleucine ATT ATC ATA A Ala Alanine GCT GCC GCA GCG G Gly Glycine GGT GGC GGA GGG P Pro Proline CCT CCC CCA CCG T Thr Threonine ACT ACC ACA ACG V Val Valine GTT GTC GTA GTG R Arg Arginine CGT CGC CGA CGG AGA AGG L Leu Leucine TTA TTG CTT CTC CTA CTG S Ser Serine TCT TCC TCA TCG AGT AGC Ter Stop TAA TAG TGA

0
1
2
3
4
5
6
M(Met)W(Trp)N(Asn)D(Asp)C(Cys)Q(Gln)E(Glu)H(His)K(Lys)F(Phe)Y(Tyr)I(Ile)A(Ala)G(Gly)P(Pro)T(Thr)V(Val)R(Arg)L(Leu)S(Ser)Ter(Stop)Amino acids
Number of Codons
M Met Methionine ATG W Trp Tryptophane TGG N Asn Asparagine AAT AAC D Asp Aspartic acid GAT GAC C Cys Cysteine TGT TGC Q Gln Glutam ine CAA CAG E Glu Glutamic acid GAA GAG H His Histidine CAT CAC K Lys Lysine AAA AAG F Phe Phenylalanine TTT TTC Y Tyr Tyrosisne TAT TAC I Ile Isoleucine ATT ATC ATA A Ala Alanine GCT GCC GCA GCG G Gly Glycine GGT GGC GGA GGG P Pro Proline CCT CCC CCA CCG T Thr Threonine ACT ACC ACA ACG V Val Valine GTT GTC GTA GTG R Arg Arginine CGT CGC CGA CGG AGA AGG L Leu Leucine TTA TTG CTT CTC CTA CTG S Ser Serine TCT TCC TCA TCG AGT AGC Ter Stop TAA TAG TGA
Charged(basic; acidic); Hydrophiles; Hydrophobes
Codons vs Amino Acids

Codons vs Amino Acids
• Because of this repetition the genetic code is said to be degenerate and codons which produce the same amino acid are called synonymous codons.
0
1
2
3
4
5
6
M(Met)W(Trp)N(Asn)D(Asp)C(Cys)Q(Gln)E(Glu)H(His)K(Lys)F(Phe)Y(Tyr)I(Ile)A(Ala)G(Gly)P(Pro)T(Thr)V(Val)R(Arg)L(Leu)S(Ser)Ter(Stop)Amino acids
Number of Codons
M Met Methionine ATGW Trp Tryptophane TGGN Asn Asparagine AAT AACD Asp Aspartic acid GAT GACC Cys Cysteine TGT TGCQ Gln Glutamine CAA CAGE Glu Glutamic acid GAA GAGH His Histidine CAT CACK Lys Lysine AAA AAGF Phe Phenylalanine TTT TTCY Tyr Tyrosisne TAT TACI Ile Isoleucine ATT ATC ATAA Ala Alanine GCT GCC GCA GCGG Gly Glycine GGT GGC GGA GGGP Pro Proline CCT CCC CCA CCGT Thr Threonine ACT ACC ACA ACGV Val Valine GTT GTC GTA GTGR Arg Arginine CGT CGC CGA CGG AGA AGGL Leu Leucine TTA TTG CTT CTC CTA CTGS Ser Serine TCT TCC TCA TCG AGT AGC

Important properties inherent to
the standard genetic code

Synonymous vs nonsynonymous substitutions
• Nondegenerate sites: are codon position where mutations always result in amino acid substitutions.
(exp. TTT (Phenylalanyne, CTT (leucine), ATT (Isoleucine), and GTT (Valine)).
• Twofold degenerate sites: are codon positions where 2 different nucleotides (bases) result in the translation of the same aa, and the 2 others code for a different aa.
(exp. GAT and GAC code for Aspartic acid (asp, D),
whereas GAA and GAG both code for Glutamic acid (glu, E)).
• Threefold degenerate sites: are codon positions where changing 3 of the 4 nucleotides has no effect on the aa, while changing the fourth possible nucleotide results in a different aa.
There is only 1 threefold degenerate site: the 3rd position of an isoleucine codon. ATT, ATC, or ATA all encode isoleucine, but ATG encodes methionine.

Standard genetic code
• Three amino acids: Arginine, Leucine and Serine are encoded by 6 different codons:
R Arg Arginine CGT CGC CGA CGG AGA A GGL Leu Leucine TTA TTG CTT CTC CTA CTGS Ser Serine TCT TCC TCA TCG AGT AGC
• Five amino-acids are encoded by 4 codons which differ only in the third position. These sites are called “fourfold degenerate” sites
A Ala Alanine GCT GCC GCA GCGG Gly Glycine GGG GGA GGT GGCP Pro Proline CCT CCC CCA CCGT Thr Threonine ACT ACC ACA ACGV Val Valine GTT GTC GTA GTG
• Fourfold degenerate sites: are codon positions where changing a nucleotide in any of the 3 alternatives has no effect on the aa.
exp. GGT, GGC, GGA, GGG(Glycine);
CCT,CCC,CCA,CCG(Proline)
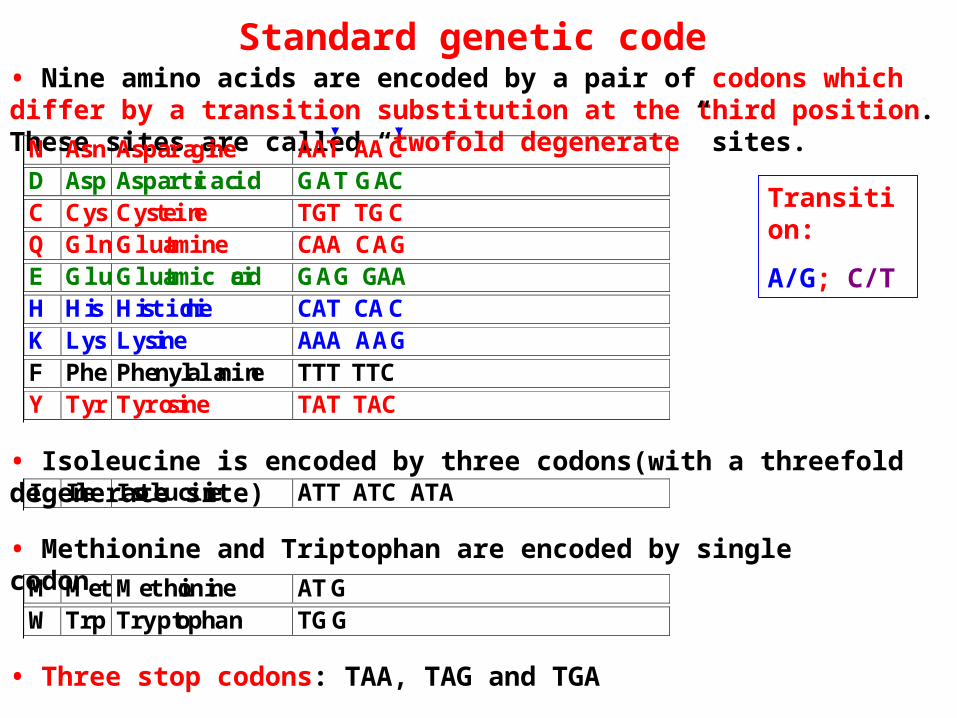
Standard genetic code• Nine amino acids are encoded by a pair of codons which differ by a transition substitution at the third position. These sites are called “twofold degenerate” sites.
• Isoleucine is encoded by three codons(with a threefold degenerate site)
• Methionine and Triptophan are encoded by single codon
• Three stop codons: TAA, TAG and TGA
N Asn Asparagine AAT AACD Asp Aspartic acid GAT GACC Cys Cysteine TGT TGCQ Gln Glutamine CAA CAGE Glu Glutamic acid GAG GAAH His Histidine CAT CACK Lys Lysine AAA AAGF Phe Phenylalanine TTT TTCY Tyr Tyrosine TAT TAC
I Ile Isoleucine ATT ATC ATA
M Met Methionine ATGW Trp Tryptophan TGG
Transition:
A/G; C/T

Nucleotide substitutions in protein coding genes can be divided into :
• synonymous (or silent) substitutions i.e. nucleotide substitutions that do not result in amino acid changes.
• non synonymous substitutions i.e. nucleotide substitutions that change amino acids.
• nonsense mutations, mutations that result in stop codons.
exp: Gly: any changes in 3rd position of codon results in Gly; any changes in second position results in amino acid changes; and so is the first position.
Standard Genetic Code
GAG
G Gly Glycine GGG GGA GGT GGC
Glu AGC Ser exp:

• Estimation of synonymous and nonsynonymous substitution rates is important in understanding the dynamics of molecular sequence evolution.
• As synonymous (silent) mutations are largely invisible to natural selection, while nonsynonymous (amino-acid replacing) mutations may be under strong selective pressure, comparison of the rates of fixation of those two types of mutations provides a powerful tool for understanding the mechanisms of DNA sequence evolution.
• For example, variable nonsynonymous/synonymous rate ratios among lineages may indicate adaptative evolution or relaxed selective constraints along certain lineages.
• Likewise, models of variable nonsynonymous/synonymous rate ratios among sites may provide important insights into functional constraints at different amino acid sites and may be used to detect sites under positive selection.
Nonsynonymous/synonymous substitutions

Codon usage
• If nucleotide substitution occurs at random at each nucleotide site, every nucleotide site is expected to have one of the 4 nucleotides, A, T, C and G, with equal probability.
• Therefore, if there is no selection and no mutation bias, one would expect that the codons encoding the same amino acid are on average in equal frequencies in protein coding regions of DNA.
• In practice, the frequencies of different codons for the same amino acid are usually different, and some codons are used more often than others. This codon usage bias is often observed.
• Codon usage bias is controlled by both mutation pressure and purifying selection.
• There are 64 (43) possible codons that code for 20 amino acids (and stop signals).

• For a pair of homologous codons presenting only one nucleotide difference, the number of synonymous and nonsynonymous substitutions may be obtained by simple counting of silent versus non silent amino acid changes;
• For a pair of codons presenting more than one nucleotide difference, distinction between synonymous and nonsynonymous substitutions is not easy to calculate and statistical estimation methods are needed;
• There can be many possible pathways between codons that differ at all three positions sites; each pathway has its own probability.
Estimating synonymous and nonsynonymous differences

• Observed nucleotide differences between 2 homologous sequences are classified into 4 categories: synonymous transitions, synonymous transversions, nonsynonymous transitions and nonsynonymous transversions.
• When the 2 compared codons differ at one position, the classification is obvious.
• When they differ at 2 or 3 positions, there will be 2 of 6 parsimonious pathways along which one codon could change into the other, and all of them should be considered.
Estimating synonymous and nonsynonymous differences
• Since different pathways may involve different numbers of synonymous and nonsynonymous changes, they should be weighted differently.

SEQ.1 GAA GTT TTT
SEQ.2 GAC GTC GTA
Glu Val Phe
Asp Val Val
•Codon 1: GAA --> GAC ;1 nuc. diff., 1 nonsynonymous difference;
•Codon 2: GTT --> GTC ;1 nuc. diff., 1 synonymous difference;
•Codon 3: counting is less straightforward:
TTT(F:Phe)
GTT(V:Val) TTA(L:Leu)
GTA(V:Val)
1 2
Path 1 : implies 1 non-synonymous and 1 synonymous substitutions;Path 2 : implies 2 non synonymous substitutions;
Example: 2 homologous sequences

Evolutionary Distance estimation between 2 sequences
The simplest problem is the estimation of the number of synonymous (dS) and nonsynonymous (dN) substitutions per site between 2 sequences:
• the number of synonymous (S) and nonsynonymous (N) sites in the sequences are counted;
• a correction for multiple substitutions at the same site is applied to calculate the numbers of synonymous (dS) and nonsynonymous (dN) substitutions per site between the 2 sequences.
==> many estimation Methods

Evolutionary Distance estimation
In general the genetic code affords fewer opportunities for nonsynonymous changes than for synonymous changes.
rate of synonymous >> rate of nonsynonymous substitutions.
Furthermore, the likelihood of either type of mutation is highly dependent on amino acid composition.
For example: a protein containing a large number of leucines will contain many more opportunities for synonymous change than will a protein with a high number of lysines.
L Leu Leucine TTA TTG CTT CTC CTA CTG4forld degeneratesite
2fold degenerate siteSeveral possible substitutions that will not change the aa Leucine
K Lys Lysine AAA AAG
Only one possible mutation at 3rd position that will not change Lysine

Evolutionary Distance estimation
• Fundamental for the study of protein evolution and useful for constructing phylogenetic trees and estimation of divergence time.

QuickTime™ et undécompresseur TIFF (non compressé)sont requis pour visionner cette image.
• Ziheng Yang & Rasmus Nielsen (2000)Estimating synonymous and nonsynonymous substitution rates under realistic evolutionary models. Mol Biol Evol. 17:32-43.
Estimating synonymous and nonsynonymous substitution rates
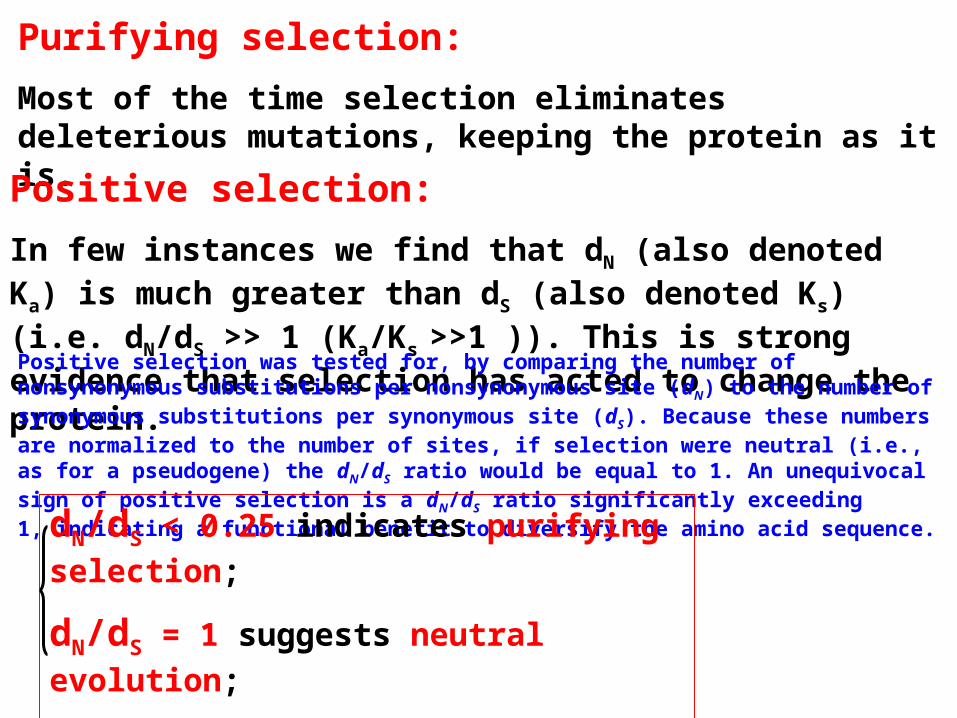
Purifying selection:
Most of the time selection eliminates deleterious mutations, keeping the protein as it is.
Positive selection:
In few instances we find that dN (also denoted Ka) is much greater than dS (also denoted Ks) (i.e. dN/dS >> 1 (Ka/Ks >>1 )). This is strong evidence that selection has acted to change the protein.Positive selection was tested for, by comparing the number of nonsynonymous substitutions per nonsynonymous site (dN) to the number of synonymous substitutions per synonymous site (dS). Because these numbers are normalized to the number of sites, if selection were neutral (i.e., as for a pseudogene) the dN/dS ratio would be equal to 1. An unequivocal sign of positive selection is a dN/dS ratio significantly exceeding 1, indicating a functional benefit to diversify the amino acid sequence.
dN/dS < 0.25 indicates purifying selection;
dN/dS = 1 suggests neutral evolution;
dN/dS >> 1 indicates positive selection.

Negative (purifying) selection eliminates disadvantageous mutations i.e. inhibits protein evolution.
(that is why dN < dS in most protein coding regions)
Positive selection is very important for evolution of new functions
especially for duplicated genes.
(must occur early after duplication otherwise null mutations and will be fixed producing pseudogenes).
• dN/dS (or Ka/Ks) measures selection pressure

Saturation: loss of evolutionary signal
Mutational saturation in DNA and protein sequences occurs when sites have undergone multiple mutations since divergence, causing sequence dissimilarity (the observed differences) to no longer accurately reflect the “true” evolutionary distance i.e. the number of substitutions that have actually occurred since the divergence of two sequences.
Correct estimation of the evolutionary distance is crucial.
Generally: sequences where dS > 2 are excluded to avoid the saturation effect of nucleotide substitution.

• PAML: Phylogenetic Analysis by Maximum Likelihood (PAML)
http://abacus.gene.ucl.ac.uk/software/paml.html
YN00 - P13.4.C13.18.fa.pamlns = 13 ls = 29Estimation by the method of:Yang & Nielsen (2000):
seq. seq. S N t kappa omega dN +- SE dS +- SEYALI0A08195g YALI0A17963g 15.1 71.9 0.37 1.31 0.20 0.07 +- 0.03 0.36 +- 0.22YALI0E25443g YALI0A17963g 17.3 69.7 1.8 1.31 0.05 0.13 +- 0.05 2.55 +- 13.95YALI0E25443g YALI0A08195g 17.6 69.4 1.00 1.31 0.06 0.08 +- 0.03 1.35 +- 0.70……… ……YALI0C21230g YALI0A17963g 24.1 62.9 5.35 1.31 0.75 1.63 +- 1.06 2.19 +- 1.70YALI0C21230g YALI0A08195g 24.5 62.5 6.58 1.31 0.57 1.81 +- 1.43 3.19 +- 6.21YALI0C21230g YALI0E25443g 24.9 62.1 4.76 1.31 1.27 1.69 +- 0.57 1.33 +- 0.59YALI0C21230g YALI0A02783g 24.6 62.4 4.71 1.31 3.58 1.97 +- 0.81 0.55 +- 0.21YALI0C21230g YALI0C21252g 25.4 61.6 6.64 1.31 3.22 2.77 +- 2.27 0.86 +- 0.32YALI0C21230g YALI0C21274g 25.3 61.7 6.54 1.31 3.46 2.75 +- 2.21 0.79 +- 0.34YALI0C21230g YALI0F09944g 24.3 62.7 7.51 1.31 2.31 2.97 +- 2.93 1.29 +- 1.09YALI0C21230g YALI0A13497g 28.2 58.8 7.13 1.31 3.20 3.06 +- 3.38 0.95 +- 0.34
…. …..YALI0C21230g YALI0B06160g 27.1 59.9 7.34 1.31 1.66 2.79 +- 2.37 1.68 +- 0.86YALI0D11638g YALI0C21230g 27.3 59.7 8.04 1.31 1.68 3.07 +- 3.40 1.83 +- 1.39YALI0E19140g YALI0C21230g 25.2 61.8 7.67 1.31 2.48 3.09 +- 3.46 1.25 +- 0.54YALI0E19140g YALI0D11638g 22.4 64.6 4.12 1.31 0.45 1.04 +- 0.29 2.33 +- 2.13
-> yn00 similar results than ML (Yang & Nielsen (2000))
-> advantage : easy automation for large scale comparisons;

Evolution of functionally important regions over time. Immediately after a speciation event, the two copies of the genomic region are 100% identical (see graph on left). Over time, regions under little or no selective pressure, such as introns, are saturated with mutations, whereas regions under negative selection, such as most exons, retain a higher percent identity (see graph on right). Many sequences involved in regulating gene expression also maintain a higher percent identity than do sequences with no function.
COMPARATIVE GENOMICS Webb Miller, ú Kateryna D. Makova, ú Anton Nekrutenko, and ú Ross C. Hardison ú Annual Review of Genomics and Human GeneticsVol. 5: 15-56 (2004)
Yang & Nielsen,
Esimating Synonymous and Nonsynonymous Substitution Rates Under Realistic Evolutionary Models
Mol. Biol. Evol. 2000, 17:32-43
=>Other estimation Models
Reference
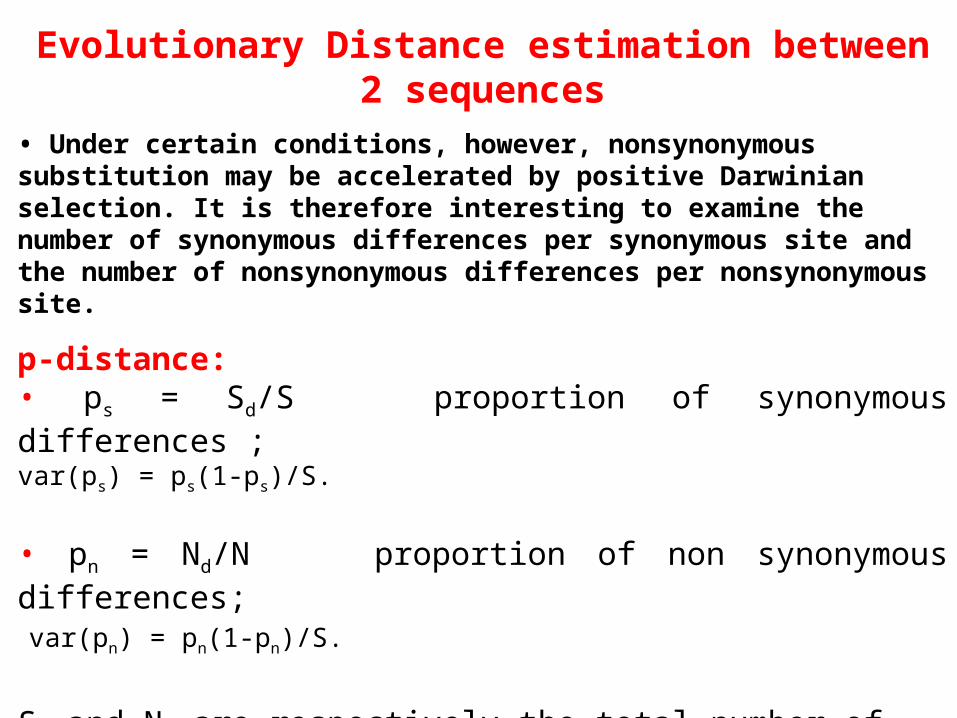
Evolutionary Distance estimation between 2 sequences• Under certain conditions, however, nonsynonymous substitution may be accelerated by positive Darwinian selection. It is therefore interesting to examine the number of synonymous differences per synonymous site and the number of nonsynonymous differences per nonsynonymous site.
p-distance:• ps = Sd/S proportion of synonymous differences ;var(ps) = ps(1-ps)/S.
• pn = Nd/N proportion of non synonymous differences;
var(pn) = pn(1-pn)/S.
Sd and Nd are respectively the total number of synonymous and non synonymous differences calculated over all codons. S and N are the numbers of synonymous and nonsynonymous substitutions.
S+N=n total number of nucleotides and N >> S.
ps is often denoted Ks and pn is denoted Ka.

Substitutions between protein sequences
p = nd/n
V(p)=p(1-p)/n
nd and n are the number of amino acid differences and the total number of amino acids compared.
However, refining estimates of the number of substitutions that have occurred between the amino acid sequences of 2 or more proteins is generally more difficult than the equivalent task for coding sequences (see paths above).
One solution is to weight each amino acid substitution differently by using empirical data from a variety of different protein comparisons to generate a matrix as the PAM matrix for example.

Number of synonymous (ds) and non synonymous (dn) substitutions per site
1) Jukes and Cantor, “one-parameter method” denoted “1-p” :
This model assumes that the rate of nucleotide substitution is the same for all pairs of the four nucleotides A, T, C and G (generally not true!).
d = -(3/4)*Ln(1-(4/3)*p) where p is either ps or pn.
2) Kimura's 2-parameter, denoted “2-p” :
The rate of transitional nucleotide substitution is often higher than that of transversional substitution.
d = -(1/2)*ln(1 -2*p -q) -(1/4)*Log(1 -2*q) p is the proportion of transitional differences,q is the proportion of transversional differencesp and q are respectively calculated over synonymous and non synonymous differences.

Juk es-Cantor model :A T C G
A - l l lT l - l lC l l - lG l l l - l is the rate of substitution.
Tajima-Nei model :A T C G
A − β g dT α − g dC α β - dG α β g - α, β, g an d dar e therates of substitution.
Ki mur a 2 -parameter s model :A T C G
A − β β αT β − α βC β α − β α a nd β ar e the ra tes of transitionalG α β β − and transvertiona l substitutions
Tamur a model :A T C G
A - (1 -q)β qβ qαT (1 -q)β - qα qβ α and β a re t he rates o f transitionalC (1 -q)β (1 -q)α - qβ and transvertiona l substitutionsG (1 -q)α (1 -q)β qβ - a nd q i s t he G+ C content.
Haseg awa e . t al model :A T C G
A - gTβ gCβ gGαT gAβ - gCα gGβ α and β a re t he rates o f transitionalC gAβ gTα - gGβ a nd transvertiona l substitutionsG gAα gTβ gCβ - and gi the nucleotide frequencies
(i=A,T, ,C G).
Tamur -a N ei model :A T C G
A - gTβ gCβ gGα1 α1 a nd α2 ar e the ra tes of transition al substitutions
T gAβ - gCα2 gGβ betwe en purines an d betwe en pyrimidi ;nesC gAβ gTα2 - gGβ β i s th e rat e o f transvertiona l substitutio ;nsG gAα1 gTβ gCβ - a nd gi t he nucleotid e frequencie s (i=A, ,T C,G).
Other distance models

• Example: yn00 in PAML.
• Protein sequences in a family
and corresponding DNA sequences

1. Alignment of a family protein sequences using clustalW
2. Alignment of corresponding DNA sequences using as template their corresponding amino acid alignment obtained in step 1
3. Format the DNA alignment in yn00 format
4. Perform yn00 program (PAML package) on the obtained DNA alignment
5. Clean the yn00 output to get YN (Yang & Nielsen) estimates in a file. Estimations with large standard errors were eliminated
6. From YN estimates extract gene pairs with w = dN/dS >= 3 and gene pairs with w<= 0.3, respectively.
7. Genes with w>=3 are considered as candidate genes on which positive selection may operate. Whereas genes with w<=0.3 are candidates for purifying (negative) selection
Procedure

S. cerevisiae: dS versus dN
0.0 0.5 1.0 1.5 2.0 2.5 3.0 3.5 4.0 4.5 5.0 5.5 6.00.00.51.01.52.02.53.03.54.04.55.05.56.06.57.07.5
dN
m std n min MaxdN 0.90 0.6 5085 0.0 4.98dS 2.96 1.3 5085 0.0 6.84w=dN/dS 0.34 0.32 5085 0.0 4.45
w=dN/dS >=3 3.6 0.57 10 3.0 4.45
• Most of the genes are under purifying selection
• Only few genes might be under positive selection

II. Evolutionary rate evaluation among orthologs and in-paralogs in SPOs
• Codeml (PAML) was applied to each SPO (see procedure).
• PAML: Phylogenetic Analysis by Maximum Likelihood (PAML) http://abacus.gene.ucl.ac.uk/software/paml.html (Recent doc : July 2007)
• Ziheng Yang & Rasmus Nielsen (2000)Estimating synonymous and nonsynonymous substitution rates under realistic evolutionary models. Mol Biol Evol. 17:32-43.
• Yang Z (2007). PAML 4: phylogenetic analysis by maximum likelihood. Mol Biol Evol. 24:1586-91.
Heger & Ponting (2007). Evolutionary rate analyses of orthologs and paralogs from 12 Drosophila genomes. Genome Res. 1837-49.

• Codeml pairwise comparisons (of SPO members) with the model:one dN/dS ratio and one Codon frequencies: F3x4 (codon position vs 4 base pairs) calculated from the multiple alignment of the SPO members. No correlation between sites was assumed, and a fixed transition/transversion ratio was considered.

1. Alignment of an SPO protein sequences using clustalW (default opt)
2. Alignment of corresponding DNA sequences using as template their corresponding amino acid alignment obtained in step 1
3. Convert the DNA alignment in codeml format
4. Perform codeml program on the obtained DNA alignment.
Estimates: dN, dS, dN/dS,….
5. Clean the codeml output to get estimates in a table form
6. Statistical analyses:
Exp: From Codeml estimates extract gene pairs with w = dN/dS >= 2
Procedure

Species phylogenetic tree based on dS rates
“Because silent substitution in coding DNA sequences do not lead to changes in the protein products, synonymous sites are under fewer evolutionary constraints than other coding sites, and hence more accurately reflect underlying neutral rates and the true evolutionary distance between genes” (Goodstadt and Ponting, 2006).
=> distances based on dS values should be more accurate than distances based on traditional amino acid substitutions as obtained when aligning concatenated orthologous genes.

Mean dS values calculated from 453 dS matrices corresponding to SPO11.1-1
11 CHMU 0.0000 1.1738 1.1728 30.5276 28.6699 30.9055 36.2626 36.3537 36.0999 36.1532 53.6803 CHTR 1.1738 0.0000 0.0048 31.3273 28.3891 30.6030 37.4417 37.4186 37.3462 37.3979 52.4822 CHTH 1.1728 0.0048 0.0000 30.9196 28.4772 30.8791 37.5375 37.5366 37.5035 37.5489 52.6565 CHAB 30.5276 31.3273 30.9196 0.0000 1.0536 1.0631 18.3224 18.3136 18.2304 18.2923 56.0756 CHCA 28.6699 28.3891 28.4772 1.0536 0.0000 0.9201 15.5996 15.7738 15.6075 15.6025 57.8310 CHFE 30.9055 30.6030 30.8791 1.0631 0.9201 0.0000 16.8963 16.9108 16.9969 16.8146 57.7664 CHPN 36.2626 37.4417 37.5375 18.3224 15.5996 16.8963 0.0000 0.0003 0.0003 0.0004 57.8077 CHPC 36.3537 37.4186 37.5366 18.3136 15.7738 16.9108 0.0003 0.0000 0.0006 0.0004 57.5464 CHPJ 36.0999 37.3462 37.5035 18.2304 15.6075 16.9969 0.0003 0.0006 0.0000 0.0007 57.3637 CHPT 36.1532 37.3979 37.5489 18.2923 15.6025 16.8146 0.0004 0.0004 0.0007 0.0000 57.3782 PAUW 53.6803 52.4822 52.6565 56.0756 57.8310 57.7664 57.8077 57.5464 57.3637 57.3782 0.0000

Neighbor-joining method +CHAB +-4 +--------5 +CHFE ! ! ! +CHCA +---------------6 ! ! +CHPJ ! ! ! ! +---------------7 +CHPN ! ! + -8 ! + -9 +CHPC ! ! ! +CHPT ! ! +CHMU 3---------------------2 ! ! +CHTR ! +-1 ! +CHTH ! +------------------------------------------- ---------------PAUW
Mean dS values calculated from 453 dS matrices corresponding to SPO11.1-1

• Codon volatility

A new concept: codons volatility (Plotkin et al. 2004. nature 428. p.942-945).
• Method recently introduced, the utility of which is still under debate;
• has interresting consequences on the study of codon variability;

Codons volatility
• The codon CGA encoding arginine (R), has 8 potential ancestor codons (i.e. non stop codon) that differ from CGA by one substitution.
• Volatility of a codon is defined as the proportion of nonsynonymous codons over the total neighbour sense codons obtained by a single substitution.
• The volatility of CGA = 4/8.
• The volatility of AGA also encodes an arginine = 6/8.
12 3
4
567
81
2 3
4
567
8
Plotkin et al. 2004.
Nature 428. p.942-945

Codon Volatility (simple substitution model):
Codons and volatility under simple substitution model

aa A R N D C Q E G H I L K M F P S T W Y V taa daa Vol G+C A+TA GCT 3 1 1 1 1 1 1 9 6 0.67 2 1A GCC 3 1 1 1 1 1 1 9 6 0.67 3 0A GCA 3 1 1 1 1 1 1 9 6 0.67 2 1A GCG 3 1 1 1 1 1 1 9 6 0.67 3 0R CGT 3 1 1 1 1 1 1 9 6 0.67 2 1R CGC 3 1 1 1 1 1 1 9 6 0.67 3 0R CGA 4 1 1 1 1 8 4 0.5 2 1R CGG 4 1 1 1 1 1 9 5 0.56 3 0R AGA 2 1 1 1 2 1 8 6 0.75 1 2R AGG 2 1 1 1 2 1 1 9 7 0.78 2 1N AAT 1 1 1 1 2 1 1 1 9 8 0.89 0 3N AAC 1 1 1 1 2 1 1 1 9 8 0.89 1 2D GAT 1 1 1 2 1 1 1 1 9 8 0.89 1 2D GAC 1 1 1 2 1 1 1 1 9 8 0.89 2 1C TGT 1 1 1 1 2 1 1 8 7 0.88 1 2C TGC 1 1 1 1 2 1 1 8 7 0.88 2 1Q CAA 1 1 1 2 1 1 1 8 7 0.88 1 2Q CAG 1 1 1 2 1 1 1 8 7 0.88 2 1E GAA 1 2 1 1 1 1 1 8 7 0.88 1 2E GAG 1 2 1 1 1 1 1 8 7 0.88 2 1G GGT 1 1 1 1 3 1 1 9 6 0.67 2 1G GGC 1 1 1 1 3 1 1 9 6 0.67 3 0G GGA 1 2 1 3 1 8 5 0.63 2 1G GGG 1 2 1 3 1 1 9 6 0.67 3 0H CAT 1 1 1 2 1 1 1 1 9 8 0.89 1 2H CAC 1 1 1 2 1 1 1 1 9 8 0.89 2 1I ATT 1 2 1 1 1 1 1 1 9 7 0.78 0 3I ATC 1 2 1 1 1 1 1 1 9 7 0.78 1 2I ATA 1 2 2 1 1 1 1 9 7 0.78 0 3L TTA 1 2 2 1 1 7 5 0.71 0 3L TTG 2 1 2 1 1 1 8 6 0.75 1 2L CTT 1 1 1 3 1 1 1 9 6 0.67 1 2L CTC 1 1 1 3 1 1 1 9 6 0.67 2 1L CTA 1 1 1 4 1 1 9 5 0.56 1 2L CTG 1 1 4 1 1 1 9 5 0.56 2 1K AAA 1 2 1 1 1 1 1 8 7 0.88 0 3K AAG 1 2 1 1 1 1 1 8 7 0.88 1 2M ATG 1 3 2 1 1 1 9 9 1. 1 2F TTT 1 1 3 1 1 1 1 9 8 0.89 0 3F TTC 1 1 3 1 1 1 1 9 8 0.89 1 2P CCT 1 1 1 1 3 1 1 9 6 0.67 2 1P CCC 1 1 1 1 3 1 1 9 6 0.67 3 0P CCA 1 1 1 1 3 1 1 9 6 0.67 2 1P CCG 1 1 1 1 3 1 1 9 6 0.67 3 0S TCT 1 1 1 1 3 1 1 9 6 0.67 1 2S TCC 1 1 1 1 3 1 1 9 6 0.67 2 1S TCA 1 1 1 3 1 7 4 0.57 1 2S TCG 1 1 1 3 1 1 8 5 0.63 2 1S AGT 3 1 1 1 1 1 1 9 8 0.89 1 2S AGC 3 1 1 1 1 1 1 9 8 0.89 2 1T ACT 1 1 1 1 2 3 9 6 0.67 1 2T ACC 1 1 1 1 2 3 9 6 0.67 2 1T ACA 1 1 1 1 1 1 3 9 6 0.67 1 2T ACG 1 1 1 1 1 1 3 9 6 0.67 2 1W TGG 2 2 1 1 1 7 7 1. 2 1Y TAT 1 1 1 1 1 1 1 7 6 0.86 0 3Y TAC 1 1 1 1 1 1 1 7 6 0.86 1 2V GTT 1 1 1 1 1 1 3 9 6 0.67 1 2V GTC 1 1 1 1 1 1 3 9 6 0.67 2 1V GTA 1 1 1 1 2 3 9 6 0.67 1 2V GTG 1 1 1 2 1 3 9 6 0.67 2 1Tot 36 54 18 18 18 18 18 36 18 27 54 18 9 18 36 54 36 9 18 36

References:• Ziheng Yang and Rasmus Nielsen (2000)Estimating synonymous and nonsynonymous substitution rates under realistic evolutionary models.Mol Biol Evol. 17:32-43.
• Yang Z. and Bielawski J.P. (2000)
Statistical methods for detecting molecular adaptation
Trends Ecol Evol. 15:496-503.• Phylogenetic Analysis by Maximum Likelihood (PAML) http://abacus.gene.ucl.ac.uk/software/paml.html
• Plotkin JB, Dushoff J, Fraser HB (2004)Detecting selection using a single genome sequence of M. tuberculosis and P. falciparum. Nature 428:942-5.
• Molecular Evolution; A phylogenetic Approach
Page, RDM and Holmes, EC (Blackwell Science, 2004)
• Sharp, PM & Li WH (1987). NAR 15:p.1281-1295.
References
• MEGA: http://www.megasoftware.net/
• PAML: http://abacus.gene.ucl.ac.uk/software/paml.html
• Fundamental concepts of Bioinformatics.
Dan E. Krane and Michael L. Raymer
• Genomes 2 edition. T.A. Brown
• Phylogeny programs :
http://evolution.genetics.washington.edu/phylip/sftware.html
Books:
• Molecular Evolution; A phylogenetic Approach
Page, RDM and Holmes, EC
Blackwell Science