Embed Size (px)
Citation preview
Molecular dynamics simulations of volumetric thermophysical properties of natural gases 417
Molecular dynamics simulations of volumetric thermophysical properties of natural gases
Santiago Aparicio and Mert Atilhan
X
Molecular dynamics simulations of volumetric thermophysical properties of natural gases
Santiago Aparicio1 and Mert Atilhan2
1Department of Chemistry. University of Burgos Spain
2Department of Chemical Engineering. Qatar University Qatar
1. Introduction
The accurate knowledge of thermophysical properties of natural gas mixtures is of great importance for practical purposes for the gas industry from exploration stages to final customer use (Jaescke et al., 2002; Wagner & Kleinrahm, 2004; Gallagher, 2006). Two main properties are required by the oil and natural gas industry: i) phase equilibria and ii) pressure–density–temperature (PρT) data. The large impact of PρT, volumetric, data on production, processing and transportation of natural gas is well–known (Hall & Holste, 1990; Husain, 1993; Wagner & Kleinrahm, 2004; Bluvshtein, 2007). Although the required accuracy for the considered properties varies depending on the purpose for which they are used (performance analysis or gas sales, Mokhatab et al. 2006), a high degree of accuracy is frequently required for most of the applications. Thermophysical properties of natural gas systems must be accurately known for national and international custody transfer considering that flowmeters measurements applied to custody transfer are used to buy and sell natural gas between pipeline companies. It should be remarked that custody transfer operations relies on accurate density data, and thus, the economic impact of accurate density measurements is very large both for the calculation of energy content of natural gas and for the flow rate obtained usually from orifice meters (which are used in about 90 % of the metering stations). Inaccuracies in density measurements may lead to very large economical losses or profits for gas producers or buyers, and thus, to conflicts between companies or even countries. Therefore, density values with accuracies below the 0.1 % level are commonly required. Experimental measurements using highly accurate densimeters, mainly magnetic suspension type, may lead to measurements with a level of uncertainty below the required 0.1 % limit (Wagner & Kleinrahm, 2004; Patil et al., 2007), and thus, this would be the best and most reliable option to obtain density data. Nevertheless, natural gas composition changes remarkably from one to other reservoir (because of age and deep), moreover, the advances in exploration and drilling technologies allow to explore and produce from non-conventional reservoirs (such as ultra-deep ones) which characteristics are very different to the traditional ones. Therefore, considering that to carry out experimental density
18
www.intechopen.com
Natural Gas418
measurements is very costly, both in time and economical resources, and having in mind that it is not possible to measure all possible compositions of natural gas in the wide pressure–temperature ranges required for production, transportation and processing purposes, thus, accurate predictive models are required by the gas industry. The current industrial standard model for custody transfer purposes is AGA8-DC92 (Starling & Savidge, 1992); this is a complex multiparametric equation of state which has been used for years as an international standard. Nevertheless, in spite of the common use of AGA8-DC92 in the gas industry it presents several problems. Any predictive model must be validated with reliable experimental data obtained on a limited number of samples that have well defined compositions. None of the samples used for the AGA8-DC92 validation are in the extended region, and thus, the application of this model for mixtures with large concentrations of CO2, N2, or long alkanes (as the natural gases from non-conventional reservoirs; Babusiaux, 2004) may be problematic. Moreover, the accuracy of AGA8-DC92 model decreases remarkably on going from region 1 (265 to 335 K, 0 to 12 MPa, deviations < 0.1 %) to regions 2 ( 12 to 17 MPa, 211 to 394 K, deviation < 0.3 %) and 3 (17 to 70 MPa, 144 to 477 K, deviation < 0.5 %) of model validity, and thus the model performance decreases remarkably when pressure and temperature increases. Recent studies have reported larger deviations than the claimed ones for AGA8-DC92 (Patil et al., 2007). Therefore, two main conclusions may be extracted: i) performance of AGA8-DC92 has to be systematically analyzed using a collection of carefully selected mixtures and ii) probably a new model has to be proposed as international standard for custody transfer and transmission purposes. Properties of natural gases, including PρT behavior, are a reflection of intermolecular forces rising by the simultaneous presence of very different types of molecules in these complex multicomponent fluids, and their evolution with pressure and temperature. Therefore macroscopic properties of these fluids, such as density, are a consequence of the microscopic structure and behavior of the involved molecules in the considered phases. These relationships between microscopic and macroscopic behavior may be developed through the principles of statistical mechanics if an accurate knowledge of the forces acting between the involved molecules were available. Hence, if we want to develop reliable and accurate models to predict natural gas density, we should get a deeper insight into the microscopic structure for complex gas mixtures and their relationships with PρT behavior. For this purpose, computational chemistry methods, mainly classical molecular dynamics and Monte Carlo approaches, are very useful tools allowing i) to infer microscopic structural and energetic features and ii) to predict macroscopic relevant properties, such as density, as a function of pressure and temperature. We report in this work a computational study in which the ability of classical molecular dynamics simulation methods to predict PρT behavior of complex natural gas mixtures is analyzed. Computational predictions are compared with available highly accurate experimental density data. The possibility of using this approach to predict density values with an acceptable degree of accuracy at moderate computational costs is analyzed, the weaknesses and strengths of the method together with possible future directions are considered.
2. Literature Review
A detailed analysis of the literature shows that the available studies on the use of molecular modelling with predictive purposes for thermophysical properties of natural gas like mixtures are scarce. We will not report here the available literature on the use of Gibbss ensemble Monte Carlo methods for the prediction of phase equilibria, both for pure compounds or for the involved binary mixtures, because this is not the object of this work. Moreover, most of the studies use Monte Carlo approach instead of the classical molecular dynamics methods proposed in this work. In this section, we will analyze the relevant studies available in the open literature in which computational methods, both classical molecular dynamics and Monte Carlo approaches, are used to predict thermophysical properties of natural gas mixtures. Results of literature analysis are reported in a chronological ordering. Saager and Fischer, 1989, reported a study on NVT molecular dynamics simulations of PVT and thermal properties of pure methane up to 1000 MPa. Duan et al., 1992, reported a wide study in which PVT properties of pure methane are predicted in the 273 – 2000 K and 100 – 20000 bar ranges using NVE molecular dynamics simulation methods together with a united atom approach. Results show deviations within the 1.5 % range. Yoshida & Uematsu, 1996, published a study reporting the results for the prediction of PVT properties of natural gases by Monte Carlo molecular simulation. They studied light mixtures composed by methane, ethane, propane, CO2 and N2 in the conditions of natural gas transportation in pipelines. They reported deviations lower than 1.5 % in pressure, although density prediction analysis is not carried out in a straightforward manner. Duan et al., 1996, used molecular dynamics to simulate the PVT properties of the ternary mixture methane + CO2 + N2, leading to results with low deviations compared with the general equation of state proposed by the authors. Neubauer et al., 1999, reported a study in which NPT Monte Carlo method was applied for the simulation of volumetric properties of natural gas mixtures, both in the single phase and two – phase conditions. A united atom approach was used leading to density deviations up to 5 % in the high pressure region, decreasing with decreasing pressure and increasing temperature. These too large deviations, that obviously hinder the application of the proposed method with purely predictive purposes, are a consequence of the poor representation of the composition of the gas during the simulation. Errington et al., 1999, reported a NPT Monte Carlo study on the properties of the n-alkanes homologous series, developing a united atom intermolecular potential and showing its validity for alkanes up to C78. Saturated densities are predicted within a 2 % limit and liquid densities for the longer n-alkanes to 1 %. Dysthe et al., 1999, used equilibrium molecular dynamics together with the Green-Kubo formalism to predict transport coefficients of multicomponent natural gas like mixtures including alkanes up to C4 , N2 and He, both in the gas and liquid phases. Simulations were performed in the NVT ensemble with a united atom approach for alkanes leading to viscosity deviations of 7 % and 11 % for the gaseous and liquid states, respectively. Escobedo and Chen, 2001, developed a NPT Monte Carlo study for the prediction of Joule – Thomson inversion curves for several fluids, including pure methane and a gas condensate mixture (with alkanes up to C7), leading to reliable predictions.
www.intechopen.com
Molecular dynamics simulations of volumetric thermophysical properties of natural gases 419
measurements is very costly, both in time and economical resources, and having in mind that it is not possible to measure all possible compositions of natural gas in the wide pressure–temperature ranges required for production, transportation and processing purposes, thus, accurate predictive models are required by the gas industry. The current industrial standard model for custody transfer purposes is AGA8-DC92 (Starling & Savidge, 1992); this is a complex multiparametric equation of state which has been used for years as an international standard. Nevertheless, in spite of the common use of AGA8-DC92 in the gas industry it presents several problems. Any predictive model must be validated with reliable experimental data obtained on a limited number of samples that have well defined compositions. None of the samples used for the AGA8-DC92 validation are in the extended region, and thus, the application of this model for mixtures with large concentrations of CO2, N2, or long alkanes (as the natural gases from non-conventional reservoirs; Babusiaux, 2004) may be problematic. Moreover, the accuracy of AGA8-DC92 model decreases remarkably on going from region 1 (265 to 335 K, 0 to 12 MPa, deviations < 0.1 %) to regions 2 ( 12 to 17 MPa, 211 to 394 K, deviation < 0.3 %) and 3 (17 to 70 MPa, 144 to 477 K, deviation < 0.5 %) of model validity, and thus the model performance decreases remarkably when pressure and temperature increases. Recent studies have reported larger deviations than the claimed ones for AGA8-DC92 (Patil et al., 2007). Therefore, two main conclusions may be extracted: i) performance of AGA8-DC92 has to be systematically analyzed using a collection of carefully selected mixtures and ii) probably a new model has to be proposed as international standard for custody transfer and transmission purposes. Properties of natural gases, including PρT behavior, are a reflection of intermolecular forces rising by the simultaneous presence of very different types of molecules in these complex multicomponent fluids, and their evolution with pressure and temperature. Therefore macroscopic properties of these fluids, such as density, are a consequence of the microscopic structure and behavior of the involved molecules in the considered phases. These relationships between microscopic and macroscopic behavior may be developed through the principles of statistical mechanics if an accurate knowledge of the forces acting between the involved molecules were available. Hence, if we want to develop reliable and accurate models to predict natural gas density, we should get a deeper insight into the microscopic structure for complex gas mixtures and their relationships with PρT behavior. For this purpose, computational chemistry methods, mainly classical molecular dynamics and Monte Carlo approaches, are very useful tools allowing i) to infer microscopic structural and energetic features and ii) to predict macroscopic relevant properties, such as density, as a function of pressure and temperature. We report in this work a computational study in which the ability of classical molecular dynamics simulation methods to predict PρT behavior of complex natural gas mixtures is analyzed. Computational predictions are compared with available highly accurate experimental density data. The possibility of using this approach to predict density values with an acceptable degree of accuracy at moderate computational costs is analyzed, the weaknesses and strengths of the method together with possible future directions are considered.
2. Literature Review
A detailed analysis of the literature shows that the available studies on the use of molecular modelling with predictive purposes for thermophysical properties of natural gas like mixtures are scarce. We will not report here the available literature on the use of Gibbss ensemble Monte Carlo methods for the prediction of phase equilibria, both for pure compounds or for the involved binary mixtures, because this is not the object of this work. Moreover, most of the studies use Monte Carlo approach instead of the classical molecular dynamics methods proposed in this work. In this section, we will analyze the relevant studies available in the open literature in which computational methods, both classical molecular dynamics and Monte Carlo approaches, are used to predict thermophysical properties of natural gas mixtures. Results of literature analysis are reported in a chronological ordering. Saager and Fischer, 1989, reported a study on NVT molecular dynamics simulations of PVT and thermal properties of pure methane up to 1000 MPa. Duan et al., 1992, reported a wide study in which PVT properties of pure methane are predicted in the 273 – 2000 K and 100 – 20000 bar ranges using NVE molecular dynamics simulation methods together with a united atom approach. Results show deviations within the 1.5 % range. Yoshida & Uematsu, 1996, published a study reporting the results for the prediction of PVT properties of natural gases by Monte Carlo molecular simulation. They studied light mixtures composed by methane, ethane, propane, CO2 and N2 in the conditions of natural gas transportation in pipelines. They reported deviations lower than 1.5 % in pressure, although density prediction analysis is not carried out in a straightforward manner. Duan et al., 1996, used molecular dynamics to simulate the PVT properties of the ternary mixture methane + CO2 + N2, leading to results with low deviations compared with the general equation of state proposed by the authors. Neubauer et al., 1999, reported a study in which NPT Monte Carlo method was applied for the simulation of volumetric properties of natural gas mixtures, both in the single phase and two – phase conditions. A united atom approach was used leading to density deviations up to 5 % in the high pressure region, decreasing with decreasing pressure and increasing temperature. These too large deviations, that obviously hinder the application of the proposed method with purely predictive purposes, are a consequence of the poor representation of the composition of the gas during the simulation. Errington et al., 1999, reported a NPT Monte Carlo study on the properties of the n-alkanes homologous series, developing a united atom intermolecular potential and showing its validity for alkanes up to C78. Saturated densities are predicted within a 2 % limit and liquid densities for the longer n-alkanes to 1 %. Dysthe et al., 1999, used equilibrium molecular dynamics together with the Green-Kubo formalism to predict transport coefficients of multicomponent natural gas like mixtures including alkanes up to C4 , N2 and He, both in the gas and liquid phases. Simulations were performed in the NVT ensemble with a united atom approach for alkanes leading to viscosity deviations of 7 % and 11 % for the gaseous and liquid states, respectively. Escobedo and Chen, 2001, developed a NPT Monte Carlo study for the prediction of Joule – Thomson inversion curves for several fluids, including pure methane and a gas condensate mixture (with alkanes up to C7), leading to reliable predictions.
www.intechopen.com
Natural Gas420
Lagache et al., 2001, reported a study in which NPT Monte Carlo simulations were performed to compute second order derivatives of the Gibbs energy for simple alkanes up to butane and for the methane – ethane binary mixture. The authors used a united atom potential. Results show that predicted data are in fair agreement with experimental values, even for complex properties such as Joule – Thomson coefficient for which deviations below the 10 % are obtained. Ungerer, 2003, reported a wide review in which the use of Monte Carlo and molecular dynamics methods is analyzed for several relevant fields in the petroleum and gas industry. Lagache et al., 2004, reported a study in which NPT Monte Carlo was used for the prediction of density and other relevant properties (thermal expansivity, isothermal compressibility, isobaric heat capacity and Joule – Thomson coefficient) of methane, ethane and two mixtures including heavy components up to 35 carbon atoms. The authors use a united atom approach to model the involved molecules. Density, and compressibility factor, show deviations up to 3 %, whereas for the remaining studied properties deviations are lower than 10 %. The authors show the importance of the mixtures characterization and representation to obtain accurate results. Ungerer et al., 2004, reported a NPT Monte Carlo study on the prediction of relevant properties, including density, for H2S – rich gases, showing that although reported results provide valuable information on the understanding of the complex mixed fluids, this computational approach does not lead to the high accuracy required for process design purposes for the studied acid gases. Ungerer et al. (Ungerer et al., 2006; Ungerer et al., 2006) reported a wide and useful study on the application of Monte Carlo methods for oil and gas production and processing purposes. They showed some of the results previously reported by Lagache et al., 2004, and claimed again to the remarkable importance of an adequate characterization of studied mixtures to obtain accurate results for single phase and equilibria properties. Bessieres et al., 2006, reported a study in which NPT Monte Carlo simulations were used to predict the Joule–Thomson inversion curve of pure methane using and united atom approach. Results show very accurate predictions with deviations below the 1 % limit. Vrabec et al., 2007, carried out a study on the performance of molecular simulation methods for the prediction of Joule–Thomson inversion curves for light natural gas mixtures. Reported results show deviations usually within the 5 % range, larger for high temperatures, but being competitive with most state-of-the-art EOS in predicting Joule - Thomson inversion curves. In a review work, Ungerer et al., 2007, analyzed the weaknesses and strengths of using molecular simulation for the predication of thermophysical properties of complex fluids, including natural gas like mixtures. The authors claim that one of the main limitations of the computational approach is the availability of potentials and force field parameters tested in wide pressure–temperature ranges. The main conclusions obtained from the analysis of the available open literature are: i) Monte Carlo approach is used in an exclusive basis when thermophysical properties of natural gas mixtures are under study. ii) United atom potentials are the most common option. iii) Studies in wide pressure–temperature ranges and for multicomponent mixtures are very scarce, and thus the performance of the proposed approaches is not clear.
Thus, in this work we report results using the molecular dynamics approach, all-atoms potential, and analysis in wide P-T ranges for selected pure and mixed fluids. This methodology was considered because of the absence of similar studies in the open literature to analyze its validity for natural gas industry production, transportation and processing purposes.
3. Computational Methods
Classical molecular dynamics simulations were carried out using the TINKER molecular modeling package (Ponder, 2004). All simulations were performed in the NPT ensemble; the Nosé–Hoover method (Hoover, 1985) was used to control the temperature and pressure of the simulation system. The motion equations were solved using the Verlet Leapfrog integration algorithm (Allen & Tildesley, 1989). Long-range electrostatic interactions were treated with the smooth particle mesh Ewald method (Essmann, 1995). The simulated systems consist of cubic boxes, with the number of molecules and compositions, for mixed fluids, reported in Table 1, to which periodic boundary conditions were applied in the three directions to simulate an infinite system. The composition of the mixed fluid selected to test the performance of the computational approach for multicomponent natural gas–like mixtures resembles the one reported by Patil et al., 2007, for which very accurate and reliable density data obtained through magnetic suspension densitometers are reported. The number of molecules used for the simulation of pure compounds was selected to obtain systems with 4000 – 5000 total atoms leading to reasonable computing times. For the mixture we have selected a total number of molecules (1000) that allow the representation of all the involved species, even those that appear at very low mole fraction but which effect on the mixed fluid behavior is important. The simulations were performed using a cutoff radius of L/2 Å for the non bonded interactions, L being the initial box side. Initial boxes generated using the PACKMOL program (Martínez & Martínez, 2005) were minimized according to the MINIMIZE program in TINKER package to a 0.01 kcal mol-1 Å-1 rms gradient. Long simulation times are needed for computing the properties of these fluids and procedures have to be designed carefully to avoid the presence of local minima. Therefore several heating and quenching steps in the NVT ensemble up to 600 K were performed after which a 100 ps NVT equilibration molecular dynamics simulation was run at the studied temperature; finally, from the output NVT simulation configuration, a run of 1 ns (time step 1 fs) in the NPT ensemble at the studied pressure and temperature was run, from which the first 0.5 ns were used to ensure equilibration (checked through constant energy) and the remaining 0.5 ns for data collection. n-Alkanes were described according to the so called Optimized Potential for Liquid Simulations (all atom version) OPLS–AA (Jorgensen et al., 1996), eqs. 1-4. Parameters for CO2 and N2 were obtained from the literature (Shi & Maginn, 2008; Lagache et al., 2005), with bonds, angles and non-bonded interactions treated using eqs. 1,2 and 4. A Lennard- Jones 6-12 potential, eq. 4, was used to describe the interactions between sites which are separated more than three bonds, if they are in the same molecule (intramolecular interactions), and for interactions between sites belonging to different molecules (intermolecular interactions). Non-bonded interactions between 1-4 sites are scaled with a 0.5 factor. Lorentz-Berthelot mixing rules are applied for Lennard–Jones terms between different sites, eqs. 5-6. The used forcefield parameters are reported in Table 2.
www.intechopen.com
Molecular dynamics simulations of volumetric thermophysical properties of natural gases 421
Lagache et al., 2001, reported a study in which NPT Monte Carlo simulations were performed to compute second order derivatives of the Gibbs energy for simple alkanes up to butane and for the methane – ethane binary mixture. The authors used a united atom potential. Results show that predicted data are in fair agreement with experimental values, even for complex properties such as Joule – Thomson coefficient for which deviations below the 10 % are obtained. Ungerer, 2003, reported a wide review in which the use of Monte Carlo and molecular dynamics methods is analyzed for several relevant fields in the petroleum and gas industry. Lagache et al., 2004, reported a study in which NPT Monte Carlo was used for the prediction of density and other relevant properties (thermal expansivity, isothermal compressibility, isobaric heat capacity and Joule – Thomson coefficient) of methane, ethane and two mixtures including heavy components up to 35 carbon atoms. The authors use a united atom approach to model the involved molecules. Density, and compressibility factor, show deviations up to 3 %, whereas for the remaining studied properties deviations are lower than 10 %. The authors show the importance of the mixtures characterization and representation to obtain accurate results. Ungerer et al., 2004, reported a NPT Monte Carlo study on the prediction of relevant properties, including density, for H2S – rich gases, showing that although reported results provide valuable information on the understanding of the complex mixed fluids, this computational approach does not lead to the high accuracy required for process design purposes for the studied acid gases. Ungerer et al. (Ungerer et al., 2006; Ungerer et al., 2006) reported a wide and useful study on the application of Monte Carlo methods for oil and gas production and processing purposes. They showed some of the results previously reported by Lagache et al., 2004, and claimed again to the remarkable importance of an adequate characterization of studied mixtures to obtain accurate results for single phase and equilibria properties. Bessieres et al., 2006, reported a study in which NPT Monte Carlo simulations were used to predict the Joule–Thomson inversion curve of pure methane using and united atom approach. Results show very accurate predictions with deviations below the 1 % limit. Vrabec et al., 2007, carried out a study on the performance of molecular simulation methods for the prediction of Joule–Thomson inversion curves for light natural gas mixtures. Reported results show deviations usually within the 5 % range, larger for high temperatures, but being competitive with most state-of-the-art EOS in predicting Joule - Thomson inversion curves. In a review work, Ungerer et al., 2007, analyzed the weaknesses and strengths of using molecular simulation for the predication of thermophysical properties of complex fluids, including natural gas like mixtures. The authors claim that one of the main limitations of the computational approach is the availability of potentials and force field parameters tested in wide pressure–temperature ranges. The main conclusions obtained from the analysis of the available open literature are: i) Monte Carlo approach is used in an exclusive basis when thermophysical properties of natural gas mixtures are under study. ii) United atom potentials are the most common option. iii) Studies in wide pressure–temperature ranges and for multicomponent mixtures are very scarce, and thus the performance of the proposed approaches is not clear.
Thus, in this work we report results using the molecular dynamics approach, all-atoms potential, and analysis in wide P-T ranges for selected pure and mixed fluids. This methodology was considered because of the absence of similar studies in the open literature to analyze its validity for natural gas industry production, transportation and processing purposes.
3. Computational Methods
Classical molecular dynamics simulations were carried out using the TINKER molecular modeling package (Ponder, 2004). All simulations were performed in the NPT ensemble; the Nosé–Hoover method (Hoover, 1985) was used to control the temperature and pressure of the simulation system. The motion equations were solved using the Verlet Leapfrog integration algorithm (Allen & Tildesley, 1989). Long-range electrostatic interactions were treated with the smooth particle mesh Ewald method (Essmann, 1995). The simulated systems consist of cubic boxes, with the number of molecules and compositions, for mixed fluids, reported in Table 1, to which periodic boundary conditions were applied in the three directions to simulate an infinite system. The composition of the mixed fluid selected to test the performance of the computational approach for multicomponent natural gas–like mixtures resembles the one reported by Patil et al., 2007, for which very accurate and reliable density data obtained through magnetic suspension densitometers are reported. The number of molecules used for the simulation of pure compounds was selected to obtain systems with 4000 – 5000 total atoms leading to reasonable computing times. For the mixture we have selected a total number of molecules (1000) that allow the representation of all the involved species, even those that appear at very low mole fraction but which effect on the mixed fluid behavior is important. The simulations were performed using a cutoff radius of L/2 Å for the non bonded interactions, L being the initial box side. Initial boxes generated using the PACKMOL program (Martínez & Martínez, 2005) were minimized according to the MINIMIZE program in TINKER package to a 0.01 kcal mol-1 Å-1 rms gradient. Long simulation times are needed for computing the properties of these fluids and procedures have to be designed carefully to avoid the presence of local minima. Therefore several heating and quenching steps in the NVT ensemble up to 600 K were performed after which a 100 ps NVT equilibration molecular dynamics simulation was run at the studied temperature; finally, from the output NVT simulation configuration, a run of 1 ns (time step 1 fs) in the NPT ensemble at the studied pressure and temperature was run, from which the first 0.5 ns were used to ensure equilibration (checked through constant energy) and the remaining 0.5 ns for data collection. n-Alkanes were described according to the so called Optimized Potential for Liquid Simulations (all atom version) OPLS–AA (Jorgensen et al., 1996), eqs. 1-4. Parameters for CO2 and N2 were obtained from the literature (Shi & Maginn, 2008; Lagache et al., 2005), with bonds, angles and non-bonded interactions treated using eqs. 1,2 and 4. A Lennard- Jones 6-12 potential, eq. 4, was used to describe the interactions between sites which are separated more than three bonds, if they are in the same molecule (intramolecular interactions), and for interactions between sites belonging to different molecules (intermolecular interactions). Non-bonded interactions between 1-4 sites are scaled with a 0.5 factor. Lorentz-Berthelot mixing rules are applied for Lennard–Jones terms between different sites, eqs. 5-6. The used forcefield parameters are reported in Table 2.
www.intechopen.com
Natural Gas422
2 bonds
eqrbond rrkE (1)
2 angles
eqθangle θθkE (2)
3cos12
2cos12
cos12
321 VVVEbond (3)
i j ij
ij
ij
ijij
ij
jinonbonded rrr
eqqE 6
6
12
122
4
(4)
2
jiij
(5)
jiij (6)
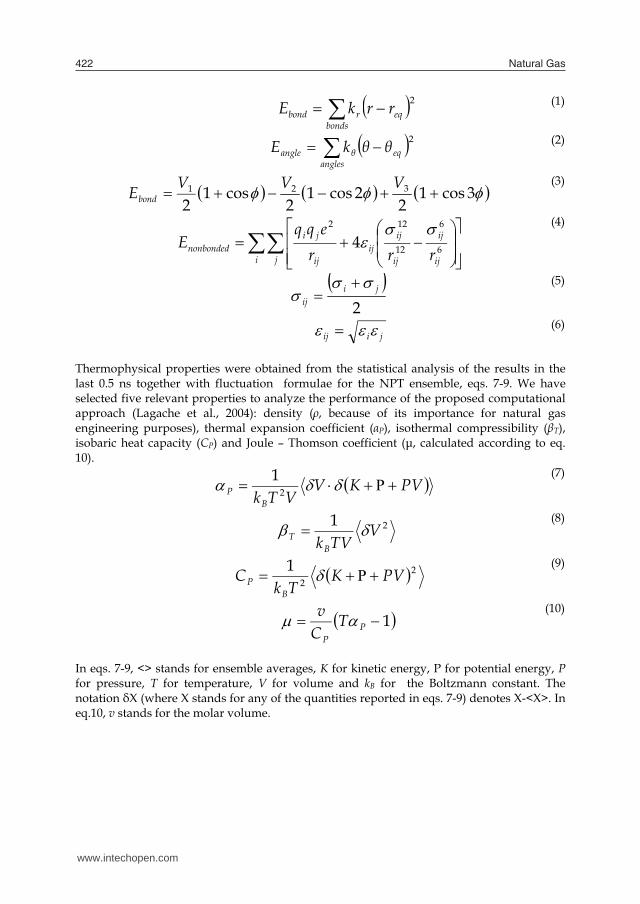
Thermophysical properties were obtained from the statistical analysis of the results in the last 0.5 ns together with fluctuation formulae for the NPT ensemble, eqs. 7-9. We have selected five relevant properties to analyze the performance of the proposed computational approach (Lagache et al., 2004): density (ρ, because of its importance for natural gas engineering purposes), thermal expansion coefficient (αP), isothermal compressibility (βT), isobaric heat capacity (CP) and Joule – Thomson coefficient (μ, calculated according to eq. 10).
PVKVVTkB
P 21
(7)
21 VTVkB
T (8)
22
1 PVKTk
CB
P (9)
1 PP
TCv
(10)
In eqs. 7-9, <> stands for ensemble averages, K for kinetic energy, P for potential energy, P for pressure, T for temperature, V for volume and kB for the Boltzmann constant. The notation δX (where X stands for any of the quantities reported in eqs. 7-9) denotes X-<X>. In eq.10, v stands for the molar volume.
Pure fluids simulations Mixed fluid simulations
Component N Experimental mole fraction
(Patil et al., 2007) N Mole
fraction Methane 1000 0.90991 910 0.91000 Ethane 500 0.02949 29 0.02900 Propane 500 0.01513 15 0.01500 i-Butane 300 0.00755 8 0.00800 n-Butane 300 0.00755 8 0.00800 i-Pentane 300 0.00299 3 0.00300 n-Pentane 300 0.00304 3 0.00300 CO2 1000 0.02031 20 0.02000 N2 1000 0.00403 4 0.00400
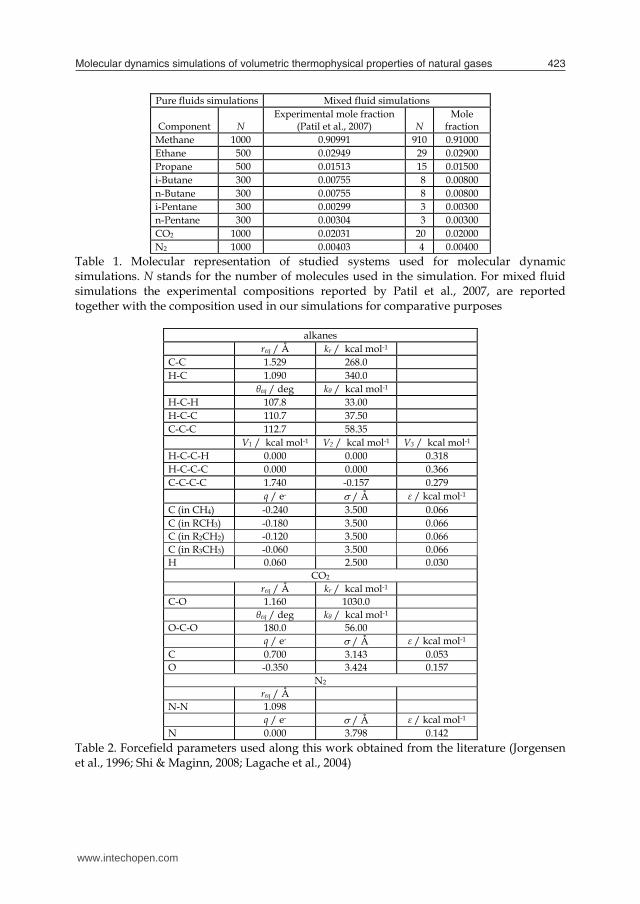
Table 1. Molecular representation of studied systems used for molecular dynamic simulations. N stands for the number of molecules used in the simulation. For mixed fluid simulations the experimental compositions reported by Patil et al., 2007, are reported together with the composition used in our simulations for comparative purposes
alkanes req / Å kr / kcal mol-1 C-C 1.529 268.0 H-C 1.090 340.0 θeq / deg kθ / kcal mol-1 H-C-H 107.8 33.00 H-C-C 110.7 37.50 C-C-C 112.7 58.35 V1 / kcal mol-1 V2 / kcal mol-1 V3 / kcal mol-1 H-C-C-H 0.000 0.000 0.318 H-C-C-C 0.000 0.000 0.366 C-C-C-C 1.740 -0.157 0.279 q / e- / Å ε / kcal mol-1
C (in CH4) -0.240 3.500 0.066 C (in RCH3) -0.180 3.500 0.066 C (in R2CH2) -0.120 3.500 0.066 C (in R3CH3) -0.060 3.500 0.066 H 0.060 2.500 0.030
CO2 req / Å kr / kcal mol-1 C-O 1.160 1030.0 θeq / deg kθ / kcal mol-1 O-C-O 180.0 56.00 q / e- / Å ε / kcal mol-1
C 0.700 3.143 0.053 O -0.350 3.424 0.157
N2 req / Å N-N 1.098 q / e- / Å ε / kcal mol-1
N 0.000 3.798 0.142 Table 2. Forcefield parameters used along this work obtained from the literature (Jorgensen et al., 1996; Shi & Maginn, 2008; Lagache et al., 2004)
www.intechopen.com
Molecular dynamics simulations of volumetric thermophysical properties of natural gases 423
2 bonds
eqrbond rrkE (1)
2 angles
eqθangle θθkE (2)
3cos12
2cos12
cos12
321 VVVEbond (3)
i j ij
ij
ij
ijij
ij
jinonbonded rrr
eqqE 6
6
12
122
4
(4)
2
jiij
(5)
jiij (6)
Thermophysical properties were obtained from the statistical analysis of the results in the last 0.5 ns together with fluctuation formulae for the NPT ensemble, eqs. 7-9. We have selected five relevant properties to analyze the performance of the proposed computational approach (Lagache et al., 2004): density (ρ, because of its importance for natural gas engineering purposes), thermal expansion coefficient (αP), isothermal compressibility (βT), isobaric heat capacity (CP) and Joule – Thomson coefficient (μ, calculated according to eq. 10).
PVKVVTkB
P 21
(7)
21 VTVkB
T (8)
22
1 PVKTk
CB
P (9)
1 PP
TCv
(10)
In eqs. 7-9, <> stands for ensemble averages, K for kinetic energy, P for potential energy, P for pressure, T for temperature, V for volume and kB for the Boltzmann constant. The notation δX (where X stands for any of the quantities reported in eqs. 7-9) denotes X-<X>. In eq.10, v stands for the molar volume.
Pure fluids simulations Mixed fluid simulations
Component N Experimental mole fraction
(Patil et al., 2007) N Mole
fraction Methane 1000 0.90991 910 0.91000 Ethane 500 0.02949 29 0.02900 Propane 500 0.01513 15 0.01500 i-Butane 300 0.00755 8 0.00800 n-Butane 300 0.00755 8 0.00800 i-Pentane 300 0.00299 3 0.00300 n-Pentane 300 0.00304 3 0.00300 CO2 1000 0.02031 20 0.02000 N2 1000 0.00403 4 0.00400
Table 1. Molecular representation of studied systems used for molecular dynamic simulations. N stands for the number of molecules used in the simulation. For mixed fluid simulations the experimental compositions reported by Patil et al., 2007, are reported together with the composition used in our simulations for comparative purposes
alkanes req / Å kr / kcal mol-1 C-C 1.529 268.0 H-C 1.090 340.0 θeq / deg kθ / kcal mol-1 H-C-H 107.8 33.00 H-C-C 110.7 37.50 C-C-C 112.7 58.35 V1 / kcal mol-1 V2 / kcal mol-1 V3 / kcal mol-1 H-C-C-H 0.000 0.000 0.318 H-C-C-C 0.000 0.000 0.366 C-C-C-C 1.740 -0.157 0.279 q / e- / Å ε / kcal mol-1
C (in CH4) -0.240 3.500 0.066 C (in RCH3) -0.180 3.500 0.066 C (in R2CH2) -0.120 3.500 0.066 C (in R3CH3) -0.060 3.500 0.066 H 0.060 2.500 0.030
CO2 req / Å kr / kcal mol-1 C-O 1.160 1030.0 θeq / deg kθ / kcal mol-1 O-C-O 180.0 56.00 q / e- / Å ε / kcal mol-1
C 0.700 3.143 0.053 O -0.350 3.424 0.157
N2 req / Å N-N 1.098 q / e- / Å ε / kcal mol-1
N 0.000 3.798 0.142 Table 2. Forcefield parameters used along this work obtained from the literature (Jorgensen et al., 1996; Shi & Maginn, 2008; Lagache et al., 2004)
www.intechopen.com
Natural Gas424
4. Molecular Dynamics Simulations Results
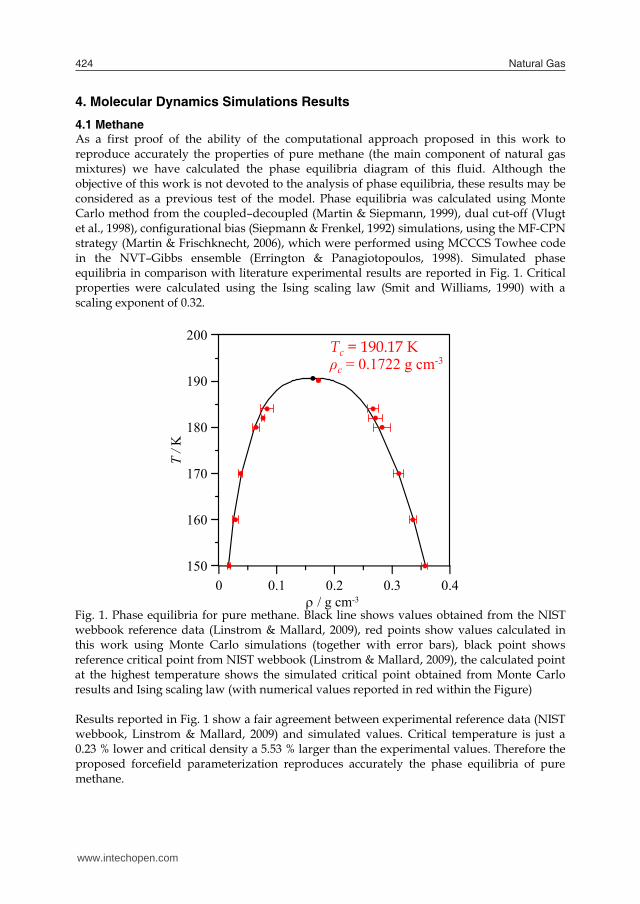
4.1 Methane As a first proof of the ability of the computational approach proposed in this work to reproduce accurately the properties of pure methane (the main component of natural gas mixtures) we have calculated the phase equilibria diagram of this fluid. Although the objective of this work is not devoted to the analysis of phase equilibria, these results may be considered as a previous test of the model. Phase equilibria was calculated using Monte Carlo method from the coupled–decoupled (Martin & Siepmann, 1999), dual cut-off (Vlugt et al., 1998), configurational bias (Siepmann & Frenkel, 1992) simulations, using the MF-CPN strategy (Martin & Frischknecht, 2006), which were performed using MCCCS Towhee code in the NVT–Gibbs ensemble (Errington & Panagiotopoulos, 1998). Simulated phase equilibria in comparison with literature experimental results are reported in Fig. 1. Critical properties were calculated using the Ising scaling law (Smit and Williams, 1990) with a scaling exponent of 0.32. Fig. 1. Phase equilibria for pure methane. Black line shows values obtained from the NIST webbook reference data (Linstrom & Mallard, 2009), red points show values calculated in this work using Monte Carlo simulations (together with error bars), black point shows reference critical point from NIST webbook (Linstrom & Mallard, 2009), the calculated point at the highest temperature shows the simulated critical point obtained from Monte Carlo results and Ising scaling law (with numerical values reported in red within the Figure) Results reported in Fig. 1 show a fair agreement between experimental reference data (NIST webbook, Linstrom & Mallard, 2009) and simulated values. Critical temperature is just a 0.23 % lower and critical density a 5.53 % larger than the experimental values. Therefore the proposed forcefield parameterization reproduces accurately the phase equilibria of pure methane.
0 0.1 0.2 0.3 0.4/ g cm-3
150
160
170
180
190
200
T / K
Tc = 190.17 Kρc = 0.1722 g cm-3
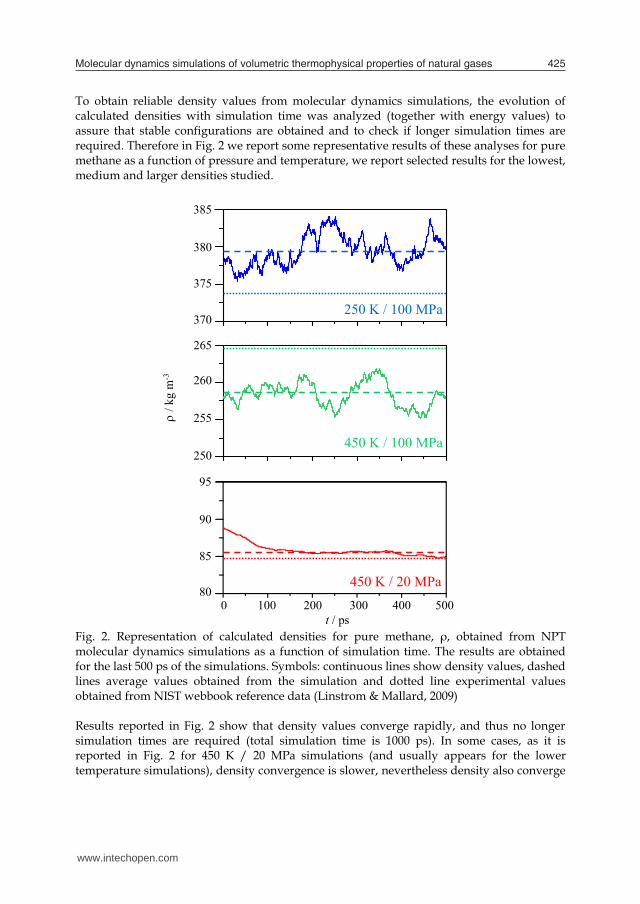
To obtain reliable density values from molecular dynamics simulations, the evolution of calculated densities with simulation time was analyzed (together with energy values) to assure that stable configurations are obtained and to check if longer simulation times are required. Therefore in Fig. 2 we report some representative results of these analyses for pure methane as a function of pressure and temperature, we report selected results for the lowest, medium and larger densities studied. Fig. 2. Representation of calculated densities for pure methane, ρ, obtained from NPT molecular dynamics simulations as a function of simulation time. The results are obtained for the last 500 ps of the simulations. Symbols: continuous lines show density values, dashed lines average values obtained from the simulation and dotted line experimental values obtained from NIST webbook reference data (Linstrom & Mallard, 2009) Results reported in Fig. 2 show that density values converge rapidly, and thus no longer simulation times are required (total simulation time is 1000 ps). In some cases, as it is reported in Fig. 2 for 450 K / 20 MPa simulations (and usually appears for the lower temperature simulations), density convergence is slower, nevertheless density also converge
0 100 200 300 400 500t / ps
95
90
85
80
/ kg
m-3
385
380
375
370
265
260
255
250
450 K / 20 MPa
450 K / 100 MPa
250 K / 100 MPa
www.intechopen.com
Molecular dynamics simulations of volumetric thermophysical properties of natural gases 425
4. Molecular Dynamics Simulations Results
4.1 Methane As a first proof of the ability of the computational approach proposed in this work to reproduce accurately the properties of pure methane (the main component of natural gas mixtures) we have calculated the phase equilibria diagram of this fluid. Although the objective of this work is not devoted to the analysis of phase equilibria, these results may be considered as a previous test of the model. Phase equilibria was calculated using Monte Carlo method from the coupled–decoupled (Martin & Siepmann, 1999), dual cut-off (Vlugt et al., 1998), configurational bias (Siepmann & Frenkel, 1992) simulations, using the MF-CPN strategy (Martin & Frischknecht, 2006), which were performed using MCCCS Towhee code in the NVT–Gibbs ensemble (Errington & Panagiotopoulos, 1998). Simulated phase equilibria in comparison with literature experimental results are reported in Fig. 1. Critical properties were calculated using the Ising scaling law (Smit and Williams, 1990) with a scaling exponent of 0.32. Fig. 1. Phase equilibria for pure methane. Black line shows values obtained from the NIST webbook reference data (Linstrom & Mallard, 2009), red points show values calculated in this work using Monte Carlo simulations (together with error bars), black point shows reference critical point from NIST webbook (Linstrom & Mallard, 2009), the calculated point at the highest temperature shows the simulated critical point obtained from Monte Carlo results and Ising scaling law (with numerical values reported in red within the Figure) Results reported in Fig. 1 show a fair agreement between experimental reference data (NIST webbook, Linstrom & Mallard, 2009) and simulated values. Critical temperature is just a 0.23 % lower and critical density a 5.53 % larger than the experimental values. Therefore the proposed forcefield parameterization reproduces accurately the phase equilibria of pure methane.
0 0.1 0.2 0.3 0.4/ g cm-3
150
160
170
180
190
200
T / K
Tc = 190.17 Kρc = 0.1722 g cm-3
To obtain reliable density values from molecular dynamics simulations, the evolution of calculated densities with simulation time was analyzed (together with energy values) to assure that stable configurations are obtained and to check if longer simulation times are required. Therefore in Fig. 2 we report some representative results of these analyses for pure methane as a function of pressure and temperature, we report selected results for the lowest, medium and larger densities studied. Fig. 2. Representation of calculated densities for pure methane, ρ, obtained from NPT molecular dynamics simulations as a function of simulation time. The results are obtained for the last 500 ps of the simulations. Symbols: continuous lines show density values, dashed lines average values obtained from the simulation and dotted line experimental values obtained from NIST webbook reference data (Linstrom & Mallard, 2009) Results reported in Fig. 2 show that density values converge rapidly, and thus no longer simulation times are required (total simulation time is 1000 ps). In some cases, as it is reported in Fig. 2 for 450 K / 20 MPa simulations (and usually appears for the lower temperature simulations), density convergence is slower, nevertheless density also converge
0 100 200 300 400 500t / ps
95
90
85
80
/ kg
m-3
385
380
375
370
265
260
255
250
450 K / 20 MPa
450 K / 100 MPa
250 K / 100 MPa
www.intechopen.com
Natural Gas426
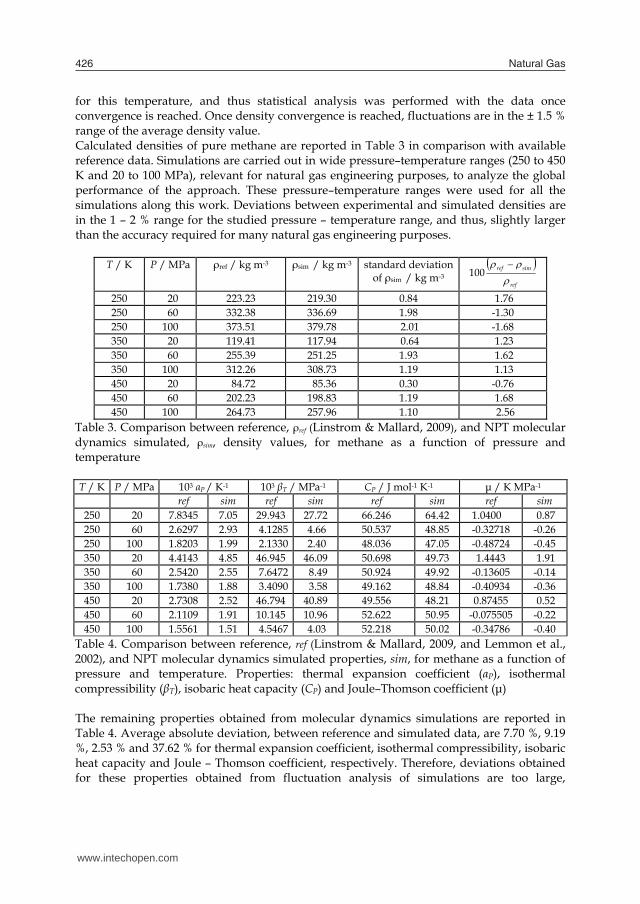
for this temperature, and thus statistical analysis was performed with the data once convergence is reached. Once density convergence is reached, fluctuations are in the ± 1.5 % range of the average density value. Calculated densities of pure methane are reported in Table 3 in comparison with available reference data. Simulations are carried out in wide pressure–temperature ranges (250 to 450 K and 20 to 100 MPa), relevant for natural gas engineering purposes, to analyze the global performance of the approach. These pressure–temperature ranges were used for all the simulations along this work. Deviations between experimental and simulated densities are in the 1 – 2 % range for the studied pressure – temperature range, and thus, slightly larger than the accuracy required for many natural gas engineering purposes.
T / K P / MPa ρref / kg m-3 ρsim / kg m-3 standard deviation of ρsim / kg m-3
ref
simref
100
250 20 223.23 219.30 0.84 1.76 250 60 332.38 336.69 1.98 -1.30 250 100 373.51 379.78 2.01 -1.68 350 20 119.41 117.94 0.64 1.23 350 60 255.39 251.25 1.93 1.62 350 100 312.26 308.73 1.19 1.13 450 20 84.72 85.36 0.30 -0.76 450 60 202.23 198.83 1.19 1.68 450 100 264.73 257.96 1.10 2.56
Table 3. Comparison between reference, ρref (Linstrom & Mallard, 2009), and NPT molecular dynamics simulated, ρsim, density values, for methane as a function of pressure and temperature T / K P / MPa 103 αP / K-1 103 βT / MPa-1 CP / J mol-1 K-1 μ / K MPa-1
ref sim ref sim ref sim ref sim 250 20 7.8345 7.05 29.943 27.72 66.246 64.42 1.0400 0.87 250 60 2.6297 2.93 4.1285 4.66 50.537 48.85 -0.32718 -0.26 250 100 1.8203 1.99 2.1330 2.40 48.036 47.05 -0.48724 -0.45 350 20 4.4143 4.85 46.945 46.09 50.698 49.73 1.4443 1.91 350 60 2.5420 2.55 7.6472 8.49 50.924 49.92 -0.13605 -0.14 350 100 1.7380 1.88 3.4090 3.58 49.162 48.84 -0.40934 -0.36 450 20 2.7308 2.52 46.794 40.89 49.556 48.21 0.87455 0.52 450 60 2.1109 1.91 10.145 10.96 52.622 50.95 -0.075505 -0.22 450 100 1.5561 1.51 4.5467 4.03 52.218 50.02 -0.34786 -0.40
Table 4. Comparison between reference, ref (Linstrom & Mallard, 2009, and Lemmon et al., 2002), and NPT molecular dynamics simulated properties, sim, for methane as a function of pressure and temperature. Properties: thermal expansion coefficient (αP), isothermal compressibility (βT), isobaric heat capacity (CP) and Joule–Thomson coefficient (μ) The remaining properties obtained from molecular dynamics simulations are reported in Table 4. Average absolute deviation, between reference and simulated data, are 7.70 %, 9.19 %, 2.53 % and 37.62 % for thermal expansion coefficient, isothermal compressibility, isobaric heat capacity and Joule – Thomson coefficient, respectively. Therefore, deviations obtained for these properties obtained from fluctuation analysis of simulations are too large,
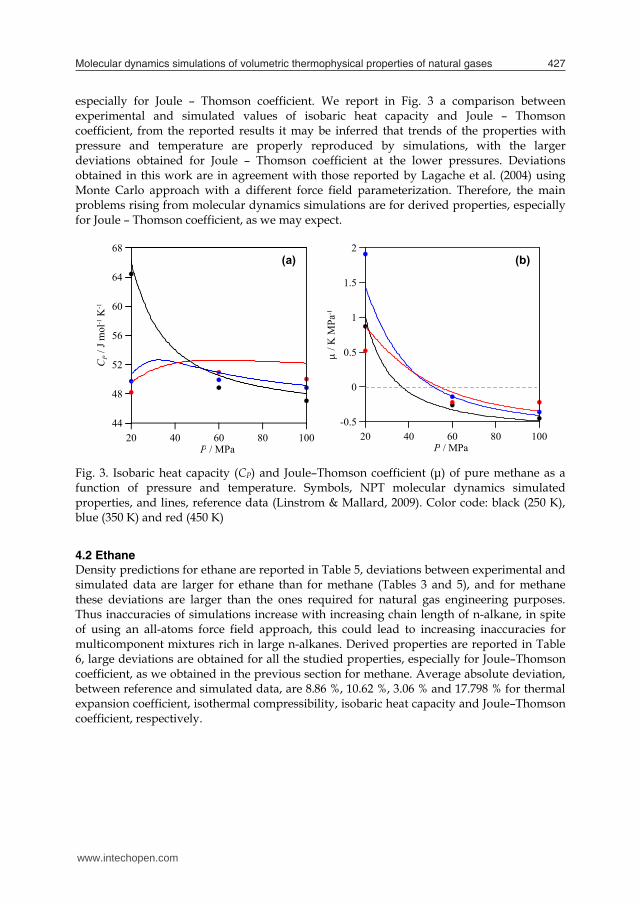
especially for Joule – Thomson coefficient. We report in Fig. 3 a comparison between experimental and simulated values of isobaric heat capacity and Joule – Thomson coefficient, from the reported results it may be inferred that trends of the properties with pressure and temperature are properly reproduced by simulations, with the larger deviations obtained for Joule – Thomson coefficient at the lower pressures. Deviations obtained in this work are in agreement with those reported by Lagache et al. (2004) using Monte Carlo approach with a different force field parameterization. Therefore, the main problems rising from molecular dynamics simulations are for derived properties, especially for Joule – Thomson coefficient, as we may expect. Fig. 3. Isobaric heat capacity (CP) and Joule–Thomson coefficient (μ) of pure methane as a function of pressure and temperature. Symbols, NPT molecular dynamics simulated properties, and lines, reference data (Linstrom & Mallard, 2009). Color code: black (250 K), blue (350 K) and red (450 K)
4.2 Ethane Density predictions for ethane are reported in Table 5, deviations between experimental and simulated data are larger for ethane than for methane (Tables 3 and 5), and for methane these deviations are larger than the ones required for natural gas engineering purposes. Thus inaccuracies of simulations increase with increasing chain length of n-alkane, in spite of using an all-atoms force field approach, this could lead to increasing inaccuracies for multicomponent mixtures rich in large n-alkanes. Derived properties are reported in Table 6, large deviations are obtained for all the studied properties, especially for Joule–Thomson coefficient, as we obtained in the previous section for methane. Average absolute deviation, between reference and simulated data, are 8.86 %, 10.62 %, 3.06 % and 17.798 % for thermal expansion coefficient, isothermal compressibility, isobaric heat capacity and Joule–Thomson coefficient, respectively.
20 40 60 80 100P / MPa
44
48
52
56
60
64
68
CP /
J m
ol-1 K
-1
20 40 60 80 100P / MPa
-0.5
0
0.5
1
1.5
2
/ K
MPa
-1
(a) (b)
www.intechopen.com
Molecular dynamics simulations of volumetric thermophysical properties of natural gases 427
for this temperature, and thus statistical analysis was performed with the data once convergence is reached. Once density convergence is reached, fluctuations are in the ± 1.5 % range of the average density value. Calculated densities of pure methane are reported in Table 3 in comparison with available reference data. Simulations are carried out in wide pressure–temperature ranges (250 to 450 K and 20 to 100 MPa), relevant for natural gas engineering purposes, to analyze the global performance of the approach. These pressure–temperature ranges were used for all the simulations along this work. Deviations between experimental and simulated densities are in the 1 – 2 % range for the studied pressure – temperature range, and thus, slightly larger than the accuracy required for many natural gas engineering purposes.
T / K P / MPa ρref / kg m-3 ρsim / kg m-3 standard deviation of ρsim / kg m-3
ref
simref
100
250 20 223.23 219.30 0.84 1.76 250 60 332.38 336.69 1.98 -1.30 250 100 373.51 379.78 2.01 -1.68 350 20 119.41 117.94 0.64 1.23 350 60 255.39 251.25 1.93 1.62 350 100 312.26 308.73 1.19 1.13 450 20 84.72 85.36 0.30 -0.76 450 60 202.23 198.83 1.19 1.68 450 100 264.73 257.96 1.10 2.56
Table 3. Comparison between reference, ρref (Linstrom & Mallard, 2009), and NPT molecular dynamics simulated, ρsim, density values, for methane as a function of pressure and temperature T / K P / MPa 103 αP / K-1 103 βT / MPa-1 CP / J mol-1 K-1 μ / K MPa-1
ref sim ref sim ref sim ref sim 250 20 7.8345 7.05 29.943 27.72 66.246 64.42 1.0400 0.87 250 60 2.6297 2.93 4.1285 4.66 50.537 48.85 -0.32718 -0.26 250 100 1.8203 1.99 2.1330 2.40 48.036 47.05 -0.48724 -0.45 350 20 4.4143 4.85 46.945 46.09 50.698 49.73 1.4443 1.91 350 60 2.5420 2.55 7.6472 8.49 50.924 49.92 -0.13605 -0.14 350 100 1.7380 1.88 3.4090 3.58 49.162 48.84 -0.40934 -0.36 450 20 2.7308 2.52 46.794 40.89 49.556 48.21 0.87455 0.52 450 60 2.1109 1.91 10.145 10.96 52.622 50.95 -0.075505 -0.22 450 100 1.5561 1.51 4.5467 4.03 52.218 50.02 -0.34786 -0.40
Table 4. Comparison between reference, ref (Linstrom & Mallard, 2009, and Lemmon et al., 2002), and NPT molecular dynamics simulated properties, sim, for methane as a function of pressure and temperature. Properties: thermal expansion coefficient (αP), isothermal compressibility (βT), isobaric heat capacity (CP) and Joule–Thomson coefficient (μ) The remaining properties obtained from molecular dynamics simulations are reported in Table 4. Average absolute deviation, between reference and simulated data, are 7.70 %, 9.19 %, 2.53 % and 37.62 % for thermal expansion coefficient, isothermal compressibility, isobaric heat capacity and Joule – Thomson coefficient, respectively. Therefore, deviations obtained for these properties obtained from fluctuation analysis of simulations are too large,
especially for Joule – Thomson coefficient. We report in Fig. 3 a comparison between experimental and simulated values of isobaric heat capacity and Joule – Thomson coefficient, from the reported results it may be inferred that trends of the properties with pressure and temperature are properly reproduced by simulations, with the larger deviations obtained for Joule – Thomson coefficient at the lower pressures. Deviations obtained in this work are in agreement with those reported by Lagache et al. (2004) using Monte Carlo approach with a different force field parameterization. Therefore, the main problems rising from molecular dynamics simulations are for derived properties, especially for Joule – Thomson coefficient, as we may expect. Fig. 3. Isobaric heat capacity (CP) and Joule–Thomson coefficient (μ) of pure methane as a function of pressure and temperature. Symbols, NPT molecular dynamics simulated properties, and lines, reference data (Linstrom & Mallard, 2009). Color code: black (250 K), blue (350 K) and red (450 K)
4.2 Ethane Density predictions for ethane are reported in Table 5, deviations between experimental and simulated data are larger for ethane than for methane (Tables 3 and 5), and for methane these deviations are larger than the ones required for natural gas engineering purposes. Thus inaccuracies of simulations increase with increasing chain length of n-alkane, in spite of using an all-atoms force field approach, this could lead to increasing inaccuracies for multicomponent mixtures rich in large n-alkanes. Derived properties are reported in Table 6, large deviations are obtained for all the studied properties, especially for Joule–Thomson coefficient, as we obtained in the previous section for methane. Average absolute deviation, between reference and simulated data, are 8.86 %, 10.62 %, 3.06 % and 17.798 % for thermal expansion coefficient, isothermal compressibility, isobaric heat capacity and Joule–Thomson coefficient, respectively.
20 40 60 80 100P / MPa
44
48
52
56
60
64
68
CP /
J m
ol-1 K
-1
20 40 60 80 100P / MPa
-0.5
0
0.5
1
1.5
2
/ K
MPa
-1
(a) (b)
www.intechopen.com

Natural Gas428
T / K P / MPa ρref / kg m-3 ρsim / kg m-3 standard deviation of ρsim / kg m-3
ref
simref
100
250 20 486.74 471.42 1.22 3.15 250 60 529.91 510.23 1.81 3.71 250 100 557.16 537.81 1.95 3.47 350 20 343.55 329.85 0.85 3.99 350 60 445.96 436.74 1.74 2.07 350 100 489.08 478.33 1.39 2.20 450 20 202.36 195.12 0.94 3.58 450 60 370.02 360.81 1.22 2.49 450 100 429.48 420.75 1.40 2.03
Table 5. Comparison between reference, ρref (Linstrom & Mallard, 2009), and NPT molecular dynamics simulated, ρsim, density values, for ethane as a function of pressure and temperature T / K P / MPa 103 αP / K-1 103 βT / MPa-1 CP / J mol-1 K-1 μ / K MPa-1
ref sim ref sim ref sim ref sim 250 20 2.5063 2.84 3.1016 2.66 77.586 75.04 -0.29735 -0.25 250 60 1.6200 1.39 1.5345 1.63 71.927 70.09 -0.46941 -0.55 250 100 1.2873 1.32 1.0391 1.02 70.138 68.85 -0.52185 -0.54 350 20 4.8378 4.35 16.779 14.61 98.734 94.76 0.61455 0.50 350 60 1.8187 1.67 3.1585 3.56 81.503 78.87 -0.30069 -0.36 350 100 1.3102 1.35 1.7358 1.47 78.897 76.32 -0.42192 -0.43 450 20 4.6465 5.24 44.489 38.01 99.313 96.23 1.6323 2.17 450 60 1.8816 2.06 5.5582 6.23 91.100 88.78 -0.13673 -0.07 450 100 1.2809 1.36 2.5866 2.44 88.511 85.24 -0.33508 -0.33
Table 6. Comparison between reference, ref (Linstrom & Mallard, 2009, and Lemmon et al., 2002), and NPT molecular dynamics simulated properties, sim, for ethane as a function of pressure and temperature. Properties: thermal expansion coefficient (αP), isothermal compressibility (βT), isobaric heat capacity (CP) and Joule–Thomson coefficient (μ)
4.3 CO2 and N2 Results for carbon dioxide and nitrogen are reported in Tables 7 – 10. Although these gases are minor component of common natural gas mixtures, their effect on the thermodynamic properties of natural gas mixtures is relevant, and thus, the accurate reproduction of their properties through simulations is required to obtain reliable results. Density is simulated for both gases with low deviations, average absolute deviation, between reference and simulated data, are 1.70 % and 1.71 % for carbon dioxide and nitrogen respectively. Nevertheless, these deviations are larger than 1 %, and thus, as for the results reported for n-alkanes in previous sections, simulations lead to deviations too large for engineering purposes. Derived properties reported in Tables 8 and 10, show too large deviations, leading to average absolute deviations, between reference and simulated data, of 9.52 and 9.11 % (for thermal expansion coefficient, for carbon dioxide and nitrogen, respectively), 13.09 and 13.17 % (for isothermal compressibility), 3.54 and 3.32 % (for isobaric heat capacity) and 70.57 and 40.3 % (for Joule–Thomson coefficient).
T / K P / MPa ρref / kg m-3 ρsim / kg m-3 standard deviation of ρsim / kg m-3
ref
simref
100
250 20 1105.5 1082.45 1.40 2.09 250 60 1183.6 1161.16 1.10 1.90 250 100 1235.6 1215.04 1.55 1.66 350 20 614.18 603.76 1.04 1.70 350 60 923.92 910.12 1.47 1.49 350 100 1027.7 1013.22 1.33 1.41 450 20 285.14 280.48 1.25 1.63 450 60 689.59 677.97 1.01 1.69 450 100 847.00 832.01 1.38 1.77
Table 7. Comparison between reference, ρref (Linstrom & Mallard, 2009), and NPT molecular dynamics simulated, ρsim, density values, for carbon dioxide as a function of pressure and temperature T / K P / MPa 103 αP / K-1 103 βT / MPa-1 CP / J mol-1 K-1 μ / K MPa-1
ref sim ref sim ref sim ref sim 250 20 3.1348 2.83 2.3550 2.04 83.318 80.11 -0.10335 -0.15 250 60 2.1531 1.96 1.2889 1.13 76.168 73.35 -0.22540 -0.26 250 100 1.7459 1.60 0.9062 0.79 73.521 70.81 -0.27302 -0.31 350 20 10.574 9.49 37.489 32.62 115.34 111.89 1.6780 1.51 350 60 2.7954 2.54 3.7943 3.31 74.349 72.10 -0.013846 -0.07 350 100 1.9221 1.75 1.9368 1.70 69.370 67.18 -0.20202 -0.25 450 20 4.5519 4.04 54.620 47.14 64.820 62.38 2.4962 2.06 450 60 2.8988 2.60 8.1235 7.02 69.816 67.12 0.27833 0.16 450 100 1.9076 1.75 3.3676 2.92 66.107 63.57 -0.11128 -0.18
Table 8. Comparison between reference, ref (Linstrom & Mallard, 2009, and Lemmon et al., 2002), and NPT molecular dynamics simulated properties, sim, for carbon dioxide as a function of pressure and temperature. Properties: thermal expansion coefficient (αP), isothermal compressibility (βT), isobaric heat capacity (CP) and Joule–Thomson coefficient (μ)
T / K P / MPa ρref / kg m-3 ρsim / kg m-3 standard deviation of ρsim / kg m-3
ref
simref
100
250 20 268.10 262.99 1.62 1.91 250 60 523.04 513.14 1.51 1.89 250 100 631.37 621.81 1.44 1.51 350 20 178.03 174.46 1.00 2.01 350 60 400.90 394.65 1.74 1.56 350 100 520.38 513.04 1.25 1.41 450 20 136.50 134.03 1.04 1.81 450 60 325.58 320.51 1.91 1.56 450 100 442.22 434.70 1.58 1.70
Table 9. Comparison between reference, ρref (Linstrom & Mallard, 2009), and NPT molecular dynamics simulated, ρsim, density values, for nitrogen as a function of pressure and temperature
www.intechopen.com

Molecular dynamics simulations of volumetric thermophysical properties of natural gases 429
T / K P / MPa ρref / kg m-3 ρsim / kg m-3 standard deviation of ρsim / kg m-3
ref
simref
100
250 20 486.74 471.42 1.22 3.15 250 60 529.91 510.23 1.81 3.71 250 100 557.16 537.81 1.95 3.47 350 20 343.55 329.85 0.85 3.99 350 60 445.96 436.74 1.74 2.07 350 100 489.08 478.33 1.39 2.20 450 20 202.36 195.12 0.94 3.58 450 60 370.02 360.81 1.22 2.49 450 100 429.48 420.75 1.40 2.03
Table 5. Comparison between reference, ρref (Linstrom & Mallard, 2009), and NPT molecular dynamics simulated, ρsim, density values, for ethane as a function of pressure and temperature T / K P / MPa 103 αP / K-1 103 βT / MPa-1 CP / J mol-1 K-1 μ / K MPa-1
ref sim ref sim ref sim ref sim 250 20 2.5063 2.84 3.1016 2.66 77.586 75.04 -0.29735 -0.25 250 60 1.6200 1.39 1.5345 1.63 71.927 70.09 -0.46941 -0.55 250 100 1.2873 1.32 1.0391 1.02 70.138 68.85 -0.52185 -0.54 350 20 4.8378 4.35 16.779 14.61 98.734 94.76 0.61455 0.50 350 60 1.8187 1.67 3.1585 3.56 81.503 78.87 -0.30069 -0.36 350 100 1.3102 1.35 1.7358 1.47 78.897 76.32 -0.42192 -0.43 450 20 4.6465 5.24 44.489 38.01 99.313 96.23 1.6323 2.17 450 60 1.8816 2.06 5.5582 6.23 91.100 88.78 -0.13673 -0.07 450 100 1.2809 1.36 2.5866 2.44 88.511 85.24 -0.33508 -0.33
Table 6. Comparison between reference, ref (Linstrom & Mallard, 2009, and Lemmon et al., 2002), and NPT molecular dynamics simulated properties, sim, for ethane as a function of pressure and temperature. Properties: thermal expansion coefficient (αP), isothermal compressibility (βT), isobaric heat capacity (CP) and Joule–Thomson coefficient (μ)
4.3 CO2 and N2 Results for carbon dioxide and nitrogen are reported in Tables 7 – 10. Although these gases are minor component of common natural gas mixtures, their effect on the thermodynamic properties of natural gas mixtures is relevant, and thus, the accurate reproduction of their properties through simulations is required to obtain reliable results. Density is simulated for both gases with low deviations, average absolute deviation, between reference and simulated data, are 1.70 % and 1.71 % for carbon dioxide and nitrogen respectively. Nevertheless, these deviations are larger than 1 %, and thus, as for the results reported for n-alkanes in previous sections, simulations lead to deviations too large for engineering purposes. Derived properties reported in Tables 8 and 10, show too large deviations, leading to average absolute deviations, between reference and simulated data, of 9.52 and 9.11 % (for thermal expansion coefficient, for carbon dioxide and nitrogen, respectively), 13.09 and 13.17 % (for isothermal compressibility), 3.54 and 3.32 % (for isobaric heat capacity) and 70.57 and 40.3 % (for Joule–Thomson coefficient).
T / K P / MPa ρref / kg m-3 ρsim / kg m-3 standard deviation of ρsim / kg m-3
ref
simref
100
250 20 1105.5 1082.45 1.40 2.09 250 60 1183.6 1161.16 1.10 1.90 250 100 1235.6 1215.04 1.55 1.66 350 20 614.18 603.76 1.04 1.70 350 60 923.92 910.12 1.47 1.49 350 100 1027.7 1013.22 1.33 1.41 450 20 285.14 280.48 1.25 1.63 450 60 689.59 677.97 1.01 1.69 450 100 847.00 832.01 1.38 1.77
Table 7. Comparison between reference, ρref (Linstrom & Mallard, 2009), and NPT molecular dynamics simulated, ρsim, density values, for carbon dioxide as a function of pressure and temperature T / K P / MPa 103 αP / K-1 103 βT / MPa-1 CP / J mol-1 K-1 μ / K MPa-1
ref sim ref sim ref sim ref sim 250 20 3.1348 2.83 2.3550 2.04 83.318 80.11 -0.10335 -0.15 250 60 2.1531 1.96 1.2889 1.13 76.168 73.35 -0.22540 -0.26 250 100 1.7459 1.60 0.9062 0.79 73.521 70.81 -0.27302 -0.31 350 20 10.574 9.49 37.489 32.62 115.34 111.89 1.6780 1.51 350 60 2.7954 2.54 3.7943 3.31 74.349 72.10 -0.013846 -0.07 350 100 1.9221 1.75 1.9368 1.70 69.370 67.18 -0.20202 -0.25 450 20 4.5519 4.04 54.620 47.14 64.820 62.38 2.4962 2.06 450 60 2.8988 2.60 8.1235 7.02 69.816 67.12 0.27833 0.16 450 100 1.9076 1.75 3.3676 2.92 66.107 63.57 -0.11128 -0.18
Table 8. Comparison between reference, ref (Linstrom & Mallard, 2009, and Lemmon et al., 2002), and NPT molecular dynamics simulated properties, sim, for carbon dioxide as a function of pressure and temperature. Properties: thermal expansion coefficient (αP), isothermal compressibility (βT), isobaric heat capacity (CP) and Joule–Thomson coefficient (μ)
T / K P / MPa ρref / kg m-3 ρsim / kg m-3 standard deviation of ρsim / kg m-3
ref
simref
100
250 20 268.10 262.99 1.62 1.91 250 60 523.04 513.14 1.51 1.89 250 100 631.37 621.81 1.44 1.51 350 20 178.03 174.46 1.00 2.01 350 60 400.90 394.65 1.74 1.56 350 100 520.38 513.04 1.25 1.41 450 20 136.50 134.03 1.04 1.81 450 60 325.58 320.51 1.91 1.56 450 100 442.22 434.70 1.58 1.70
Table 9. Comparison between reference, ρref (Linstrom & Mallard, 2009), and NPT molecular dynamics simulated, ρsim, density values, for nitrogen as a function of pressure and temperature
www.intechopen.com
Natural Gas430
T / K P / MPa 103 αP / K-1 103 βT / MPa-1 CP / J mol-1 K-1 μ / K MPa-1 ref sim ref sim ref sim ref sim
250 20 5.4355 5.04 41.524 36.13 40.966 39.42 0.91540 0.70 250 60 2.9791 2.73 7.0050 6.11 40.680 39.20 -0.33604 -0.44 250 100 2.0939 1.93 3.2581 2.81 39.685 38.29 -0.53276 -0.61 350 20 3.1609 2.86 43.877 38.05 34.185 33.13 0.48940 0.00 350 60 2.3437 2.13 9.6497 8.39 36.591 35.54 -0.34318 -0.51 350 100 1.7733 1.60 4.4900 3.92 36.671 35.73 -0.55688 -0.67 450 20 2.2621 2.02 44.586 38.50 32.184 31.14 0.11451 -0.61 450 60 1.8502 1.66 11.083 9.61 34.323 33.16 -0.41970 -0.67 450 100 1.4925 1.35 5.3610 4.66 34.852 33.53 -0.59686 -0.75
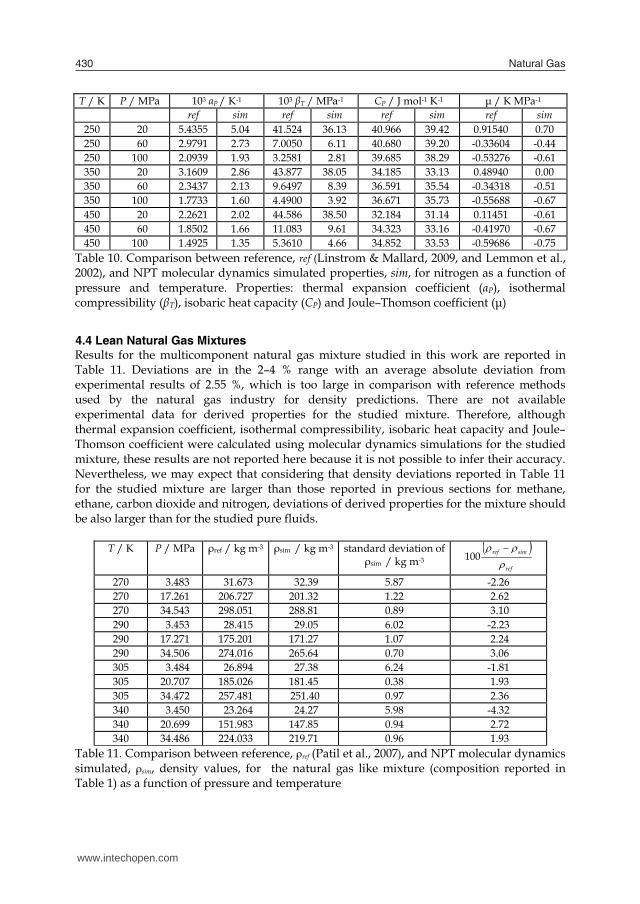
Table 10. Comparison between reference, ref (Linstrom & Mallard, 2009, and Lemmon et al., 2002), and NPT molecular dynamics simulated properties, sim, for nitrogen as a function of pressure and temperature. Properties: thermal expansion coefficient (αP), isothermal compressibility (βT), isobaric heat capacity (CP) and Joule–Thomson coefficient (μ)
4.4 Lean Natural Gas Mixtures Results for the multicomponent natural gas mixture studied in this work are reported in Table 11. Deviations are in the 2–4 % range with an average absolute deviation from experimental results of 2.55 %, which is too large in comparison with reference methods used by the natural gas industry for density predictions. There are not available experimental data for derived properties for the studied mixture. Therefore, although thermal expansion coefficient, isothermal compressibility, isobaric heat capacity and Joule–Thomson coefficient were calculated using molecular dynamics simulations for the studied mixture, these results are not reported here because it is not possible to infer their accuracy. Nevertheless, we may expect that considering that density deviations reported in Table 11 for the studied mixture are larger than those reported in previous sections for methane, ethane, carbon dioxide and nitrogen, deviations of derived properties for the mixture should be also larger than for the studied pure fluids.
T / K P / MPa ρref / kg m-3 ρsim / kg m-3 standard deviation of ρsim / kg m-3
ref
simref
100
270 3.483 31.673 32.39 5.87 -2.26 270 17.261 206.727 201.32 1.22 2.62 270 34.543 298.051 288.81 0.89 3.10 290 3.453 28.415 29.05 6.02 -2.23 290 17.271 175.201 171.27 1.07 2.24 290 34.506 274.016 265.64 0.70 3.06 305 3.484 26.894 27.38 6.24 -1.81 305 20.707 185.026 181.45 0.38 1.93 305 34.472 257.481 251.40 0.97 2.36 340 3.450 23.264 24.27 5.98 -4.32 340 20.699 151.983 147.85 0.94 2.72 340 34.486 224.033 219.71 0.96 1.93
Table 11. Comparison between reference, ρref (Patil et al., 2007), and NPT molecular dynamics simulated, ρsim, density values, for the natural gas like mixture (composition reported in Table 1) as a function of pressure and temperature
5. Conclusions
Results reported in this work show preliminary conclusions obtained in the first stages of a wide computational study that we are carrying out on the performance of molecular simulation approaches for the prediction of thermophysical properties of multicomponent natural gas like mixtures. The main conclusions that may be inferred from these initial results may be resumed in:
i) Density for the main components of natural gases is predicted with deviations in the 1 – 2 % range for the 250 – 450 K / 20 – 100 MPa studied ranges. These deviations are low considering the purely predictive character of the considered approach but are too large for natural gas engineering purposes.
ii) Derived properties (thermal expansion coefficient, isothermal compressibility, isobaric heat capacity and Joule–Thomson coefficient), for the main components of natural gases are predicted with deviations up to 10 % (even larger for Joule–Thomson coefficient for some fluids). Therefore, although these are the deviations commonly obtained using molecular dynamics approach for many complex fluids, they are too large to use this approach for industrial purposes. Fortunately, deviations for isobaric heat capacity, which is a property with remarkable importance for natural gas engineering purposes, is predicted with deviations usually lower than 5 %.
iii) Predictions for the studied multicomponent natural gas like mixture lead to analogous results than those mentioned in conclusions i and ii: low deviations for density which lead to probably larger deviations for the remaining properties, but for all of them too large for industrial purposes. Moreover, it should be remarked that the studied mixture is composed of n-alkanes only up to C5, and thus, heavier mixtures containing larger alkanes should lead to even larger deviations.
Therefore, considering the results reported in this work, molecular dynamics approach is not able to lead to predictions that may be used for natural gas production, processing or transportation purposes in the present situation. Nevertheless, we think that results reported in this work, and by other authors in the literature (Lagache et al., 2001; Lagache et al. 2004), are very promising, and the use of molecular simulation approach to predict complex natural gas like mixtures properties should not be discarded. Therefore studies are being carried out by the authors with the next main objectives:
i) Improvement of forcefield parameterizations. ii) Comparison of the performance of several force fields. iii) Improvements of all atoms force fields approach in comparison with united
atoms approach, does the increase of computational time lead to a remarkable improvement in the accuracy of predictions?
iv) Decrease the errors in density predictions below the 1 % limit, in wide pressure – temperature ranges, and thus, leading to results competitive with the methods commonly used by the gas industry nowadays.
v) Analyze the predictions for heavy mixtures containing long alkanes. vi) Comparison of the performance of Monte Carlo and molecular dynamics
approaches. vii) Analyze from a molecular viewpoint the structural factors that govern these
complex mixtures behavior using these computational tools.
www.intechopen.com
Molecular dynamics simulations of volumetric thermophysical properties of natural gases 431
T / K P / MPa 103 αP / K-1 103 βT / MPa-1 CP / J mol-1 K-1 μ / K MPa-1 ref sim ref sim ref sim ref sim
250 20 5.4355 5.04 41.524 36.13 40.966 39.42 0.91540 0.70 250 60 2.9791 2.73 7.0050 6.11 40.680 39.20 -0.33604 -0.44 250 100 2.0939 1.93 3.2581 2.81 39.685 38.29 -0.53276 -0.61 350 20 3.1609 2.86 43.877 38.05 34.185 33.13 0.48940 0.00 350 60 2.3437 2.13 9.6497 8.39 36.591 35.54 -0.34318 -0.51 350 100 1.7733 1.60 4.4900 3.92 36.671 35.73 -0.55688 -0.67 450 20 2.2621 2.02 44.586 38.50 32.184 31.14 0.11451 -0.61 450 60 1.8502 1.66 11.083 9.61 34.323 33.16 -0.41970 -0.67 450 100 1.4925 1.35 5.3610 4.66 34.852 33.53 -0.59686 -0.75
Table 10. Comparison between reference, ref (Linstrom & Mallard, 2009, and Lemmon et al., 2002), and NPT molecular dynamics simulated properties, sim, for nitrogen as a function of pressure and temperature. Properties: thermal expansion coefficient (αP), isothermal compressibility (βT), isobaric heat capacity (CP) and Joule–Thomson coefficient (μ)
4.4 Lean Natural Gas Mixtures Results for the multicomponent natural gas mixture studied in this work are reported in Table 11. Deviations are in the 2–4 % range with an average absolute deviation from experimental results of 2.55 %, which is too large in comparison with reference methods used by the natural gas industry for density predictions. There are not available experimental data for derived properties for the studied mixture. Therefore, although thermal expansion coefficient, isothermal compressibility, isobaric heat capacity and Joule–Thomson coefficient were calculated using molecular dynamics simulations for the studied mixture, these results are not reported here because it is not possible to infer their accuracy. Nevertheless, we may expect that considering that density deviations reported in Table 11 for the studied mixture are larger than those reported in previous sections for methane, ethane, carbon dioxide and nitrogen, deviations of derived properties for the mixture should be also larger than for the studied pure fluids.
T / K P / MPa ρref / kg m-3 ρsim / kg m-3 standard deviation of ρsim / kg m-3
ref
simref
100
270 3.483 31.673 32.39 5.87 -2.26 270 17.261 206.727 201.32 1.22 2.62 270 34.543 298.051 288.81 0.89 3.10 290 3.453 28.415 29.05 6.02 -2.23 290 17.271 175.201 171.27 1.07 2.24 290 34.506 274.016 265.64 0.70 3.06 305 3.484 26.894 27.38 6.24 -1.81 305 20.707 185.026 181.45 0.38 1.93 305 34.472 257.481 251.40 0.97 2.36 340 3.450 23.264 24.27 5.98 -4.32 340 20.699 151.983 147.85 0.94 2.72 340 34.486 224.033 219.71 0.96 1.93
Table 11. Comparison between reference, ρref (Patil et al., 2007), and NPT molecular dynamics simulated, ρsim, density values, for the natural gas like mixture (composition reported in Table 1) as a function of pressure and temperature
5. Conclusions
Results reported in this work show preliminary conclusions obtained in the first stages of a wide computational study that we are carrying out on the performance of molecular simulation approaches for the prediction of thermophysical properties of multicomponent natural gas like mixtures. The main conclusions that may be inferred from these initial results may be resumed in:
i) Density for the main components of natural gases is predicted with deviations in the 1 – 2 % range for the 250 – 450 K / 20 – 100 MPa studied ranges. These deviations are low considering the purely predictive character of the considered approach but are too large for natural gas engineering purposes.
ii) Derived properties (thermal expansion coefficient, isothermal compressibility, isobaric heat capacity and Joule–Thomson coefficient), for the main components of natural gases are predicted with deviations up to 10 % (even larger for Joule–Thomson coefficient for some fluids). Therefore, although these are the deviations commonly obtained using molecular dynamics approach for many complex fluids, they are too large to use this approach for industrial purposes. Fortunately, deviations for isobaric heat capacity, which is a property with remarkable importance for natural gas engineering purposes, is predicted with deviations usually lower than 5 %.
iii) Predictions for the studied multicomponent natural gas like mixture lead to analogous results than those mentioned in conclusions i and ii: low deviations for density which lead to probably larger deviations for the remaining properties, but for all of them too large for industrial purposes. Moreover, it should be remarked that the studied mixture is composed of n-alkanes only up to C5, and thus, heavier mixtures containing larger alkanes should lead to even larger deviations.
Therefore, considering the results reported in this work, molecular dynamics approach is not able to lead to predictions that may be used for natural gas production, processing or transportation purposes in the present situation. Nevertheless, we think that results reported in this work, and by other authors in the literature (Lagache et al., 2001; Lagache et al. 2004), are very promising, and the use of molecular simulation approach to predict complex natural gas like mixtures properties should not be discarded. Therefore studies are being carried out by the authors with the next main objectives:
i) Improvement of forcefield parameterizations. ii) Comparison of the performance of several force fields. iii) Improvements of all atoms force fields approach in comparison with united
atoms approach, does the increase of computational time lead to a remarkable improvement in the accuracy of predictions?
iv) Decrease the errors in density predictions below the 1 % limit, in wide pressure – temperature ranges, and thus, leading to results competitive with the methods commonly used by the gas industry nowadays.
v) Analyze the predictions for heavy mixtures containing long alkanes. vi) Comparison of the performance of Monte Carlo and molecular dynamics
approaches. vii) Analyze from a molecular viewpoint the structural factors that govern these
complex mixtures behavior using these computational tools.
www.intechopen.com
Natural Gas432
6. References
Allen, M. P. & Tildesley, D. J. (1989). Computer Simulation of Liquids,Clarendon Press, ISBN 0198556454, Oxford.
Babusiaux, D. (2004). Oil and Gas Exploration and Production: Reserves, Costs, Contracts, Editions Technip, ISBN 2710808404, Paris.
Bessieres, D.; Randzio, S. L.; Piñeiro, M. M.; Lafitte, Th. & Daridon, J. L. (2006). A Combined Pressure-controlled Scanning Calorimetry and Monte Carlo Determination of the Joule−Thomson Inversion Curve. Application to Methane. J. Phys. Chem. B, 110, 11, February 2006, 5659-5664, ISSN 1089-5647.
Bluvshtein, I. (2007). Uncertainties of gas measurement. Pipeline & Gas Journal, 234, 5, May 2007, 28-33, ISSN 0032-0188.
Bluvshtein, I. (2007). Uncertainties of measuring systems. Pipeline & Gas Journal, 234, 7, July 2007, 16-21, ISSN 0032-0188.
Duan, Z.; Moller, N. & Weare, J. H. (1992). Molecular dynamics simulation of PVT properties of geological fluids and a general equation of state of nonpolar and weaklyu polar gases up to 2000 K and 20000 bar. Geochim. Cosmochim. Acta, 56, 10, October 1992, 3839-3845, ISSN 0016- 7037.
Duan, Z.; Moller, N. & Weare, J. H. (1996). A general equation of state for supercritical fluid mixtures and molecular dynamics simulation of mixture PVTx properties. Geochim. Cosmochim. Acta, 60, 7, April 1996, 1209-1216, ISSN 0016- 7037.
Dysthe, D. K., Fuch, A. H.; Rousseau, B. & Durandeau, M. (1999). Fluid transport properties by equilibrium molecular dynamics. II. Multicomponent systems. J. Chem. Phys., 110, 8, February 1999, 4060-4067, ISSN 0021-9606.
Errington, J.R. & Panagiotopoulos, A. Z. (1998). A Fixed Point Charge Model for Water Optimized to the Vapor−Liquid Coexistence Properties. J. Phys. Chem. B, 102, 38, September 1998, 7470-7475, ISSN 1089-5647.
Errington, J. & Panagiotopoulos, A. Z. (1999). A New Intermolecular Potential Model for the n-Alkane Homologous Series. J. Phys. Chem. B, 103, 30, July 1999, 6314-6322, ISSN 1089-5647.
Escobedo, F. A. & Chen, Z. (2001). Simulation of isoenthalps curves and Joule – Thomson inversion of pure fluids and mixtures. Mol. Sim., 26, 6, June 2001, 395-416, ISSN 0892-7022.
Essmann, U. L.; Perera, M. L.; Berkowitz, T.; Darden, H.; Lee,H. & Pedersen, L. G. (1995) J. Chem. Phys., 103, 19, November 2005, 8577-8593, ISSN 0021-9606.
Gallagher, J. E. (2006). Natural Gas Measurement Handbook, Gulf Publishing Company, ISBN 1933762005, Houston.
Hall, K. R. & Holste, J. C. (1990). Determination of natural gas custody transfer properties. Flow. Meas. Instrum., 1, 3, April 1990, 127-132, ISSN 0955-5986.
Hoover, W. G. (1985). Canonical dynamics: Equilibrium phase-space distributions. Phys. Rev. A, 31, 3, March 1985, 1695-1697, ISSN 1050-2947.
Husain, Z. D. (1993). Theoretical uncertainty of orifice flow measurement, Proceedings of 68th International School of Hydrocarbon Measurement, pp. 70-75, May 1993, publ, Oklahoma City.
Jaescke, M.; Schley, P. & Janssen-van Rosmalen, R. (2002). Thermodynamic research improves energy measurement in natural gas. Int. J. Thermophys., 23, 4, July 2002, 1013-1031, ISSN 1572-9567.
Jorgensen, W. L.; Maxwell, D. S. & Tirado–Rives, J. (1996). Development and testing of the OPLS All-Atom force field on conformational energetics and properties of organic liquids. J. Am. Chem. Soc., 118, 45, November 1996, 11225-11236, ISSN 0002-7863.
Lagache, M.; Ungerer, P., Boutin, A. & Fuchs, A. H. (2001). Prediction of thermodynamic derivative properties of fuids by Monte Carlo simulation. Phys. Chem. Chem. Phys., 3, 8, February 2001, 4333-4339, ISSN 1463-9076.
Lagache, M. H.; Ungerer, P.; Boutin, A. (2004). Prediction of thermodynamic derivative properties of natural condensate gases at high pressure by Monte Carlo simulation. Fluid Phase Equilibr., 220, 2, June 2004, 211-223, ISSN 0378-3812.
Lemmon, E. W.; McLinden, M. O.; Huber, M. L. NIST Standard Reference Database 23, Version 7.0, National Institute of Standards and Techcnology, Physical and Chamical Properties Division, Gaithersburg, MD, 2002.
Linstrom, P. J. & Mallard, W.G. Eds. (2009). NIST Chemistry WebBook, NIST Standard Reference Database Number 69, National Institute of Standards and Technology, Gaithersburg. Available at http://webbook.nist.gov
Martínez, J. M. & Martínez, L. (2003). Packing optimization for automated generation of complex system's initial configurations for molecular dynamics and docking. J. Comput. Chem., 24, 7, May 2003, 819-825, ISSN 0192-8651.
Martin, M.G. & Frischknecht, A. L. (2006). Using arbitrary trial distributions to improve intramolecular sampling in configurational-bias Monte Carlo. Mol. Phys., 104, 15, July 2006, 2439-2456, ISSN 0026-8976.
Martin, M.G. & Siepmann, J.I. (1999). Novel Configurational-Bias Monte Carlo Method for Branched Molecules. Transferable Potentials for Phase Equilibria. 2. United- Atom Description of Branched Alkanes. J. Phys. Chem. B, 103, 21, May 1999, 4508-4517, ISSN 1089-5647.
Mokhatab, S.; Poe, W. A. & Speight, J. G. Handbook of Natural Gas Transmission and Processing, Gulf Professional Publishing, ISBN 0750677767, Burlington.
Neubauer, B.; Tavitian, B.; Boutin, A.; Ungerer, P. (1999). Molecular simulations on volumetric properties of natural gas. Fluid Phase Equilibr., 161, 1, July 1999, 45-62, ISSN 0378-3812.
Patil, P.; Ejaz, S.; Atilhan, M.; Cristancho, D.; Holste, J. C. & Hall, K. R. (2007). Accurate density measurements for a 91 % methane natural gas-like mixture. J. Chem. Thermodyn., 39, 8, August 2007, 1157-1163, ISSN 0021-9614.
Ponder, J. W. (2004). TINKER: Software tool for molecular design. 4.2 ed, Washington University School of Medicine.
Saager, B. & Fischer, J. (1990). Predictive power of effective intermolecular pair potentials: MD simulation results for methane up to 1000 MPa. Fluid Phase Equilibr., 57, 1-2, July 1990, 35-46, ISSN 0378-3812.
Shi, W. & Maginn, E. (2008). Atomistic Simulation of the Absorption of Carbon Dioxide and Water in the Ionic Liquid 1-n-Hexyl-3-methylimidazolium Bis(trifluoromethylsulfonyl)imide ([hmim][Tf2N]. J. Phys. Chem. B, 112, 7, January 2008, 2045-2055, ISSN ISSN 1089-5647.
Siepmann, J.I. & Frenkel, D. (1992). Configurational bias Monte Carlo: a new sampling scheme for flexible chains. Mol. Phys., 75, 1, January 1992, 59-70, ISSN 0026-8976.
www.intechopen.com
Molecular dynamics simulations of volumetric thermophysical properties of natural gases 433
6. References
Allen, M. P. & Tildesley, D. J. (1989). Computer Simulation of Liquids,Clarendon Press, ISBN 0198556454, Oxford.
Babusiaux, D. (2004). Oil and Gas Exploration and Production: Reserves, Costs, Contracts, Editions Technip, ISBN 2710808404, Paris.
Bessieres, D.; Randzio, S. L.; Piñeiro, M. M.; Lafitte, Th. & Daridon, J. L. (2006). A Combined Pressure-controlled Scanning Calorimetry and Monte Carlo Determination of the Joule−Thomson Inversion Curve. Application to Methane. J. Phys. Chem. B, 110, 11, February 2006, 5659-5664, ISSN 1089-5647.
Bluvshtein, I. (2007). Uncertainties of gas measurement. Pipeline & Gas Journal, 234, 5, May 2007, 28-33, ISSN 0032-0188.
Bluvshtein, I. (2007). Uncertainties of measuring systems. Pipeline & Gas Journal, 234, 7, July 2007, 16-21, ISSN 0032-0188.
Duan, Z.; Moller, N. & Weare, J. H. (1992). Molecular dynamics simulation of PVT properties of geological fluids and a general equation of state of nonpolar and weaklyu polar gases up to 2000 K and 20000 bar. Geochim. Cosmochim. Acta, 56, 10, October 1992, 3839-3845, ISSN 0016- 7037.
Duan, Z.; Moller, N. & Weare, J. H. (1996). A general equation of state for supercritical fluid mixtures and molecular dynamics simulation of mixture PVTx properties. Geochim. Cosmochim. Acta, 60, 7, April 1996, 1209-1216, ISSN 0016- 7037.
Dysthe, D. K., Fuch, A. H.; Rousseau, B. & Durandeau, M. (1999). Fluid transport properties by equilibrium molecular dynamics. II. Multicomponent systems. J. Chem. Phys., 110, 8, February 1999, 4060-4067, ISSN 0021-9606.
Errington, J.R. & Panagiotopoulos, A. Z. (1998). A Fixed Point Charge Model for Water Optimized to the Vapor−Liquid Coexistence Properties. J. Phys. Chem. B, 102, 38, September 1998, 7470-7475, ISSN 1089-5647.
Errington, J. & Panagiotopoulos, A. Z. (1999). A New Intermolecular Potential Model for the n-Alkane Homologous Series. J. Phys. Chem. B, 103, 30, July 1999, 6314-6322, ISSN 1089-5647.
Escobedo, F. A. & Chen, Z. (2001). Simulation of isoenthalps curves and Joule – Thomson inversion of pure fluids and mixtures. Mol. Sim., 26, 6, June 2001, 395-416, ISSN 0892-7022.
Essmann, U. L.; Perera, M. L.; Berkowitz, T.; Darden, H.; Lee,H. & Pedersen, L. G. (1995) J. Chem. Phys., 103, 19, November 2005, 8577-8593, ISSN 0021-9606.
Gallagher, J. E. (2006). Natural Gas Measurement Handbook, Gulf Publishing Company, ISBN 1933762005, Houston.
Hall, K. R. & Holste, J. C. (1990). Determination of natural gas custody transfer properties. Flow. Meas. Instrum., 1, 3, April 1990, 127-132, ISSN 0955-5986.
Hoover, W. G. (1985). Canonical dynamics: Equilibrium phase-space distributions. Phys. Rev. A, 31, 3, March 1985, 1695-1697, ISSN 1050-2947.
Husain, Z. D. (1993). Theoretical uncertainty of orifice flow measurement, Proceedings of 68th International School of Hydrocarbon Measurement, pp. 70-75, May 1993, publ, Oklahoma City.
Jaescke, M.; Schley, P. & Janssen-van Rosmalen, R. (2002). Thermodynamic research improves energy measurement in natural gas. Int. J. Thermophys., 23, 4, July 2002, 1013-1031, ISSN 1572-9567.
Jorgensen, W. L.; Maxwell, D. S. & Tirado–Rives, J. (1996). Development and testing of the OPLS All-Atom force field on conformational energetics and properties of organic liquids. J. Am. Chem. Soc., 118, 45, November 1996, 11225-11236, ISSN 0002-7863.
Lagache, M.; Ungerer, P., Boutin, A. & Fuchs, A. H. (2001). Prediction of thermodynamic derivative properties of fuids by Monte Carlo simulation. Phys. Chem. Chem. Phys., 3, 8, February 2001, 4333-4339, ISSN 1463-9076.
Lagache, M. H.; Ungerer, P.; Boutin, A. (2004). Prediction of thermodynamic derivative properties of natural condensate gases at high pressure by Monte Carlo simulation. Fluid Phase Equilibr., 220, 2, June 2004, 211-223, ISSN 0378-3812.
Lemmon, E. W.; McLinden, M. O.; Huber, M. L. NIST Standard Reference Database 23, Version 7.0, National Institute of Standards and Techcnology, Physical and Chamical Properties Division, Gaithersburg, MD, 2002.
Linstrom, P. J. & Mallard, W.G. Eds. (2009). NIST Chemistry WebBook, NIST Standard Reference Database Number 69, National Institute of Standards and Technology, Gaithersburg. Available at http://webbook.nist.gov
Martínez, J. M. & Martínez, L. (2003). Packing optimization for automated generation of complex system's initial configurations for molecular dynamics and docking. J. Comput. Chem., 24, 7, May 2003, 819-825, ISSN 0192-8651.
Martin, M.G. & Frischknecht, A. L. (2006). Using arbitrary trial distributions to improve intramolecular sampling in configurational-bias Monte Carlo. Mol. Phys., 104, 15, July 2006, 2439-2456, ISSN 0026-8976.
Martin, M.G. & Siepmann, J.I. (1999). Novel Configurational-Bias Monte Carlo Method for Branched Molecules. Transferable Potentials for Phase Equilibria. 2. United- Atom Description of Branched Alkanes. J. Phys. Chem. B, 103, 21, May 1999, 4508-4517, ISSN 1089-5647.
Mokhatab, S.; Poe, W. A. & Speight, J. G. Handbook of Natural Gas Transmission and Processing, Gulf Professional Publishing, ISBN 0750677767, Burlington.
Neubauer, B.; Tavitian, B.; Boutin, A.; Ungerer, P. (1999). Molecular simulations on volumetric properties of natural gas. Fluid Phase Equilibr., 161, 1, July 1999, 45-62, ISSN 0378-3812.
Patil, P.; Ejaz, S.; Atilhan, M.; Cristancho, D.; Holste, J. C. & Hall, K. R. (2007). Accurate density measurements for a 91 % methane natural gas-like mixture. J. Chem. Thermodyn., 39, 8, August 2007, 1157-1163, ISSN 0021-9614.
Ponder, J. W. (2004). TINKER: Software tool for molecular design. 4.2 ed, Washington University School of Medicine.
Saager, B. & Fischer, J. (1990). Predictive power of effective intermolecular pair potentials: MD simulation results for methane up to 1000 MPa. Fluid Phase Equilibr., 57, 1-2, July 1990, 35-46, ISSN 0378-3812.
Shi, W. & Maginn, E. (2008). Atomistic Simulation of the Absorption of Carbon Dioxide and Water in the Ionic Liquid 1-n-Hexyl-3-methylimidazolium Bis(trifluoromethylsulfonyl)imide ([hmim][Tf2N]. J. Phys. Chem. B, 112, 7, January 2008, 2045-2055, ISSN ISSN 1089-5647.
Siepmann, J.I. & Frenkel, D. (1992). Configurational bias Monte Carlo: a new sampling scheme for flexible chains. Mol. Phys., 75, 1, January 1992, 59-70, ISSN 0026-8976.
www.intechopen.com
Natural Gas434
Smit, B. & Williams, C. P. (1990). Vapour-liquid equilibria for quadrupolar Lennard-Jones fluids. J. Phys. Condens. Matter, 2, 18, May 1990, 4281-4288, 0953-8984.
Starling, K.E. & Savidge, J.L. (1992) Compressibility Factors of Natural Gas and Other Related Hydrocarbon Gases, AGA transmission Measurement Committee Report 8, American Gas Association, 1992.
Ungerer, P. (2003). From Organic geochemistry to statistical thermodynamics: the development of simulation methods for the petroleum industry. Oil & Gas Science and Technology – Rev. IFP, 58, 2, May 2003, 271-297, ISSN 1294-4475.
Ungerer, P.; Wender, A.; Demoulin, G.; Bourasseau, E. & Mougin, P. (2004). Application of Gibbs Ensemble and NPT Monte Carlo Simulation to the Development of Improved Processes for H2S-rich Gases. Mol. Sim., 30, 10, August 2004, 631-648, ISSN 0892-7022.
Ungerer, P.; Lachet, V. & Tavitian, B. (2006). Properties of natural gases at high pressure. In: Applications of molecular simulation in the oil and gas industry. Monte Carlo methods., 162-175, Editions Technip, ISBN 2710808587, Paris.
Ungerer, P.; Lachet, V. & Tavitian, B. (2006). Applications of molecular simulation in oil and gas production and processing. Oil & Gas Science and Technology – Rev. IFP., 61, 3, May 2006, 387-403, ISSN 1294-4475.
Ungerer, P.; Nieto-Draghi, C.; Rousseau, B.; Ahunbay, G. & Lachet, V. (2007). Molecular simulation of the thermophysical properties of fluids: From understanding toward quantitative predictions. J. Mol. Liq., 134, 1-3, May 2007, 71-89, ISSN 0167-7322.
Vlugt, T. J. H.; Martin, M.G.; Smit, B.; Siepmann, J.I. & Krishna, R. (1998). Improving the efficiency of the configurational-bias Monte Carlo algorithm. Mol. Phys., 94, 4, July 1998, 727-733, ISSN 0026-8976.
Vrabec, J.; Kumar, A. & Hasse, H. (2007). Joule–Thomson inversion curves of mixtures by molecular simulation in comparison to advanced equations of state: Natural gas as an example. Fluid Phase Equilibr., 258, 1, September 2007, 34-40, ISSN 0378-3812.
Wagner, W. & Kleinrahm, R. (2004). Densimeters for very accurate density measurements of fluids over large ranges of temperature, pressure, and density. Metrologia, 41, 2, March 2004, S24-S29, ISSN 0026-1394.
Yoshida, T.; Uematsu, M. (1996). Prediction of PVT properties of natural gases by molecular simulation. Transactions of the Japan Society of Mechanical Engineers, Series B, 62, 593, , 278-283, ISSN 03875016.
www.intechopen.com
Natural GasEdited by Primož PotoÄÂnik
ISBN 978-953-307-112-1Hard cover, 606 pagesPublisher SciyoPublished online 18, August, 2010Published in print edition August, 2010
InTech EuropeUniversity Campus STeP Ri Slavka Krautzeka 83/A 51000 Rijeka, Croatia Phone: +385 (51) 770 447 Fax: +385 (51) 686 166www.intechopen.com
InTech ChinaUnit 405, Office Block, Hotel Equatorial Shanghai No.65, Yan An Road (West), Shanghai, 200040, China Phone: +86-21-62489820 Fax: +86-21-62489821
The contributions in this book present an overview of cutting edge research on natural gas which is a vitalcomponent of world's supply of energy. Natural gas is a combustible mixture of hydrocarbon gases, primarilymethane but also heavier gaseous hydrocarbons such as ethane, propane and butane. Unlike other fossilfuels, natural gas is clean burning and emits lower levels of potentially harmful by-products into the air.Therefore, it is considered as one of the cleanest, safest, and most useful of all energy sources applied invariety of residential, commercial and industrial fields. The book is organized in 25 chapters that cover variousaspects of natural gas research: technology, applications, forecasting, numerical simulations, transport andrisk assessment.
How to referenceIn order to correctly reference this scholarly work, feel free to copy and paste the following:
Santiago Aparicio and Mert Atilhan (2010). Molecular Dynamics Simulations of Volumetric ThermophysicalProperties of Natural Gases, Natural Gas, Primož PotoÄÂnik (Ed.), ISBN: 978-953-307-112-1, InTech,Available from: http://www.intechopen.com/books/natural-gas/molecular-dynamics-simulations-of-volumetric-thermophysical-properties-of-natural-gases

© 2010 The Author(s). Licensee IntechOpen. This chapter is distributedunder the terms of the Creative Commons Attribution-NonCommercial-ShareAlike-3.0 License, which permits use, distribution and reproduction fornon-commercial purposes, provided the original is properly cited andderivative works building on this content are distributed under the samelicense.