Embed Size (px)
Citation preview
Progress in NUCLEAR SCIENCE and TECHNOLOGY, Vol. 2, pp.470-476 (2011)
c© 2011 Atomic Energy Society of Japan, All Rights Reserved.
470
Molecular Dynamics Simulation System for Structural Analysis of Biomolecules by High Performance Computing
Hisashi ISHIDA1,2,*
1Center for Computational Science and Engineering
2Quantum Beam Science Directorate
Japan Atomic Energy Agency, 8-1-7 Umemidai, Kizugawa, Kyoto 619-0215, Japan
We have developed an integrated molecular simulation system for biological macromolecules, called SCUBA
(Simulation Codes for hUge Biomolecular Assembly) which is designed to run a biomolecule system composed of more than one million particles efficiently on parallel computers. SCUBA is now being used not only for molecular dynamics (MD) simulations but also to determine the 3D structure of supra-macromolecules. For the latter purpose, a new method to fit a high-resolution X-ray structure at a certain reaction state into low-resolution electron microscopy (EM) data at different reaction states has been developed. In our method, the fitting is carried out using MD simula-tions in explicit water medium; the target function considers restraints to fit the X-ray structure into an EM density map, and the all-atom interactions for all the molecules including the water medium. This method was implemented into SCUBA and applied to ribosome, one of the supra-biomolecules utilized for translating genetic information to the amino acid sequence. The system was composed of more than 2 million atoms. The method showed that SCUBA can carry out the fitting simulation with a high parallelization efficiency ratio of more than 50% using 512 CPU cores of PRIMERGY BX900 supercomputer at the Japan Atomic Energy Agency.
KEYWORDS: molecular dynamics simulation, determination of 3D biomolecule structure, electron microscopy, ribosome, high performance computing
I. Introduction
Molecular dynamics (MD) simulation not only provides dynamic descriptions of molecules on the atomic scale, but also provides valuable information for the interpretation of experimental data.The rapid development of computer power and the elucidation of the structures of biological macromo-lecules by X-ray crystallography and other experiments have increased the need for large-scale MD simulations in the field of biology.
We have developed an integrated molecular simulation system for biological macromolecules, called SCUBA (Si-mulation Codes for hUge Biomolecular Assembly) which is designed to run a biomolecule system composed of more than one million particles efficiently on parallel computers.1) SCUBA showed an excellent performance for a variety of biomolecular systems such as Holliday junction of recombi-nant DNA and the 70S ribosome.2-4)
SCUBA is now being used not only for MD simulations but also to determine the 3D structure of su-pra-macromolecules. For the latter purpose, a new method to fit a high-resolution X-ray structure at a certain reaction state into low-resolution electron microscopy (EM) data at differ-ent reaction states has been developed. There have already been several refinement methods developed for this pur-pose.5-10) Molecular dynamics flexible fitting (MDFF) is one of the major programs used for this aim. In this program, the
*Corresponding author, E-mail: [email protected]
target function used considers restraints to fit the X-ray structure into an EM density map, and the atomic interac-tions among biomolecules. However, this method does not necessarily consider accurate atomic interactions such as in water medium because the calculation of such interactions is very time consuming. Moreover, to retain the secondary structure such as α-helices, -sheets and base-paired nucleo-tide residues, strong dihedral-angle restraints are imposed on α-helices and -sheets, and strong hydrogen-bond distance restraints are imposed on base-pairs during the fitting simu-lation. The structures determined by these methods are not necessarily accurate at the atomic level. A few studies use a few layers of water medium for the fitting.10) Although this amount of water may be sufficient to construct the fit struc-ture, it would not be sufficient if dynamics such as the conformational transition between the first atomic model (usually from an X-ray structure) and the final structure (usually fit in an EM structure) is also investigated.
In our new method, the fitting is carried out using MD simulations in explicit water medium not only to construct structural models which fit in the EM density maps but also to investigate the conformational transitions. This method was implemented into SCUBA and applied to ribosome, one of the supra-biomolecules utilized for translating genetic information to the amino acid sequence. We used EM data which have been observed by cryo-EM and single-particle reconstruction,11) and an atomic X-ray structure of the 70S ribosome complexed with tRNAs and elongation factor G
ARTICLE
Molecular Dynamics Simulation System for Structural Analysis of Biomolecules by High Performance Computing 471
VOL. 2, OCTOBER 2011
(EFG).12) Our aim is to build atomic structures of the 70S ribosome and analyze the conformational change during translation. The system was composed of more than 2 mil-lion atoms including water molecules. The new method showed that SCUBA can carry out the fitting simulation efficiently on PRIMERGY BX900 supercomputer at the Japan Atomic Energy Agency (JAEA).
II. Methods
1. Molecular Dynamics Simulation System, SCUBA MD simulation for biomolecules is performed by solving
the equation of motion using an energy function:
2 2
12 6min min
1 cos2
4 (1)
str r eq eqbonds angles dihedrals
atoms atomsij ij i j
iji j i jij ij ij
KU K r r K n
R R q q
r r Dr
Ustr consists of both bonded interaction terms (including bond stretching, bond angle bending and torsion angle twisting potentials) and non-bonded interaction terms (in-cluding van der Waals and electrostatic potentials).
r and θ are the values of the bond lengths and angles and req, and θeq are their equilibrium values, respectively. Kr and Kθ are bond and angle force constants respectively. The di-hedral term includes parameters for the dihedral force constant Kφ, the dihedral angle φ, the dihedral multiplicity n, and the phase shift γ. Non-bonded interactions between pairs of atoms i and j at a relative distance rij are represented by the last two terms. The van der Waals energy is calculated with Lennard-Jones 6-12 (LJ) potential parameters of Rij
min and εij: Rij
min is the distance between atoms i and j at which the LJ potential is equal to zero, and εij is the well depth of the LJ potential. Coulomb electrostatic energy is calculated by D (a dielectric constant) and qi (the partial atomic charge on atom i).
The programming of Eq. (1) demands meticulous work due to the complicated unique topology of bimolecules. To realize such high performance computing, State-of-the-art techniques were used for the development of SCUBA.
SCUBA has several special features: (1). A variety of force field parameters At present SCUBA can use the AMBER, CHARMM and
GROMOS force fields. (2). A variety of simulation methods A variety of simulation methods, such as energy minimi-
zation, molecular dynamics, free energy calculations, normal mode analysis, principal component analysis and so on, are included.
(3). Portability Written in Fortran90, SCUBA is designed to be easy to
read, modify and extend.Users can easily maintain the exist-ing code, and develop the current algorithms and integrate new ones.
(4). Parallelization SCUBA employs the domain decomposition (DD) me-
thod, which divides the volume of the physical system into
rectangular subcells with a length longer than the potential cutoff radius. The processor assigned to a subcell evaluates the interactions between the atoms in the subcell and be-tween the atoms in the neighboring subcells.
(5). Vectorization In order to improve the performance of SCUBA on
vector machines such as the Earth Simulator, the algorithm to calculate the interactions among the atoms is intensively vectorized.
(6). Dynamic load balance To overcome the load imbalance associated with irregular
atomic distribution, a dynamic load-balancing algorithm to keep the subcells equally reassigned to the processors during simulation is implemented.
(7). High performance By intensive parallelization and vectorization, and by us-
ing the dynamic load balance mentioned in (4), (5) and (6), SCUBA has achieved both a high parallelization efficiency ratio and a high vectorization ratio on the Earth Simulator. An MD simulation for a system of RuvAB-Holliday junction complex, which consisted of about 5.5×10⁵ atoms, achieved a parallelization efficiency ratio of 75.8%, and a vectoriza-tion ratio of 96.2% even when 45 nodes (360 CPU cores) were used.1) At present, using 512 CPU cores of PRIMERGY BX900 supercomputer at JAEA, SCUBA has achieved a parallelization efficiency ratio of more than 50%. (This will be discussed in details at Section IV.) 2. Algorithm for EM-Fitting Simulation
Single particle analysis using an electron microscope has been used to observe the structure of supra-biomolecules. However, the resolution of the EM image has not achieved the atomic level. Several studies have been carried out to determine the 3D structure of supra-biomolecules at atomic resolution by fitting the constituent molecules, determined by X-ray crystallography, into an EM density map. In those attempts, each constituent molecule is often fit into the EM density map manually, and the constituent molecules may have atomic collisions at their interfaces. To avoid the colli-sion, we have developed a flexible fitting method to alleviate the steric strain of atoms while retaining the condition that the constituent molecules fit the EM density map.5) However, because this previous method was used under the condition of a vacuum, a strong restraint was required to maintain the secondary structures, which may cause the structure to be unnatural.
Our new method utilizes an MD simulation method. First, from a given set of atomic coordinates, the simulated EM density at a k-th voxel point,
kMr can be calculated as:
sim ( ) ( )k kM i M i
i
G r r r , (2)
where ρi is the atomic mass in the atomic mass unit and ir
is the atomic coordinate of atom i. G is the Gaussian func-tion which distributes ρi to the voxel points around the atom.
sim ( )kM r is calculated as the sum of the contributions from
the neighboring atoms. The resolution of the EM density map we used here is defined by half the width of a Gaussian
472 Hisashi ISHIDA
PROGRESS IN NUCLEAR SCIENCE AND TECHNOLOGY
in Fourier space. In order to fit the atomic model into the EM density map,
we set a target function which is used to constrain the whole structure into an EM density map, in addition to the standard all-atom energy function which imposes physical constraints on the structure.
total EM EM strU k U U , (3)
where, Ustr is the standard all-atom energy function of Eq. (1), and kEM is a constant weight value. UEM is the function to fit the modeled structure into the EM density map. Here we employ the correlation coefficient (CC) of the simulated and computed densities times -1 as UEM:
sim exp1
exp sim2 2
exp sim1 1
( ) ( ), CC,
( ) ( )
(4)k k
k k
n
M Mk
EM M M n n
M Mk k
U
r rr r
r r
where expMr and
simMr represent the sets of voxel points,
1 2, ,...,
nM M Mr r r , for the experimental and simulated EM den-
sities respectively.exp ( )
kM r and sim ( )
kM r are the
experimental and simulated EM densities at a voxel point
kMr , respectively. n is the total number of voxel points in
the system. The fitting is then performed by minimizing the target function. The force derived from the derivative of CC is described as:
exp sim1
2 2exp sim
1 1
exp sim sim sim1 1
2 2 2sim exp sim
1 1 1
( ) ( )( ) (5)
( ) ( )
( ) ( ) ( ) ( )
( ) ( ) ( )
k k
k
k k
k k k k
k k k
n
M MkEM
EM M n n
M Mk k
n n
M M M Mk k
n n n
M M Mk k k
U
r
r rF r
r r
r r r r
r r r
It should be noted that the force in Eq. (5) is not calcu-
lated at the atomic position but at the voxel points. The force at each particle is given as:
1 sim
( )( ) ( )
( )k
k
k
ni M i
EM i EM Mk M
G
r r
F r F rr
. (6)
where sim( ) / ( )
k ki M i MG r r r is the contribution ratio of an
i-th atom to sim ( )
kM r (see Eq. (2)). If there is no contribu-
tion of the i-th atom to sim ( )
kM r then
sim( ) / ( )k ki M i MG r r r is zero, while if only the i-th atom
contributes to sim ( )
kM r then sim( ) / ( )
k ki M i MG r r r is
one. In this study, we call FEM an EM density force. The total force which should be imposed on the atomic positions can be described as:
( ) ( ) ( )total i EM EM i str ik F r F r F r , (7)
where ( )istr i strU rF r is the atomic interaction force
derived from Eq. (1). Thus, the atomic positions at the next step can be calculated using the force of Eq. (7) during either the minimization or MD simulation. The updated atomic positions are evaluated by the target function in Eq. (3) and the stepwise procedure from Eq. (3) to Eq. (7) is repeated until the target function has been sufficiently minimized. Thus, fitting of the simulated structure can be carried out so that the simulated coordinates fit into the experimental EM density map without causing steric strain. Practically, instead of using kEM, it is convenient to use wEM :
( ) / ( )EM EM EM i str iw k F r F r (8)
where < > shows the average among atoms. If wEM = 1. 0 then kEM is set to be <kEM·|FEM |>, the averaged amplitude of the EM-fitting force used in EM-fitting simulations, is the same as that of Fstr.
III. Materials
1. X-Ray and EM Structure of Ribosome We used the target EM data of Escherichia coli 70S ribo-
some, which were observed under reaction conditions in tRNA translocation. The data were selected because these data suggest a global and concerted motion of the 70 S ribo-some.9,11) The data were obtained from the electron microscopy database at the European Bioinformatics Insti-tute; EMD-1365 and EMD-136311) corresponding to the intermediate and pre-translocational states respectively (Ta-ble 1).
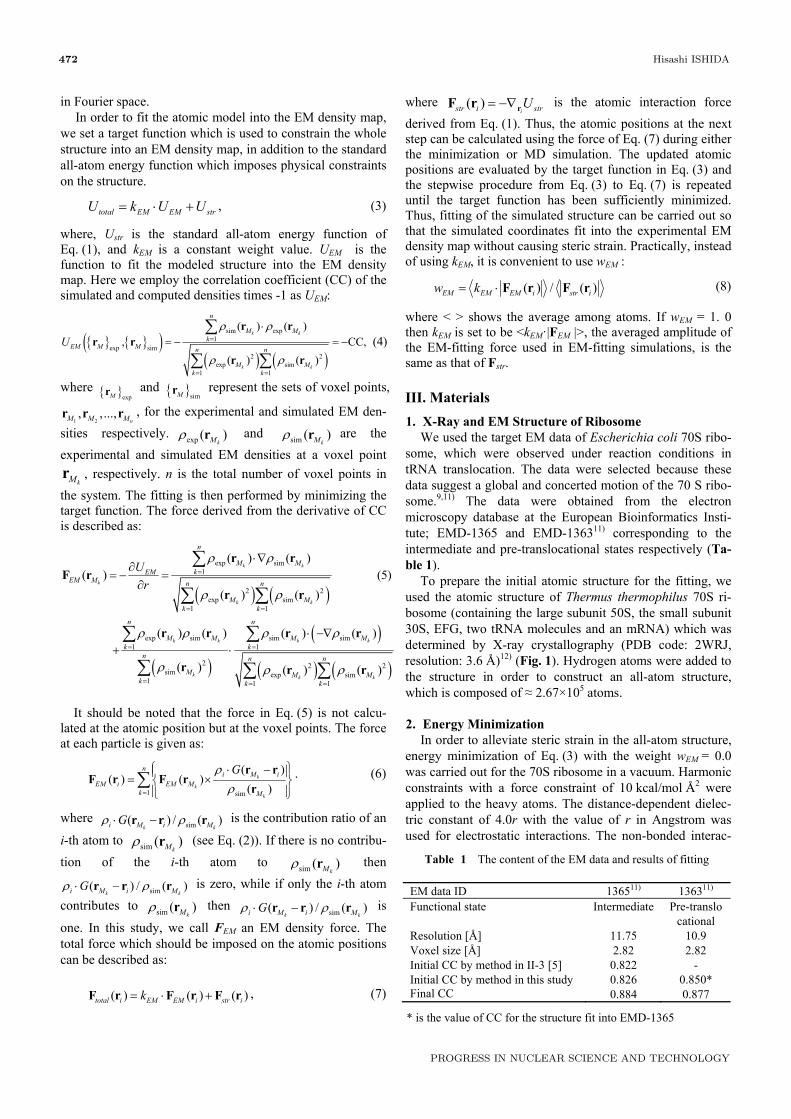
To prepare the initial atomic structure for the fitting, we used the atomic structure of Thermus thermophilus 70S ri-bosome (containing the large subunit 50S, the small subunit 30S, EFG, two tRNA molecules and an mRNA) which was determined by X-ray crystallography (PDB code: 2WRJ, resolution: 3.6 Å)12) (Fig. 1). Hydrogen atoms were added to the structure in order to construct an all-atom structure, which is composed of ≈ 2.67×10⁵ atoms.
2. Energy Minimization
In order to alleviate steric strain in the all-atom structure, energy minimization of Eq. (3) with the weight wEM = 0.0 was carried out for the 70S ribosome in a vacuum. Harmonic constraints with a force constraint of 10 kcal/mol Å2 were applied to the heavy atoms. The distance-dependent dielec-tric constant of 4.0r with the value of r in Angstrom was used for electrostatic interactions. The non-bonded interac-
Table 1 The content of the EM data and results of fitting
EM data ID 136511) 136311) Functional state Resolution [Å] Voxel size [Å] Initial CC by method in II-3 [5] Initial CC by method in this study Final CC
Intermediate
11.75 2.82 0.822 0.826 0.884
Pre-translocational
10.9 2.82
- 0.850* 0.877
* is the value of CC for the structure fit into EMD-1365

Molecular Dynamics Simulation System for Structural Analysis of Biomolecules by High Performance Computing 473
VOL. 2, OCTOBER 2011
tions were evaluated with a cut-off radius of 14 Å. The mod-eled 3D structures were minimized for 1,000 steps of the steepest descent method followed by 10,000 steps of the conjugate gradient method.
3. Alignment of EM Density Maps to the Ener-
gy-Minimized Structure Using Rigid-Body Fitting Method The initial position and orientation of the whole atomic
model should be as similar to the target position and orienta-tion in the EM density map as possible. First, we used a rigid-body fitting method by regarding the whole atomic model as a rigid-body. The high-values voxel points in the EM density map were selected so that the volume occupied by the voxel points was equivalent to the molecular volume. The model was fit into the map by matching moments of inertia between the atomic model and selected voxel points. Finally, the structure was slightly translated and rotated until the position and orientation of the molecule fit into the target EM density map as closely as possible.9)
4. Rigid-Body Fitting Using MD Simulation in a Va-
cuum It should be noted that the target function used in the pre-
vious section III. 3 is to fit the data points into the molecular volume of ribosome.9) In contrast, the target function for fitting in this study is the correlation coefficient (CC), and all the data which are positive were used for the EM-fitting. Therefore the fit structure obtained by the previous method in Section III. 3 can be different from the structure obtained by the method using MD simulation.
In the rigid-body fitting, a simulated-annealing MD algo-rithm was employed because the optimization of molecular structures can be achieved without causing them to get trapped at local minima. To perform large-scale simulations rapidly, a dynamic load balance algorithm described in Sec-
tion II. 1, which optimizes the load balance among the pro-cessors, was employed. If the processors are equally assigned to the same sub-space of the system divided by the domain-decomposition method, the irregular distribution of the atoms in a vacuum lowers the efficiency of the do-main-decomposition method as time elapses. The dynamic load balance is especially effective for our MD simulations performed in a vacuum, where the distribution of atoms in the system is heavily heterogeneous. By using the dynamics load balance we could increase the computational speed by about 2-fold.
The rigid-body fitting simulation was applied for EMD-1365. The system was heated to be 100,000 K using wEM = 1.0. The high temperature of 100,000 K comes from the fact that the number of variables of freedom in the sys-tem is small in the first stage. The temperature was gradually decreased from 100,000 K to 0 K. When the CC converged at a maximum, the structure of the 70S ribosome was se-lected as the initial structure for the following flexible fitting. The total time of the simulated-annealing to optimize the 3D structure of the 70S ribosome was about 100 ps.
The CC for EMD-1365 increased from an initial value of 0.822 up to 0.826. The atoms deviated from the initial posi-tions by less than 1.09 Å on average. Considering that the resolution of EMD-1365 is rather low, 11.75 Å, it was con-cluded that the rigid-body fitting using the previous method in Section III. 39) and the rigid-body fitting using MD simu-lation in this study give substantially the same result of the fitting.
5. Preparation for Flexible Fitting in Water Medium
To neutrize the system optimized by the rigid-body fitting simulation, magnesium ions were used. Moreover, excess ions, including magnesium, potassium, and chloride, were added in the box at concentrations of 0.1 M KCl and 7 mM MgCl2. A buffer of water around the solute of at least 15 Å in all directions was used. The total system contained ≈ 2.11 ×10⁶ atoms (including ≈ 6.11 ×10⁵ water molecules)
The system was first heated from 0 K to 350 K within 500 ps during which the molecules and bound ions were fixed with decreasing restraints and the water molecules and excess ions were allowed to move. After the restraints were removed, the system was equilibrated for 1 ns with no re-straint at a constant pressure of one bar and a temperature of 350 K. Then the box-size was fixed, and the system was equilibrated for a further 1ns at a constant temperature of 350 K. During the equilibration the translational and rota-tional movements were removed. To integrate the equation of motion, the multi-time-step (MTS) algorithm was used with a time step of 1 and 2 fs for short and medium forces with the smooth cut-off of 8 Å and 4 fs for other long-range forces. The time step for the EM-fit algorithm was set at 8 fs. For the EM-fit, all the density values more than zero were used.
6. Optimal Weight for EM-Fitting Force
wEM should be large enough to fit the atomic model into an EM density map, while wEM should be small enough not to
Fig. 1 The X-ray structure of the 70S ribosome complexed with two tRNAs and EFG.12) 50S, 30S, E-tRNA, P-tRNA, EFG and L10-L12 stalk are shown in white, yellow, purple, green, red and cyan, respectively. They are all depicted as wire models.

474 Hisashi ISHIDA
PROGRESS IN NUCLEAR SCIENCE AND TECHNOLOGY
overfit it too much. If all the atoms are fit into a medium or low-resolution map by using too large wEM, atoms will spread uniformly to make a blurred map.
To assess the optimal weight for EM-force, the CC and the number of residues forming α-helix in proteins in the 70S ribosome was evaluated. Figure 2(a) shows the time evolu-tion of the CC. With wEM = 0, the CC decrease slowly because ribosome slid slowly from the EM density map. With wEM ≥ 1.0×10⁻⁴ (0.01%), the CC increases. Figure 2(b) shows the time evolution of the number of α-helices. α-helices start to corrupt if wEM ≥ 3.0×10⁻⁴, indicating that overfit of the atomic structure into the EM map has occurred. If wEM ≤ 2.0×10⁻⁴ is used, α-helices are maintained. This tendency in the change in the number of residues in α-helices in Fig. 2 was observed with regards to the -sheets (not shown in figure). It is generally considered that the main-tenance of local sub-structures such as secondary structures is favorable during EM-fitting simulations.7) Consequently, it is concluded that wEM should not exceed 2.0×10⁻⁴ (0.02%) to maintain the secondary structures such as the α-helices and -sheets. (In the actual fitting simulation mentioned in Sec-tion IV, a long-time simulation of about 100 ns with a smaller wEM of less than 1.0×10⁻⁴ was performed to increase the CC slowly ont only to obtain the fit structure but also to investigate the conformational changes at the atomic level.)
It should be noted that the EM force with wEM = 2.0×10⁻⁴, which seems to be much smaller than the atomic interaction force, does not necessarily mean that the total EM force at a certain area is also small. If the area does not match the EM density area, then the direction of the EM force of the atoms in this area will be similar because the atoms in this area should move in the same direction to match the EM density area. In this case, the total EM force could be quite large to move the area into the EM density map. In contrast, the di-rections of the atomic interaction forces in this area may be varied, and the total atomic interaction force could be small-
er than the total EM density force. IV. Performance of SCUBA with EM-Fitting Algo-
rithm
While SCUBA is parallelized by using the domain de-composition method, the EM-fitting method was parallelized by using the slab decomposition method. The length of the slab was set to be the same size as the voxel size, 2.82 Å, of the EM density maps. Each CPU core is assigned to deal with the atoms in a certain range of slabs and calculate the simulated EM density values in Eq. (2) and the EM density force in Eq. (6).
Figure 3 shows the performance of SCUBA. The stan-dard performance of SCUBA (without using the EM-fitting algorithm) has a parallelization efficiency of more than 50% using 512 CPU cores. Although the performance of SCUBA using the EM-fitting algorithm deteriorates slightly due to the decreased parallelization efficiency of the EM-fitting algorithm, the efficiency is virtually the same as the standard performance. V. Result
1. Optimal Structure Fit into EMD-1365 and EMD-1363 The EM-fitting simulation was carried out until the posi-
tions of the center of mass of the constituent molecules in the 70S ribosome were far enough from those at the initial position but still close enough for these to overlap their dis-tribution. For this fitting, the fitting simulation was carried out for about 400 ps on average. Then in order to relax the conformation which might be deformed due to the artificial EM force, the conventional MD simulation was carried out without the EM-force (wEM = 0.0) but by imposing harmonic potentials on these centers of mass for 2 ns. This procedure was repeated 50 times, and wEM was increased gradually from 1.0 × 10⁻⁵ up to less than 1.0 × 10⁻⁴. After the atomic
Fig. 2 (a) The time evolution of the correlation coefficient in Eq. (4). The lines are for wEM = 1.0×10⁻³ (inverted triangle), 5.0×10⁻⁴ (square), 4.0×10⁻⁴ (diamond), 3.0×10⁻⁴ (green circle), 2.0×10⁻⁴ (red circle), 1.0×10⁻⁴ (black circle) and 0.0 (triangle), from top respectively. (b) The number of residues forming α-helices in proteins in the 70S ribosome. The orders of the lines are the same as (a).
Molecular Dynamics Simulation System for Structural Analysis of Biomolecules by High Performance Computing 475
VOL. 2, OCTOBER 2011
structure was fit into EMD-1363, the fitting simulation to fit it into EMD-1365 was carried out. The final CCs for EMD-1365 and EMD-1363 were 0.884 and 0.877, respec-tively (Table 1).
The total time for this calculation was 120 ns (20 ns for the fitting simulations and 100 ns for standard MD simula-tions). It was confirmed that the secondary structures in the 70S ribosome were maintained throughout the simulations. The total CPU core time used was about 1 million hours on PRIMERGY BX900 and FX1 supercomputers at JAEA.
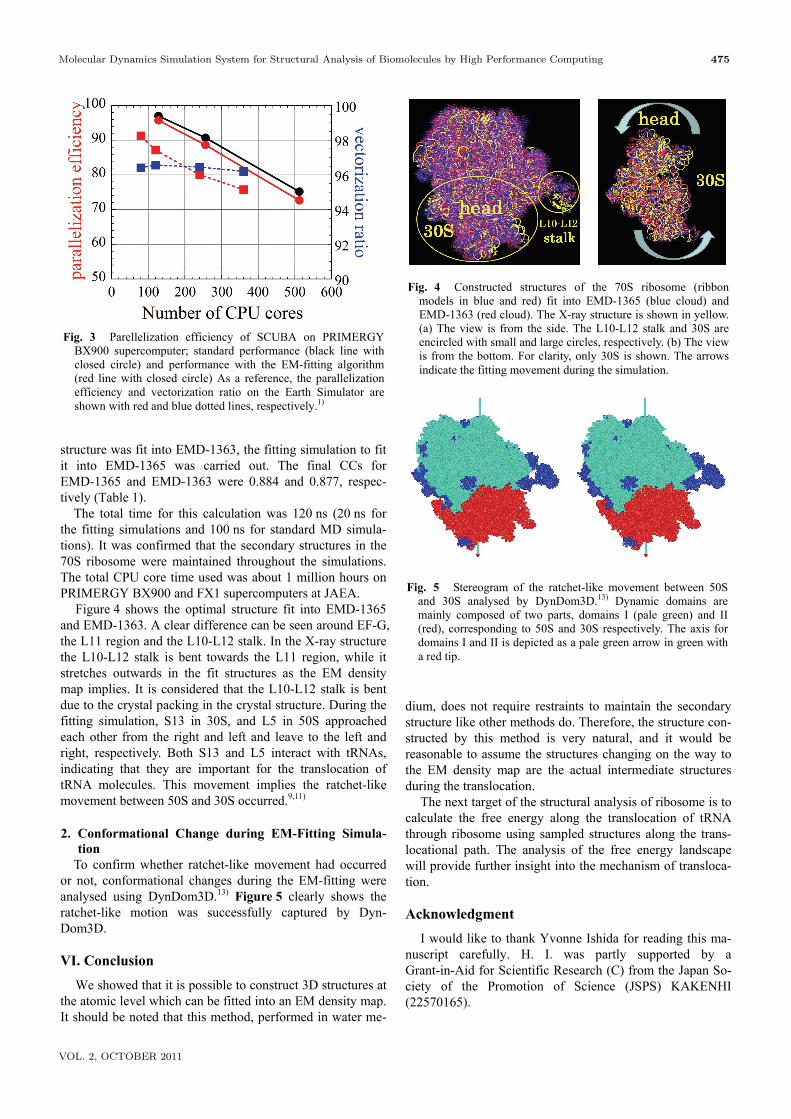
Figure 4 shows the optimal structure fit into EMD-1365 and EMD-1363. A clear difference can be seen around EF-G, the L11 region and the L10-L12 stalk. In the X-ray structure the L10-L12 stalk is bent towards the L11 region, while it stretches outwards in the fit structures as the EM density map implies. It is considered that the L10-L12 stalk is bent due to the crystal packing in the crystal structure. During the fitting simulation, S13 in 30S, and L5 in 50S approached each other from the right and left and leave to the left and right, respectively. Both S13 and L5 interact with tRNAs, indicating that they are important for the translocation of tRNA molecules. This movement implies the ratchet-like movement between 50S and 30S occurred.9,11) 2. Conformational Change during EM-Fitting Simula-
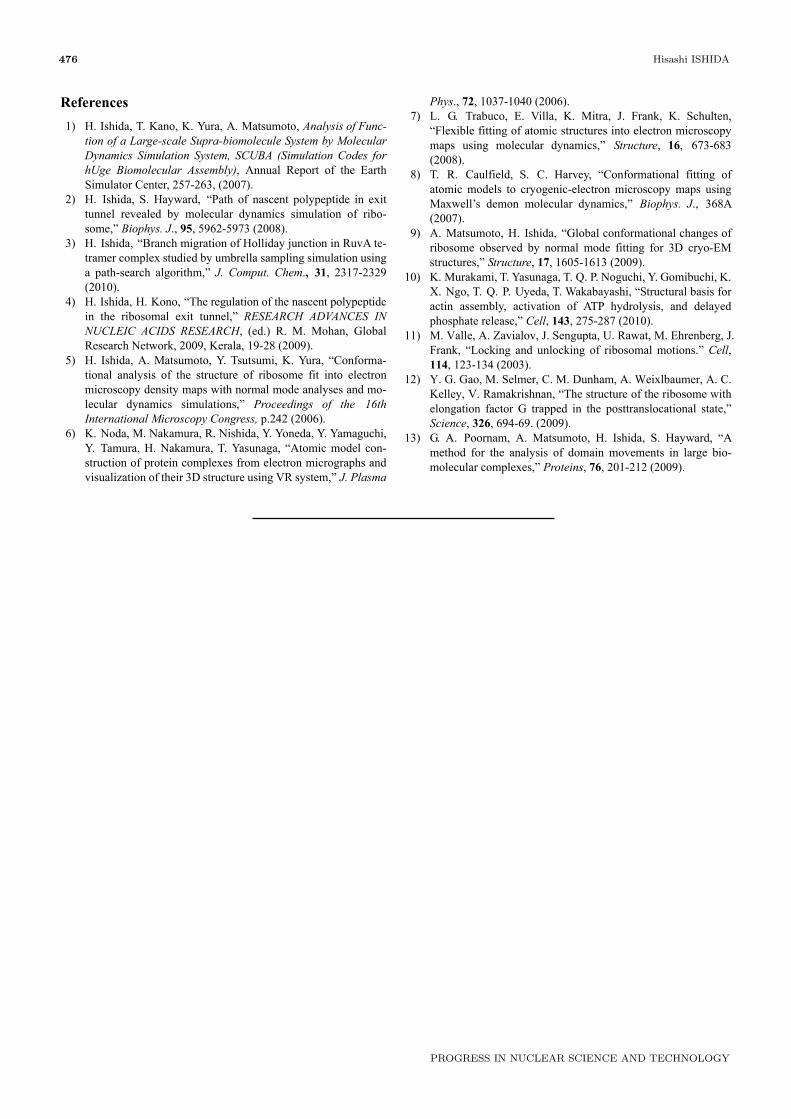
tion To confirm whether ratchet-like movement had occurred
or not, conformational changes during the EM-fitting were analysed using DynDom3D.13) Figure 5 clearly shows the ratchet-like motion was successfully captured by Dyn-Dom3D.
VI. Conclusion
We showed that it is possible to construct 3D structures at the atomic level which can be fitted into an EM density map. It should be noted that this method, performed in water me-
dium, does not require restraints to maintain the secondary structure like other methods do. Therefore, the structure con-structed by this method is very natural, and it would be reasonable to assume the structures changing on the way to the EM density map are the actual intermediate structures during the translocation.
The next target of the structural analysis of ribosome is to calculate the free energy along the translocation of tRNA through ribosome using sampled structures along the trans-locational path. The analysis of the free energy landscape will provide further insight into the mechanism of transloca-tion.
Acknowledgment
I would like to thank Yvonne Ishida for reading this ma-nuscript carefully. H. I. was partly supported by a Grant-in-Aid for Scientific Research (C) from the Japan So-ciety of the Promotion of Science (JSPS) KAKENHI (22570165).
Fig. 3 Parellelization efficiency of SCUBA on PRIMERGY BX900 supercomputer; standard performance (black line with closed circle) and performance with the EM-fitting algorithm (red line with closed circle) As a reference, the parallelization efficiency and vectorization ratio on the Earth Simulator are shown with red and blue dotted lines, respectively.1)
Fig. 4 Constructed structures of the 70S ribosome (ribbon models in blue and red) fit into EMD-1365 (blue cloud) and EMD-1363 (red cloud). The X-ray structure is shown in yellow. (a) The view is from the side. The L10-L12 stalk and 30S are encircled with small and large circles, respectively. (b) The view is from the bottom. For clarity, only 30S is shown. The arrows indicate the fitting movement during the simulation.
Fig. 5 Stereogram of the ratchet-like movement between 50S and 30S analysed by DynDom3D.13) Dynamic domains are mainly composed of two parts, domains I (pale green) and II (red), corresponding to 50S and 30S respectively. The axis for domains I and II is depicted as a pale green arrow in green with a red tip.
476 Hisashi ISHIDA
PROGRESS IN NUCLEAR SCIENCE AND TECHNOLOGY
References
1) H. Ishida, T. Kano, K. Yura, A. Matsumoto, Analysis of Func-tion of a Large-scale Supra-biomolecule System by Molecular Dynamics Simulation System, SCUBA (Simulation Codes for hUge Biomolecular Assembly), Annual Report of the Earth Simulator Center, 257-263, (2007).
2) H. Ishida, S. Hayward, “Path of nascent polypeptide in exit tunnel revealed by molecular dynamics simulation of ribo-some,” Biophys. J., 95, 5962-5973 (2008).
3) H. Ishida, “Branch migration of Holliday junction in RuvA te-tramer complex studied by umbrella sampling simulation using a path-search algorithm,” J. Comput. Chem., 31, 2317-2329 (2010).
4) H. Ishida, H. Kono, “The regulation of the nascent polypeptide in the ribosomal exit tunnel,” RESEARCH ADVANCES IN NUCLEIC ACIDS RESEARCH, (ed.) R. M. Mohan, Global Research Network, 2009, Kerala, 19-28 (2009).
5) H. Ishida, A. Matsumoto, Y. Tsutsumi, K. Yura, “Conforma-tional analysis of the structure of ribosome fit into electron microscopy density maps with normal mode analyses and mo-lecular dynamics simulations,” Proceedings of the 16th International Microscopy Congress, p.242 (2006).
6) K. Noda, M. Nakamura, R. Nishida, Y. Yoneda, Y. Yamaguchi, Y. Tamura, H. Nakamura, T. Yasunaga, “Atomic model con-struction of protein complexes from electron micrographs and visualization of their 3D structure using VR system,” J. Plasma
Phys., 72, 1037-1040 (2006). 7) L. G. Trabuco, E. Villa, K. Mitra, J. Frank, K. Schulten,
“Flexible fitting of atomic structures into electron microscopy maps using molecular dynamics,” Structure, 16, 673-683 (2008).
8) T. R. Caulfield, S. C. Harvey, “Conformational fitting of atomic models to cryogenic-electron microscopy maps using Maxwell’s demon molecular dynamics,” Biophys. J., 368A (2007).
9) A. Matsumoto, H. Ishida, “Global conformational changes of ribosome observed by normal mode fitting for 3D cryo-EM structures,” Structure, 17, 1605-1613 (2009).
10) K. Murakami, T. Yasunaga, T. Q. P. Noguchi, Y. Gomibuchi, K. X. Ngo, T. Q. P. Uyeda, T. Wakabayashi, “Structural basis for actin assembly, activation of ATP hydrolysis, and delayed phosphate release,” Cell, 143, 275-287 (2010).
11) M. Valle, A. Zavialov, J. Sengupta, U. Rawat, M. Ehrenberg, J. Frank, “Locking and unlocking of ribosomal motions.” Cell, 114, 123-134 (2003).
12) Y. G. Gao, M. Selmer, C. M. Dunham, A. Weixlbaumer, A. C. Kelley, V. Ramakrishnan, “The structure of the ribosome with elongation factor G trapped in the posttranslocational state,” Science, 326, 694-69. (2009).
13) G. A. Poornam, A. Matsumoto, H. Ishida, S. Hayward, “A method for the analysis of domain movements in large bio-molecular complexes,” Proteins, 76, 201-212 (2009).