Embed Size (px)
Citation preview

p 1
Molecular Characterization and Quantitation of Lipids with High Resolution Accurate Mass Tandem MS Techniques Infusion MS/MSALL Workflow on the AB SCIEX TripleTOF™ 5600 System
Brigitte Simons, Eva Duchoslav, Lyle Burton, Ron Bonner. 1AB SCIEX, Toronto, Canada; Qualitative mass spectrometry experiments are most commonly performed by information dependent acquisition strategies, where a survey scan is collected, and precursors are selected for MS/MS analysis based on a set of user defined criteria. This is widely applied for LC-MS/MS analyses in qualitative screening, semi-quantitative profiling, and compound identification experiments. However, for some experiments such as the analysis of complex lipid samples, information independent strategies can offer some key advantages. A simple information-independent technique involves stepping a mass isolation window across a set mass range in small increments, fragmenting selected precursor ions in a collision cell, and recording all product ions. As previously attempted with ion trapping MS platforms in past years1,2, MS/MS of all precursors ions is highly desirable as an un-biased profiling technique as nothing is missed and all product ion data can be mined retrospectively.
Quadrupole time of flight (QqTOF) instruments are well suited to data-independent experiments as they provide high resolution and mass accuracy and without speed or mass range limitations. Furthermore, the strength of QqTOF instruments for lipid molecular identification applications3,4 has been well demonstrated. Here, we review the data independent Infusion MS/MSALL Workflow and its application towards the comprehensive analysis of biological lipid extracts (Figure 1).
Key Benefits of the Infusion MS/MSALL Workflow for Lipidomics The key benefits of this qualitative and quantitative lipid profiling workflow are:
• Automated collection of MS/MS of all lipids via step-wise sampling of all precursors within the desired mass range with precursor ions selected at unit resolution.
• Extraction of any precursor ion spectrum, neutral loss, and corresponding product ion spectrum, retrospectively.
• Combination with a high resolution (>30,000 resolution) TOF MS scan for accurate mass precursor ion characterization
• Simple, fast, development-free workflow that is amenable to shotgun direct infusion of whole and class separated lipid extracts from plasma, tissue, or other biofluids and delivers answers.
Figure 1. Infusion MS/MSALL Workflow for Lipids on the TripleTOF™ 5600 System. Three-dimensional contour plot of all precursors and product ions of a liver lipid extract, acquired in negative mode using the Infusion MS/MSALL Workflow. Plots are created using PeakView™ Software.

p 2
Methods Sample Preparation: Lipid extracts of bovine brain and liver tissue were obtained from Avanti Polar Lipids (GA, USA) and standardized for total amount of lipid (~2 µM). Lipid internal standards containing non-endogenous 17:0 fatty acids were added to a final concentration of 0.02 µM and diluted appropriately into chloroform and methanol [1:2 (v/v)] with 5 mM ammonium acetate.
NanoESI-Infusion: Lipid extracts were introduced into the TripleTOF™ 5600 System by direct infusion using the Nanospray® III source and an Eksigent NanoLC Ultra® and Autosampler at a flowrate of 1 µL/min. Brain and liver samples were analyzed in replicate injections (n=5).
Data Acquisition: The Infusion MS/MSALL Workflow on the TripleTOF™ 5600 System is activated by the MS/MSALL Mode tool in the Analyst® TF 1.5.1 Software. By activating this mode, Q1 isolated masses and steps are derived from an inclusion list of masses with appropriate mass defects that can be set for both positive and negative modes. The experiment consists of a TOF MS scan from 200-1500 m/z accumulated for 250 ms followed by an ordered acquisition of ~1000 product ion spectra acquired from Q1 mass 200.051 to 1200.051 m/z stepping by 1 Da (Figure 2). MS/MS spectra are acquired from 100 – 1500 m/z accumulated for 100 ms each and the total cycle time for the experiment is 1.8 min per polarity.
Data Processing: Visualization of the 3-dimensional Infusion MS/MSALL workflow data was done using PeakView™ Software and lipid identification and quantitation was done in LipidView™ Software.
TripleTOF™ 5600 System is Key for the Infusion MS/MSALL Workflow The combination of features in the TripleTOF™ 5600 System makes it a perfect technology for performing highly productive identification and quantitation of lipids using the data independent Infusion MS/MSALL workflow. As outlined in Figures 2 and 3, complex lipid extracts are introduced by direct infusion or flow injection using the NanoSpray® Source. The mass selective quadrupole, Q1 is set to step 1 Da increments across the mass range, selecting lipid precursor ions at unit resolution. Isolated precursor ions are transmitted through the LINAC® collision cell for complete CID fragmentation and all fragment ions are recorded as high resolution TOF spectra. Additionally, a high resolution TOF MS scan is included in the cycle to provide high mass accuracy information on the selected precursors, generating a complete information map for lipid identification.
Because of the AcceleratorTOF™ Analyzer and the detector technology (40 GHz time to digital converter), the MS and MS/MS spectra acquired on the TripleTOF™ 5600 System are high resolution (>30 000 or >15 000 acquisition modes) and high mass accuracy (~2 ppm). High instrument sensitivity enables high speed acquisition so the comprehensive dataset is acquired in under 2 minutes. Overall, the infusion MS/MSALL workflow on the TripleTOF™ 5600 System is a powerful and productive system for the identification and quantitation of lipids.
Figure 3: Infusion MS/MSALL Workflow Data Collection. The ordered collection of MS/MS from Q1 steps 200 to 1200 m/z can be visualized using PeakView™ Software IDA Explore module. Precursor mass/charge is shown on the y-axis and time is shown on the x-axis. Time is directly proportional to Q1 m/z from 200 – 1200 m/z and the x-axis can be labeled as precursor m/z that directly aligns with cycle time.
Figure 2: Infusion MS/MSALL Workflow. Lipid precursors are selected at unit resolution in Q1, fragmented, and all product ions are detected simultaneously; this is done at each Q1 mass step through the mass range (A). This produces a 3D data set as shown in Figure 1 that allows for post-acquisition data extraction. A typical acquisition cycle is shown in B and consists of a TOF MS scan followed by the stepped acquisition of 1000 MS/MS spectra. This acquisition requires 1.8 min to generate a comprehensive dataset.

p 3
Data Visualization Tools in PeakView™ Software A complete record of all precursors, product ions, and neutral losses is collected within a single cycle of the infusion MS/MSALL
workflow. A three-dimensional contour plot showing intensity as a function of both precursor and fragment masses can be derived such as that shown for a total brain lipid extract in Figure 5B. Precursor mass/charge (Q1) is shown on the x-axis and the resulting product ions for each mass are shown along the y-axis. Ion intensity is visualized by varying the depth of color and can be adjusted by the user.
MS/MS Spectra Extraction: The MS/MS data can be easily reviewed using the IDA explore module in PeakView™ Software. As each product ion spectrum is acquired in ordered step-wise fashion from m/z 200 to 1200 m/z, each data point can be selected to reveal the high resolution accurate mass MS/MS spectrum (Figure 3).
Specific Fragment Ion or Neutral Loss Extraction: From the 3D dataset, effective neutral loss or precursor ion scans can also be extracted from the data, as shown by the blue, pink or green rectangle traces in Figure 5B. A filtering utility is available in PeakView Software for the review of precursor ion (Figure 5C) spectra or neutral loss spectra (Figures 4 & 6).
Extraction of a specific fragment ion can be performed to determine which precursors possess a specific lipid component (Figure 5C). In combination with the high resolution TOF MS data, the accurate mass of precursors of interest can be determined (Figure 5A).
Figure 5. Extracting High Resolution TOF MS, Precursor Ion, and Product ion Scan Data from an Infusion MS/MSALL Dataset. A high resolution TOF MS profile of all lipids from a brain extract is collected in positive mode (A). From the Infusion MS/MSALL acquisition, a contour plot demonstrates the complete chemical profile of all precursor ions, product ions, and neutral losses (B). Specific intensity information for precursor or fragment ions of interest can be extracted using a filtering utility in PeakView™ Software enabling the extraction of any spectrum; as an example a precursor ion spectrum of 184.1 m/z (C) and a product ion spectrum of 874.7 are extracted (C inset).
Figure 4. Neutral Loss Scan Extraction and Lipid Identification. From Infusion MS/MSALL workflow data, neutral loss data can be generated by extracting the intensities of neutral losses from the precursor ion (Figure 5B diagonal green rectangle trace). This allows detection of all precursors that possess a specific neutral loss and belong to a specific lipid class (top). From the precursor ion, neutral loss and MS/MS data, the identity of the specific lipids can be determined (bottom) in PeakView™ Software.

p 4
As shown in Figure 5, a filter for neutral loss (NL) 273.27 reveals all corresponding precursor ions from TAG species containing fatty acid 16:0. This is a targeted processing strategy to visualize lipid brutto species containing key fatty acid moieties, which can then be confirmed by high resolution MS/MS fragments to assign the true molecular composition. Multiple filters can be applied enabling a molecular array of several TAG species displayed by common fatty acids, for example, 14:0, 16:0, and 18:1 (Figure 6).
Lipid Species Identification Using LipidView™ Software LipidView™ Software allows the batch processing of TOF MS and MS/MS collected in the Infusion MS/MSALL workflow in both polarities, for the identification of lipid molecular species using a lipid fragments database. Because of the high resolution accurate mass MS data, de-isotoping corrections can be applied which provides a more accurate response of the lipid species identified. Lipid species peak intensities or peak area measurements can then be corrected or normalized against their class-specific internal standards to further offer semi-quantitative information aligned across several samples and experiments. The Data Details Workspace within the software enables the viewing of all precursor masses with all fragment ions giving rise to the assigned lipid species (see Figure 7). These results align
the positive mode Infusion MS/MSALL workflow results of brain tissue against liver tissue (n=5 each) for comparison. Internal standards correct and normalize the response of their corresponding class, and the responses and reproducibility of the internal standards are shown in Figure 8 for this experiment.
Figure 6: Fragment Ion and Neutral Loss Filters Provide a Means of Reviewing Lipid-Specific Profiles and MS/MS Evidence with Ease. TAG profiling in liver lipid Infusion MS/MSALL workflow data is shown by extracting precursor ions that generate neutral loss signatures for 14:0, 16:0, and 18:1 fatty acids. Underlying MS/MS spectra are then used to identify the remaining molecular components to identify the TAG species.
Figure 7: Data Details View in LipidView™ Software. This view shows the alignment of precursor mass/charge and fragment mass assigned to an identified lipid. The positive mode lipid class profile shown here is generated across the brain and liver lipid extracts in positive mode (n=5).
Figure 8: Lipid Class Internal Standards can be Reviewed for Sensitivity and Reproducibility in LipidView™ Software. Phosphoglycerolipid internal standards detected in negative mode [A] and positive mode [B] are shown with calculated %CV across all samples.
p 5
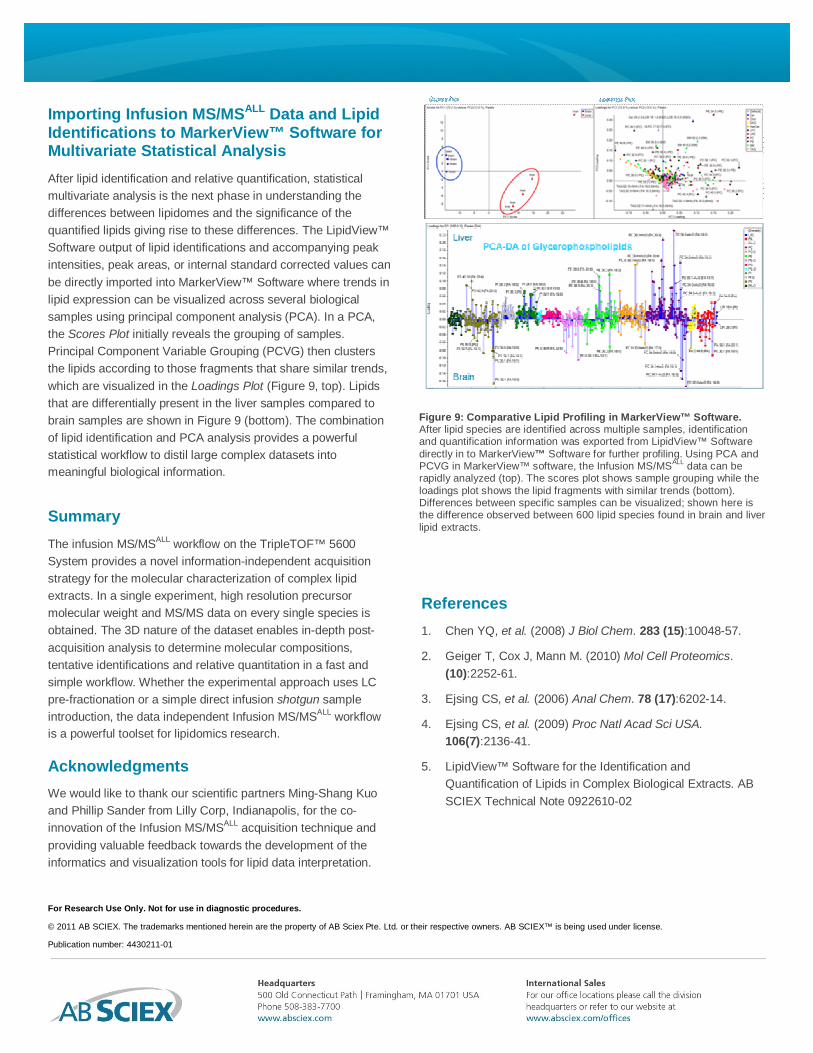
Importing Infusion MS/MSALL Data and Lipid Identifications to MarkerView™ Software for Multivariate Statistical Analysis After lipid identification and relative quantification, statistical multivariate analysis is the next phase in understanding the differences between lipidomes and the significance of the quantified lipids giving rise to these differences. The LipidView™ Software output of lipid identifications and accompanying peak intensities, peak areas, or internal standard corrected values can be directly imported into MarkerView™ Software where trends in lipid expression can be visualized across several biological samples using principal component analysis (PCA). In a PCA, the Scores Plot initially reveals the grouping of samples. Principal Component Variable Grouping (PCVG) then clusters the lipids according to those fragments that share similar trends, which are visualized in the Loadings Plot (Figure 9, top). Lipids that are differentially present in the liver samples compared to brain samples are shown in Figure 9 (bottom). The combination of lipid identification and PCA analysis provides a powerful statistical workflow to distil large complex datasets into meaningful biological information.
Summary The infusion MS/MSALL workflow on the TripleTOF™ 5600 System provides a novel information-independent acquisition strategy for the molecular characterization of complex lipid extracts. In a single experiment, high resolution precursor molecular weight and MS/MS data on every single species is obtained. The 3D nature of the dataset enables in-depth post-acquisition analysis to determine molecular compositions, tentative identifications and relative quantitation in a fast and simple workflow. Whether the experimental approach uses LC pre-fractionation or a simple direct infusion shotgun sample introduction, the data independent Infusion MS/MSALL workflow is a powerful toolset for lipidomics research.
Acknowledgments We would like to thank our scientific partners Ming-Shang Kuo and Phillip Sander from Lilly Corp, Indianapolis, for the co-innovation of the Infusion MS/MSALL acquisition technique and providing valuable feedback towards the development of the informatics and visualization tools for lipid data interpretation.
References 1. Chen YQ, et al. (2008) J Biol Chem. 283 (15):10048-57.
2. Geiger T, Cox J, Mann M. (2010) Mol Cell Proteomics. (10):2252-61.
3. Ejsing CS, et al. (2006) Anal Chem. 78 (17):6202-14.
4. Ejsing CS, et al. (2009) Proc Natl Acad Sci USA. 106(7):2136-41.
5. LipidView™ Software for the Identification and Quantification of Lipids in Complex Biological Extracts. AB SCIEX Technical Note 0922610-02
Figure 9: Comparative Lipid Profiling in MarkerView™ Software. After lipid species are identified across multiple samples, identification and quantification information was exported from LipidView™ Software directly in to MarkerView™ Software for further profiling. Using PCA and PCVG in MarkerView™ software, the Infusion MS/MSALL data can be rapidly analyzed (top). The scores plot shows sample grouping while the loadings plot shows the lipid fragments with similar trends (bottom). Differences between specific samples can be visualized; shown here is the difference observed between 600 lipid species found in brain and liver lipid extracts.
For Research Use Only. Not for use in diagnostic procedures.
© 2011 AB SCIEX. The trademarks mentioned herein are the property of AB Sciex Pte. Ltd. or their respective owners. AB SCIEX™ is being used under license.
Publication number: 4430211-01