Embed Size (px)
Citation preview
1
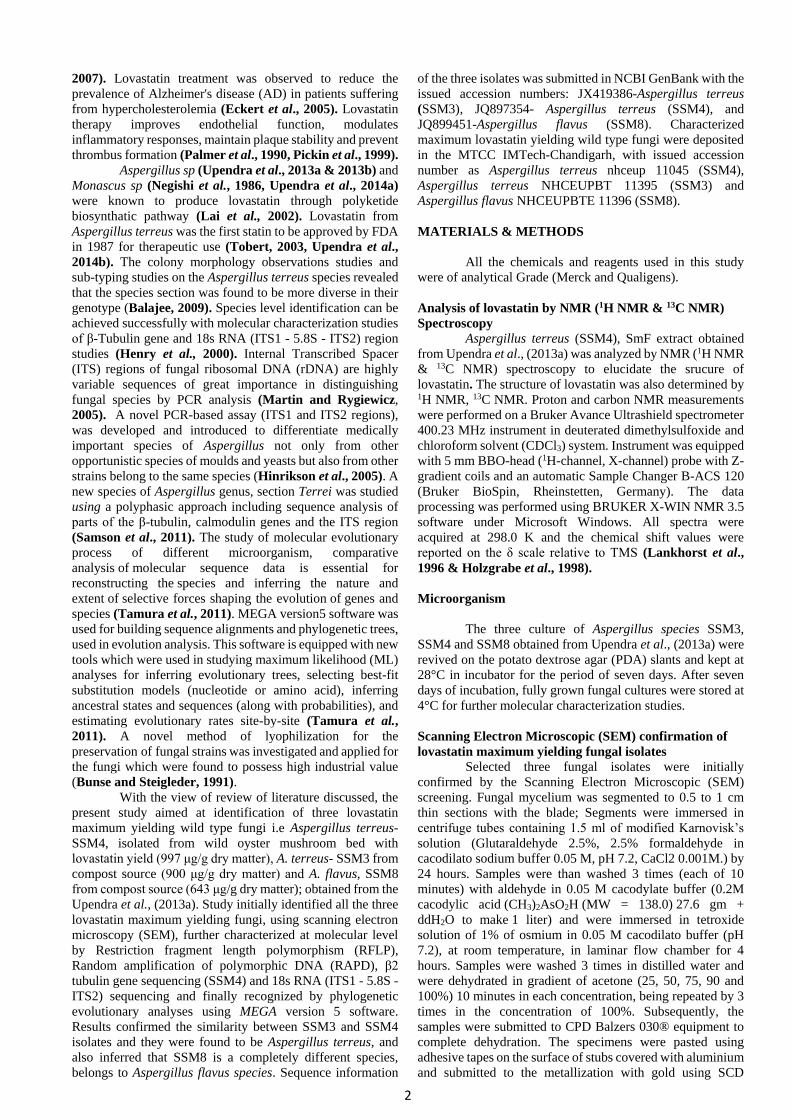
Proceedings of 3rd AFSA Conference on Food Safety and Food Security September 15-17, 2016, India
Asian Food Safety And Food Security Association ISSN: 2306-2150
MOLECULAR CHARACTERIZATION AND MTCC SUBMISSION OF
LOVASTATIN MAXIMUM YIELDING FUNGI ISOLATED FROM
NATURAL SAMPLES
R S Upendra1, Pratima Khandelwal2, Z.R. Amiri3
1Sr. Asst. Prof, Dept. of Biotechnology, New Horizon College of Engineering, Outer Ring Road, Bellandur Post, Marathahalli,
Bangalore -560103, Karnataka, India. [email protected]
2Prof & Head, Dept. of Biotechnology, New Horizon College of Engineering, Outer Ring Road, Bellandur Post, Marathahalli, Bangalore -560103, Karnataka, India
3Assoc. Professor, Dept. of Food Sci. & Tech., Sari Agricultural Sciences and Natural Resources University, Sari, Iran [email protected]
* Corresponding Author’s mailing address:
Sr. Assistant Professor, Dept. of Biotechnology, New Horizon College of Engineering, Ring Road, Bellandur Post,
Marathahalli, Bangalore -560103, Karnataka, India Tel: 91-80-66297777, Fax: 91-80-28440770. Email: [email protected].
Keywords: Lovastatin, RFLP, RAPD, β2 Tubulin & 18S rRNA gene sequencing, Phylogenetic analysis.
Introduction High levels of cholesterol in the blood refer to the
condition called Hypercholesterolemia also called
dyslipidemia (Durrington, 2003). The highest % of global
death today is caused by cardiovascular diseases (CVDs)
occurs due to the hypercholesterolemic conditions, an
estimate of 17.3 million people were died due to CVD,
representing 30% of all global deaths in the year 2008 (WHO,
2010). An estimate of 80 % of death occurring in the low and
middle income countries mainly due to CVD and affects men
and women equally (WHO, 2011). Hypercholesterolemia can
be easily treated with medications by targeting the reduction
of the low density lipoprotein (LDL) cholesterol in the blood.
Among the fungal polyketide metabolites, statins are in prime
importance due to their anti-cholesterol nature (Praveen and
Savitha, 2012). US Food and Drug administration approved
lovastatin as the first hypo-cholesterolemic drug in the year
1987 (Tobert, 2003). Lovastatin competitively inhibits the
enzyme HMG-CoA reductase (mevalonate: NADP1
oxidoreductase, EC 1.1.1.34) which catalyzes the reduction of
HMG-CoA to mevalonate during synthesis of cholesterol
(Alberts et al., 1980 & 1988, Upendra et al., 2016).
Lovastatin found to inhibits cellular proliferation, induces
apoptosis and necrosis in breast cancer (Kalwitter et al.,
2010) and also suppress the proliferation and migration of
human glioblastoma cancer cells by the inhibition of Ras
farnesylation mechanism (Xia et al., 2001). Lovastatin
therapy was effective in preventing creatinine clearance
decline and also suppresses renal function loss in patients with
kidney disease (Buemi et al., 2002). High doses of lovastatin
stimulate bone formation in vitro and in vivo and, stimulate
biomechanical strength to heal fractures (Garrett et al.,
Abstract
Aspergillus sp. is known to produce cholesterol reducing drug-lovastatin. Lovastatin is a naturally occurring drug found in food such as red yeast rice (red rice koji or red fermented rice, red koji rice, red koji rice, anka, or ang-kak). Lovastatin (mevinolin) was the first hypocholesterolemic drug to be approved in 1987 by Food and Drug administration (FDA), USA. In the present study, three lovastatin maximum yielding wild type fungi i.e Aspergillus terreus- SSM4, isolated from wild oyster mushroom bed with lovastatin yield (997 μg/g dry matter), A. terreus- SSM3 from compost source (900 μg/g dry matter) and A. flavus, SSM8 from compost source (643 μg/g dry matter); obtained from the Upendra et al., (2013a) were initially identified using scanning electron microscopy (SEM), further characterized at molecular level by restriction fragment length polymorphism (RFLP), random amplification of polymorphic DNA (RAPD), β2 tubulin gene sequencing (SSM4) and 18s RNA (ITS1 - 5.8S - ITS2) sequencing and finally recognized by phylogenetic evolutionary analyses using MEGA version 5 software. Results confirmed the similarity between SSM3 and SSM4 isolates and they were found to be Aspergillus terreus, and also inferred that SSM8 is a completely different species, belongs to Aspergillus flavus species. Sequence information of the three isolates was submitted in NCBI GenBank with the issued accession numbers: JX419386- Aspergillus terreus (SSM3), JQ897354- Aspergillus terreus (SSM4), and JQ899451- Aspergillus flavus (SSM8). Characterized maximum lovastatin yielding wild type fungi were deposited in the MTCC IMTech- Chandigarh, with issued accession number as Aspergillus terreus nhceup 11045 (SSM4), Aspergillus terreus NHCEUPBT 11395 (SSM3) and Aspergillus flavus NHCEUPBTE 11396 (SSM8). Lovastatin in the SmF extract of Aspergillus terreus (SSM4) was confirmed using both 1H NMR and 13C NMR studies. In conclusion the presented study successfully characterized the lovastatin high yielding fungi and deposited to MTCC IMTech-Chandigarh with issued accession numbers.
2
2007). Lovastatin treatment was observed to reduce the
prevalence of Alzheimer's disease (AD) in patients suffering
from hypercholesterolemia (Eckert et al., 2005). Lovastatin
therapy improves endothelial function, modulates
inflammatory responses, maintain plaque stability and prevent
thrombus formation (Palmer et al., 1990, Pickin et al., 1999).
Aspergillus sp (Upendra et al., 2013a & 2013b) and
Monascus sp (Negishi et al., 1986, Upendra et al., 2014a)
were known to produce lovastatin through polyketide
biosynthatic pathway (Lai et al., 2002). Lovastatin from
Aspergillus terreus was the first statin to be approved by FDA
in 1987 for therapeutic use (Tobert, 2003, Upendra et al.,
2014b). The colony morphology observations studies and
sub-typing studies on the Aspergillus terreus species revealed
that the species section was found to be more diverse in their
genotype (Balajee, 2009). Species level identification can be
achieved successfully with molecular characterization studies
of β-Tubulin gene and 18s RNA (ITS1 - 5.8S - ITS2) region
studies (Henry et al., 2000). Internal Transcribed Spacer
(ITS) regions of fungal ribosomal DNA (rDNA) are highly
variable sequences of great importance in distinguishing
fungal species by PCR analysis (Martin and Rygiewicz,
2005). A novel PCR-based assay (ITS1 and ITS2 regions),
was developed and introduced to differentiate medically
important species of Aspergillus not only from other
opportunistic species of moulds and yeasts but also from other
strains belong to the same species (Hinrikson et al., 2005). A
new species of Aspergillus genus, section Terrei was studied
using a polyphasic approach including sequence analysis of
parts of the β-tubulin, calmodulin genes and the ITS region
(Samson et al., 2011). The study of molecular evolutionary
process of different microorganism, comparative
analysis of molecular sequence data is essential for
reconstructing the species and inferring the nature and
extent of selective forces shaping the evolution of genes and
species (Tamura et al., 2011). MEGA version5 software was
used for building sequence alignments and phylogenetic trees,
used in evolution analysis. This software is equipped with new
tools which were used in studying maximum likelihood (ML)
analyses for inferring evolutionary trees, selecting best-fit
substitution models (nucleotide or amino acid), inferring
ancestral states and sequences (along with probabilities), and
estimating evolutionary rates site-by-site (Tamura et al.,
2011). A novel method of lyophilization for the
preservation of fungal strains was investigated and applied for
the fungi which were found to possess high industrial value
(Bunse and Steigleder, 1991).
With the view of review of literature discussed, the
present study aimed at identification of three lovastatin
maximum yielding wild type fungi i.e Aspergillus terreus-
SSM4, isolated from wild oyster mushroom bed with
lovastatin yield (997 μg/g dry matter), A. terreus- SSM3 from
compost source (900 μg/g dry matter) and A. flavus, SSM8
from compost source (643 μg/g dry matter); obtained from the
Upendra et al., (2013a). Study initially identified all the three
lovastatin maximum yielding fungi, using scanning electron
microscopy (SEM), further characterized at molecular level
by Restriction fragment length polymorphism (RFLP),
Random amplification of polymorphic DNA (RAPD), β2
tubulin gene sequencing (SSM4) and 18s RNA (ITS1 - 5.8S -
ITS2) sequencing and finally recognized by phylogenetic
evolutionary analyses using MEGA version 5 software.
Results confirmed the similarity between SSM3 and SSM4
isolates and they were found to be Aspergillus terreus, and
also inferred that SSM8 is a completely different species,
belongs to Aspergillus flavus species. Sequence information
of the three isolates was submitted in NCBI GenBank with the
issued accession numbers: JX419386-Aspergillus terreus
(SSM3), JQ897354- Aspergillus terreus (SSM4), and
JQ899451-Aspergillus flavus (SSM8). Characterized
maximum lovastatin yielding wild type fungi were deposited
in the MTCC IMTech-Chandigarh, with issued accession
number as Aspergillus terreus nhceup 11045 (SSM4),
Aspergillus terreus NHCEUPBT 11395 (SSM3) and
Aspergillus flavus NHCEUPBTE 11396 (SSM8).
MATERIALS & METHODS
All the chemicals and reagents used in this study
were of analytical Grade (Merck and Qualigens).
Analysis of lovastatin by NMR (1H NMR & 13C NMR)
Spectroscopy
Aspergillus terreus (SSM4), SmF extract obtained
from Upendra et al., (2013a) was analyzed by NMR (1H NMR
& 13C NMR) spectroscopy to elucidate the srucure of
lovastatin. The structure of lovastatin was also determined by 1H NMR, 13C NMR. Proton and carbon NMR measurements
were performed on a Bruker Avance Ultrashield spectrometer
400.23 MHz instrument in deuterated dimethylsulfoxide and
chloroform solvent (CDCl3) system. Instrument was equipped
with 5 mm BBO-head (1H-channel, X-channel) probe with Z-
gradient coils and an automatic Sample Changer B-ACS 120
(Bruker BioSpin, Rheinstetten, Germany). The data
processing was performed using BRUKER X-WIN NMR 3.5
software under Microsoft Windows. All spectra were
acquired at 298.0 K and the chemical shift values were
reported on the δ scale relative to TMS (Lankhorst et al.,
1996 & Holzgrabe et al., 1998).
Microorganism
The three culture of Aspergillus species SSM3,
SSM4 and SSM8 obtained from Upendra et al., (2013a) were
revived on the potato dextrose agar (PDA) slants and kept at
28°C in incubator for the period of seven days. After seven
days of incubation, fully grown fungal cultures were stored at
4°C for further molecular characterization studies.
Scanning Electron Microscopic (SEM) confirmation of
lovastatin maximum yielding fungal isolates Selected three fungal isolates were initially
confirmed by the Scanning Electron Microscopic (SEM)
screening. Fungal mycelium was segmented to 0.5 to 1 cm
thin sections with the blade; Segments were immersed in
centrifuge tubes containing 1.5 ml of modified Karnovisk’s
solution (Glutaraldehyde 2.5%, 2.5% formaldehyde in
cacodilato sodium buffer 0.05 M, pH 7.2, CaCl2 0.001M.) by
24 hours. Samples were than washed 3 times (each of 10
minutes) with aldehyde in 0.05 M cacodylate buffer (0.2M
cacodylic acid (CH3)2AsO2H (MW = 138.0) 27.6 gm +
ddH2O to make 1 liter) and were immersed in tetroxide
solution of 1% of osmium in 0.05 M cacodilato buffer (pH
7.2), at room temperature, in laminar flow chamber for 4
hours. Samples were washed 3 times in distilled water and
were dehydrated in gradient of acetone (25, 50, 75, 90 and
100%) 10 minutes in each concentration, being repeated by 3
times in the concentration of 100%. Subsequently, the
samples were submitted to CPD Balzers 030® equipment to
complete dehydration. The specimens were pasted using
adhesive tapes on the surface of stubs covered with aluminium
and submitted to the metallization with gold using SCD
3
Balzers 050® equipment, in order to increase its conductivity.
Finally, the specimens were observed by the scanning electron
microscope LEO Evo 40®, interfaced by digital image
processing software. Microscopic properties such as conidial
head, conidiophores, vesicle and conidia were studied under
Scanning Electron microscopy at 2000X - 3000 X
magnification for all the three maximum lovastatin yielding
fungal isolates (Gonzalez and Woods, 2002).
Molecular characterization by Restriction fragment
length polymorphism (RFLP)
Fungal DNA was isolated by adopting the method as
described previously by Zhao et al., (2001). The DNA pellet
isolated was resuspended in 200 µl of TE buffer and stored at
4oC for further analysis. Extracted Fungal DNA was subjected
to electrophoresis on 1.2 % agarose gel for purity checking.
PCR amplification was carried out for isolated DNA of all the
three lovastatin high yielding fungal isolates of the present
study. Conserved regions of 18S rRNA (ITS 1) and the 28S
rRNA (ITS 4) gene (intervening 5.8S gene under the ITS 1
and ITS 2 noncoding regions) amplification was done using
ITS 1 (5’TCC GTA GGT GAA CCT GCG G-3’) and ITS 4
(5’-TCC TCC GCT TAT TGA TAT GC-3’) primers
(118,119,167). 50 µl final volume of PCR reaction mixture
(Table-1) was amplified following the PCR programme
conditions (Table-2) designed for a total of 35 cycles.
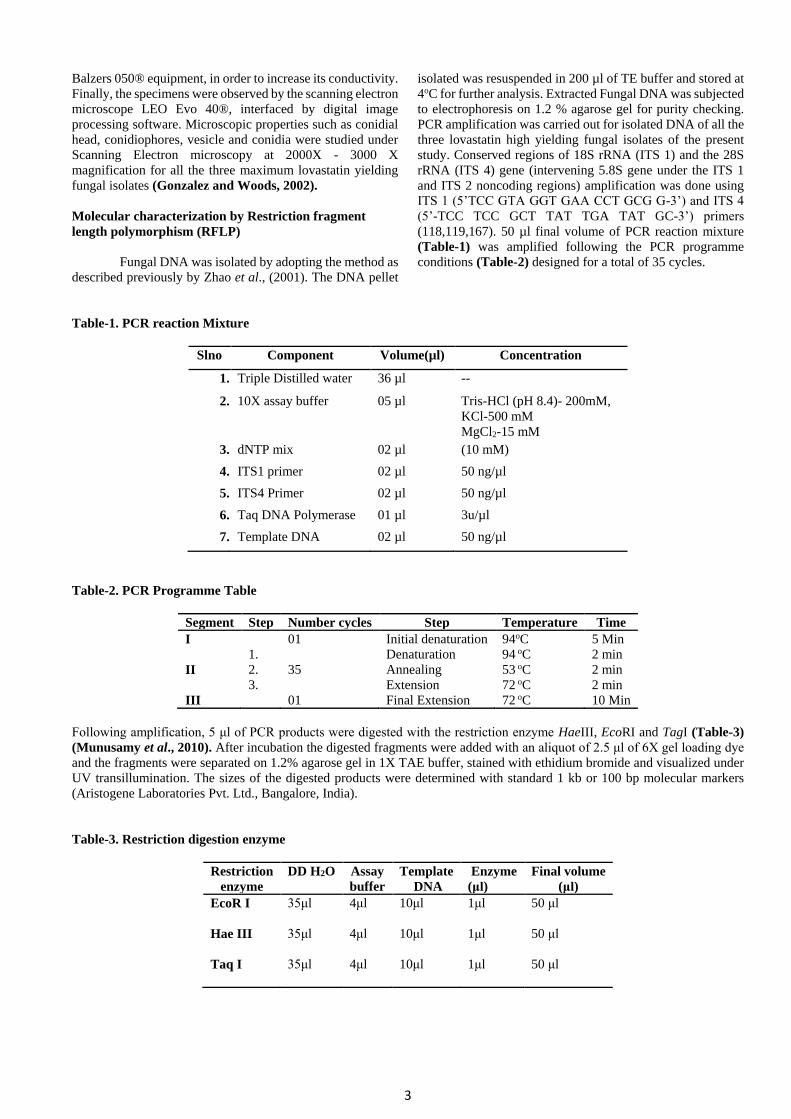
Table-1. PCR reaction Mixture
Slno Component Volume(µl) Concentration
1. Triple Distilled water 36 µl --
2. 10X assay buffer 05 µl Tris-HCl (pH 8.4)- 200mM,
KCl-500 mM
MgCl2-15 mM
3. dNTP mix 02 µl (10 mM)
4. ITS1 primer 02 µl 50 ng/µl
5. ITS4 Primer 02 µl 50 ng/µl
6. Taq DNA Polymerase 01 µl 3u/µl
7. Template DNA 02 µl 50 ng/µl
Table-2. PCR Programme Table
Segment Step Number cycles Step Temperature Time
I 01 Initial denaturation 94oC 5 Min
II
1.
35
Denaturation 94 oC 2 min
2. Annealing 53 oC 2 min
3. Extension 72 oC 2 min
III 01 Final Extension 72 oC 10 Min
Following amplification, 5 μl of PCR products were digested with the restriction enzyme HaeIII, EcoRI and TagI (Table-3)
(Munusamy et al., 2010). After incubation the digested fragments were added with an aliquot of 2.5 μl of 6X gel loading dye
and the fragments were separated on 1.2% agarose gel in 1X TAE buffer, stained with ethidium bromide and visualized under
UV transillumination. The sizes of the digested products were determined with standard 1 kb or 100 bp molecular markers
(Aristogene Laboratories Pvt. Ltd., Bangalore, India).
Table-3. Restriction digestion enzyme
Restriction
enzyme
DD H2O Assay
buffer
Template
DNA
Enzyme
(μl)
Final volume
(μl)
EcoR I
35μl 4μl 10μl 1μl 50 μl
Hae III
35μl 4μl 10μl 1μl 50 μl
Taq I
35μl 4μl 10μl 1μl 50 μl
4
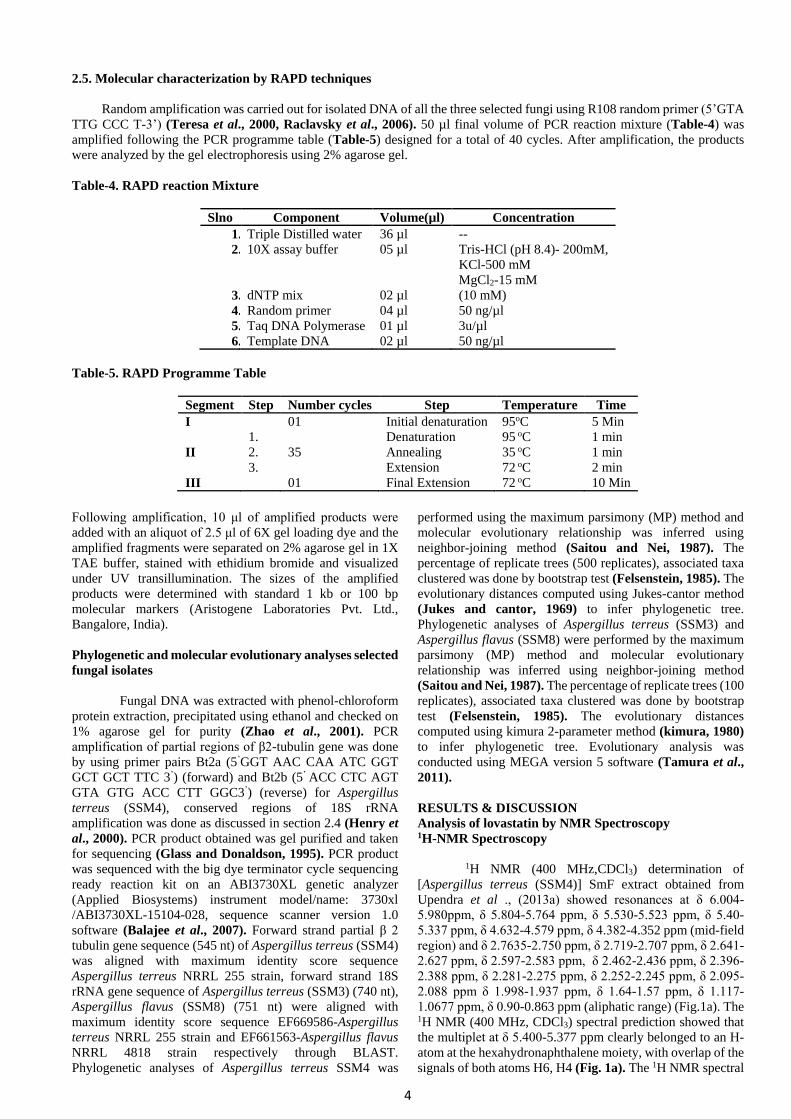
2.5. Molecular characterization by RAPD techniques
Random amplification was carried out for isolated DNA of all the three selected fungi using R108 random primer (5’GTA
TTG CCC T-3’) (Teresa et al., 2000, Raclavsky et al., 2006). 50 µl final volume of PCR reaction mixture (Table-4) was
amplified following the PCR programme table (Table-5) designed for a total of 40 cycles. After amplification, the products
were analyzed by the gel electrophoresis using 2% agarose gel.
Table-4. RAPD reaction Mixture
Slno Component Volume(µl) Concentration
1. Triple Distilled water 36 µl --
2. 10X assay buffer 05 µl Tris-HCl (pH 8.4)- 200mM,
KCl-500 mM
MgCl2-15 mM
3. dNTP mix 02 µl (10 mM)
4. Random primer 04 µl 50 ng/µl
5. Taq DNA Polymerase 01 µl 3u/µl
6. Template DNA 02 µl 50 ng/µl
Table-5. RAPD Programme Table
Segment Step Number cycles Step Temperature Time
I 01 Initial denaturation 95oC 5 Min
II
1.
35
Denaturation 95 oC 1 min
2. Annealing 35 oC 1 min
3. Extension 72 oC 2 min
III 01 Final Extension 72 oC 10 Min
Following amplification, 10 μl of amplified products were
added with an aliquot of 2.5 μl of 6X gel loading dye and the
amplified fragments were separated on 2% agarose gel in 1X
TAE buffer, stained with ethidium bromide and visualized
under UV transillumination. The sizes of the amplified
products were determined with standard 1 kb or 100 bp
molecular markers (Aristogene Laboratories Pvt. Ltd.,
Bangalore, India).
Phylogenetic and molecular evolutionary analyses selected
fungal isolates
Fungal DNA was extracted with phenol-chloroform
protein extraction, precipitated using ethanol and checked on
1% agarose gel for purity (Zhao et al., 2001). PCR
amplification of partial regions of β2-tubulin gene was done
by using primer pairs Bt2a (5’GGT AAC CAA ATC GGT
GCT GCT TTC 3’) (forward) and Bt2b (5’ ACC CTC AGT
GTA GTG ACC CTT GGC3’) (reverse) for Aspergillus
terreus (SSM4), conserved regions of 18S rRNA
amplification was done as discussed in section 2.4 (Henry et
al., 2000). PCR product obtained was gel purified and taken
for sequencing (Glass and Donaldson, 1995). PCR product
was sequenced with the big dye terminator cycle sequencing
ready reaction kit on an ABI3730XL genetic analyzer
(Applied Biosystems) instrument model/name: 3730xl
/ABI3730XL-15104-028, sequence scanner version 1.0
software (Balajee et al., 2007). Forward strand partial β 2
tubulin gene sequence (545 nt) of Aspergillus terreus (SSM4)
was aligned with maximum identity score sequence
Aspergillus terreus NRRL 255 strain, forward strand 18S
rRNA gene sequence of Aspergillus terreus (SSM3) (740 nt),
Aspergillus flavus (SSM8) (751 nt) were aligned with
maximum identity score sequence EF669586-Aspergillus
terreus NRRL 255 strain and EF661563-Aspergillus flavus
NRRL 4818 strain respectively through BLAST.
Phylogenetic analyses of Aspergillus terreus SSM4 was
performed using the maximum parsimony (MP) method and
molecular evolutionary relationship was inferred using
neighbor-joining method (Saitou and Nei, 1987). The
percentage of replicate trees (500 replicates), associated taxa
clustered was done by bootstrap test (Felsenstein, 1985). The
evolutionary distances computed using Jukes-cantor method
(Jukes and cantor, 1969) to infer phylogenetic tree.
Phylogenetic analyses of Aspergillus terreus (SSM3) and
Aspergillus flavus (SSM8) were performed by the maximum
parsimony (MP) method and molecular evolutionary
relationship was inferred using neighbor-joining method
(Saitou and Nei, 1987). The percentage of replicate trees (100
replicates), associated taxa clustered was done by bootstrap
test (Felsenstein, 1985). The evolutionary distances
computed using kimura 2-parameter method (kimura, 1980)
to infer phylogenetic tree. Evolutionary analysis was
conducted using MEGA version 5 software (Tamura et al.,
2011).
RESULTS & DISCUSSION
Analysis of lovastatin by NMR Spectroscopy 1H-NMR Spectroscopy
1H NMR (400 MHz,CDCl3) determination of
[Aspergillus terreus (SSM4)] SmF extract obtained from
Upendra et al ., (2013a) showed resonances at δ 6.004-
5.980ppm, δ 5.804-5.764 ppm, δ 5.530-5.523 ppm, δ 5.40-
5.337 ppm, δ 4.632-4.579 ppm, δ 4.382-4.352 ppm (mid-field
region) and δ 2.7635-2.750 ppm, δ 2.719-2.707 ppm, δ 2.641-
2.627 ppm, δ 2.597-2.583 ppm, δ 2.462-2.436 ppm, δ 2.396-
2.388 ppm, δ 2.281-2.275 ppm, δ 2.252-2.245 ppm, δ 2.095-
2.088 ppm δ 1.998-1.937 ppm, δ 1.64-1.57 ppm, δ 1.117-
1.0677 ppm, δ 0.90-0.863 ppm (aliphatic range) (Fig.1a). The 1H NMR (400 MHz, CDCl3) spectral prediction showed that
the multiplet at δ 5.400-5.377 ppm clearly belonged to an H-
atom at the hexahydronaphthalene moiety, with overlap of the
signals of both atoms H6, H4 (Fig. 1a). The 1H NMR spectral
5
data of lovastatin was found to be in concurrence with
reported spectral data (Holzgrabe et al., 1998).
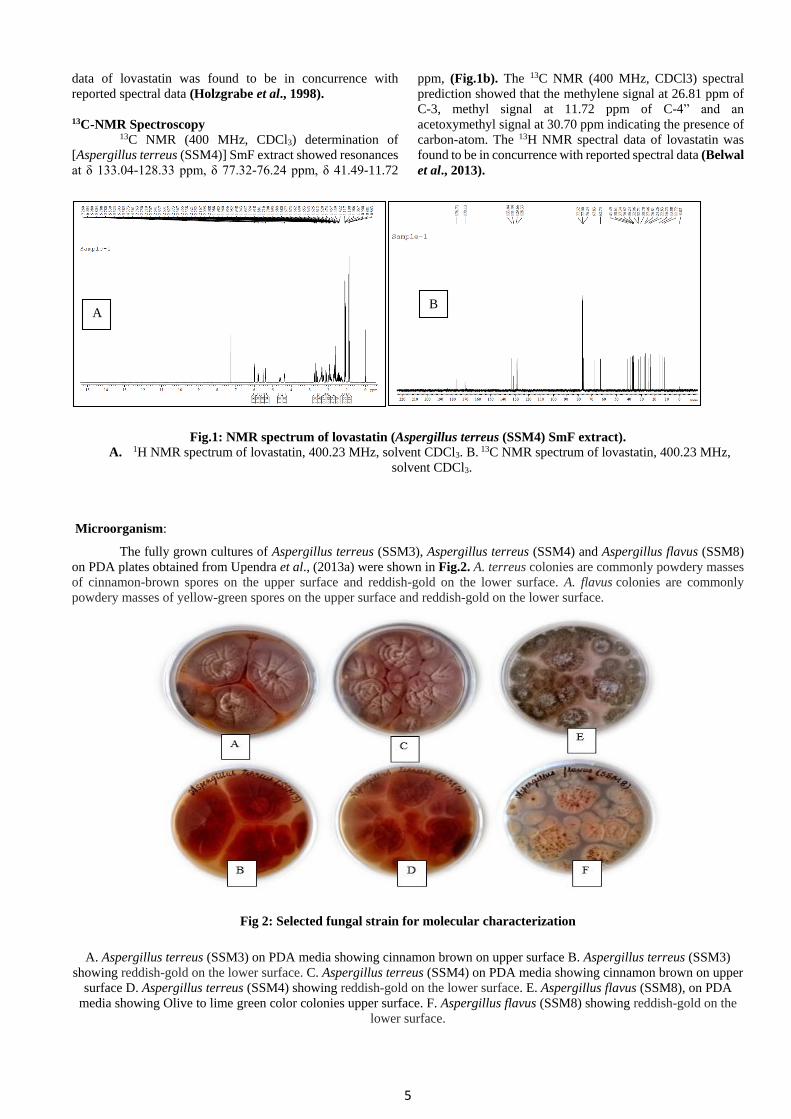
13C-NMR Spectroscopy 13C NMR (400 MHz, CDCl3) determination of
[Aspergillus terreus (SSM4)] SmF extract showed resonances
at δ 133.04-128.33 ppm, δ 77.32-76.24 ppm, δ 41.49-11.72
ppm, (Fig.1b). The 13C NMR (400 MHz, CDCl3) spectral
prediction showed that the methylene signal at 26.81 ppm of
C-3, methyl signal at 11.72 ppm of C-4” and an
acetoxymethyl signal at 30.70 ppm indicating the presence of
carbon-atom. The 13H NMR spectral data of lovastatin was
found to be in concurrence with reported spectral data (Belwal
et al., 2013).
Fig.1: NMR spectrum of lovastatin (Aspergillus terreus (SSM4) SmF extract).
A. 1H NMR spectrum of lovastatin, 400.23 MHz, solvent CDCl3. B. 13C NMR spectrum of lovastatin, 400.23 MHz,
solvent CDCl3.
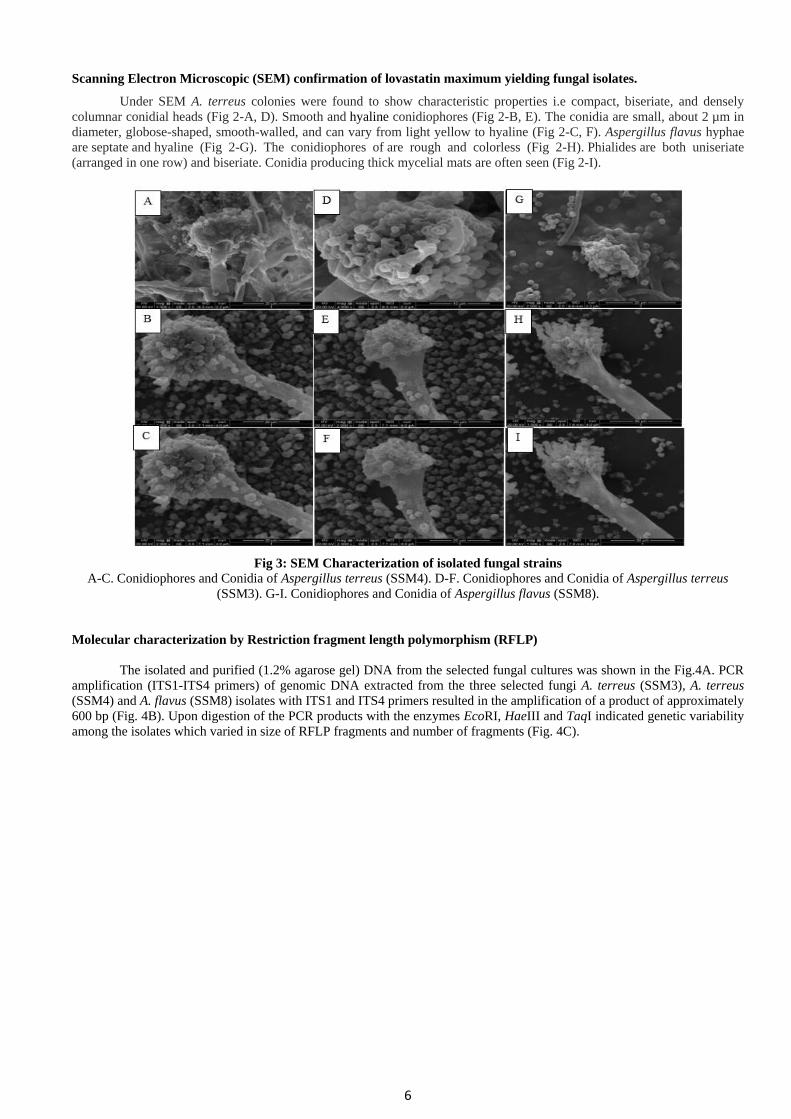
Microorganism:
The fully grown cultures of Aspergillus terreus (SSM3), Aspergillus terreus (SSM4) and Aspergillus flavus (SSM8)
on PDA plates obtained from Upendra et al., (2013a) were shown in Fig.2. A. terreus colonies are commonly powdery masses
of cinnamon-brown spores on the upper surface and reddish-gold on the lower surface. A. flavus colonies are commonly
powdery masses of yellow-green spores on the upper surface and reddish-gold on the lower surface.
Fig 2: Selected fungal strain for molecular characterization
A. Aspergillus terreus (SSM3) on PDA media showing cinnamon brown on upper surface B. Aspergillus terreus (SSM3)
showing reddish-gold on the lower surface. C. Aspergillus terreus (SSM4) on PDA media showing cinnamon brown on upper
surface D. Aspergillus terreus (SSM4) showing reddish-gold on the lower surface. E. Aspergillus flavus (SSM8), on PDA
media showing Olive to lime green color colonies upper surface. F. Aspergillus flavus (SSM8) showing reddish-gold on the
lower surface.
A B
6
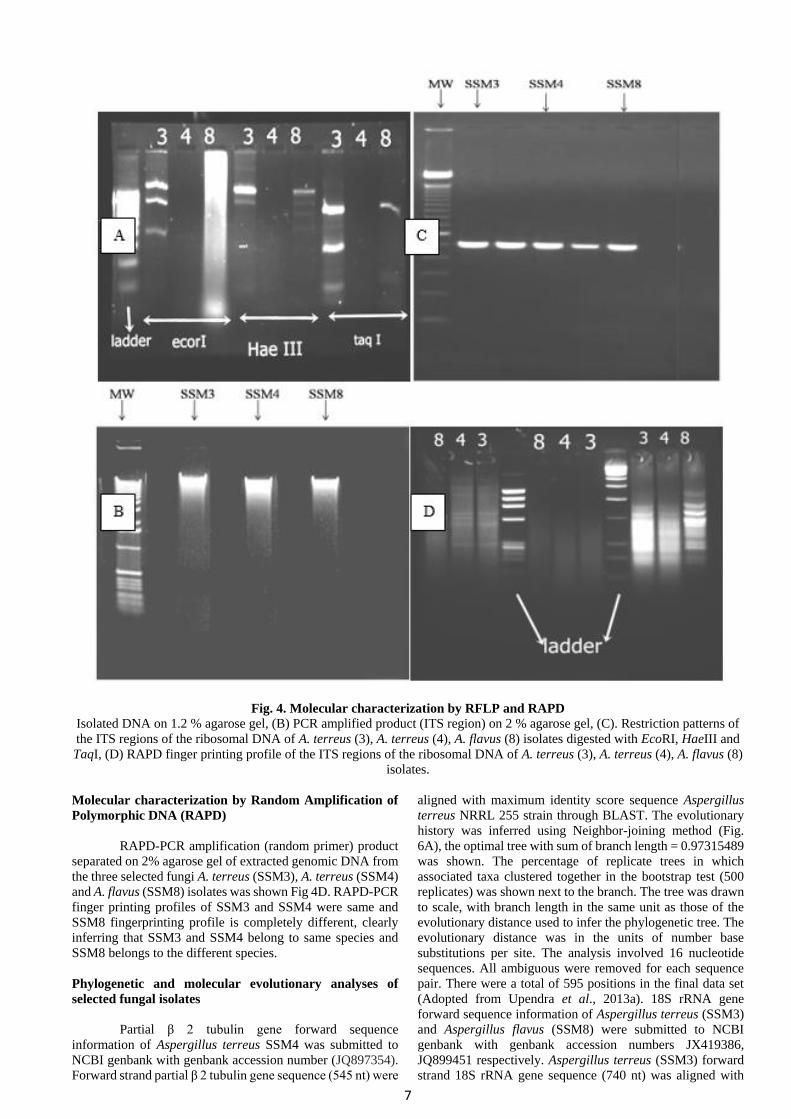
Scanning Electron Microscopic (SEM) confirmation of lovastatin maximum yielding fungal isolates.
Under SEM A. terreus colonies were found to show characteristic properties i.e compact, biseriate, and densely
columnar conidial heads (Fig 2-A, D). Smooth and hyaline conidiophores (Fig 2-B, E). The conidia are small, about 2 µm in
diameter, globose-shaped, smooth-walled, and can vary from light yellow to hyaline (Fig 2-C, F). Aspergillus flavus hyphae
are septate and hyaline (Fig 2-G). The conidiophores of are rough and colorless (Fig 2-H). Phialides are both uniseriate
(arranged in one row) and biseriate. Conidia producing thick mycelial mats are often seen (Fig 2-I).
Fig 3: SEM Characterization of isolated fungal strains A-C. Conidiophores and Conidia of Aspergillus terreus (SSM4). D-F. Conidiophores and Conidia of Aspergillus terreus
(SSM3). G-I. Conidiophores and Conidia of Aspergillus flavus (SSM8).
Molecular characterization by Restriction fragment length polymorphism (RFLP)
The isolated and purified (1.2% agarose gel) DNA from the selected fungal cultures was shown in the Fig.4A. PCR
amplification (ITS1-ITS4 primers) of genomic DNA extracted from the three selected fungi A. terreus (SSM3), A. terreus
(SSM4) and A. flavus (SSM8) isolates with ITS1 and ITS4 primers resulted in the amplification of a product of approximately
600 bp (Fig. 4B). Upon digestion of the PCR products with the enzymes EcoRI, HaeIII and TaqI indicated genetic variability
among the isolates which varied in size of RFLP fragments and number of fragments (Fig. 4C).
7
Fig. 4. Molecular characterization by RFLP and RAPD
Isolated DNA on 1.2 % agarose gel, (B) PCR amplified product (ITS region) on 2 % agarose gel, (C). Restriction patterns of
the ITS regions of the ribosomal DNA of A. terreus (3), A. terreus (4), A. flavus (8) isolates digested with EcoRI, HaeIII and
TaqI, (D) RAPD finger printing profile of the ITS regions of the ribosomal DNA of A. terreus (3), A. terreus (4), A. flavus (8)
isolates.
Molecular characterization by Random Amplification of
Polymorphic DNA (RAPD)
RAPD-PCR amplification (random primer) product
separated on 2% agarose gel of extracted genomic DNA from
the three selected fungi A. terreus (SSM3), A. terreus (SSM4)
and A. flavus (SSM8) isolates was shown Fig 4D. RAPD-PCR
finger printing profiles of SSM3 and SSM4 were same and
SSM8 fingerprinting profile is completely different, clearly
inferring that SSM3 and SSM4 belong to same species and
SSM8 belongs to the different species.
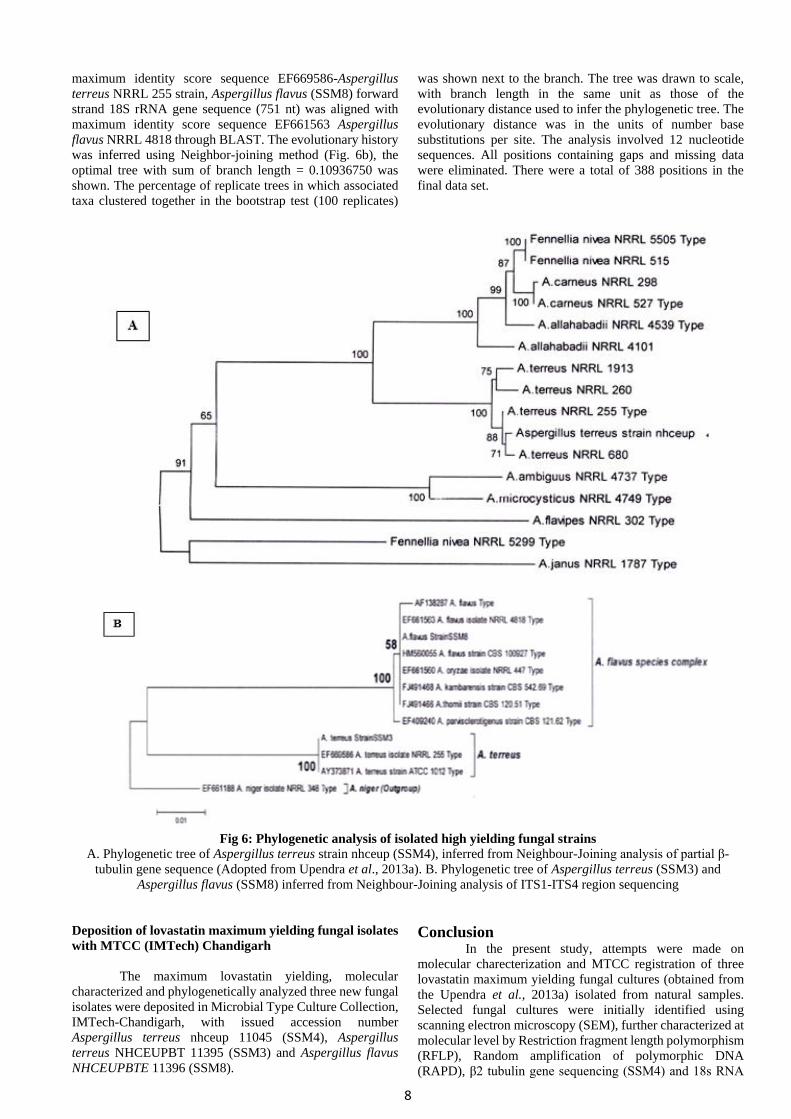
Phylogenetic and molecular evolutionary analyses of
selected fungal isolates
Partial β 2 tubulin gene forward sequence
information of Aspergillus terreus SSM4 was submitted to
NCBI genbank with genbank accession number (JQ897354).
Forward strand partial β 2 tubulin gene sequence (545 nt) were
aligned with maximum identity score sequence Aspergillus
terreus NRRL 255 strain through BLAST. The evolutionary
history was inferred using Neighbor-joining method (Fig.
6A), the optimal tree with sum of branch length = 0.97315489
was shown. The percentage of replicate trees in which
associated taxa clustered together in the bootstrap test (500
replicates) was shown next to the branch. The tree was drawn
to scale, with branch length in the same unit as those of the
evolutionary distance used to infer the phylogenetic tree. The
evolutionary distance was in the units of number base
substitutions per site. The analysis involved 16 nucleotide
sequences. All ambiguous were removed for each sequence
pair. There were a total of 595 positions in the final data set
(Adopted from Upendra et al., 2013a). 18S rRNA gene
forward sequence information of Aspergillus terreus (SSM3)
and Aspergillus flavus (SSM8) were submitted to NCBI
genbank with genbank accession numbers JX419386,
JQ899451 respectively. Aspergillus terreus (SSM3) forward
strand 18S rRNA gene sequence (740 nt) was aligned with
8
maximum identity score sequence EF669586-Aspergillus
terreus NRRL 255 strain, Aspergillus flavus (SSM8) forward
strand 18S rRNA gene sequence (751 nt) was aligned with
maximum identity score sequence EF661563 Aspergillus
flavus NRRL 4818 through BLAST. The evolutionary history
was inferred using Neighbor-joining method (Fig. 6b), the
optimal tree with sum of branch length = 0.10936750 was
shown. The percentage of replicate trees in which associated
taxa clustered together in the bootstrap test (100 replicates)
was shown next to the branch. The tree was drawn to scale,
with branch length in the same unit as those of the
evolutionary distance used to infer the phylogenetic tree. The
evolutionary distance was in the units of number base
substitutions per site. The analysis involved 12 nucleotide
sequences. All positions containing gaps and missing data
were eliminated. There were a total of 388 positions in the
final data set.
Fig 6: Phylogenetic analysis of isolated high yielding fungal strains
A. Phylogenetic tree of Aspergillus terreus strain nhceup (SSM4), inferred from Neighbour-Joining analysis of partial β-
tubulin gene sequence (Adopted from Upendra et al., 2013a). B. Phylogenetic tree of Aspergillus terreus (SSM3) and
Aspergillus flavus (SSM8) inferred from Neighbour-Joining analysis of ITS1-ITS4 region sequencing
Deposition of lovastatin maximum yielding fungal isolates
with MTCC (IMTech) Chandigarh
The maximum lovastatin yielding, molecular
characterized and phylogenetically analyzed three new fungal
isolates were deposited in Microbial Type Culture Collection,
IMTech-Chandigarh, with issued accession number
Aspergillus terreus nhceup 11045 (SSM4), Aspergillus
terreus NHCEUPBT 11395 (SSM3) and Aspergillus flavus
NHCEUPBTE 11396 (SSM8).
Conclusion In the present study, attempts were made on
molecular charecterization and MTCC registration of three
lovastatin maximum yielding fungal cultures (obtained from
the Upendra et al., 2013a) isolated from natural samples.
Selected fungal cultures were initially identified using
scanning electron microscopy (SEM), further characterized at
molecular level by Restriction fragment length polymorphism
(RFLP), Random amplification of polymorphic DNA
(RAPD), β2 tubulin gene sequencing (SSM4) and 18s RNA
9
(ITS1 - 5.8S - ITS2) sequencing and finally recognized by
phylogenetic evolutionary analyses using MEGA version 5
software. Sequence information of the three isolates was
submitted in NCBI GenBank with the issued accession
numbers: JX419386-Aspergillus terreus (SSM3), JQ897354-
Aspergillus terreus (SSM4), and JQ899451-Aspergillus
flavus (SSM8). Characterized maximum lovastatin yielding
wild type fungi were deposited in the MTCC IMTech-
Chandigarh, with issued accession number as Aspergillus
terreus nhceup 11045 (SSM4), Aspergillus terreus
NHCEUPBT 11395 (SSM3) and Aspergillus flavus
NHCEUPBTE 11396 (SSM8).
Acknowledgement
We wish to express our sincere gratitude to
Chairman and Principal, New Horizon College of
Engineering, Bangalore for providing us with all facilities to
undertake research work on “Molecular characterization and
MTCC submission of lovastatin maximum yielding fungi
isolated from natural samples”. We extended our sincere
thanks to Biocon, Bangalore, India for providing us with pure
lovastatin (used as standard). We deeply express our
thankfulness to Prof. Baboo M. Nair Professor Emeritus,
Lund University, Sweden for his meticulous suggestions in
compiling data and designing the manuscript.
REFERENCES
Alberts A W, Chen J, Kuron G, Hunt V, Huff J, Hoffman C,
et al. (1980). Mevinolin: A highly potent competitive inhibitor of hydroxymethyl glutaryl coenzyme A reductase and cholesterol lowering agent. Proceedings of the National Academy of Sciences of the United States of America, 77(7), 3957-3961.
Alberts A W (1988). Discovery, biochemistry and biology of lovastatin. American Journal of Cardiology, 62, 10-5J.
Balajee Arunmozhi. S. (2009): Aspergillus terreus complex. Medical Mycology, 47 (1), S42-S46.
Balajee S A, Houbraken J, Verweij P E, Hong S B, Yaghuchi T, Varga J and Samson R A (2007): Aspergillus species identification in the clinical setting. Studies in Mycology, 59, 39-46.
Belwal Chandrakant, Praveen Kumar Goyal , Anup Balte, Sandeep Kolhe, Kamlesh Chauhan, Ajay singh Rawat, Anand Vardhan (2013): Isolation, Identification, and Characterization of an Unknown Impurity in Lovastatin EP. Scientia Pharmaceutica, 8, 1-10.
Buemi M, Senatore M, Corica F, Aloisi C, Romeo A, Cavallaro E, et al. (2002): Statins and progressive renal disease. Medicinal Research Reviews, 22, 76–84.
Bunse T, Steigleder GK. (1991). The preservation of fungal cultures by lyophilization. Mycoses, 34(3-4), 173-6.
Durrington, P (2003). “Dyslipidaemia”. The Lancet, 362 (9385), 717–31.
Eckert GP, Wood WG, Muller WE. (2005). Statins: Drugs for Alzheimer's disease? Journal of Neural Transmission, 112, 1057–71.
Garrett IR, Gutierrez GE, Rossini G, Nyman J, McCluskey B, Flores A, et al. (2007). Locally Delivered Lovastatin Nanoparticles Enhance Fracture Healing in Rats. Journal of Orthopaedic Research, 25, 1351–57.
Felsenstein J. (1985). Confidence limits on phylogenies: An approach using the bootstrap. Evolution, 39:783-791.
Glass N L and Donaldson G C (1995): Development of primer sets designed for use with the PCR to amplify conserved genes from filamentous ascomycetes. Applied and Environmental Microbiology. 61(4), 1323.
Gonzalez RC, Woods RE. Digital image processing. NJ: Prentice Hall, Englewood Cliffs; 2002.
Henry T, Peter C. Iwen, Steven H. Hinrichs. (2000). Identification of Aspergillus Species Using Internal Transcribed Spacer Regions 1 and 2. Journal of clinical microbiology, 38 (4):1510-1515.
Hinrikson, H.P., S.F. Hurst, L. De Aguirre & C.J. Morrison (2005): Molecular methods for the identification of Aspergillus Species. Medical Mycology; Supplement 1, 43: 129-137.
Holzgrabe Ulrike, Bernd W.K. Diehl, Iwona Wawer (1998). NMR spectroscopy in pharmacy. Journal of Pharmaceutical and Biomedical Analysis, 17: 557–616.
Jukes T.H & Cantor C.R. (1969). Evolution of protein molecules. (Munro H N, editor.) Mammalian protein metabolism, III. New York: Academic Press: 21-132.
Kimura M. (1980). A simple method for estimating evolutionary rate of base substitutions through comparative
studies of nucleotide sequence. Journal of Molecular Evolution, 16:111-120.
Klawitter J, Touraj Shokati, Vanessa Moll, Uwe Christians, Jost Klawitter (2010). Effects of lovastatin on breast cancer cells: a proteo-metabonomic study. Breast Cancer Research, 12, R16.
Lai Long-Shan T. Tai-Her Tsai, and Te Chi Wang (2002). Application of Oxygen Vectors to Aspergillus terreus Cultivation. Journal of Bioscience and Bioengineering, 94, 453-459.
Lankhorst P.P., M.M. Poot, M.P.A. de Lange (1996). Quantitative Determination of Lovastatin and dihydrolovastatin by Means of 1H NMR Spectroscopy. Pharmacopeial Forum 22 (3), 2414–2422.
Martin Kendall J and Paul T Rygiewicz (2005). Fungal-specific PCR primers developed for analysis of the ITS region of environmental DNA extracts. BMC Microbiology, 5, 28 doi: 10.1186/1471-2180-5-28.
Munusamy Mohankumar, Ayyathurai Vijayasamundeeswari, Muthusamy Karthikeyan, Subramanian Mathiyazhagan, Vaikuntavasan Paranidharan, Rethinasamy Velazhahan (2010). Analysis of molecular variability among isolates of Aspergillus flavus by PCR-RFLP of the its regions of rDNA. Journal of plant protection research, 50 (4), 446-451.
Negishi S, Huang ZC, Hasumi K, Murakawa S. Endo (1986): A Productivity of monacolin K (mevinolin) in the genus Monascus. Journal of Fermentation Engineering. 64:509–51.
Palmer RH, Dell RB, Goodman DW. (1990). Lack of effect of lovastatin therapy on the parameters of whole-body cholesterol metabolism. Journal of Clinical Investigation, 86, 801–8.
Pickin DM, McCabe CJ, Ramsay LE, Payne N, Haq IU, Yeo WW, et al. (1999), Cost effectiveness of HMG-CoA reductase inhibitor (statin) treatment related to the risk of coronary heart disease and cost of drug treatment. Heart, 82, 325–32.
Praveen V.K and Savitha J (2012). Solid state Fermentation: An effective Method of Lovastatin Production by Fungy – A Mini review. The Open Tropical Medicine Journal, 5: 1-5.
Raclavsky.V, J.Trtkova, V.Buchta, R.Bolehovska, M.Vackova, P.Hemal (2006). Primer 108 performs best in the RAPD strain typing of three Aspergillus species isolated from patients. Folia Microbiology, 51(2), 136-140.
Saitou N, Nei M (1987). The neighbor-joining method: a new method for reconstructing phylogenetic trees. Molecular Biology and Evolution, 4(4), 406-25.
Samson R.A., Peterson S.W., Frisvad J.C. and Varga J (2011). New species in Aspergillus section Terrei. Studies in Mycology, 69: 39–55.
Tamura K, Peterson D, Peterson N, Stecher G, Nei M and Kumar S. (2011). MEGA5: Molecular evolutionary genetics analysis using maximum likelihood, evolutionary distance and maximum parsimony methods. Molecular Biology and Evolution, 28: 2731-2739.
10
Teresa M. Diaz-Guerra, Emilia Mellado, Manuel Cuenca-Estrella, Lourdes Gaztelurrutia, Jose Ignacio Villate Navarro, and Juan l. Rodri´Guez Tudela (2000): Genetic Similarity among One Aspergillus flavus Strain Isolated from a Patient Who Underwent Heart Surgery and Two Environmental Strains Obtained from the Operating Room. Journal of clinical microbiology, Vol. 38, No. 6, p. 2419–2422.
Tobert J A. (2003). Lovastatin and beyond: The history of the HMG CoA reductase inhibitors. Nature Review Drug Discovery, 2(7), 517–526.
Upendra R. S., Pratima Khandelwal (2016). Physical mutagenesis based strain improvement of Aspergillus sp. for enhanced production of lovastatin. International Journal of Pharmacy and Pharmaceutical Science, 8 (7): 163-167.
Upendra R.S, Pratima Khandelwal, Z.R. Amiri and Baboo M. Nair (2014b): Invited session key lecture on “Optimization of process for producing lovastatin from novel fungal isolates”. Proceedings of the IV International conference on SUTPBM-2014: 28-34.
Upendra R. S, Pratima Khandelwal, Z. R. Amiri, Aparna. S, Archana. C and Ashwathi. M (2014a). Isolation and Characterization of lovastatin producing food grade fungi from oriental foods. World Journal of Pharmaceutical Research, 3(10), 1404-1414.
Upendra R.S., Pratima Khandelwal, Amiri Z R, Swetha L and Mohammed Ausim S (2013b). Screening and Molecular Characterization of Natural Fungal Isolates Producing Lovastatin. Journal of Microbial and Biochemical Technology, 5(2), 025-030.
Upendra R.S., Khandelwal P and Mohammed Ausim (2013a): A novel approach for enhancement of Lovastatin production using Aspergillus species. International Journal of Agriculture and Environmental Biotechnology, 6:779-786.
World Health Organization, (2010). Global status report on non-communicable diseases. Geneva, World Health Organization.
World Health Organization, (2011). Global atlas on cardiovascular disease prevention and control. Geneva, World Health Organization.
Xia Z, Tan MM, Wong WW, Dimitroulakos J, Minden MD, Penn LZ (2001): Blocking protein geranylgeranylation is essential for lovastatin-induced apoptosis of human acute myeloid leukemia cells. Leukemia (Baltimore), 15, 1398–407.
Zhao J, Fanrong Kong, Ruoyu Li, Xiaohong Wang, Zhe Wan, and Duanli Wang (2001): Identification of Aspergillus fumigatus and Related Species by Nested PCR Targeting Ribosomal DNA Internal Transcribed Spacer Regions. Journal of clinical microbiology, 39 (6): 2261–2266
.