Embed Size (px)
Citation preview

MOLD-TEK PACKAGING Ltd Packaging
BSE CODE : 533080 NSE CODE: MOLDTKPAC
BLOOMBERG CODE: MTEP:IN SENSEX : 36442
www.geojit.com
6th March, 2019
INITIATING COVERAGE
Retail Equity Research (South India Focus) BUY
12M Investment Period Rating as per Small Cap
CMP Rs264 TARGET Rs312 RETURN 18%
(Closing: 05-03-19)
Well packed…scalable business model Mold-Tek Packaging Ltd (MTEP), one of the leading manufacturers and suppliers of high quality airtight and pilfer proof containers/pails in India for Paints, Lubricants, Food and FMCG.
MTEP’s revenue grew by 12% CAGR whereas PAT grew by whopping 41% CAGR over FY13-FY18.
EBITDA margin expanded by 830bps to 18.7% over FY13-18.
Strong profitability growth was led by margin expansion on account of increasing share of in-mold volumes.
Development of molds and labels in-house and use of robots in production process has significantly helped in reducing cost and maintaining competitive advantage.
Incremental volumes owing to capacity expansion, higher contribution from in-mold sales and rising share of FMCG in revenue mix will be margin accretive.
We factor earnings to grow by 22% CAGR over FY19E-FY21E.
We value at P/E of 17x on FY21E with a target price of Rs312 and recommend to Buy.
Company Data
Market Cap (cr) Rs. 727
Enterprise Value (cr) Rs. 807 Outstanding Shares (cr) 2.8
Free Float 64.4%
Dividend Yield 1.5%
52 week high Rs. 373
52 week low Rs. 202
6m average volume (cr) 0.1
Beta 1.0
Face value Rs. 5.0
Shareholding (%) Q4FY18 Q1FY19 Q2FY19
Promoters 35.6 35.5 35.6 FII’s 8.3 9.5 12.1 MFs/Insti 12.5 12.0 11.0 Public 38.5 38.4 37.3 Others 5.1 4.6 4.0
Total 100.0 100.0 100.0
Price Performance 3 month 6 Month 1 Year
Absolute Return -2.1% -16.0% -20.3%
Absolute Sensex 1.6% -4.7% 8.0%
Relative Return -3.7% -11.1% -28.3%
Y.E Mar (cr) FY19E FY20E FY21E
Sales 403 475 551
Growth (%) 18.7 17.9 15.9
EBITDA 73 87 104
EBITDA Margins % 18.0 18.4 18.9
PAT Adj. 34 42 51
Growth (%) 8.3 21.6 21.8
Adj.EPS 12.4 15.1 18.4
Growth (%) 8.3 21.6 21.8
P/E 21.3 17.5 14.4
P/B 3.6 3.1 2.7
EV/EBITDA 11.3 9.3 7.7
ROE (%) 17.9 19.1 20.1 D/E 0.4 0.3 0.2
Anil.R
Research Analyst
An Innovator and Pioneer in packaging industry MTEP is credited with shifting Indian paint and lubricants industry to plastic pails which until then were using metal containers. Company introduced packaging solution for the industry with innovative features such as the “pull up spout”; locking system, tamper and leak proof seals. Further, MTEP is the first company in India to introduce the concept of in-mold labeling (IML), a technique which combines injection molding of the container and placement of the label in single step.
Tangible benefits from adoption of new technology Historically, MTEP was supplying plastic pails for paints and lubricants players, which were more or less commoditized and lacked much product differentiation. MTEP adopted In-mold labeling technology in 2011 which was largely accepted globally to add photographic, glossy labels to packaging and thus enhance brand value. Post adoption of IML, EBITDA margin has improved by 830bps to 18.7% and profitability grew by 41% CAGR over FY13-18.
Backward integration… a well thought strategy MTEP has fully integrated facilities ranging from label making, mold adaptations to in-house robots for use in its production line. MTEP has in house tool room capable for quick maintenance & mold development. Backward integration of design, molds and use of robots in production process has led to cost reduction.
Poised for a strong growth Going forward, MTEP is expected to capitalize on long term growth opportunities aided by higher volumes due to increasing acceptance of IML in paint & lubricant segments. Further, focus on capacity expansion, diversification of end users and penetration into newer markets will drive earnings growth.
Valuations We are positive on MTEP as tangible benefits from shift towards IML technology is yet to be realised. Going forward we expect EBITDA margin to positively surprise led by scale benefits from shift to IML and increasing share of F&F segment in sales mix. We value MTEP at 17x on FY21E with a target price of Rs312 and recommend to Buy.
150
250
350
450
Feb-18 May-18 Aug-18 Nov-18 Feb-19
MTEP Sensex Rebased

www.geojit.com
27th December 2018 Valuations During FY10-FY13, MTEP’s P/E valuations hovered in the range 3x-5x. However, during last 5 years, valuation has significantly re-rated and its P/E band has expanded from 5x to above 20x and touched a high of 30x. Consistent re-rating in MTEP valuation has been largely propelled by strong earnings momentum of 41 % CAGR over FY13-FY18. But currently it is trading at 1 year forward P/E of 17x, 16% discount to its last 1 year average of 21x (on account of sharp correction in mid & small cap stocks) which seems attractive given strong earnings outlook going forward.
1 Yr Fwd P/E
During FY10-13 MTEP’s EBITDA margin was in the range of ~10%-12%. However, post FY13 EBITDA margin witnessed significant expansion by 830bps to 18.7% led by 540bps improvement in gross margins to 40.5% in FY18 driven by a structural upgrade in its business model. Increasing share of IML in product mix, higher contribution from Food & FMCG (F&F) segment coupled with cost savings led by backward integration drove margin expansion. Currently IML constitute 57% of the revenue mix versus 13% in FY13, while contribution of F&F segment constituted 20% of the overall revenue mix versus 4% in FY13.
Margin expansion...a key growth driver
We expect MTEP to capitalize on the long term growth opportunities aided by growing ac-ceptance of IML by paints & lubes industry and exponential growth in F&F segment leading to margin expansion. Further its ramp-up in capacity for existing clients, superior technology, low cost advantage due to backward integration and long-term client relationship will provide an edge over competitors. Currently management’s focus is on increasing revenue contribu-tion from FMCG customers where margins are higher. Additionally, FSSAI (Food Safety and Standards Authority of India) is expected to come-up with new set of stringent norms related to packaging to control contamination in food products. We believe that this will be one of key growth trigger for higher-end packaging going forward and the MTEP will be the major benefi-ciary. In F&F segment, it has marquee clients like Procter & Gamble, ITC, HUL, Amul, Cadbury, London Dairy, Mondelez, Heinz and Vadilal etc.
Growth prospects bright….
Going forward, increasing share of IML in revenue mix, exponential growth in F&F segment and incremental volumes from capacity addition for existing clients will drive earnings growth. We expect earnings to grow at 22% CAGR over FY19E-21E. We value MTEP at P/E multiple of 17x on FY21E and we have a BUY rating with a target price of Rs312
Source: Company, Geojit Research.
Valuation
FY13-FY18, valuation has
significantly re-rated from
P/E band from 5x- 30x
largely propelled by strong
earnings momentum of 41%
CAGR
Increasing share of IML in
revenue mix, exponential
growth in F&F segment and
incremental volumes from
capacity addition for
existing clients will drive
earnings growth
14x
19x
17x
25x
2
7
12
17
22
27
32
Apr-10 Jan-11 Oct-11 Jul-12 Apr-13 Jan-14 Oct-14 Jul-15 Apr-16 Jan-17 Oct-17 Jul-18
1 Year FWD P/E Average + 1 SD Average - 1 SD Average 1 year FWD P/E

www.geojit.com
27th December 2018
Investment Rationale
Plastic packaging in India Broadly packaging industry can be divided into Flexible and Rigid packaging. Rigid plastic packaging container" means any plastic package having an inflexible finite shape or form that is capable of maintaining its shape while holding other products, including bottles, cartons, and other receptacles. Packaging is a highly fragmented industry in India as unorganized players account for a major share. Amid such hyper-competition, competitive moats are highly dependent on ability to develop value-added offerings and containment of operating cost through process efficiencies. This is even more relevant for companies supplying to FMCG industry given high focus on product differentiation to generate strong brand recall without inflating costs. Apart from aesthetic looks, preference towards plastic packaging has grown enormously due to properties such as protection against moisture, safety, quality and long shelf life. It also provides high dimensional stability, high impact strength, resistance to strain, transparency etc. Packaging industry growth can be directly linked to growth of major sectors like food & beverages, pharmaceuticals and retail industry. Economic growth, which will be driven by higher consumption, increasing urbanization, demand for better life style
products and willingness to spend on branded products, are the key catalysts of growth of packaging industry.
A pioneer in rigid plastic packaging
MTEP is an innovator and pioneer in rigid plastic packaging in India. In ’90s, MTEP started developing plastic pails for the paint industry which until then were using metal containers. Within a short span of time paint industry switched to plastic pails and MTEP started raking a lot of orders from Asian Paints, Kansai Nerolac and Berger Paints. After conquering the paint market, MTEP started to focus on another lucrative market i.e, lubricants, in 1998 and won exclusive rights for supplying packaging for companies including Castrol, Valvoline, Shell and Exxon Mobil which were using metal containers till then. For this the company came up with innovative features such as 'pull out spout', 'single & double locking system' and 'tamper proof seals' for lubricant packaging containers.
Early adopter of new Technology Historically, the company was mainly supplying plastic pails to the paints and lubricants end-users which were more or less a commoditized business that lacked product differentiation and pricing power.
In 2011, MTEP was the first company to introduce in- mold labeling (IML) concept in India. Since 1990s IML was gaining traction in Europe and management was confident of its acceptance in India. MTEP acquired this technology for getting better visibility and value addition. In- mold labeling (IML) is a technique which combines injection molding of the container and placement of the label into single step. In-mold labeling is the latest technology used globally to add photographic, glossy labels to packaging and thus enhance brand value. The IML process involves injecting a mass of molten polymer against the mold walls where the label is placed. Thereby, both the container and the label are formed in one process which removes the need for traditional methods such as screen-printing and heat transfer labeling. As the IML label is multi-layered, it remains protected from scratches, other wear and tear that comes from regular use and provides better visual appearance and reduces the packaging costs. As robots are used in IML, the company is able to deliver photographic-quality labeling with hygienic, hands-free production of containers, suitable especially for food and FMCG products. Whereas other labelling techniques prevalent in the industry include screen printing, shrink sleeving and heat transfer labelling (HTL).
Source: Company, Geojit Research.
An innovator
Backward-integration
supports margin expansion
Traditional process
Step 1: Input raw material – Poly Propolyene Co Polymer (PPCP)
Step 2: Injection molding
Step 3: Screen
printing
Step 3: HTL
wrapping
Step 4: Quality
Check
Step 5: Handle Fixing & Packing
Step 6: Dispatching for clients
Step 3: Screen
wrapping

www.geojit.com
IML process
Over the last ~5 years, the company has witnessed robust growth in revenues from the IML segment. The volumes from IML has witnessed significant jump from 19% to 52% over FY14-18.
Volume share of IML & Non-IML
Source: Company, Geojit Research.
Over FY14-18 revenue contribution of IML increased to 58% from 20%. This increase was largely led by penetration of IML packaging in the lubricant and paint industries followed by rising penetration in the Food & FMCG segment. In last 2 years, on account of quality labeling, hygienic manufacturing and hands-free production of containers, IML-packaged containers have become the preferred choice for the branded players in Food & FMCG industry. Further, IML packaging forms major part of the volumes from this plant, considering this we expect IML share is expected to pick-up going forward.
Step 1: Input raw material – Poly Propolyene Co Polymer (PPCP)
Step 3: Quality Check
Step 4: Handle Fixing & Packing
Step 5: Dispatching for clients
Step 2: Injection Molding with In-Mold Labeling done by Robots
Backward integration… a well thought strategy MTEP is the only company in India having fully integrated facilities ranging from label mak-ing and mold adaptations to in-house robots for use in its production line. Further, it is the only packaging company in the world with an in-house tool room capable of manufacturing the robots required for IML packaging. Initially, MTEP imported three robots from Taiwan by incurring a cost of over Rs10crore. To increase its capacity in IML and reduce cost, the com-pany started developing the robotic systems in-house. Currently it has 55 robots, of which 49 were designed and manufactured in-house at one-third of the imported cost. Due to the back-ward integration into robotic technology, the company is able to design manufacturing molds and different labels in short time, boosting the efficiency and quality of its products. Due to this, MTEP is able to reduce mold costs and wastage, ensure optimal usage of raw material and develop hygienic products due to the absence of human intervention, all of which ensure supply at competitive prices without compromising on quality. Due to the backward integra-tion of design, manufacture of own molds and use of robots in production process provides MTEP significant edge over its competitors. Increasing share of IML in product mix coupled with backward integration has helped MTEP to expand its gross margins by 540bps to 40.5% over FY13-18.
IML share on upward trajectory….margin accretive
Source: Company, Geojit Research.
IML technology to gain
traction
Backward-integration
supports margin expansion
19%27%
40.0%47%
52%
81% 73% 60.0% 53% 48%0%
10%
20%
30%
40%
50%
60%
70%
80%
90%
FY14 FY15 FY16 FY17 FY18
IML Non-IML

www.geojit.com
EBITDA margins improving
Foray into edible oil/ghee packaging…an opportunity MTEP has forayed into edible oil/ghee packaging, which has an industry size of INR10bn. The company has started supplying innovative square shape IML containers to Madhuri Oils and Sanchi Ghee. In FY20 management expects Rs50cr revenue from this new opportunity. Further, management is in talks with Britannia and Gokul Ghee (Kolhapur Zilla Sahakari Dudh Utpadak Sangh Ltd.) for ghee packaging. The key benefits of new square shape IML containers versus metal tins/blow-molded containers are: scratch resistant, pull-up spout and handle for easy pouring, permanent branding, reusability of the container, stackable & space saving coupled with transport costs and more advertising space on all sides. We believe the improving acceptability of IML packaging by edible oil/ghee players can lead to a shift from blow-molded containers/tins to square shaped IML containers.
Revenue share of IML & Non-IML
Source: Company, Geojit Research.
Focus on tapping opportunity from FMCG industry… As of FY18, MTEP’s Food & FMCG (F&F) packaging segment contributes 18% of overall revenue versus 2% in FY14. Amid growing regulatory scrutiny with regards to contamination in food products, FSSAI is likely to come up with more stringent regulations. Considering this, IML packaging is likely to gain more traction in FMCG given its superior functionality compared to alternative packaging. Given MTEP’s technological superiority, ability to be innovative, backward integration and long history of sticky clients, we believe that the company has potential to scale-up its F&F segment. Further, the realisation from Food & FMCG packaging is 20-25% higher than that for lubricants and paints, largely due to customization and differentiation that packaging suppliers need to build-in for better visual appeal and proprietary design. Whereas, plastic pails supplied to paints and lubricants end-users are the more commoditized in nature. Currently management’s focus is to increase the contribution of F&F segment in the revenue mix which is likely to help the company in expanding margins. The edible oil packs which were introduced by company few years back, is expected to provide next big growth opportunity. Additionally, company plans to introduce new packs for Ghee. Going forward we believe that contribution of F&F segment in revenue mix will be key driver for earnings.
Source: Company, Geojit Research.
F&F segment provides
significant opportunity to
scale-up
12.4% 12.1%
10.4%
11.6%
14.0%
16.6%17.2%
18.7%
8.0%
10.0%
12.0%
14.0%
16.0%
18.0%
20.0%
FY11 FY12 FY13 FY14 FY15 FY16 FY17 FY18
EBITDA margins
1% 5% 14% 20% 30% 44.2% 49% 58%
99% 95%86% 80%
70%55.8% 51% 43%
0%
20%
40%
60%
80%
100%
FY11 FY12 FY13 FY14 FY15 FY16 FY17 FY18
IML Non IML

www.geojit.com
Strong client base In past two decades, ~90% of revenue is contributed from paint and lubricant industries. MTEP enjoys 20-25% share in paint industry and its top 5 clients includes Nerolac, Akzo Nobel, and Asian Paints. Further, it is the market leader in lubricant packaging with 70% market share and provides ~90-95% of packaging needs to Castrol since 1997. MTEP bagged prestigious contracts of Shell & Exxon Mobil for 5 years of exclusive supply. In Food & FMCG segment, it has marquee clients like Procter & Gamble, ITC, HUL, Amul, Kraft Foods, Cadbury, London Dairy, Mondelez, Heinz and Vadilal etc.
Top 5 clients (%) -FY18
Source: Company, Geojit Research.
Key clients
28%
13%
11%10%
8%
30%
Asian Paints
Kansai Nerolac
Castrol
Mondelēz
Akzo Nobel
Others
www.geojit.com
27th December 2018
In FY17 MTEP set up a plant in UAE-Ras Al Khaimah (RAK) of 3,000tn capacity with a capex of Rs150mn for catering to paints, lubes, food and dairy companies in UAE and Iran given no sizable IML players and the trend of using bigger containers for food/dairy products. However, the performance of RAK was not as per management’s expectations. The capacity utilization during FY18 was limited to 25%. Recently management has shifted some machinery from the RAK unit to Hyderabad plant and currently it is being utilised to make 5, 15 and 17litre packs for ghee and edible oil segments. The decision on full closure of the RAK plant depends on a major client’s decision which is awaited in the immediate future.
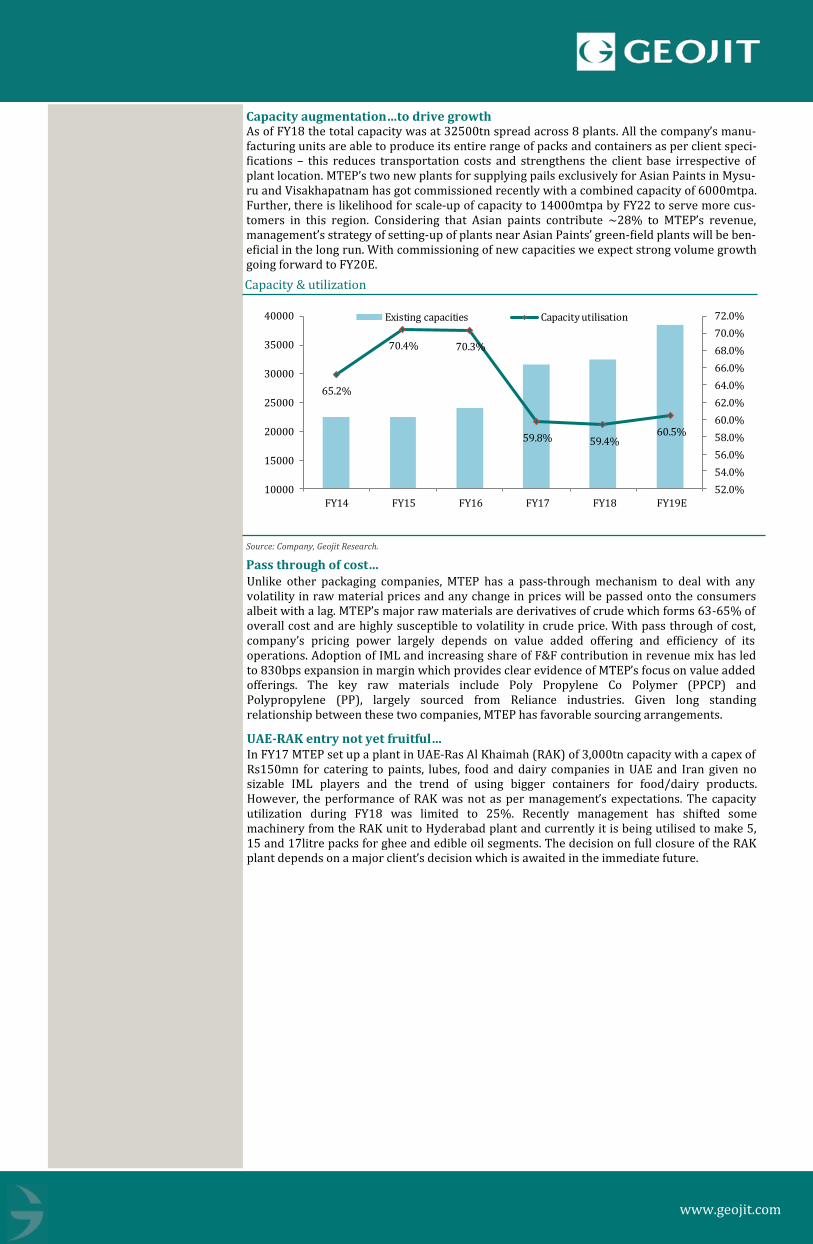
Capacity augmentation…to drive growth
Source: Company, Geojit Research.
Pass through of cost… Unlike other packaging companies, MTEP has a pass-through mechanism to deal with any volatility in raw material prices and any change in prices will be passed onto the consumers albeit with a lag. MTEP’s major raw materials are derivatives of crude which forms 63-65% of overall cost and are highly susceptible to volatility in crude price. With pass through of cost, company’s pricing power largely depends on value added offering and efficiency of its operations. Adoption of IML and increasing share of F&F contribution in revenue mix has led to 830bps expansion in margin which provides clear evidence of MTEP’s focus on value added offerings. The key raw materials include Poly Propylene Co Polymer (PPCP) and Polypropylene (PP), largely sourced from Reliance industries. Given long standing relationship between these two companies, MTEP has favorable sourcing arrangements.
As of FY18 the total capacity was at 32500tn spread across 8 plants. All the company’s manu-facturing units are able to produce its entire range of packs and containers as per client speci-fications – this reduces transportation costs and strengthens the client base irrespective of plant location. MTEP’s two new plants for supplying pails exclusively for Asian Paints in Mysu-ru and Visakhapatnam has got commissioned recently with a combined capacity of 6000mtpa. Further, there is likelihood for scale-up of capacity to 14000mtpa by FY22 to serve more cus-tomers in this region. Considering that Asian paints contribute ~28% to MTEP’s revenue, management’s strategy of setting-up of plants near Asian Paints’ green-field plants will be ben-eficial in the long run. With commissioning of new capacities we expect strong volume growth going forward to FY20E.
Capacity & utilization
UAE-RAK entry not yet fruitful…
65.2%
70.4% 70.3%
59.8% 59.4%60.5%
52.0%
54.0%
56.0%
58.0%
60.0%
62.0%
64.0%
66.0%
68.0%
70.0%
72.0%
10000
15000
20000
25000
30000
35000
40000
FY14 FY15 FY16 FY17 FY18 FY19E
Existing capacities Capacity utilisation

www.geojit.com
Financials
Revenue grew by 12% CAGR over FY13-FY18… Revenue grew by healthy 12% CAGR over FY13-18. Post adoption of IML technology, MTEP’s revenue from IML segment grew by 49% CAGR over the same period. This was largely led by increasing acceptance of IML by the end users of packaging. Going forward incremental volumes from capacity addition in paint (exclusive for Asian paints in Mysuru & Vizag) and increasing contribution from F&F segment led by strong client addition will drive revenue growth. We expect revenue to grow by 17% CAGR over FY19-21E.
Revenue growth trend
Source: Company, Geojit Research.
EBITDA to grow by 20% CAGR over FY19E-21E… EBITDA grew by 26% YoY as the share of IML in the revenue mix increased from 5% in FY13 to 57% during FY18. MTEP’s operating margin expanded by 830bps to 18.7% in FY18 versus 10.4% in FY13. We expect further scope for expansion in EBITDA margins as full benefits of IML is yet to be realised as the share of IML mix is likely to increase going forward. Additional-ly, with rise in contribution from F&F segment where the volumes are largely from IML mar-gins are likely to improve further. However given volatility in raw material price in the near term, we factor EBITDA margin to be at 18% and 18.4% for FY19E & FY20E. Post this we ex-pect margin to improve to 18.9% in FY21E
EBITDA and Margins %
Source: Company, Geojit Research.
20 30 40 46 52 63 73 87 104
10.4%11.6%
14.0%
16.6%17.2%
18.7%18.0% 18.4% 18.9%
1.0%
3.0%
5.0%
7.0%
9.0%
11.0%
13.0%
15.0%
17.0%
19.0%
21.0%
10
30
50
70
90
FY13 FY14 FY15 FY16 FY17 FY18 FY19E FY20E FY21E
EBITDA Margin
192 254 285 276 301 339 403 475 551
10.2%
32.1%
12.3%
-3.3%
9.1%12.9%
18.7% 17.9%15.9%
-10.0%
-5.0%
0.0%
5.0%
10.0%
15.0%
20.0%
25.0%
30.0%
35.0%
150
250
350
450
550
650
FY13 FY14 FY15 FY16 FY17 FY18 FY19E FY20E FY21E
Revenue YoY growth

www.geojit.com
Company Description
PAT growth
PAT to grow by 22% CAGR over FY19-21E… Profitability grew by whopping 41% CAGR over FY13-FY18 largely led by 730bps expansion in gross margins and lower cost. PAT margins witnessed strong expansion from 3% to 9.3% over FY13-18. With increasing share of high margins in F&F segment and IML in the revenue mix we expect strong profitability going ahead. We expect PAT to grow by 22% CAGR over FY19E-21E.
Key segments…
Paints packaging
MTEP is India’s leading packaging specialist for paints with numerous sizes in all shapes. MTEP’s containers are stackable, rest securely on the pallet and can be used in a shaker. Be it classic oval, rectangular or square in shape, the broad front of paint buckets provides the per-fect advertising space. These pails are provided with tamper proof lids so as to ensure com-plete safety against adulteration. Lube packaging MTEP supplies injection-molded containers for lubes. These containers are completely leak proof since they are made as a single unit. They have extremely attractive aesthetics with ex-quisite decoration to project the product. Due to compact size and mold design, these contain-ers are easy to store and stack.
Source: Company, Geojit Research.
Mold-Tek Packaging Limited (MTEP) is an innovator and pioneer in rigid plastic packaging in India and is market leader in this segment. MTEP was established in 1986 by technocrats Lakshmana Rao and A. Subramanyam. Company manufactures injection molded containers for lubes, paints, food and other products. Further, it is the first company to introduce IML technology in India. MTEP is the only company in India having fully integrated facilities rang-ing from label making and mold adaptations to in-house robots in its production process.
6 9 17 24 27 32 34 42 50.9
-38.1%
56.9% 86.0%42.9%
11.6%17.9%
8.4%
21.7% 21.8%
3.0% 3.6% 5.9% 8.7% 8.9% 9.3% 8.5% 8.8% 9.2%
-60.0%
-40.0%
-20.0%
0.0%
20.0%
40.0%
60.0%
80.0%
100.0%
0
10
20
30
40
50
60
FY13 FY14 FY15 FY16 FY17 FY18 FY19E FY20E FY21E
PAT YoY growth Margin

www.geojit.com
Food & FMCG segment For Food & FMCG, MTEP supplies IML decorated thin wall containers which have high visual appeal, stringent quality control (hygiene) and higher shelf life. In the hyper-competitive F&F space, these requirements are imperative for any company to stand out from the crowd. Key Risks… ~ 70% of the revenue is contributed by top 5 clients.
Presently paints & lubricants contribute 80% of revenue. Any slowdown in these industries will impact profitability .

www.geojit.com
27th December 2018
Y.E March (Rs Cr) FY17A FY18A FY19E FY20E FY21E
Sales 301 339 403 475 551 % change 9.1 12.9 18.7 17.9 15.9 EBITDA 52 63 73 87 104 % change 13.3 22.4 14.3 20.6 19.1 Depreciation 10 12 15 20 23 EBIT 42 52 58 67 81 Interest 2 4 7 6 6 Other Income 1.6 1 2 3 4 PBT 41 49 53 64 78 % change 11.2 17.9 8.8 21.6 21.8 Tax 14 17 18 23 27 Tax Rate (%) 34.7 34.8 35.0 35.0 35.0 Reported PAT 22 31 34 42 51 Adj.* (5) (1) - - - Adj. PAT 27 32 34 42 51 % change 11.6 17.9 8.4 21.6 21.8 No. of shares (cr) 2.8 2.8 2.8 2.8 2.8 Adj EPS (Rs) 9.7 11.4 12.4 15.1 18.4 % change 11.6 17.9 8.3 21.6 21.8 DPS (Rs) 3.9 1.9 4.1 4.1 4.1 CEPS (Rs) 13.3 15.7 17.7 22.3 26.7
PROFIT & LOSS BALANCE SHEET
Y.E March (Rs Cr) FY17A FY18A FY19E FY20E FY21E
Cash 0.2 0.2 0.2 1.2 0.3 Accounts Receivable 61 82 92 111 128 Inventories 36 50 58 66 76 Other Cur. Assets 17 20 22 26 31 Investments 21 20 15 10 7 Gross Fixed Assets 100 136 186 211 241 Net Fixed Assets 90 114 149 154 161 CWIP 10 15 10 5 8 Intangible Assets - - - - - Def. Tax (Net) (7) (10) (10) (10) (10) Other Assets - - - - - Total Assets 229 292 337 364 402 Current Liabilities 25 29 39 45 54 Provisions 9 2 3 3 4 Debt Funds 39 80 85 82 71 Other Liabilities - - - - - Equity Capital 14 14 14 14 14 Reserves & Surplus 142 167 196 220 260 Shareholder’s Fund 156 181 210 234 273 Total Liabilities 229 292 337 364 402 BVPS 56 65 76 84 99
CASH FLOW RATIOS
Y.E March (Rs Cr) FY17A FY18A FY19A FY20E FY21E
Net inc. + Depn. 37 44 49 62 74 Non-cash adj. (3) 6 5 3 3 Changes in W.C (8) (40) (6) (27) (23) C.F.Operation 26 9 48 38 53 Capital exp. (28) (43) (45) (20) (33) Change in inv. (5) 1 9 1 3 Other invest.CF 8 2 2 3 4 C.F - Investment (25) (40) (34) (16) (26) Issue of equity - - - - - Issue/repay debt 12 40 6 (4) (11) Dividends paid (11) (5) (11) (11) (11) Other finance.CF (2) (4) (7) (6) (6) C.F - Finance (1) 31 (13) (21) (28) Chg. in cash 0 (0) 0.6 0.4 (0.9) Closing cash 0.2 0.2 0.7 1.2 0.3
Y.E March FY17A FY18A FY19E FY20E FY21E
Profitab & Return
EBITDA margin (%) 17.2 18.7 18.0 18.4 18.9 EBIT margin (%) 13.9 15.2 14.3 14.2 14.7 Net profit mgn.(%) 8.9 9.3 8.5 8.8 9.2 ROE (%) 17.9 18.8 17.9 19.1 20.1 ROCE (%) 15.7 15.2 14.1 15.1 16.7 W.C & Liquidity Receivables (days) 70.1 77.0 78.3 77.3 79.2 Inventory (days) 59.0 78.4 80.0 79.1 79.5 Payables (days) 51.5 49.5 50.8 54.0 55.2 Current ratio (x) 3.3 4.8 4.1 4.2 4.1 Quick ratio (x) 2.4 2.8 2.3 2.5 2.4 Turnover &Leverage Gross asset T.O (x) 3.3 2.9 2.5 2.4 2.4 Total asset T.O (x) 1.4 1.3 1.3 1.3 1.4 Int. covge. ratio (x) 18.1 12.6 8.5 11.2 12.8 Adj. debt/equity (x) 0.2 0.4 0.4 0.3 0.3 Valuation EV/Sales (x) 2.6 2.4 2.0 1.7 1.5 EV/EBITDA (x) 14.9 12.8 11.3 9.3 7.7 P/E (x) 27.2 23.1 21.3 17.5 14.4 P/BV (x) 4.7 4.1 3.6 3.1 2.7
Standalone Financials

www.geojit.com
Source: Bloomberg, Geojit Research.
27th December 2018
Dates Rating Target 6th March, 2019 Buy 312
Investment Rating Criteria
Large Cap Stocks; Buy - Upside is above 10%. Hold - Upside is between 0% - 10%. Reduce - Downside is more than 0%. Neutral - Not Applicable
Mid Cap and Small Cap; Buy - Upside is above 15%. Accumulate - Upside is between 10% - 15%. Hold - Upside is between 0% - 10%. Reduce/Sell - Downside is more than 0%. Neutral - Not Applicable
To satisfy regulatory requirements, we attribute ‘Accumulate’ as Buy and ‘Reduce’ as Sell. The recommendations are based on 12 month horizon, unless otherwise specified. The investment ratings are on absolute positive/negative return basis. It is possible that due to volatile price fluctuation in the near to medium term, there could be a temporary mismatch to rating. For reasons of valuations/return/lack of clarity/event we may revisit rating at appropriate time. Please note that the stock always carries the risk of being up-graded to BUY or downgraded to a HOLD, REDUCE or SELL. Neutral- The analyst has no investment opinion on the stock under review
General Disclosures and Disclaimers
CERTIFICATION
I, Anil.R, author of this Report, hereby certify that all the views expressed in this research report reflect our personal views about any or all of the subject issuer or securities. This report has been prepared by the Research Team of Geojit Financial Services Limited, hereinafter referred to as Geojit. COMPANY OVERVIEW
Geojit Financial Services Limited (hereinafter Geojit), a publically listed company, is engaged in services of retail broking, depository services, portfolio management and marketing investment products including mutual funds, insurance and properties. Geojit is a SEBI registered Research Entity and as such prepares and shares research data and reports periodically with clients, investors, stake holders and general public in compliance with Securities and Ex-change Board of India Act, 1992, Securities And Exchange Board Of India (Research Analysts) Regulations, 2014 and/or any other applicable directives, instructions or guidelines issued by the Regulators from time to time. DISTRIBUTION OF REPORTS
This document is not for public distribution and has been furnished to you solely for your information and must not be reproduced or redistributed to any other person. Geojit will not treat the recipients of this report as clients by virtue of their receiving this report. GENERAL REPRESENTATION
The research reports do not constitute an offer or solicitation for the purchase or sale of any financial instruments, inducements, promise, guarantee, war-ranty, or as an official confirmation of any transaction or contractual obligations of any kind. This report is provided for assistance only and is not intended to be and must not alone be taken as the basis for an investment decision. The information contained herein is from publicly available data or other sources believed to be reliable, but we do not represent that it is accurate or complete and it should not be relied on as such. We have also reviewed the research report for any untrue statements of material facts or any false or misleading information. While we endeavor to update on a reasonable basis the infor-mation discussed in this material, there may be regulatory, compliance, or other reasons that prevent us from doing so. RISK DISCLOSURE
Geojit and/or its Affiliates and its officers, directors and employees including the analyst/authors shall not be in any way be responsible for any loss or damage that may arise to any person from any inadvertent error in the information contained in this report. Investors may lose his/her entire investment under certain market conditions so before acting on any advice or recommendation in these material, investors should consider whether it is suitable for their particular circumstances and, if necessary, seek professional advice. This report does not take into account the specific investment objectives, finan-cial situation/circumstances and the particular needs of any specific person who may receive this document. The user assumes the entire risk of any use made of this information. Each recipient of this report should make such investigation as it deems necessary to arrive at an independent evaluation of an investment in the securities of companies referred to in this report (including the merits and risks involved). The price, volume and income of the invest-
ments referred to in this report may fluctuate and investors may realize losses that may exceed their original capital. FUNDAMENTAL DISCLAIMER
We have prepared this report based on information believed to be reliable. The recommendations herein are based on 12 month horizon, unless otherwise specified. The investment ratings are on absolute positive/negative return basis. It is possible that due to volatile price fluctuation in the near to medium term, there could be a temporary mismatch to rating. For reasons of valuations/return/lack of clarity/event we may revisit rating at appropriate time. The stocks always carry the risk of being upgraded to buy or downgraded to a hold, reduce or sell. The opinions expressed are subject to change but we have no obligation to tell our clients when our opinions or recommendations change. This report is non-inclusive and does not consider all the information that the recipients may consider material to investments. This report is issued by Geojit without any liability/undertaking/commitment on the part of itself or anyof its entities. We may have issued or may issue on the companies covered herein, reports, recommendations or information which is contrary to those contained in this report.
PRICE HISTORY
0
50
100
150
200
250
300
350
400
Mar-16 Sep-16 Mar-17 Sep-17 Mar-18 Sep-18 Mar-19

www.geojit.com
27th December 2018
The projections and forecasts described in this report should be evaluated keeping in mind the fact that these are based on estimates and assumptions and will vary from actual results over a period of time. The actual performance of the companies represented in the report may vary from those projected. These are not scientifically proven to guarantee certain intended results and hence, are not published as a warranty and do not carry any evidentiary value whatso-ever. These are not to be relied on in or as contractual, legal or tax advice. Prospective investors and others are cautioned that any forward-looking state-ments are not predictions and may be subject to change without notice. JURISDICTION
The securities described herein may not be eligible for sale in all jurisdictions or to all categories of investors. The countries in which the companies men-tioned in this report are organized may have restrictions on investments, voting rights or dealings in securities by nationals of other countries. Distributing/taking/sending/dispatching/transmitting this document in certain foreign jurisdictions may be restricted by law, and persons into whose possession this document comes should inform themselves about, and observe any such restrictions. Failure to comply with this restriction may constitute a violation of any foreign jurisdiction laws. Foreign currencies denominated securities are subject to fluctuations in exchange rates that could have an adverse effect on the value or price of or income derived from the investment. Investors in securities such as ADRs, the value of which are influenced by foreign currencies effectively assume currency risk. REGULATORY DISCLOSURES:
Geojit’s Associates consists of privately held companies such as Geojit Technologies Private Limited (GTPL- Software Solutions provider), Geojit Credits Private Limited (GCPL- NBFC Services provider), Geojit Investment Services Limited (GISL- Corporate Agent for Insurance products), Geojit Financial Management Services Private Limited (GFMSL) &Geojit Financial Distribution Private Limited (GFDPL), (Distributors of Insurance and MF Units).In the context of the SEBI Regulations on Research Analysts (2014), Geojit affirms that we are a SEBI registered Research Entity and in the course of our busi-ness as a stock market intermediary, we issue research reports /research analysis etc that are prepared by our Research Analysts. We also affirm and under-take that no disciplinary action has been taken against us or our Analysts in connection with our business activities. In compliance with the above mentioned SEBI Regulations, the following additional disclosures are also provided which may be considered by the reader before making an investment decision: 1. Disclosures regarding Ownership*:
Geojit confirms that: It/its associates have no financial interest or any other material conflict in relation to the subject company (ies) covered herein. It/its associates have no actual beneficial ownership greater than 1% in relation to the subject company (ies) covered herein. Further, the Analyst confirms that:
he, his associates and his relatives have no financial interest in the subject company (ies) covered herein, and they have no other material conflict in the subject company.
he, his associates and his relatives have no actual/beneficial ownership greater than 1% in the subject company covered
2. Disclosures regarding Compensation:
During the past 12 months, Geojit or its Associates:
(a) Have not received any compensation from the subject company; (b) Have not managed or co-managed public offering of securities for the subject com-pany (c) Have not received any compensation for investment banking or merchant banking or brokerage services from the subject company. (d) Have not received any compensation for products or services other than investment banking or merchant banking or brokerage services from the subject company (e) Have not received any compensation or other benefits from the subject company or third party in connection with the research report (f) The subject com-pany is / was not a client during twelve months preceding the date of distribution of the research report. 3. Disclosure by Geojit regarding the compensation paid to its Research Analyst:
Geojit hereby confirms that no part of the compensation paid to the persons employed by it as Research Analysts is based on any specific brokerage ser-vices or transactions pertaining to trading in securities of companies contained in the Research Reports. 4. Disclosure regarding the Research Analyst’s connection with the subject company:
It is affirmed that the I, Anil.R, Research Analyst(s) of Geojit have not served as an officer, director or employee of the subject company 5. Disclosure regarding Market Making activity:
Neither Geojit/its Analysts have engaged in market making activities for the subject company. Please ensure that you have read the “Risk Disclosure Docu-ments for Capital Market and Derivatives Segments” as prescribed by the Securities and Exchange Board of India before investing.
Geojit Financial Services Ltd. (formerly known as Geojit BNP Paribas Financial Services Ltd.), Registered Office: 34/659-P, Civil Line Road, Padivattom, Kochi-
682024, Kerala, India. Phone: +91 484-2901000, Website: www.geojit.com. For investor queries: [email protected], For grievances: grievanc-
[email protected], For compliance officer: [email protected].
Corporate Identity Number: L67120KL1994PLC008403, SEBI Stock Broker Registration No INZ000104737, Research Entity SEBI Reg No: INH200000345,
Investment Adviser SEBI Reg No: INA200002817, Portfolio Manager: INP000003203, Depository Participant: IN-DP-325-2017, ARN Regn.Nos:0098, IRDA
Corporate Agent (Composite) No.: CA0226