Embed Size (px)
Citation preview
09-11 Dec, 2012 Saudi Arabia-Jeddah
Moisture in Power Transformers
- How to Estimate and What to Do?
09-11 Dec, 2012 Saudi Arabia-Jeddah
Content
• The effects of water in a transformer
• How does water get into a transformer
• How can we measure moisture
• Interpretation and guidelines for moisture
• What can we do about it

09-11 Dec, 2012 Saudi Arabia-Jeddah
Water in a transformer

09-11 Dec, 2012 Saudi Arabia-Jeddah
Life of a transformer – with and without diagnostics and maintenance actions
09-11 Dec, 2012 Saudi Arabia-Jeddah
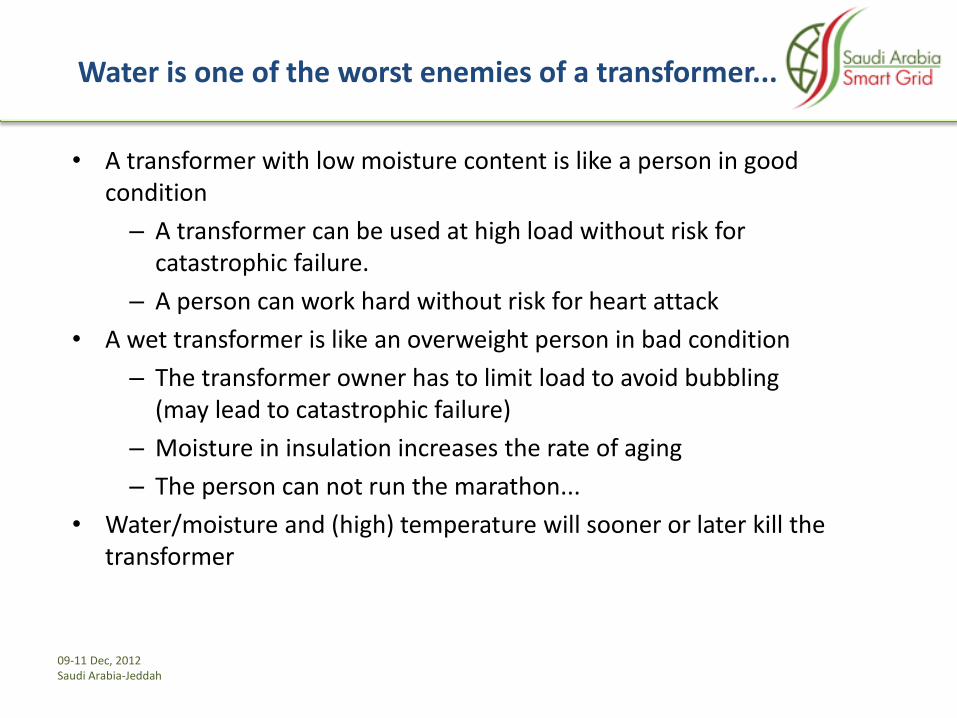
Water is one of the worst enemies of a transformer...
• A transformer with low moisture content is like a person in good condition
– A transformer can be used at high load without risk for catastrophic failure.
– A person can work hard without risk for heart attack
• A wet transformer is like an overweight person in bad condition
– The transformer owner has to limit load to avoid bubbling (may lead to catastrophic failure)
– Moisture in insulation increases the rate of aging
– The person can not run the marathon...
• Water/moisture and (high) temperature will sooner or later kill the transformer
09-11 Dec, 2012 Saudi Arabia-Jeddah
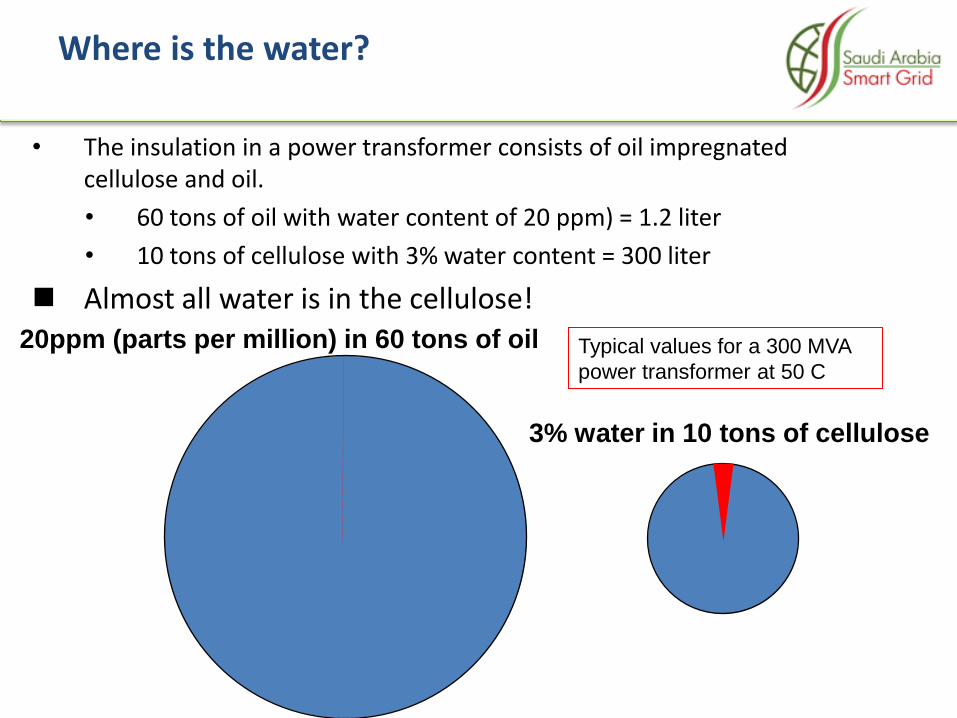
Where is the water?
• The insulation in a power transformer consists of oil impregnated cellulose and oil.
• 60 tons of oil with water content of 20 ppm) = 1.2 liter
• 10 tons of cellulose with 3% water content = 300 liter
Almost all water is in the cellulose! 20ppm (parts per million) in 60 tons of oil
3% water in 10 tons of cellulose
Typical values for a 300 MVA
power transformer at 50 C
09-11 Dec, 2012 Saudi Arabia-Jeddah
Water effects the transformer performance
Loading capability
• Limits the loading capability due to decreased bubbling
inception temperature
Dielectric strength
• Decreases the dielectric strength of the oil and decreases PD
inception voltage
Aging
• High temperature and moisture will dramatically accelerate
aging that lowers the mechanical strength of the cellulose
insulation
09-11 Dec, 2012 Saudi Arabia-Jeddah
High moisture limits the loading capability
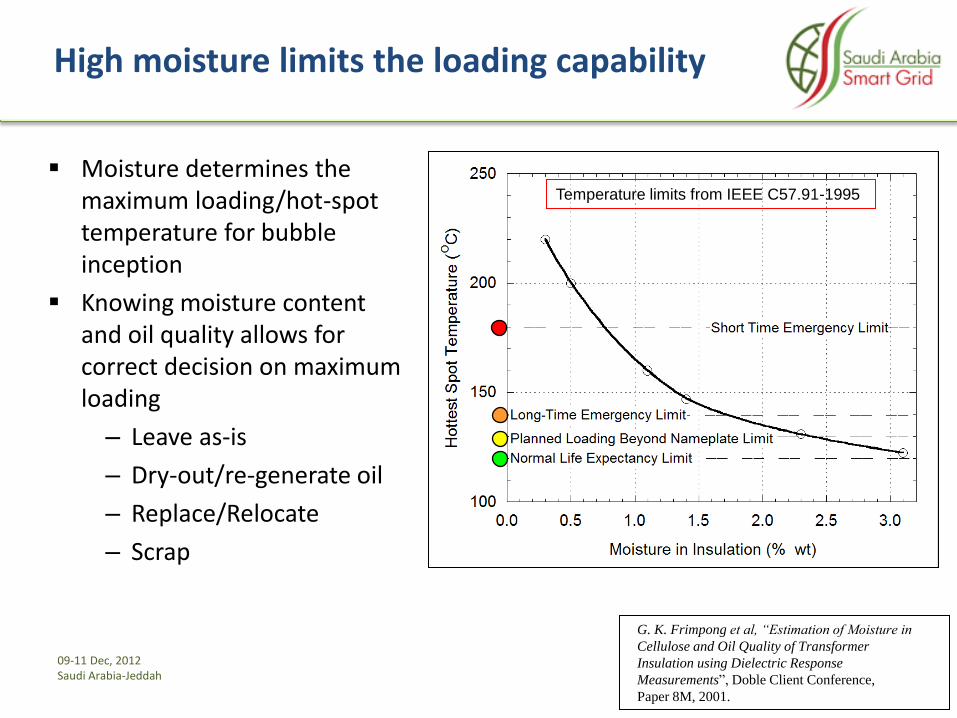
Moisture determines the maximum loading/hot-spot temperature for bubble inception
Knowing moisture content and oil quality allows for correct decision on maximum loading
– Leave as-is
– Dry-out/re-generate oil
– Replace/Relocate
– Scrap
G. K. Frimpong et al, “Estimation of Moisture in
Cellulose and Oil Quality of Transformer
Insulation using Dielectric Response
Measurements”, Doble Client Conference,
Paper 8M, 2001.
Temperature limits from IEEE C57.91-1995
09-11 Dec, 2012 Saudi Arabia-Jeddah
Life of a transformer – Moisture and aging
• During manufacturing, the cellulose insulation in the transformer is carefully dried out before it is impregnated with oil
• The moisture content in the solid insulation of a new transformer is typically targeted to be < 0.5% by weight
• As the transformer gets older, the moisture content will increase
– Open-breathing transformers, typically around 0.2%/year
– Sealed conservator transformers, typically around 0.05%/year
• In an old and/or severely deteriorated transformer, the moisture content can be > 4%
• The aging process of the insulation is directly related to moisture content

09-11 Dec, 2012 Saudi Arabia-Jeddah
0
5
10
15
20
25
30
35
40
45
50
80 90 100 110 120 130 140
Winding Hot Spot °C
Agin
g F
act
or
for
Kra
ft P
aper
(IE
EE
)
IEEE
Kraft
0.5%
Water 1%
2%3%
4%5%
Moisture accelerates aging
Left: Lars E. Lundgaard, Walter Hansen, Dag Linhjell, Terence J.
Painter, “Ageing of oil-impregnated paper in power
transformers”, IEEE PWRD, 2003
~2 years @ 3%
~12 years @ 1%

09-11 Dec, 2012 Saudi Arabia-Jeddah
Where does the water come from?
• Leaking gaskets and faulty water traps may expose the inside of the transformer to moisture humid air
• Exposure to humid air during site installation/commissioning
• Exposure to humid air during maintenance
• Normal aging of cellulose produces water
• Insufficient drying at manufacturing
Typical moisture content in paper/pressboard:
• New transformer: < 1%
• Aged transformer: 2 - 4%
Normal increase of water content is typically 0.05-0.2%/year
09-11 Dec, 2012 Saudi Arabia-Jeddah
Interpretation of moisture content by various standards and practices
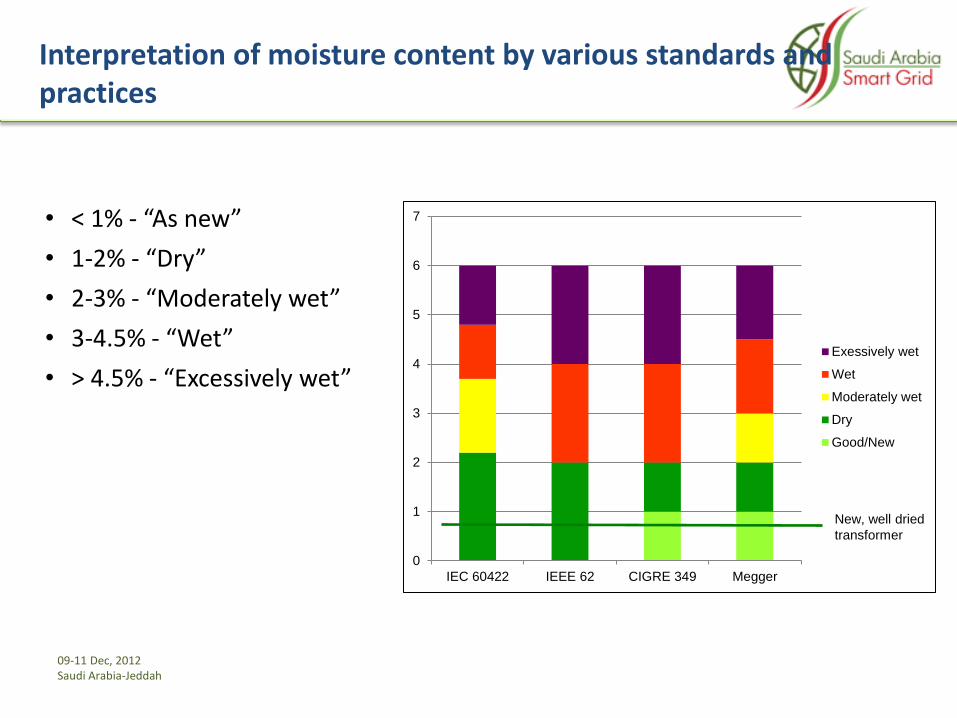
• < 1% - “As new”
• 1-2% - “Dry”
• 2-3% - “Moderately wet”
• 3-4.5% - “Wet”
• > 4.5% - “Excessively wet”
0
1
2
3
4
5
6
7
IEC 60422 IEEE 62 CIGRE 349 Megger
Exessively wet
Wet
Moderately wet
Dry
Good/New
New, well dried
transformer
09-11 Dec, 2012 Saudi Arabia-Jeddah
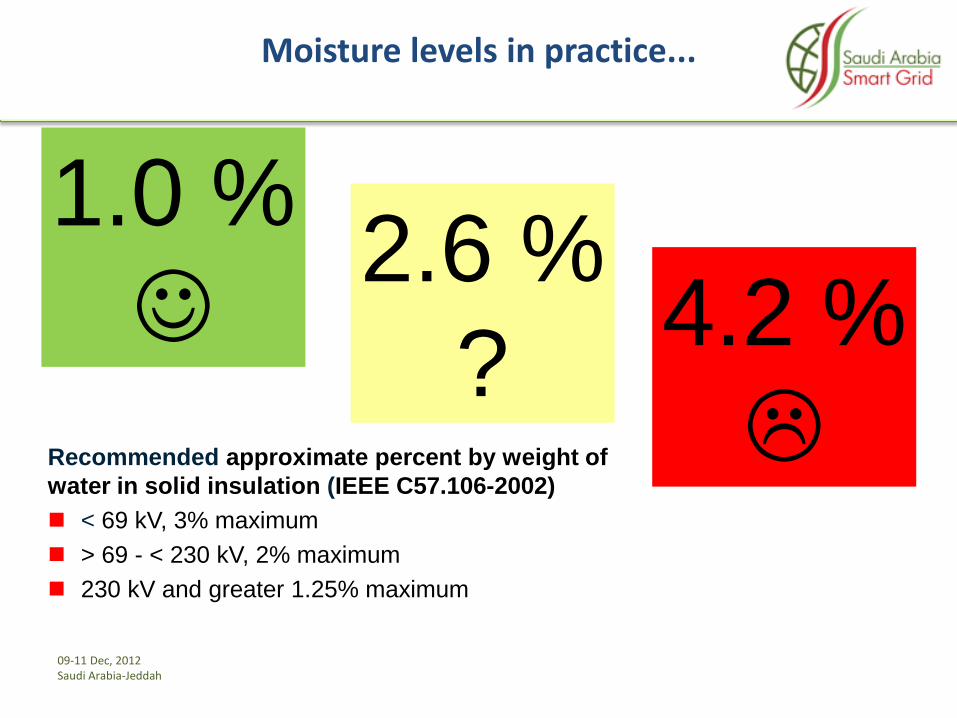
Moisture levels in practice...
1.0 %
4.2 %
2.6 %
? Recommended approximate percent by weight of
water in solid insulation (IEEE C57.106-2002)
< 69 kV, 3% maximum
> 69 - < 230 kV, 2% maximum
230 kV and greater 1.25% maximum
09-11 Dec, 2012 Saudi Arabia-Jeddah
Methods for moisture estimation in cellulose insulation
• Direct method
– Take paper sample from transformer and measure moisture content using Karl Fisher titration
• Indirect methods
– Moisture in oil
• Absolute values
• Relative saturation
– Power frequency tan delta/power factor measurements
– Dielectric response measurements
oReturn Voltage Measurement (RVM) – DC method
oPolarization-Depolarization Current measurements (PDC) – DC method
oDielectric Frequency Response measurements (DFR/FDS) – AC method
09-11 Dec, 2012 Saudi Arabia-Jeddah
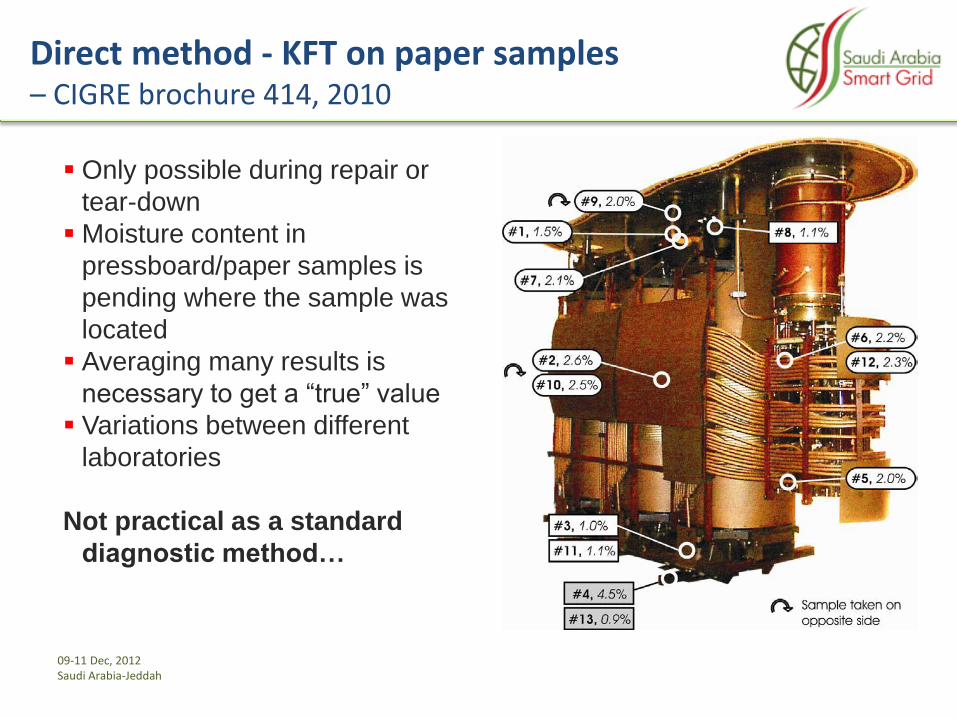
Direct method - KFT on paper samples – CIGRE brochure 414, 2010
Only possible during repair or
tear-down
Moisture content in
pressboard/paper samples is
pending where the sample was
located
Averaging many results is
necessary to get a “true” value
Variations between different
laboratories
Not practical as a standard
diagnostic method…

09-11 Dec, 2012 Saudi Arabia-Jeddah
KFT measurements on paper samples – Laboratory results
M. Koch, “Creating a Reliable Data Base for
Moisture Evaluation of Power Transformers“,
Pax and KTH Workshop on Variable Frequency
Diagnostics, Stockholm, 2007
0
0.5
1
1.5
2
2.5
3
3.5
4
Sample A Sample B Sample C
A
B
C
D
E
F
G
Moisture content in cellulose paper, %

09-11 Dec, 2012 Saudi Arabia-Jeddah
Absolute moisture in oil method
1. Oil sampling under service conditions
2. Measurement of water content by Karl Fischer titration
3. Deriving moisture content in paper via equilibrium diagrams
The procedure is easy to perform and very common but affected by substantial potential errors:
• Sampling and transportation of samples
• Large variation in laboratory results
• Diagrams only valid under equilibrium conditions (rarely happens during normal operation)
• Standard diagrams does not cover aged oil and/or cellulose that may have different solubility
The method tend to overestimate moisture in solid insulation…

09-11 Dec, 2012 Saudi Arabia-Jeddah
Water in oil – Examples of laboratory analysis – CIGRE Brochure 414, 2010

09-11 Dec, 2012 Saudi Arabia-Jeddah
Water In Oil – Equilibrium charts (Oommen)
Very difficult to estimate water in paper from oil samples taken at low temperatures!
Oil sample taken at 200C
4.0% water = 6 ppm
1.0 % water = 3 ppm
09-11 Dec, 2012 Saudi Arabia-Jeddah
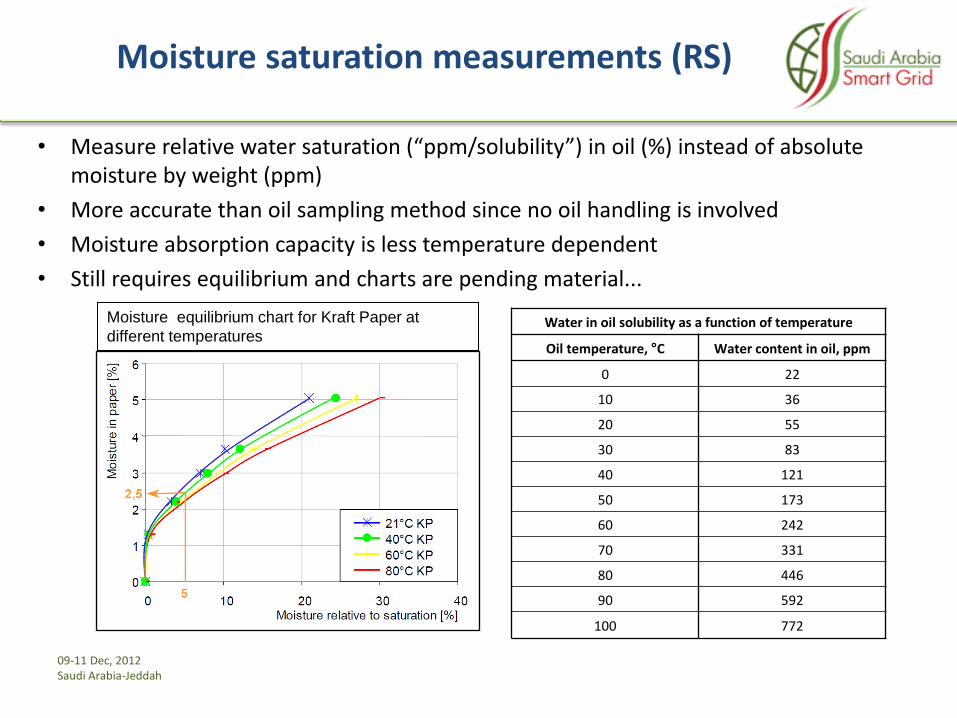
Moisture saturation measurements (RS)
• Measure relative water saturation (“ppm/solubility”) in oil (%) instead of absolute moisture by weight (ppm)
• More accurate than oil sampling method since no oil handling is involved
• Moisture absorption capacity is less temperature dependent
• Still requires equilibrium and charts are pending material...
Moisture equilibrium chart for Kraft Paper at
different temperatures Water in oil solubility as a function of temperature
Oil temperature, °C Water content in oil, ppm
0 22
10 36
20 55
30 83
40 121
50 173
60 242
70 331
80 446
90 592
100 772
09-11 Dec, 2012 Saudi Arabia-Jeddah
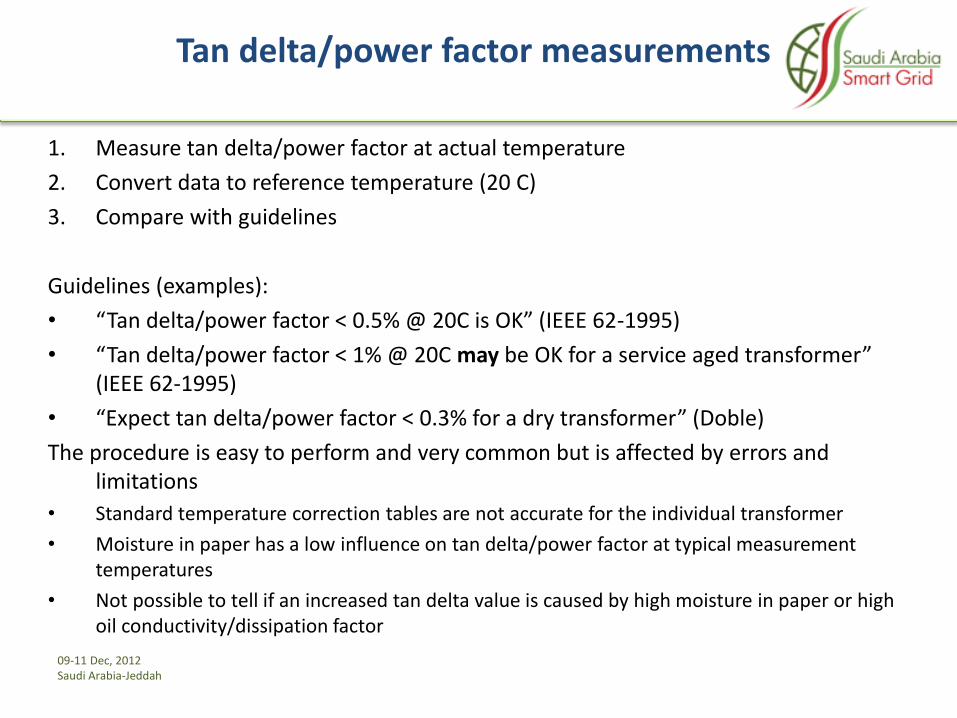
Tan delta/power factor measurements
1. Measure tan delta/power factor at actual temperature
2. Convert data to reference temperature (20 C)
3. Compare with guidelines
Guidelines (examples):
• “Tan delta/power factor < 0.5% @ 20C is OK” (IEEE 62-1995)
• “Tan delta/power factor < 1% @ 20C may be OK for a service aged transformer” (IEEE 62-1995)
• “Expect tan delta/power factor < 0.3% for a dry transformer” (Doble)
The procedure is easy to perform and very common but is affected by errors and limitations
• Standard temperature correction tables are not accurate for the individual transformer
• Moisture in paper has a low influence on tan delta/power factor at typical measurement temperatures
• Not possible to tell if an increased tan delta value is caused by high moisture in paper or high oil conductivity/dissipation factor
09-11 Dec, 2012 Saudi Arabia-Jeddah
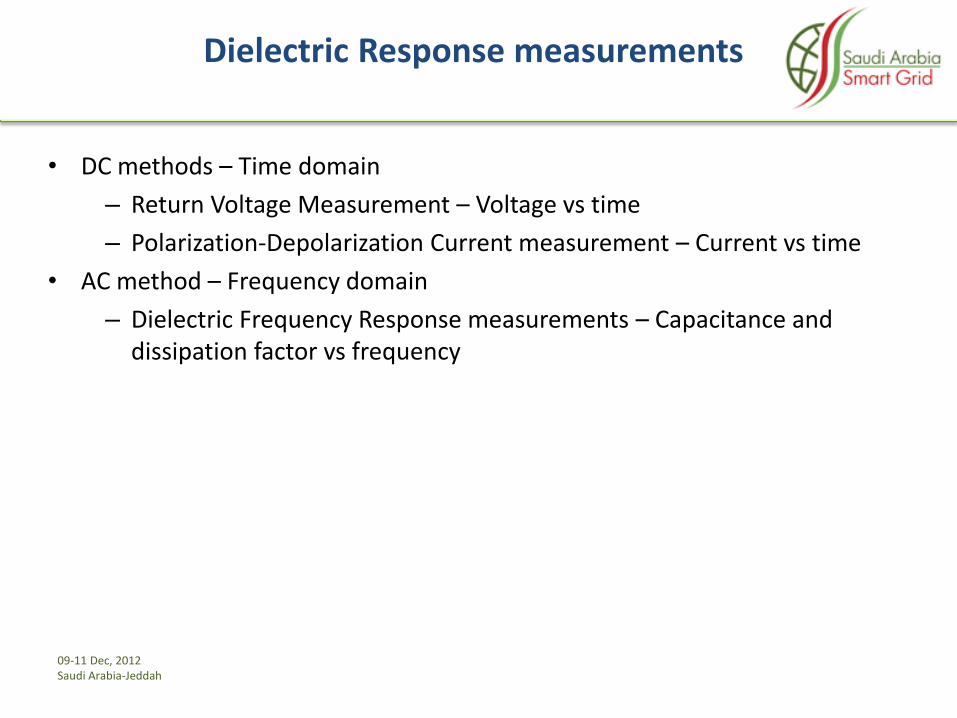
Dielectric Response measurements
• DC methods – Time domain
– Return Voltage Measurement – Voltage vs time
– Polarization-Depolarization Current measurement – Current vs time
• AC method – Frequency domain
– Dielectric Frequency Response measurements – Capacitance and dissipation factor vs frequency

09-11 Dec, 2012 Saudi Arabia-Jeddah
Methods for dielectric response measurements
DC (Polarization-Depolarization Current measurements)
Strength
– Shorter measurement time for very low frequencies
Weaknesses
– Sensitive to AC interference
– Very sensitive to VLF interference
– Very sensitive to DC interference
– Limited frequency range (PDC only)
– Data conversion necessary (combined PDC/DFR only)
– Discharge before measurement may be needed
AC (Dielectric Frequency Response
measurements)
Strengths
• Not sensitive to AC interference
• Not sensitive to VLF interference
• Not sensitive to DC interference
• Wide frequency range
• No data conversion
• No discharge necessary
Weakness
• Longer measurement time for very
low frequencies( with comment)
09-11 Dec, 2012 Saudi Arabia-Jeddah
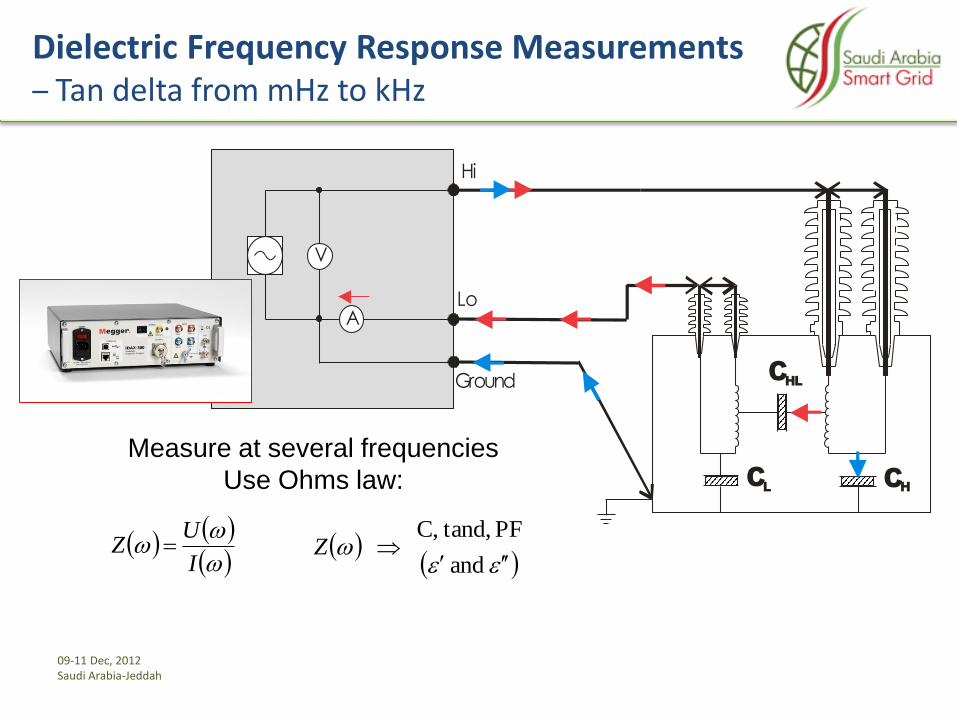
Dielectric Frequency Response Measurements – Tan delta from mHz to kHz
V
A
Hi
Lo
Ground CHL
CL
CH
I
UZ
and
PF tand,,C Z
Measure at several frequencies
Use Ohms law:
09-11 Dec, 2012 Saudi Arabia-Jeddah
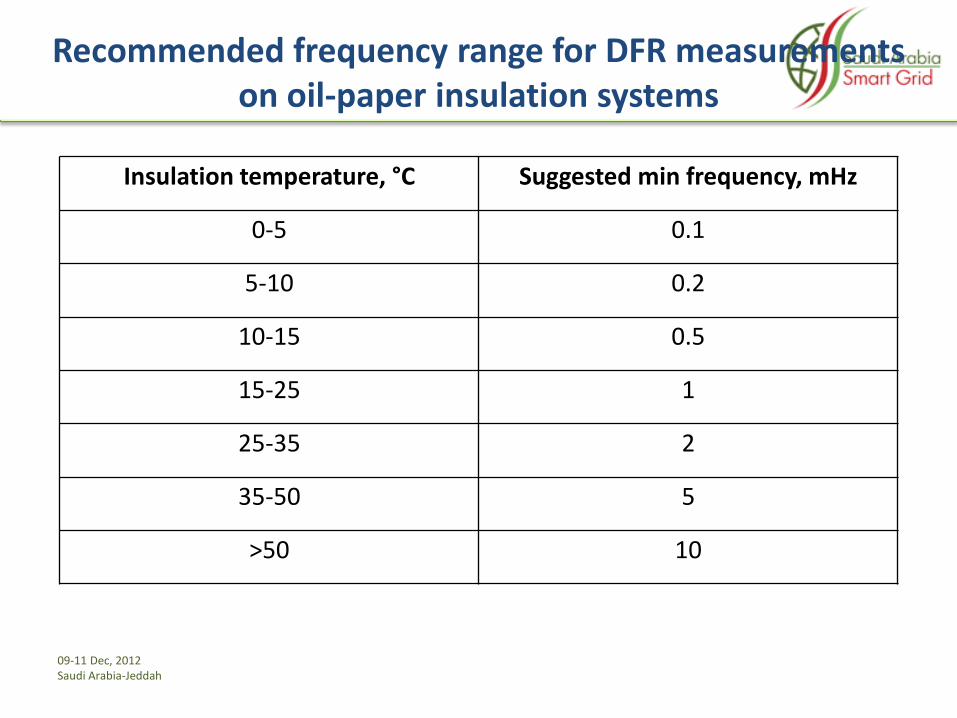
Recommended frequency range for DFR measurements on oil-paper insulation systems
Insulation temperature, °C Suggested min frequency, mHz
0-5 0.1
5-10 0.2
10-15 0.5
15-25 1
25-35 2
35-50 5
>50 10
09-11 Dec, 2012 Saudi Arabia-Jeddah
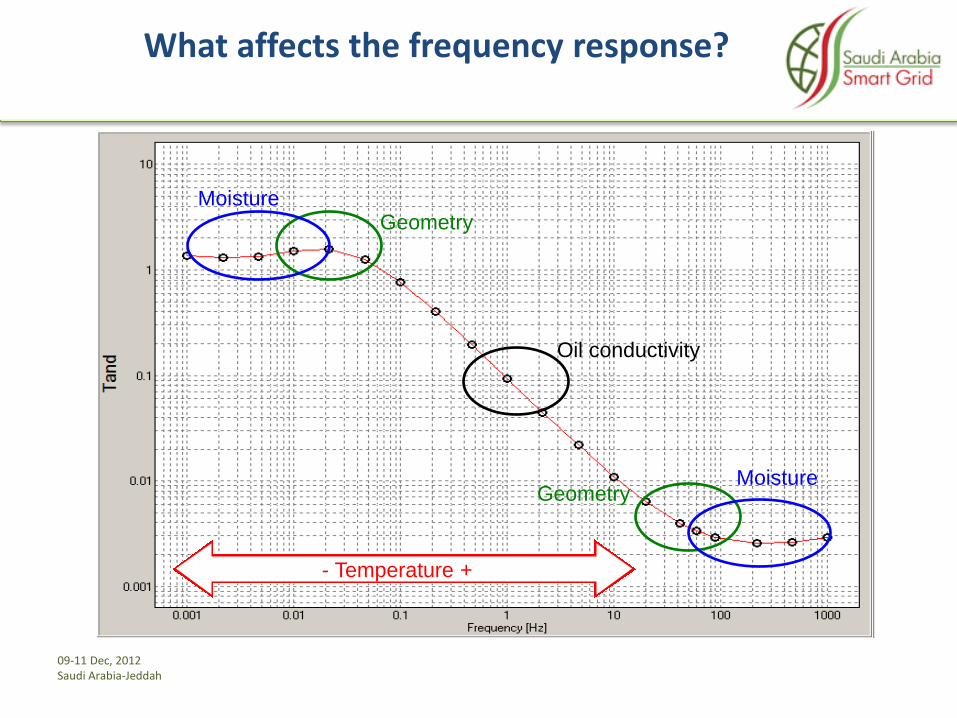
What affects the frequency response?
- Temperature +
Geometry
Oil conductivity
Geometry
Moisture
Moisture

09-11 Dec, 2012 Saudi Arabia-Jeddah
FDS/DFR moisture assessment (AC)
Measure tan delta from 1 kHz to 1 mHz (20 C)
Analyze results in MODS
Confirm insulation temperature (winding/top-oil temperature)
MODS automatically finds best fit between measurement and insulation model by varying parameters that affects the response
Results:
– Moisture in solid insulation
– Conductivity/tan delta of the oil
– Power frequency tan delta/power factor @ measurement temperature
– Accurate power frequency tan delta/power factor @ reference temperature 20 C
– Temperature dependence of power frequency tan delta/power factor
09-11 Dec, 2012 Saudi Arabia-Jeddah
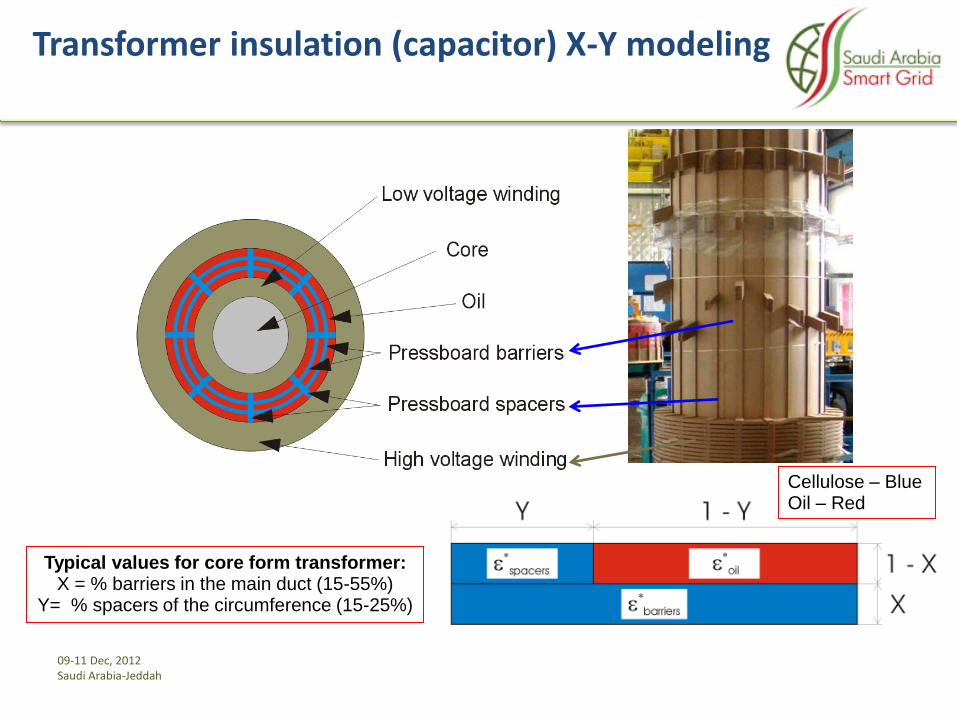
Transformer insulation (capacitor) X-Y modeling
Typical values for core form transformer: X = % barriers in the main duct (15-55%)
Y= % spacers of the circumference (15-25%)
Cellulose – Blue Oil – Red

09-11 Dec, 2012 Saudi Arabia-Jeddah
Measured
frequency
response
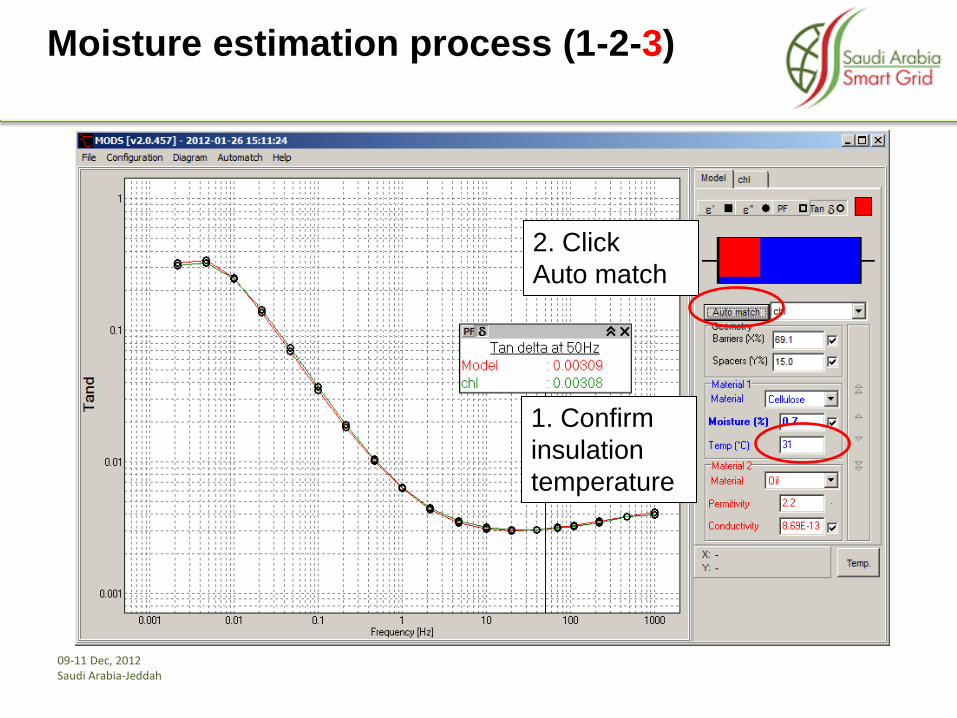
Moisture estimation process (1-2-3)
Select for analysis

09-11 Dec, 2012 Saudi Arabia-Jeddah
Modelled
response
Moisture estimation process (1-2-3)
% Spacers/sticks
Oil
Measurement
% Barriers
X-Y capacitor model
09-11 Dec, 2012 Saudi Arabia-Jeddah
Moisture estimation process (1-2-3)
1. Confirm
insulation
temperature
2. Click
Auto match

09-11 Dec, 2012 Saudi Arabia-Jeddah
Moisture estimation process – Results
Moisture
Oil conductivity
09-11 Dec, 2012 Saudi Arabia-Jeddah
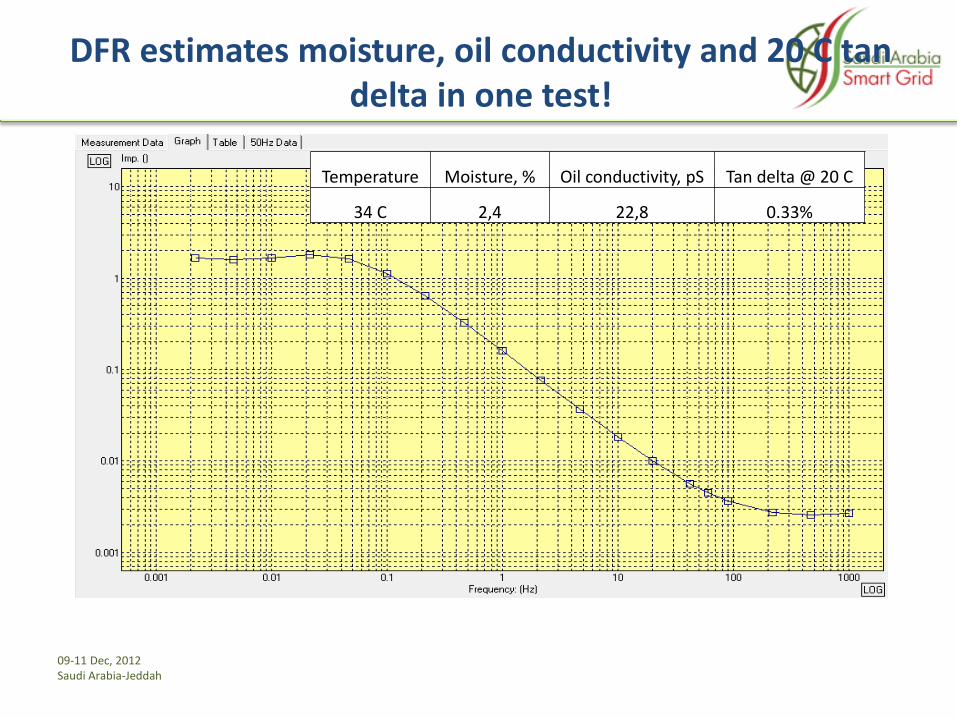
DFR estimates moisture, oil conductivity and 20 C tan delta in one test!
Temperature Moisture, % Oil conductivity, pS Tan delta @ 20 C
34 C 2,4 22,8 0.33%
09-11 Dec, 2012 Saudi Arabia-Jeddah
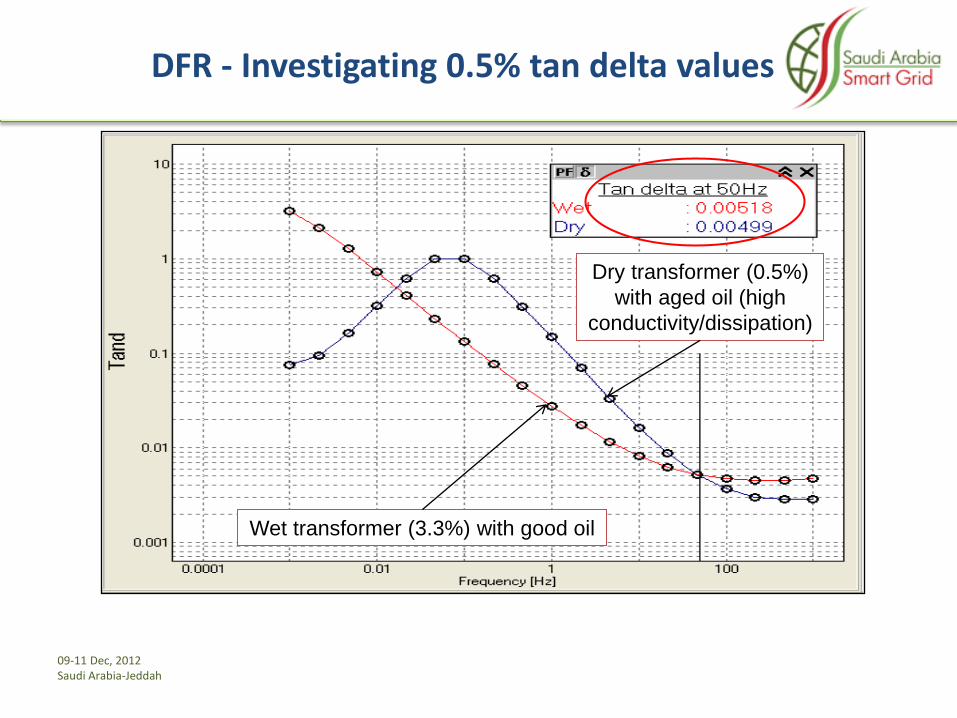
DFR - Investigating 0.5% tan delta values
Wet transformer (3.3%) with good oil
Dry transformer (0.5%)
with aged oil (high
conductivity/dissipation)
09-11 Dec, 2012 Saudi Arabia-Jeddah
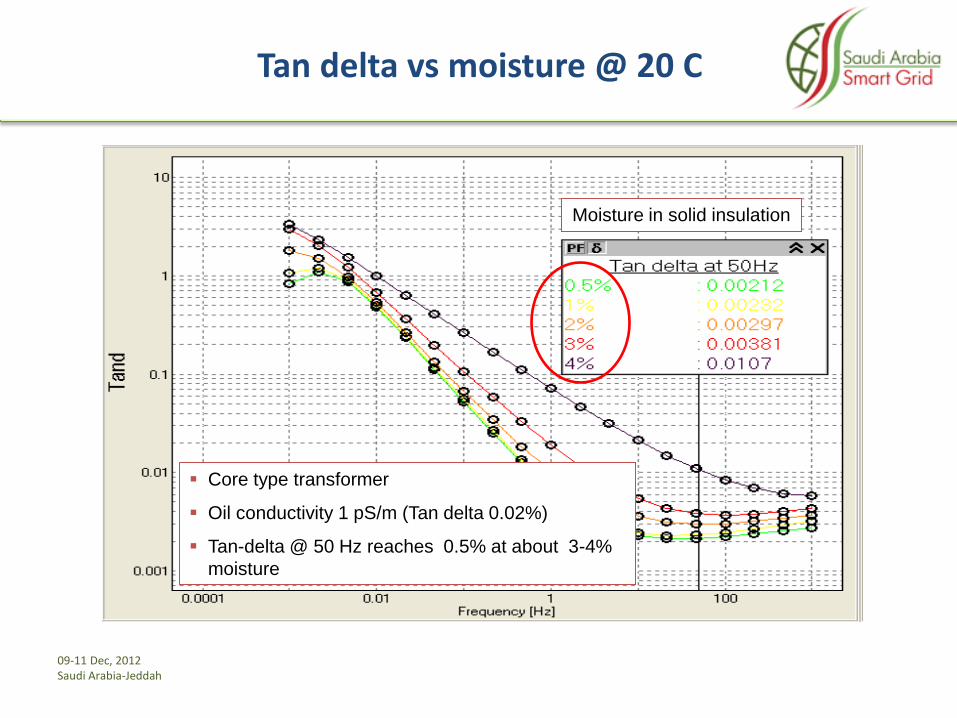
Tan delta vs moisture @ 20 C
Moisture in solid insulation
Core type transformer
Oil conductivity 1 pS/m (Tan delta 0.02%)
Tan-delta @ 50 Hz reaches 0.5% at about 3-4%
moisture

09-11 Dec, 2012 Saudi Arabia-Jeddah
Maintenance based on water in oil analysis…
Six transformers scheduled for oil regeneration and dehydration based on ppm water in oil data
Transformer Type % moisture in insulation (from oil analysis)
1 Core 2.5
2 Core 1.8
3 Core 1.4
4 Core 2.8
5 Shell Data not available
6 Core 3.5
7 Shell 3.3
“ABB Advanced Diagnostic Testing Services
Provide Detailed Results”, 2006
09-11 Dec, 2012 Saudi Arabia-Jeddah
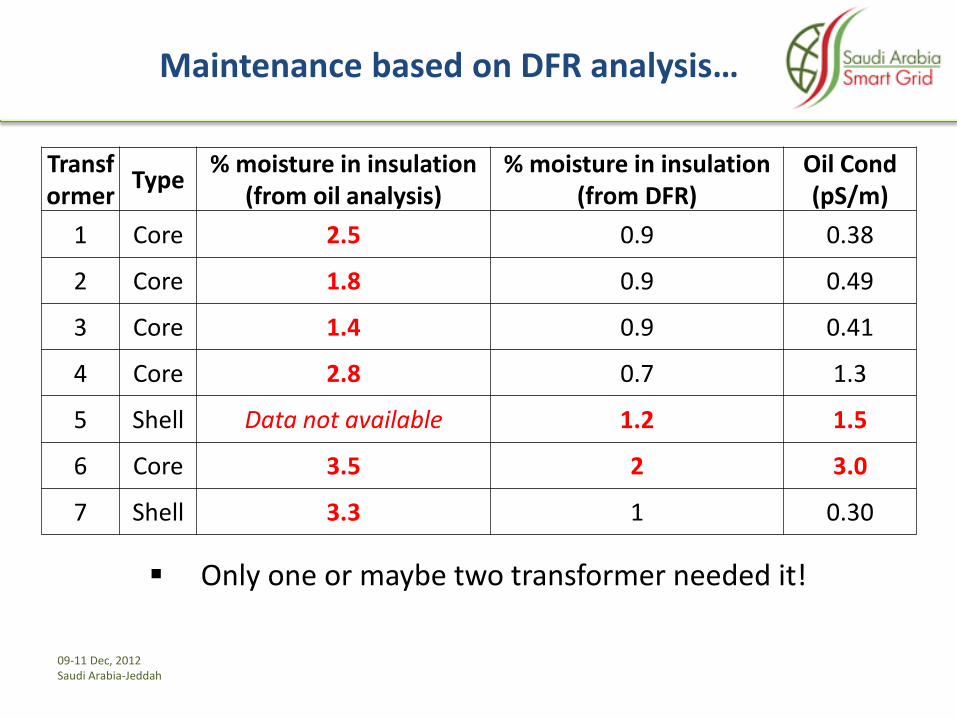
Maintenance based on DFR analysis…
Only one or maybe two transformer needed it!
Transformer
Type % moisture in insulation
(from oil analysis) % moisture in insulation
(from DFR) Oil Cond (pS/m)
1 Core 2.5 0.9 0.38
2 Core 1.8 0.9 0.49
3 Core 1.4 0.9 0.41
4 Core 2.8 0.7 1.3
5 Shell Data not available 1.2 1.5
6 Core 3.5 2 3.0
7 Shell 3.3 1 0.30

09-11 Dec, 2012 Saudi Arabia-Jeddah
The added value of DFR measurements
• Estimate the moisture content of cellulose insulation in power transformers, CTs, bushings etc
• Estimate the dielectric properties of insulating oil
• Estimate temperature dependence and perform individual temperature corrections based on the actual insulation material(-s) and condition
• Understanding capacitance changes and dissipation factor increase in power system components
• Detect contamination in the insulating system
• Monitor e.g. dry-out and impregnation processes
• Just for fun...!
09-11 Dec, 2012 Saudi Arabia-Jeddah
IDAX/VAX Products for DFR Measurements

09-11 Dec, 2012 Saudi Arabia-Jeddah
IDAX 300/350 – Insulation Diagnostic Analyzers
09-11 Dec, 2012 Saudi Arabia-Jeddah
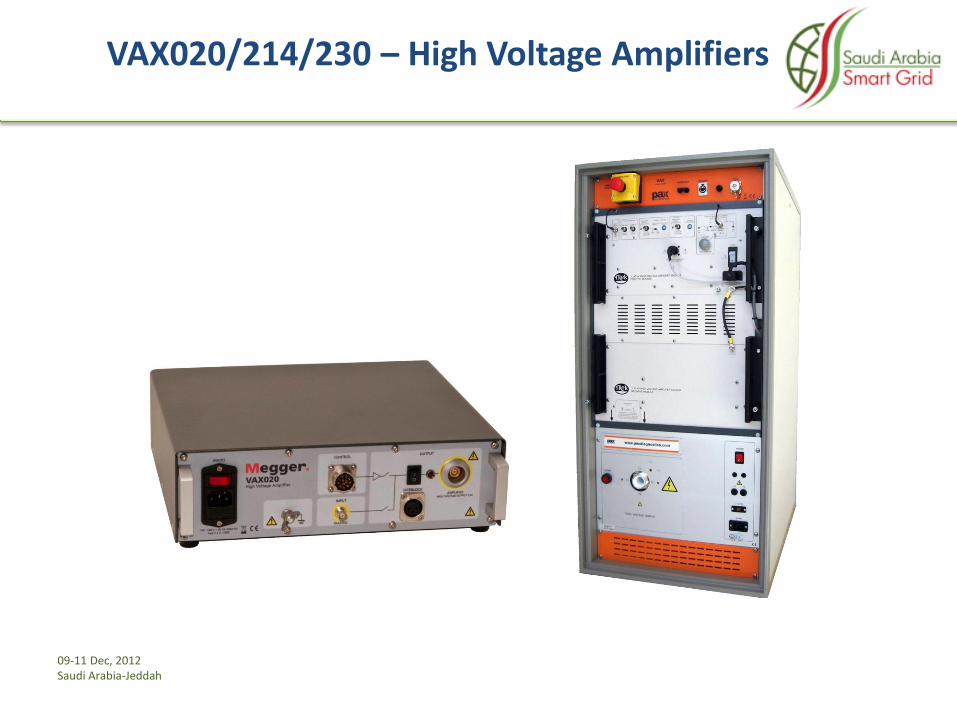
VAX020/214/230 – High Voltage Amplifiers

09-11 Dec, 2012 Saudi Arabia-Jeddah
IDAX/VAX Test System
HW • Test signal: 0 – 200 V (peak), 50 mA
(IDAX300/350)
0 – 2kV (peak), 50 mA (with VAX020)
0 – 10 kV (peak), 40 mA (with VAX214)
0 – 30 kV (peak), 40 mA (with VAX230)
• Frequency: 0.0001 Hz – 10000 Hz
• Capacitance range: 10 pF – 100 µF
• Max AC interference: 1 (IDAX) or 10 (VAX) mA or 1:20 SNR
• Max DC interference: 1000 nA
• 2-ch measurement: Multiplexing (IDAX300/350)
Simultaneous (IDAX300S/350S)
SW
• IDAX SW for measurement control and analysis
• MODS SW for:
– Automatic assessment of moisture in solid insulation and oil conductivity/tan delta
– Temperature dependence analysis by conversion of frequency data to temperature data
– Individual temperature correction (ITC) from measurement temperature to 20° reference
09-11 Dec, 2012 Saudi Arabia-Jeddah
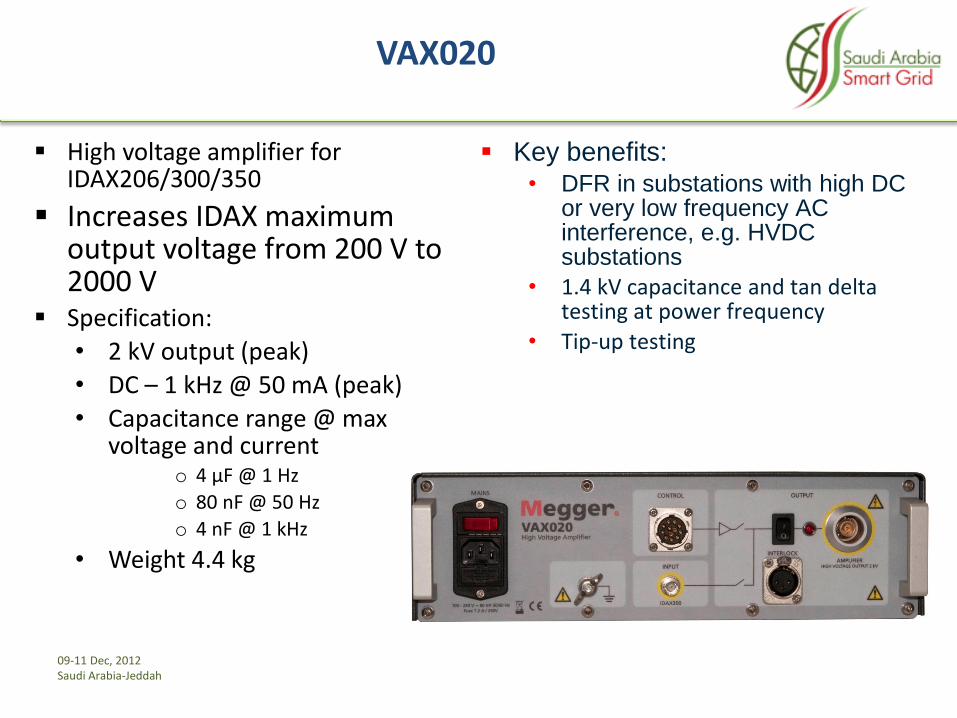
VAX020
High voltage amplifier for IDAX206/300/350
Increases IDAX maximum output voltage from 200 V to 2000 V
Specification:
• 2 kV output (peak)
• DC – 1 kHz @ 50 mA (peak)
• Capacitance range @ max voltage and current
o 4 µF @ 1 Hz
o 80 nF @ 50 Hz
o 4 nF @ 1 kHz
• Weight 4.4 kg
Key benefits: • DFR in substations with high DC
or very low frequency AC interference, e.g. HVDC substations
• 1.4 kV capacitance and tan delta testing at power frequency
• Tip-up testing
09-11 Dec, 2012 Saudi Arabia-Jeddah
Transformer drying
09-11 Dec, 2012 Saudi Arabia-Jeddah
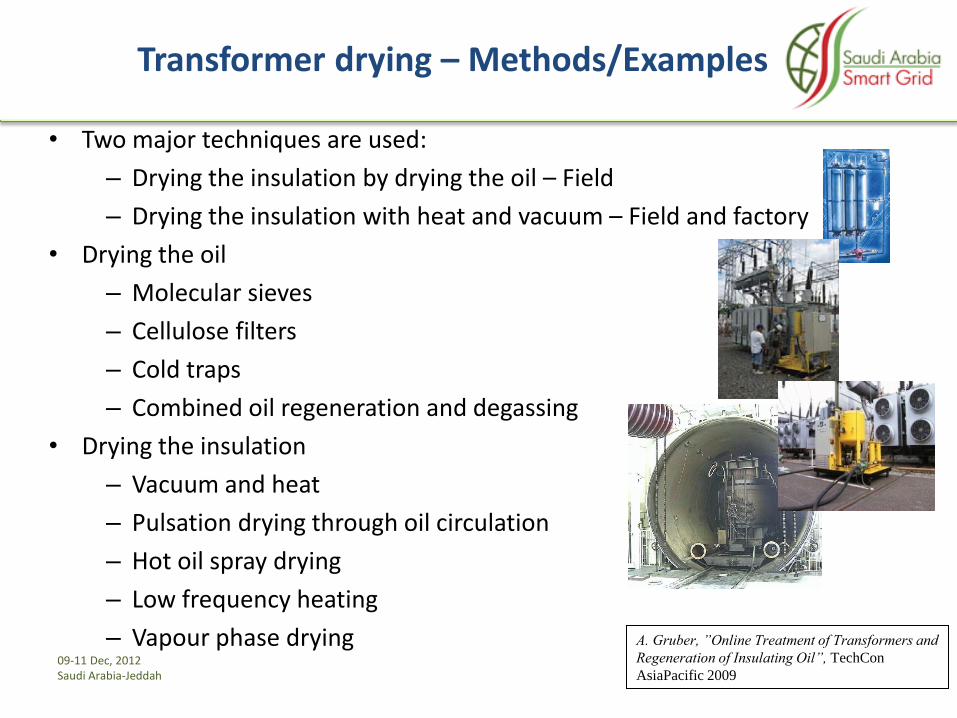
Transformer drying – Methods/Examples
• Two major techniques are used:
– Drying the insulation by drying the oil – Field
– Drying the insulation with heat and vacuum – Field and factory
• Drying the oil
– Molecular sieves
– Cellulose filters
– Cold traps
– Combined oil regeneration and degassing
• Drying the insulation
– Vacuum and heat
– Pulsation drying through oil circulation
– Hot oil spray drying
– Low frequency heating
– Vapour phase drying A. Gruber, ”Online Treatment of Transformers and
Regeneration of Insulating Oil”, TechCon
AsiaPacific 2009

09-11 Dec, 2012 Saudi Arabia-Jeddah
Transformer drying – Comparing methods
P. Koestinger et al, ”Practical Experience With the
Drying of Power Transformers In the Field,
Applying the LFH Technology”, CIGRE A2-205,
2004
< 0.1 liter/day
> 10 liter/day
Drying time to dry a 400MVA transformer with 14 ton insulation from 3% down to 1.5% moisture
09-11 Dec, 2012 Saudi Arabia-Jeddah
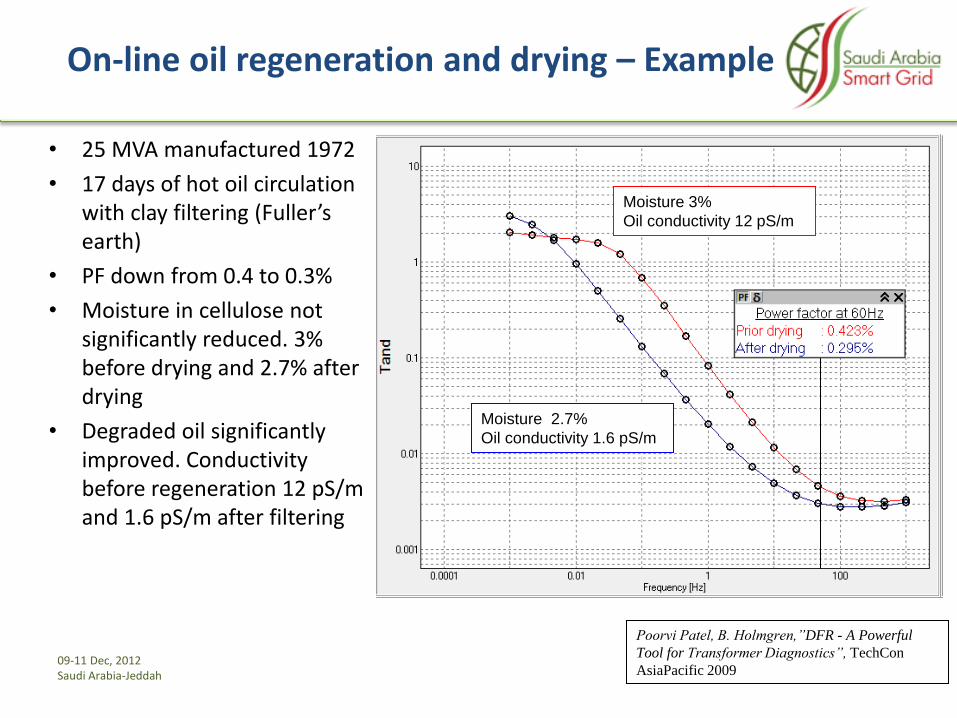
On-line oil regeneration and drying – Example
• 25 MVA manufactured 1972
• 17 days of hot oil circulation with clay filtering (Fuller’s earth)
• PF down from 0.4 to 0.3%
• Moisture in cellulose not significantly reduced. 3% before drying and 2.7% after drying
• Degraded oil significantly improved. Conductivity before regeneration 12 pS/m and 1.6 pS/m after filtering
Moisture 3%
Oil conductivity 12 pS/m
Moisture 2.7%
Oil conductivity 1.6 pS/m
Poorvi Patel, B. Holmgren,”DFR - A Powerful
Tool for Transformer Diagnostics”, TechCon
AsiaPacific 2009
09-11 Dec, 2012 Saudi Arabia-Jeddah
Summary and conclusions
• Moisture is the worst enemy of the transformer!
– Limits the loading capability
– Accelerates the aging process
– Decreases dielectric strength
• The water/moisture in a transformer resides in the solid insulation, not in the oil
• Dielectric Frequency Response Measurement is a great technique for moisture assessment as it measures:
– Moisture content in the cellulose insulation
– Conductivity/dissipation factor of the insulating oil
– Power frequency tan delta/power factor, accurately temperature corrected to 20 C reference temperature
• Drying a power transformer can take from days to years pending drying process and technology
09-11 Dec, 2012 Saudi Arabia-Jeddah
Thank you for your attention!