Embed Size (px)
Citation preview

Moisture adsorption and desorption properties ofcolloidal silicon dioxide and its impact on layer adhesion of abilayer tablet formulation.
Jennifer Wang1, 2, David Trinkle1, George Derbin1, Kyle Martin1, Shasad Sharif 3, PeterTimmins4, and Divyakant Desai1*
1Drug Product Science and Technology, Bristol-Myers Squibb Co., New Brunswick, NJ2Teva Pharmaceuticals, North Wales, PA3Analytical and Bioanalytical Development, Bristol-Myers Squibb Co., New Brunswick, NJ4Drug Product Science and Technology, Bristol-Myers Squibb, Moreton, Merseyside CH46 1QW, UK
Received: February 14, 2014; Accepted: March 15, 2014 Original Article
ABSTRACT
A bilayer tablet formulation approach was used to develop a fixed dose combination tabletformulation of drugs Y & Z. The weight of Layer I containing Drug Y and the weight of Layer IIA or II B containing Drug Z were 250 mg and 1280 mg, respectively. While Layer I wasmanufactured using dry granulation, Layer II A and II B were manufactured using a moistureactivated dry granulation (MADG) process. Layer II A and Layer II B contained 3% w/w colloidalsilicon dioxide with the surface area of 300 m2/g (Aeroperl® 300) and 200 m2/g (Aerosil® 200),respectively, for moisture scavenging, and otherwise common excipients. Both grades of silicondioxide were amorphous. When exposed to an open relative humidity of 40°C/75% for 72 hours,the bilayer tablet consisting of Layers I/Layer II A (containing Aeroperl® 300) showed a clear layerseparation while the tablet consisting of Layers I/Layer II B (containing Aerosil® 200) did not. If theindividual layer is exposed to a similar condition, the projected change in the moisture content forLayer I, Layer II A, and Layer II B, could be 63% w/w, 107% w/w, and 109% w/w, respectively.Thus, the difference in moisture adsorption between Layer I/ Layer II A (containing Aeroperl® 300)than Layer I/Layer II B (containing Aerosil® 200) was similar. The comparison of the moistureadsorption-desorption isotherms for Aeroperl® 300 and Aerosil® 200 suggested that Aeroperl® 300can adsorb relatively large amounts of moisture at any humidity level due to its greater surface areabut it does not retain moisture when the humidity decreases. In contrast, Aerosil 200 adsorbrelatively smaller amounts of moisture but it retains moisture due to its larger pore sizes. It ishypothesized that the moisture not retained by Aeroperl® 300 could be available for interaction withother Layer I excipients, such as, microcrystalline cellulose and crospovidone. Such interaction cangenerate significant shear stress at the layer interface triggering the delamination.
KEY WORDS: Bilayer tablet, layer adhesion, moisture adsorption, swelling, layer separation, silicon dioxide
INTRODUCTION
The technology for formulating bilayer ormultilayer tablets is considered flexible for fixed
* Corresponding author: D. S. Desai, Bristol-Myers Squibb Co., P.O.Box 191, New Brunswick, NJ 08903, USA, Tel: +1 732 227 6458,Fax: +1 732 227 3986, E-mail: [email protected]
This Journal is © IPEC-Americas Inc March 2014 J. Excipients and Food Chem. 5 (1) 2014 - 21
Original Article
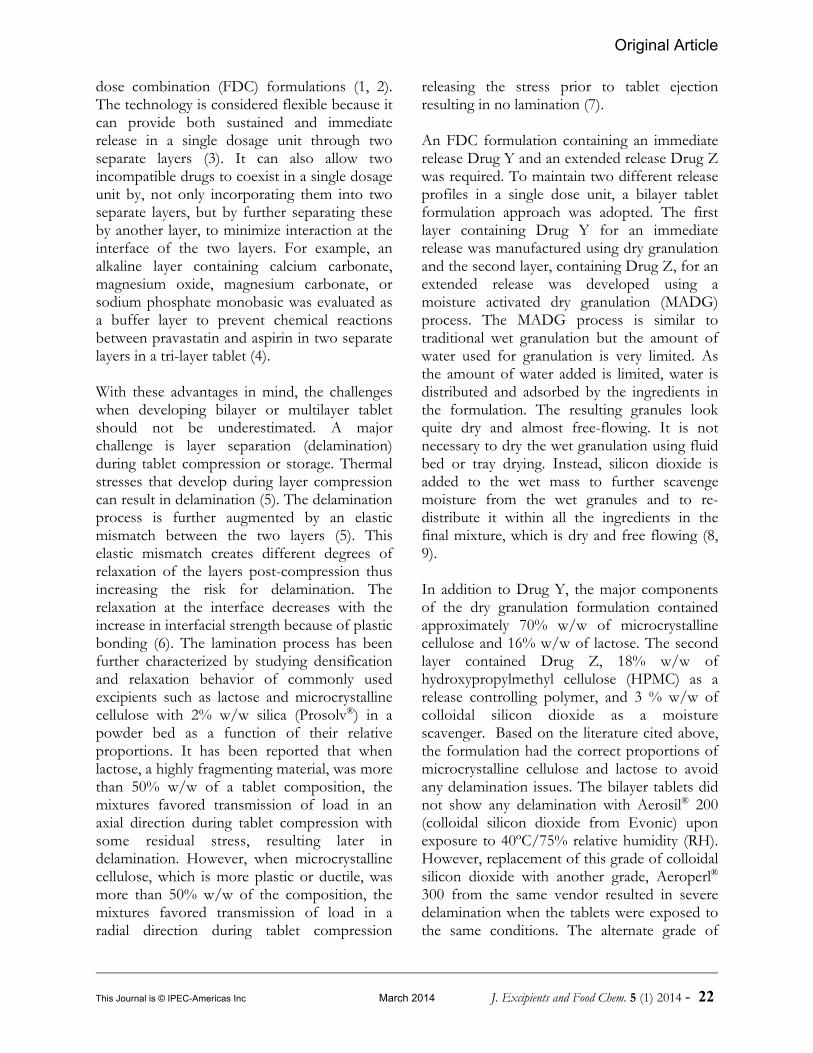
dose combination (FDC) formulations (1, 2). The technology is considered flexible because itcan provide both sustained and immediaterelease in a single dosage unit through twoseparate layers (3). It can also allow twoincompatible drugs to coexist in a single dosageunit by, not only incorporating them into twoseparate layers, but by further separating theseby another layer, to minimize interaction at theinterface of the two layers. For example, analkaline layer containing calcium carbonate,magnesium oxide, magnesium carbonate, orsodium phosphate monobasic was evaluated asa buffer layer to prevent chemical reactionsbetween pravastatin and aspirin in two separatelayers in a tri-layer tablet (4).
With these advantages in mind, the challengeswhen developing bilayer or multilayer tabletshould not be underestimated. A majorchallenge is layer separation (delamination)during tablet compression or storage. Thermalstresses that develop during layer compressioncan result in delamination (5). The delaminationprocess is further augmented by an elasticmismatch between the two layers (5). Thiselastic mismatch creates different degrees ofrelaxation of the layers post-compression thusincreasing the risk for delamination. Therelaxation at the interface decreases with theincrease in interfacial strength because of plasticbonding (6). The lamination process has beenfurther characterized by studying densificationand relaxation behavior of commonly usedexcipients such as lactose and microcrystallinecellulose with 2% w/w silica (Prosolv®) in apowder bed as a function of their relativeproportions. It has been reported that whenlactose, a highly fragmenting material, was morethan 50% w/w of a tablet composition, themixtures favored transmission of load in anaxial direction during tablet compression withsome residual stress, resulting later indelamination. However, when microcrystallinecellulose, which is more plastic or ductile, wasmore than 50% w/w of the composition, themixtures favored transmission of load in aradial direction during tablet compression
releasing the stress prior to tablet ejectionresulting in no lamination (7).
An FDC formulation containing an immediaterelease Drug Y and an extended release Drug Zwas required. To maintain two different releaseprofiles in a single dose unit, a bilayer tabletformulation approach was adopted. The firstlayer containing Drug Y for an immediaterelease was manufactured using dry granulationand the second layer, containing Drug Z, for anextended release was developed using amoisture activated dry granulation (MADG)process. The MADG process is similar totraditional wet granulation but the amount ofwater used for granulation is very limited. Asthe amount of water added is limited, water isdistributed and adsorbed by the ingredients inthe formulation. The resulting granules lookquite dry and almost free-flowing. It is notnecessary to dry the wet granulation using fluidbed or tray drying. Instead, silicon dioxide isadded to the wet mass to further scavengemoisture from the wet granules and to re-distribute it within all the ingredients in thefinal mixture, which is dry and free flowing (8,9). In addition to Drug Y, the major componentsof the dry granulation formulation containedapproximately 70% w/w of microcrystallinecellulose and 16% w/w of lactose. The secondlayer contained Drug Z, 18% w/w ofhydroxypropylmethyl cellulose (HPMC) as arelease controlling polymer, and 3 % w/w ofcolloidal silicon dioxide as a moisturescavenger. Based on the literature cited above,the formulation had the correct proportions ofmicrocrystalline cellulose and lactose to avoidany delamination issues. The bilayer tablets didnot show any delamination with Aerosil® 200(colloidal silicon dioxide from Evonic) uponexposure to 40ºC/75% relative humidity (RH).However, replacement of this grade of colloidalsilicon dioxide with another grade, Aeroperl®
300 from the same vendor resulted in severedelamination when the tablets were exposed tothe same conditions. The alternate grade of
This Journal is © IPEC-Americas Inc March 2014 J. Excipients and Food Chem. 5 (1) 2014 - 22

Original Article
silicon dioxide was used in order to provideflexibility in the supply chain. The maindifference in the two grades of colloidal silicondioxide was surface area. Aeroperl® andAerosil® have a surface area of 300 and200 m2/g, respectively. Despite the differencesin their surface area, both colloidal silicondioxides were used at a 3% w/w level in thesecond layer and their total amount in the tabletwas about 2.5 % w/w. Based on their smallamount in the tablet formulation, delaminationdue to interchangeability of colloidal silicondioxide grade was unexpected. In order tounderstand the observed delaminationphenomenon, a systemic study was undertakenand the results reported here.
MATERIALS AND METHODS
Materials
Drug Y and Z were provided by Bristol-MyersSquibb Company, Microcrystalline cellulose(NF, Avicel® PH102) was obtained from FMCBioPolymer, Philadelphia, Pennsylvania,anhydrous lactose (NF) from Sheffield PharmaIngredients, New London, Connecticut,crospovidone (NF) and Hydroxypropylmethylcellulose (Hypromellose® K100M) fromBASF Corporation, Florham Park, New Jersey,silicone dioxide (NF) Aeroperl® 300 andAerosil® 200 from Evonik DegussaCorporation, Piscataway, New Jersey, andmagnesium stearate (NF) from MallinckrodtInc, St. Louis, Missouri.
Manufacture of bilayer tablets
Two types of bilayer tablets, one consisting ofDrug Y in Layer I and Drug Z in Layer IIA andthe other consisting of Drug Y in Layer I andDrug Z Layer IIB, were manufactured. Thecompositions of the formulations of all threelayers are listed in Table 1. The followingprocess was used to manufacture the bi-layertablets containing Layers I/IIA or I/IIB. LayerI, an immediate release formulation with aweight of 250 mg, comprised of Drug Y 4.1%w/w, microcrystal line cellulose 73.4% w/w,
Table 1 Bilayer tablet formulation
INGREDIENT % w/wFUNCTION OF THE
INGREDIENT
Layer I -250 mg weight
Drug Y 4.1 Active ingredient
Microcrystalline cellulose 73.4 Filler/diluent
Lactose anhydrous 16.0 Filler/diluent
Crospovidone 4.0 Disintegrant
Silicon dioxide, hydrous 1.5 Glidant
Magnesium stearate 1.0 Lubricant
Total 100.0
Layer IIA -1280 mg weight
Drug Z 78.2*
Active ingredient
Hydroxypropyl methylcellulose 18.0Release controllingpolymer
Aeroperl 300 (colloidal silicon dioxide-anhydrous)
3.0 Moisture scavenger
Purified water 0.8 or 2.5 Binder
Total 100.0
OR Layer IIB -1280 mg weight
Drug Z 78.2*
Active ingredient
Hydroxypropyl methylcellulose 18.0Release controllingpolymer
Aerosil 200 (colloidal silicon dioxide-anhydrous)
3.0 Moisture scavenger
Purified water 0.8 or 2.5 binder
Total 100.0
*The amount of drug was proportionally reduced with the increase in
water amount
lactose anhydrous 16.0% w/w, crospovidone4.0% w/w, silicone dioxide (hydrous) 1.5%w/w, and magnesium stearate 1.0% w/w. LayerIIA, an extended release formulation with aweight of 1280 mg, was comprised of Drug Z78.2% w/w, hydroxypropyl methylcellulose(Hypromellose® K100M) 18.0% w/w, colloidalsilicon dioxide, anhydrous lactose (Aeroperl®
300) 3.0% w/w, and water 0.8% or 2.5% w/w. The formula of the Layer IIB was the same asthat of Layer IIA except that Aerosil® 200,another grade of anhydrous colloidal silicondioxide, was used to replace Aeroperl® 300 atthe same amount. The final blend of Layer Iwas made with a dry granulation process in aroller compactor (Alexanderwerk WP 120). Thefinal blend of Layer IIA or IIB was made usingthe MADG process in a high shear granulator(Diosna), followed by drying, milling, andblending (Figure 1). The bilayer tabletsconsisting of Layers I/IIA or Layers I/IIB werecompressed into tablets using a bilayer rotarytablet press (Piccola Bilayer Tablet Press, SMI,
This Journal is © IPEC-Americas Inc March 2014 J. Excipients and Food Chem. 5 (1) 2014 - 23

Original Article
Figure 1 Manufacturing process flow for Layer II using amoisture activated dry granulation process (MADG)
serial number -044) equipped with an ovalshaped tooling, 0.748 in x 0.400 in. The LayerII (A or B) was compressed first using a 3 kNtamping force. Layer I was compressed secondwith the compression force in the range of 40to 50 kN to obtain a tablet hardness of about604 N. The tablet friability was less than 0.5%for all the formulations. Two tablet batcheseach with Aeroperl® 300 and Aerosil® 200 inLayer II were manufactured. Efforts were madeto optimize the water level for Layer IIA andLayer IIB. It was also noted that for Layer IIAcontaining Aeroperl® 300, no delamination wasobserved after tablet compression and storageat room temperature when 0.8% w/w waterhad been used in the batch. However, in aseparate batch made using 2.5% w/w water, thetablet delaminated after compression, evenwhen storing at room temperature. On theother hand, for Layer IIB containing Aerosil®
200, the tablets did not delaminate aftercompression when storing at room temperatureirrespective of whether 0.8% w/w or 2.5%w/w water used for the manufacture.
Moisture adsorption/desorption measurement
The moisture adsorption/desorption versusrelative humidity curves at room temperature ofeach individual ingredient used for Layers I,IIA, and IIB were determined using anautomated VTI Moisture System. Vaporthermal isotherm (VTI) curves were generatedusing an IGASorp dynamic vapor sorptionanalyzer (Hiden Isochema, Warrington, UK).Samples of approximately 45 mg were loadedonto the IGASorp microbalance with a 5 gcapacity, a resolution of 0.1 μg and stability of± 1 μg. Sample temperature was maintained at25EC with stability of 0.3EC/min. Relativehumidity was lowered to below 0.5% and thenramped up in relative humidity steps rangingfrom 10% to 90%. Sorption data was collectedat 10% RH intervals. Equilibrium target was99.5% with a minimum wait time of 30 minutesand a maximum of 180 minutes. Air flow ratewas 250 ml/min. Desorption data was collectedunder the same conditions with decreasing %RH steps. Since results were interpreted asbeing dependent on relative (rather thanabsolute) values of water absorption/desorption, the experiments were preformedonly once if comparable results had beenpublished literature.
Expansion and delamination of the bilayertablets
Since the bilayer tablets, at the addition of 0.8%w/w water, did not delaminate aftercompression when stored at room temperature,whether they included Aeroperl® 300 in LayerIIA or Aerosil® 200 in Layer IIB, they wereselected for further evaluation at a stressedcondition of 40ºC/75% RH. They weresubjected to 40°C at relative humidity of 75%environment for 72 hours in an open Petri dish.The tablet dimensions, including length, width,and height, before and after the exposure, weremeasured. The physical integrity of theindividual tablets was observed as well.
This Journal is © IPEC-Americas Inc March 2014 J. Excipients and Food Chem. 5 (1) 2014 - 24

Original Article
Manufacture of the physical mixtures ofindividual layers
The physical mixtures of the Layers I, IIA, andIIB of the same compositions as described inthe section above “manufacture of the bi-layertablets” were made by mixing all ingredients ina diffusion mixer (Turbula) at 45 RPM for 20minutes. No water was added to the physicalmixture of Layer I. The water was sprayed infine mist onto the mixture of Layer II (asshown in Figure 1) after dry mixing, followedby mixing for three additional minutes.
Compaction behavior characterization of eachlayer
A uniaxial compaction simulator (Stylcammodel 200R, Medel’Pharm, France,) equippedwith an instrumented upper punch, lowerpunch, and die was used. The axial upper andlower compression forces and displacements, aswell as radial die wall pressure, were measuredduring compaction. A set of flat-faced tablettooling with the diameter of 11.28 mm wasused. On the suggestion of previous reports,the die wall was lubricated with magnesiumstearate powder between each compaction inorder to minimize the impact of die wallfriction on powder property measurement (10).
Mercury Intrusion Porosimetry
Pore-volume distributions of Aerosil® 200 andAeroperl® 300 were determined by mercuryintrusion porosimetry using an AutoPore IV9500 (Serial No. 1106, Micromeritics, Norcross,Georgia). A powder penetrometer with 5 ccbulb and 1.131 cc stem (s/n 10-0539) was usedfor testing a 53 mg sample of Aerosil® 200. Thepenetrometer assembly with sample wasevacuated down to a pressure of 50 µm Hgbefore mercury was introduced at low pressure.Incremental pore volume was determined at 50different pressure steps ranging from 0.5 psi to33,000 psi corresponding to pore diametersbetween 352 µm to 0.005 µm. Equilibrium timewas 10 seconds at each pressure. The same test
method and penetrometer size were used fortesting a 154 mg sample of Aeroperl® 300.
Scanning Electron Microscopy (SEM)
Scanning electron microscopy, SEM, imageswere collected of the samples mounted onaluminum stubs to which adhesive carbonconductive tabs had been applied. They weresputter coated using a Cressington 208 HRAuto Sputter Coater equipped with a platinumtarget (Ted Pella, Inc., Redding, California). Secondary electron images were acquired at 2kV using a field emission FEI XL30 ESEM(FEI Company, Hillsboro, Oregon, 97124USA).
Powder X-ray Diffraction (PXRD)
Powder X-ray diffraction (PXRD) patternswere generated using an Empyrean(PANalytical, Ea Almelo, Netherlands) X-raypowder diffractometer with Cu Kα1 radiation:λ = 1.54059 Å. The diffractometer was equip-ped with a rotating-anode generator, which wasset at a power level of 40 kV and 40 mA, and aPIXcel 1D real time multiple strip (RTMS)detector. Incident optics consisted of a primaryGöbel mirror, primary soller slit of 2.29°, anddivergence slit of 10 mm. Diffracted opticsconsisted of Nickel Beta-filter, secondary sollerslit of 2.29°. Data were collected in reflectancegeometry over a 2θ range of 2-32°, with a stepsize of 0.0394°, and counting time 7.8 seconds/step in continuous mode.
RESULTS AND DISCUSSION
As shown in Table 1, the only difference inLayer IIA and Layer IIB was the grade ofcolloidal silicon dioxide. Layer IIA containedAeroperl® 300 and Layer IIB containedAerosil® 200. As described under themanufacture of the bilayer tablets, nodelamination was observed after tabletcompression and storage at room temperaturewhen 0.8% w/w water had been added.However, in a separate batch with Aeroperl®
300, when 2.5% w/w water was added, the
This Journal is © IPEC-Americas Inc March 2014 J. Excipients and Food Chem. 5 (1) 2014 - 25

Original Article
Figure 2 Water sorption isotherms, Aerosil® 200 versusAeroperl® 300.
tablet delaminated after compression evenwhen storing at room temperature. On theother hand, the tablets in Layer IIB containingAerosil® 200, did not delaminate after theaddition of 2.5% w/w water when stored atroom temperature. Therefore, the tabletscontaining 0.8% w/w water were evaluated at40ºC/75% RH.
The bilayer tablets containing Aeroperl® 300made with 0.8% water showed clear layerseparation after 72 hours of exposure at40ºC/75% RH, but the tablets with Aerosil®
200 did not, under the same conditions.Although both Aeroperl® 300 and Aerosil® 200are anhydrous colloidal silicon dioxide andconstituted just 3% w/w of the Layer II
formulation, they influenced the physicalintegrity of the tablet when exposed to highhumidity. Exposure of a bilayer tabletformulation to high humidity followed by visualobservations of possible layer delamination is acommonly used method to determine whethera bilayer tablet will maintain its physicalintegrity throughout the product shelf-life.
Since the layer separation was triggered bymoisture, the investigation focused on thebehavior of Aeroperl® 300 and Aerosil® 200 onexposure to high humidity. Moisture adsorptionisotherms were obtained for Aeroperl® 300 andAerosil® 200 using VTI Moisture System(Figure 2). Both excipients picked up moisturewhen exposed to higher humidity as shown bythe adsorption isotherm curves. However,when the humidity was decreased during themoisture desorption stage Aeroperl® 300retained little moisture, while Aerosil® 200retained some moisture. Given the greatersurface area of Aeroperl® 300, it as expected,picked up more moisture than Aerosil® 200(20% vs. 9.5%) (Figure 2). It was also notedthat Aerosil® 200 showed moisture-desorptionhysteresis, indicating that Aerosil® 200 had adifferent desorption behavior than Aeroperl®
300. The moisture adsorption-desorptionisotherm behaviors of the APIs and otherexcipients in the formulations of the threelayers were also experimentally measured in thesame manner as for Aeroperl® 300 and Aerosil®
200. As summarized in Table 2, experimentallyobtained moisture adsorption isotherm curvesfor all individual ingredients were retrofittedinto polynomial equations.
Taking Aeroperl® 300 as an example, thepercent of weight change by moistureadsorption, versus the relative humidity, x, wascurve fitted and expressed using theexponential function shown in Equation 1:
Eq. 1Y x x x
x x 311.6 576.5 403.5
123.6 + 23.0 0.08
5 4 3
2
= − +
− −
This Journal is © IPEC-Americas Inc March 2014 J. Excipients and Food Chem. 5 (1) 2014 - 26
Original Article
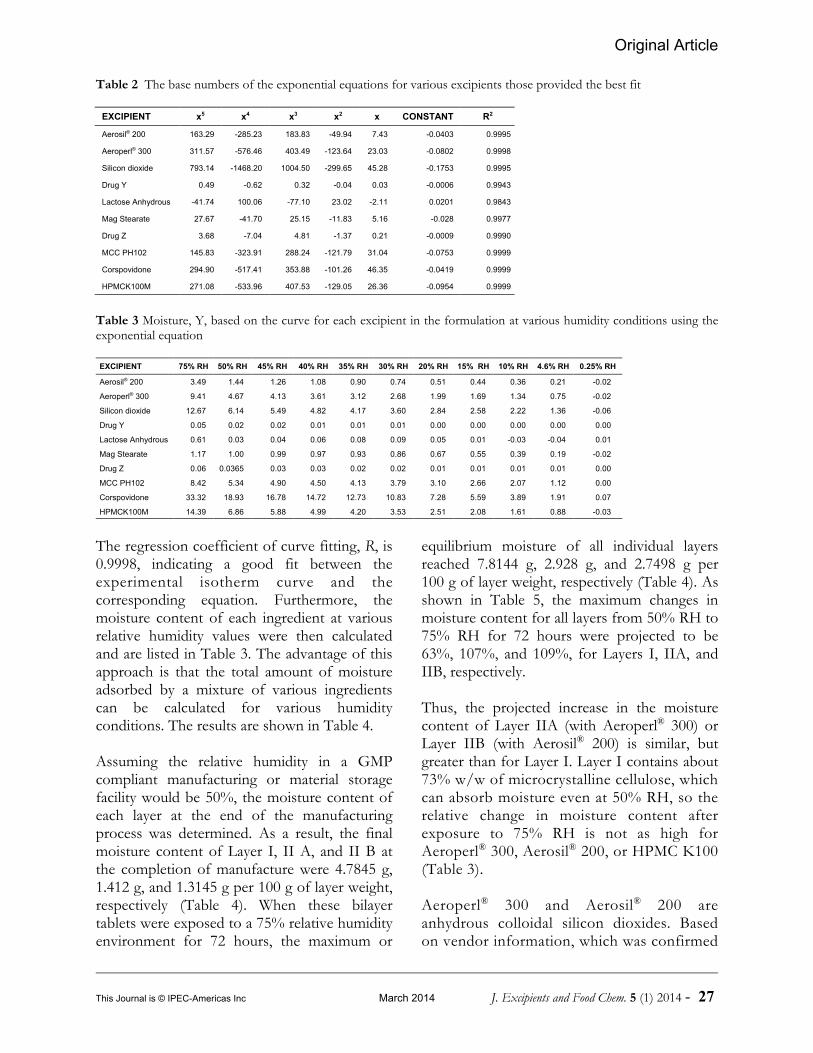
Table 2 The base numbers of the exponential equations for various excipients those provided the best fit
EXCIPIENT x5 x4 x3 x2 x CONSTANT R2
Aerosil® 200 163.29 -285.23 183.83 -49.94 7.43 -0.0403 0.9995
Aeroperl® 300 311.57 -576.46 403.49 -123.64 23.03 -0.0802 0.9998
Silicon dioxide 793.14 -1468.20 1004.50 -299.65 45.28 -0.1753 0.9995
Drug Y 0.49 -0.62 0.32 -0.04 0.03 -0.0006 0.9943
Lactose Anhydrous -41.74 100.06 -77.10 23.02 -2.11 0.0201 0.9843
Mag Stearate 27.67 -41.70 25.15 -11.83 5.16 -0.028 0.9977
Drug Z 3.68 -7.04 4.81 -1.37 0.21 -0.0009 0.9990
MCC PH102 145.83 -323.91 288.24 -121.79 31.04 -0.0753 0.9999
Corspovidone 294.90 -517.41 353.88 -101.26 46.35 -0.0419 0.9999
HPMCK100M 271.08 -533.96 407.53 -129.05 26.36 -0.0954 0.9999
Table 3 Moisture, Y, based on the curve for each excipient in the formulation at various humidity conditions using theexponential equation
EXCIPIENT 75% RH 50% RH 45% RH 40% RH 35% RH 30% RH 20% RH 15% RH 10% RH 4.6% RH 0.25% RH
Aerosil® 200 3.49 1.44 1.26 1.08 0.90 0.74 0.51 0.44 0.36 0.21 -0.02
Aeroperl® 300 9.41 4.67 4.13 3.61 3.12 2.68 1.99 1.69 1.34 0.75 -0.02
Silicon dioxide 12.67 6.14 5.49 4.82 4.17 3.60 2.84 2.58 2.22 1.36 -0.06
Drug Y 0.05 0.02 0.02 0.01 0.01 0.01 0.00 0.00 0.00 0.00 0.00
Lactose Anhydrous 0.61 0.03 0.04 0.06 0.08 0.09 0.05 0.01 -0.03 -0.04 0.01
Mag Stearate 1.17 1.00 0.99 0.97 0.93 0.86 0.67 0.55 0.39 0.19 -0.02
Drug Z 0.06 0.0365 0.03 0.03 0.02 0.02 0.01 0.01 0.01 0.01 0.00
MCC PH102 8.42 5.34 4.90 4.50 4.13 3.79 3.10 2.66 2.07 1.12 0.00
Corspovidone 33.32 18.93 16.78 14.72 12.73 10.83 7.28 5.59 3.89 1.91 0.07
HPMCK100M 14.39 6.86 5.88 4.99 4.20 3.53 2.51 2.08 1.61 0.88 -0.03
The regression coefficient of curve fitting, R, is0.9998, indicating a good fit between theexperimental isotherm curve and thecorresponding equation. Furthermore, themoisture content of each ingredient at variousrelative humidity values were then calculatedand are listed in Table 3. The advantage of thisapproach is that the total amount of moistureadsorbed by a mixture of various ingredientscan be calculated for various humidityconditions. The results are shown in Table 4.
Assuming the relative humidity in a GMPcompliant manufacturing or material storagefacility would be 50%, the moisture content ofeach layer at the end of the manufacturingprocess was determined. As a result, the finalmoisture content of Layer I, II A, and II B atthe completion of manufacture were 4.7845 g,1.412 g, and 1.3145 g per 100 g of layer weight,respectively (Table 4). When these bilayertablets were exposed to a 75% relative humidityenvironment for 72 hours, the maximum or
equilibrium moisture of all individual layersreached 7.8144 g, 2.928 g, and 2.7498 g per100 g of layer weight, respectively (Table 4). Asshown in Table 5, the maximum changes inmoisture content for all layers from 50% RH to75% RH for 72 hours were projected to be63%, 107%, and 109%, for Layers I, IIA, andIIB, respectively.
Thus, the projected increase in the moisturecontent of Layer IIA (with Aeroperl® 300) orLayer IIB (with Aerosil® 200) is similar, butgreater than for Layer I. Layer I contains about73% w/w of microcrystalline cellulose, whichcan absorb moisture even at 50% RH, so therelative change in moisture content afterexposure to 75% RH is not as high forAeroperl® 300, Aerosil® 200, or HPMC K100(Table 3).
Aeroperl® 300 and Aerosil® 200 areanhydrous colloidal silicon dioxides. Basedon vendor information, which was confirmed
This Journal is © IPEC-Americas Inc March 2014 J. Excipients and Food Chem. 5 (1) 2014 - 27

Original Article
Figure 3 Powder X-ray patterns for Aeroperl® 300 andAerosil® 200
Table 4 Calculation of the amount of moisture adsorbed by Layer IIA (with Aeroperl® 300) and Layer IIB (with Aerosil®
200) under various humidity conditions.
LAYER II A 75% RH 50% RH 35% RH
Drug Z 78.2 x 0.06 78.2 x 0.0365 78.2x0.02
HPMC 18.0 x 14.39 18.0 x 6.86 18.0 x 4.20
Aeroperl® 300 3.0 x 9.41 3.0 x 4.67 3.0 x 3.12
0.8% water added in MADG 0.8 0.8 0.8
Total moisture adsorb(g) 292.74/100= 2.928 141.2/100 = 1.41287.34/100 =0.8734
LAYER II B 75% RH 50% RH 35% RH
Drug Z 78.2 x 0.06 78.2 x 0.0365 78.2 x 0.02
HPMC 18.0 x 14.39 18.0 x 6.86 18.0 x 4.20
Aerosil® 200 3.0 x 3.49 3.0 x1.44 3.0 x 0.90
0.8% water added in MADG 0.8 0.8 0.8
Total moisture adsorbed 274.98/100= 2.7498 g 131.45/100= 1.3145 g 80.66/100 =0.8066 g
Table 5 Projected moisture adsorption for each layerwhen exposed to 40ºC/75% RH for 72 hours
LAYER
MOISTURE CONTENTAT THE END OFMANUFACTURE
(ASSUMES 50% RH)
MOISTURE CONTENTAT THE AND OFMANUFACTURE
(ASSUMES 75% RH)
CHANGE INMOISTURECONTENT
(%)
Layer I 4.7845 g 7.8144 g 63
Layer II A(with Aeroperl300)
1.412 g 2.928 g 107
Layer II B(with Aerosil200)
1.3145 g 2.7498 109
experimentally, the surface area for Aeroperl®
300 and Aerosil® 200 are 300 m2/g and 200m2/g, respectively. The larger surface area ofAeroperl® 300 should allow more moistureadsorption as is shown in Figure 2. However,the difference in surface area alone cannotexplain the difference in moisture retentioncapacity of these two grades. Powder X-raypatterns for Aeroperl® 300 and Aerosil® 200 areshown in Figure 3. It can be seen that thePXRD pattern for both excipients reveal nopeaks indicating an amorphous state for bothgrades. If both grades are amorphous then theywould be expected to behave similarly whenexposed to high humidity. Since they were notbehaving similarly, they were characterizedfurther. As shown in Figure 4, the morphology of thedifferent silicon dioxide excipients issubstantially different as determined by SEM
and qualitative interpretation of images at amagnification of 250 x and 2000 x. Aeroperl®
300 appears to have a bimodal particle sizedistribution (PSD) of spherical particles, whichis consistent with the literature on PSD of thisgranulated colloidal silicon dioxide. On theother hand, Aerosil® 200 has irregularly shapedparticles of different sizes with irregular, porousor sponge-like surfaces. Both grades werecompared at 10,000 x using SEM, shown inFigure 5. Aerosil® 200 is viewed as a muchmore complex material composed of irregular,branched structures. At the highermagnification, Aeroperl® 300 surface texture isshown. The image shows aggregates/
This Journal is © IPEC-Americas Inc March 2014 J. Excipients and Food Chem. 5 (1) 2014 - 28

Original Article
Figure 6 Pore size and pore volume of Aeroperl® 300and Aerosil® 200 by mercury porosimetry (MIP)
Figure 5 Comparison of Aeroperl® 300 (top) and Aerosil®
200 by SEM at x1000 magnification
Figure 4 Comparison of Aeroperl® 300 (left) and Aerosil®
200 by SEM at x250 and x2000 magnification
agglomerates of the colloidal silicon dioxide
that construct the spherical particle.
To elucidate structural differences, pore sizesand pore volume distributions for Aeroperl®
300 and Aerosil® 200 were studied usingmercury intrusion porosimetry (MIP). Figure 6shows the total cumulative intrusion volume forAerosil® 200 as two and a half times greaterthan for Aeroperl® 300. A summary of keymaterial properties evaluated during thecharacterization of Aeroperl®-300 and Aerosil®-200 has been provided in Table 6. As shown inthe table, the key parameters are total intrusionvolume, average pore diameter, porosity andbulk density. The porosity as well as porediameter of Aeroperl® 300 and Aerosil® 200 issubstantially different. The data shows thatboth materials have a mesopore network. This
This Journal is © IPEC-Americas Inc March 2014 J. Excipients and Food Chem. 5 (1) 2014 - 29

Original Article
implies an inter-particle network of pores.
Table 6 Comparison of key properties of Aerosil® 200and Aeroperl® 300
INTRUSION DATASUMMARY
UNITAEROSIL®
200AEROPERL®
300
Total Intrusion Volume ml/g 6.5 2.5
Average PoreDiameter
µm 0.11 0.03
Porosity % 40 65
Bulk Density (at 0.51 psia)
g/ml 0.08 0.26
Bilayer tablet compression and commonlyencountered issues have been previouslysummarized by Kottala et al. (11, 12). There arethree main reasons for layer separation. First,when using a material which has a moredeformable capacity, such as microcrystallinecellulose, in the first layer. This was not the casehere since the layer containing approximately73% microcrystalline cellulose was used in thesecond layer (i.e. compressed second). Second,using a higher tamping force in the first layerthat would smooth out the layer surface somuch that it would have difficulty to interlockwith the particles in the second layer resultingin layer separation. The 3 kN tamping forceused here for the first layer was on the low sideof the normally used tamping force range of 2to 18 kN. Thirdly, a mismatch in moistureadsorption could trigger interfacial stressresulting in layer separation. It is believed thatthis was the reason for the layer separationobserved in this study. As Figure 2 shows,Aeroperl® 300 can adsorb more moisture thanAerosil® 200 due to its greater surface area.Further, the vapor sorption isotherm forAeroperl® 300 shows that it does not retainmoisture with decreasing humidity. In contrast,Aerosil® 200 adsorbs relatively less moisturethan Aeroperl® 300 due to its smaller surfacearea, but it retains some moisture at decreasinghumidity due to its larger pore sizes. Thus,Aeroperl® 300, makes moisture available forinteractions with other excipients in Layer I ofthe tablet formulation, such as, microcrystallinecellulose and cropovidone. Crospovidonewhich is a disintegrant and, microcrystalline
cellulose can swell significantly in the presenceof moisture resulting in considerable stress atthe layer interface triggering layer separation. Asnoted, during the tablet manufacture when2.5% w/w water was added, tablets containingAeroperl® 300 delaminated after compressionfor this reason even when stored at roomtemperature/ambient humidity.
Such impact of any commonly used excipienthas not been reported previously. As statedabove, both grades of silicon dioxide behaveddifferently when exposed to external moisture.These interactions were surprising since nocompendial or vendor specifications areavailable which may alert formulation scientistsfor such a possibility. Thus there are twolessons to be learned i.e., (1) the compendial orvendor specifications may not providesufficient information to interchange anexcipient grade in a formulation, (2) replacingan excipient grade with another gradeexhibiting dissimilar adsorption/desorptionwhen exposed to high humidity can result inmore significant shear at the layer interfacetriggering layer separation.
CONCLUSION
A bilayer tablet formulation containing twodifferent grades of colloidal silicon dioxideexhibited significantly different layerseparation/delamination behavior whenexposed to increased humidity. Aeroperl® 300and Aerosil® 200 are both amorphous butAeroperl® 300 has a relative surface area largerthan Aerosil® 200. When exposed to increasedhumidity levels, Aeroperl® 300 demonstrated agreater moisture adsorption capacity due to itslarger surface area but did not retain themoisture content with decreasing humidity.Aerosil® 200 showed better moisture retentioncapacity due to its larger pore sizes. Themoisture which was not retained by Aeroperl®
300 in Layer II A was available for interactionwith other excipients in Layer I such asmicrocrystalline cellulose and crospovidonewhich is a disintegrant. It was hypothesized thatsuch interactions result in considerable stress at
This Journal is © IPEC-Americas Inc March 2014 J. Excipients and Food Chem. 5 (1) 2014 - 30

Original Article
the layer interface triggering the layerseparation.
REFERENCES
1 Abdul S, Poddar SS. A flexible technology formodified release of drugs:multi layered tablets.Journal of Controlled Release. 2004;97(393-405).
2 Desai D, Wang J, Wen H, Li X, Timmins P.Formulation design,challenges, and developmentconsiderations of fixed dose combination (FDC) oforal solid dosage forms. PharmaceuticalDevelopment and Technology. 2013;18(6):1265-76.
3 Mandal U, Pal TK. Formulation and in-vitro studiesof a fixed-dose combination of a bilayer matrix tabletcontaining metformin HCl as sustained release andglipizide as immediate release. Drug Developmentand Industrial Pharmacy. 2008;34:305-13.
4 Benkerrour L, Galley O, Quinet F, Abebe A,Timmins P, inventors; Multilayered tablet containingpravastatin and aspirin and method, 2004.
5 Podezcek F. Theoretical and experimentalinvestigations into the delamination tendencies ofbilayer tablets. International Journal ofPharmaceutics. 2011;408:102-12.
6 Anuar MS, Briscoe BJ. Interfacial elastic relaxationduring the ejection of bi-layered tablets. InternationalJournal of Pharmaceutics. 2010;387:42-7.
7 Michrafy A, Diarra H, Dodds JA. Compactionbehavior of binary mixtures. Powder Technology.2009;190:146-51.
8 Ullah I, Wang J, Chang SY, Wiley GJ, Jain NB, KiangS. Moisture-Activated Dry Granulation-Part 1:Aguide to excipient and equipment selection andformulation development. PharmaceuticalTechnology. 2009;33(11):62-70.
9 Ullah I, Wang J, Chang SY, Guo H, Kiang S, JainNB. Moisture-Activated Dry Granulation Part II:Theeffects of formulation ingredients andmanufacturing-process variables on granulationquality attributes. Pharmaceutical Technology.2009;33(12):42-51.
10 Sinka IC, Cocks ACF. Modeling die compaction inthe pharmaceutical industry. Modelling of powderdie compaction2007.
11 Kottala N, Abebe A, Sprockel O, Bergum J, NikfarF, A. C. Evaluation of the performancecharacteristics of bilayer tablets: Part I. Impact ofmaterial properties and process parameters on thestrength of bilayer tablets. AAPS PhramSciTech.2012;13(4):1236-42.
12 Kottala N, Abebe A, Sprockel O, Akseli I, Nikfar F,Cuitino A. Influence of compaction properties and
interfacial topography on the performance of bilayertablets. International Journal of Pharmaceutics.2012;436(1-2):171-8.
This Journal is © IPEC-Americas Inc March 2014 J. Excipients and Food Chem. 5 (1) 2014 - 31