Embed Size (px)
Citation preview

THERMOPHYSICAL PROPERTIES OF METHANOL BASED
NANOFLUIDS
MOHD. MOSTAFIZUR RAHMAN
DISSERTATION SUBMITTED IN FULFILMENT OF THE
REQUIREMENT FOR THE DEGREE OF MASTER OF
ENGINEERING SCIENCE
FACULTY OF ENGINEERING
UNIVERSITY OF MALAYA
KUALA LUMPUR
2015

ii
UNIVERSITI MALAYA
ORIGINAL LITERARY WORK DECLARATION
Name of Candidate: Mohd. Mostafizur Rahman (I.C/Passport No:
Registration/Matric No: KGA120095
Name of Degree: Master of Engineering Science
Title of Project Paper/Research Report/Dissertation/Thesis (“this Work”):
Thermophysical Properties of Methanol Based Nanofluids
Field of Study: Energy
I do solemnly and sincerely declare that:
(1) I am the sole author/writer of this Work;
(2) This Work is original;
(3) Any use of any work in which copyright exists was done by way of fair dealing and
for permitted purposes and any excerpt or extract from, or reference to or reproduction of
any copyright work has been disclosed expressly and sufficiently and the title of the Work
and its authorship have been acknowledged in this Work;
(4) I do not have any actual knowledge nor do I ought reasonably to know that the making
of this work constitutes an infringement of any copyright work;
(5) I hereby assign all and every rights in the copyright to this Work to the University of
Malaya (“UM”), who henceforth shall be owner of the copyright in this Work and that
any reproduction or use in any form or by any means whatsoever is prohibited without
the written consent of UM having been first had and obtained;
(6) I am fully aware that if in the course of making this Work I have infringed any
copyright whether intentionally or otherwise, I may be subject to legal action or any other
action as may be determined by UM.
Candidate’s Signature Date
Subscribed and solemnly declared before,
Witness’s Signature Date
Name:
Designation:

iii
ABSTRACT
Nanofluids are defined as colloidal suspension of solid particles with the size smaller than
100 nanometer. In this study, Al2O3, SiO2 and TiO2 nanoparticles were suspended into
methanol without any surfactant to investigate their characteristics, stability and
thermophysical properties. Nanoparticles size, shape, elemental proportion and
suspension uniformity were characterized. The stability of methanol based nanofluids
was analyzed using Uv-Vis spectrometer and zeta potential. Thermophysical properties
of nanofluids, namely thermal conductivity, viscosity and density of nanofluids were
measured by KD2 pro analyzer, LVDV III ultra–programmable rheometer and KEM-DA
130N density meter, respectively. All experiments were conducted at five different
volume concentrations (0.005, 0.01, 0.05, 0.10 and 0.15 vol%) and five different
temperatures (1, 5, 10, 15 and 20 ºC). In this study, Al2O3-methanol nanofluid appeared
to be more stable compared to SiO2-methanol and TiO2-methanol nanofluids. It was found
that thermal conductivity increased with the increase of volume concentration of
nanoparticles for all types of nanoparticles. Thermal conductivity enhancements is shown
between 1–8% for every 0.05 vol% increase with Al2O3 having the highest enhancement
increase in nanoparticle volume concentration. Thermal conductivity also increased
between 0.5–3.9% for every 5 °C increment in temperature with SiO2 showing the least
change. The shear stress and viscosity increased with volume concentration but decreased
with increase in temperature and shear rate. The results showed that the fluids appeared
as a non-Newtonian fluid with a shear thickening or dilatant behavior. The increment was
higher in TiO2–methanol nanofluids compared to the other two with the highest increment
of 17.8%. Besides, density of the methanol based nanofluids increased with volume
concentrations. However, density decreased accordingly with increased temperature. This
study demonstrates that thermal conductivity, viscosity and density of methanol based
nanofluids depend on the volume concentration and temperature.

iv
ABSTRAK
Nanofluids ditakrifkan sebagai penyuraian koloid zarah pepejal dengan saiz yang lebih
kecil daripada 100 nanometer. Dalam kajian ini, Al2O3, SiO2 dan TiO2 nanopartikel diurai
dalam metanol tanpa surfaktan untuk menyiasat ciri-cirinya, kestabilan dan sifat
termofizikal. Nanopartikel saiz, bentuk, bahagian unsur dan keseragaman penyuraian
telah dikaji. Kestabilan nanofluids berasaskan metanol dianalisis menggunakan Uv-Vis
spektrometer dan potensi zeta. Sifat termofizikal dnanofluids, iaitu, kekonduksian terma
kelikatan dan ketumpatan nanofluids diukur masing-masing dengan KD2 pro analyzer,
reometer boleh-program-ultra LVDV III dan meter ketumpatan KEM-DA 130N. Semua
ujikaji telah dijalankan di lima kepekatan yang berbeza isipadu (0.005, 0.01, 0.05, 0.10
dan 0.15 vol%) dan lima suhu yang berbeza (1, 5, 10, 15 dan 20 °C). Dalam kajian ini,
nanofluid Al2O3-metanol didapati lebih stabil berbanding dengan nanofluid SiO2-metanol
dan TiO2-metanol. Ia telah mendapati bahawa kekonduksian haba meningkat dengan
peningkatan kepekatan jumlah nanopartikel untuk semua jenis partikel nano.
Kekonduksian terma meningkat sebanyak 1-8% untuk peningkatan setiap 0.05 vol% dan
Al2O3 mempunyai peningkatan yang tertinggi dalam kepekatan jumlah nanopartikel.
Kekonduksian haba juga meningkat antara 0.5-3.9% untuk setiap kenaikan suhu 5 °C
dengan SiO2 menunjukkan perubahan yang paling kurang. Keicihan dan kelikatan
meningkat dengan kepekatan jumlah tetapi menurun dengan peningkatan suhu dan kadar
ricih. Hasil kajian menunjukkan bahawa cecair muncul sebagai cecair bukan Newtonian
dengan penebalan ricih atau tingkah laku Perisai Cecair. Peningkatan ini lebih tinggi
dalam nanofluids TiO2-metanol berbanding yang lain dengan kenaikan tertinggi sebanyak
17.8%. Selain itu, ketumpatan nanofluid berdasarkan metanol meningkat dengan
kepekatan jumlah. Walau bagaimanapun, ketumpatan menurun pada kadar yang sama
dengan suhu meningkat. Kajian ini menunjukkan bahawa kekonduksian haba, kelikatan
dan ketumpatan nanofluids berasaskan metanol bergantung kepada kepekatan isipadu dan
suhu nanofluids.
v
ACKNOWLEDGEMENTS
In the Name of Allah, The Beneficent, The Merciful, I would like to express my utmost
gratitude and thanks to the almighty Allah (s.w.t) for the help and guidance that He has
given me through all these years. My deepest appreciation is to my family for their
blessings and supports.
I would like to express my gratitude and profound respect to my supervisors, Professor
Dr. Saidur Rahman and Professor Ir. Dr. Abdul Aziz Bin Abdul Raman for their brilliant
guidance, supports and encouragement to carry out this research work. I am deeply
indebted to them.
Finally, thanks to University of Malaya for financial support, privileges, and opportunities
to conduct this study. This project was carried out under the Ministry of Higher Education
of Malaysia and the University of Malaya, Kuala Lumpur, Malaysia for the financial
support under the project UM.C/HIR/MOHE/ENG/40. I gratefully acknowledge to the
members of Energy Laboratory in helping me and for suggestion, ideas, discussions, and
advices in completing this research work.

vi
TABLE OF CONTENTS
ORIGINAL LITERARY WORK DECLARATION ................................................... ii
ABSTRACT .................................................................................................................... iii
ABSTRAK ...................................................................................................................... iv
ACKNOWLEDGEMENTS ............................................................................................ v
TABLE OF CONTENTS ............................................................................................... vi
LIST OF FIGURE .......................................................................................................... x
LIST OF TABLE .......................................................................................................... xv
LIST OF SYMBLES AND ABBREVIATIONS ........................................................ xvi
LIST OF APPENDICES ........................................................................................... xviii
CHAPTER 1 : INTRODUCTION ................................................................................. 1
1.1 Background ............................................................................................................. 1
1.2 Importance of this study .......................................................................................... 4
1.3 Problem statement ................................................................................................... 5
1.4 Objectives of this study ........................................................................................... 5
1.5 Outline of the thesis ................................................................................................. 6
CHAPTER 2 : LITERATURE REVIEW ..................................................................... 7
2.1 Introduction ............................................................................................................. 7
2.2 Nanofluids ............................................................................................................... 7
2.2.1 Preparation of nanofluids .................................................................................. 8
2.2.1.1 One step method ......................................................................................... 8
vii
2.2.1.2 Two-step method ........................................................................................ 9
2.3 Characterization of nanoparticles and nanofluids ................................................. 11
2.3.1 XRD, SEM and TEM...................................................................................... 11
2.4 Stability of nanofluids ........................................................................................... 13
2.4.1 Sediment photograph capturing ...................................................................... 13
2.4.2 UV-Visible spectrophotometer ....................................................................... 13
2.4.3 Zeta potential and Zetasizer ............................................................................ 14
2.5 Thermophysical properties of nanofluids .............................................................. 16
2.5.1 Thermal conductivity of nanofluids ................................................................ 16
2.5.1.1 Theoretical study on thermal conductivity ............................................... 16
2.5.1.2 Experimental study on thermal conductivity ........................................... 19
2.5.1.2.(a) Effect of volume fraction on thermal conductivity of nanofluids ...... 22
2.5.1.2.(b) Influence of temperature on thermal conductivity of nanofluids ....... 22
2.5.2 Viscosity of nanofluids ................................................................................... 23
2.5.2.1 Theoretical study on viscosity .................................................................. 23
2.5.2.2 Experimental study on viscosity .............................................................. 26
2.5.2.2.(a) Viscosity of nanofluids as a function of volume fraction ................... 27
2.5.2.2.(b) Effect of temperature on viscosity of nanofluids ............................... 28
2.5.3 Density of nanofluids ...................................................................................... 28
2.6 Summary of literature review ................................................................................ 30
CHAPTER 3 : METHODOLOGY .............................................................................. 32
3.1 Introduction ........................................................................................................... 32

viii
3.2 Experimental setup ................................................................................................ 32
3.2.1 Materials ......................................................................................................... 32
3.2.2 List of equipment ............................................................................................ 34
3.3 Preparation of methanol based nanofluids ............................................................ 34
3.4 Characterization of nanoparticles and methanol based nanofluids ....................... 37
3.4.1 Determination of particle shape, size and suspension uniformly ................... 38
3.5 Stability of methanol based nanofluids ................................................................. 38
3.5.1 Sediment photograph capturing ...................................................................... 39
3.5.2 UV-Visible spectrophotometer ....................................................................... 39
3.5.3 Zeta potential and zetasizer ............................................................................. 39
3.6 Thermophysical properties of methanol based nanofluids .................................... 40
3.6.1 Thermal conductivity measurement................................................................ 40
3.6.2 Viscosity measurement ................................................................................... 42
3.6.3 Density measurement ...................................................................................... 44
CHAPTER 4 : RESULTS AND DISCUSSIONS ....................................................... 46
4.1 Introduction ........................................................................................................... 46
4.2 Characterization of nanoparticles and methanol based nanofluids .................... 46
4.2.1 X-ray Diffraction (XRD) image analysis........................................................ 46
4.2.2 Scanning electron microscope (SEM) image Analysis ................................... 48
4.2.3 TEM image analysis ....................................................................................... 49
4.3 Stability of methanol based nanofluids ................................................................. 51
4.3.1 Sedimentation image analysis ......................................................................... 51

ix
4.3.2 Inspection stability by Uv-Visible spectrophotometer ................................... 52
4.3.3 Stability inspection by Zeta potential and Zetasizer test ................................ 54
4.4 Thermophysical properties of methanol based nanofluids .................................... 56
4.4.1 Thermal conductivity of methanol based nanofluids ...................................... 56
4.4.2 Viscosity of methanol based nanofluids ......................................................... 63
4.4.3 Density of methanol based nanofluids ............................................................ 69
4.5 Implication of this study ........................................................................................ 72
CHAPTER 5 : CONCLUSIONS AND RECOMMENDATIONS ............................ 73
5.1 Introduction ........................................................................................................... 73
5.2 Conclusions ........................................................................................................... 73
5.3 Recommendations for future work ........................................................................ 74
REFERENCES .............................................................................................................. 76
LIST OF PUBLICATION AND PRESENTATION .................................................. 86
APPENDIXES ............................................................................................................... 87
x
LIST OF FIGURE
Figure 2.1: Common basefluids, nanoparticles, and surfactants for
synthesizing nanofluid .............................................................. 10
Figure 2.2: XRD pattern of Ag nanoparticles (Philip & Shima, 2014)....... 12
Figure 2.3: SEM (left) and TEM (right) image of Al2O3-water nanofluids
(Shukla et al., 2005) .................................................................. 12
Figure 2.4: Zeta potential of methanol nanofluids as a function of nanoparticle
volume fraction (Pang et al., 2012) ........................................... 14
Figure 2.5: Particle size of methanol based nanofluids as a function of
nanoparticle volume fraction (Pang et al., 2012) ...................... 16
Figure 2.6: Thermal conductivity versus particle volume fraction .............. 22
Figure 2.7: Thermal conductivity versus temperature ................................. 23
Figure 2.8: Viscosity increases with the increase of particle volume
fraction ...................................................................................... 27
Figure 2.9: Viscosity increases with the increase of temperature ................ 28
Figure 2.10: Density increases with the increase of particle volume
fraction ...................................................................................... 29
Figure 2.11: Density increases with the increase of temperature................. 30
Figure 3.1: Flowchart of experimental analysis ........................................... 32
Figure 3.2: Cluster size at different ultrasonication time (0.05vol% of Al2O3
concentration) ............................................................................ 35
Figure 3.3: Effect of evaporation on ultrasonication duration of Al2O3‒
methanol (0.05 vol%) nanofluids (a) before ultrasonication (b)
after 2h ultrasonication .............................................................. 37
Figure 3.4: Using thermal bath to control temperature during ultrasonication
time to prepare nanofluids ......................................................... 37

xi
Figure 3.5: Schematic diagram of KD2 pro thermal properties analyzer ..... 41
Figure 3.6: Thermal conductivity comparison with measured and reference
data ............................................................................................ 42
Figure 3.7: Schematic diagram of viscosity measurement........................... 43
Figure 3.8: Viscosity comparison with measured and reference data .......... 44
Figure 3.9: Density comparison with measured and reference data ............ 45
Figure 4.1: XRD pattern of Al2O3 nanoparticles ......................................... 47
Figure 4.2: XRD pattern of SiO2 nanoparticles ........................................... 47
Figure 4.3: XRD pattern of TiO2 nanoparticles ........................................... 47
Figure 4.4: SEM image of Al2O3 nanoparticles ........................................... 48
Figure 4.5: SEM image of SiO2 nanoparticles ............................................. 49
Figure 4.6: SEM image of TiO2 nanoparticles ............................................. 49
Figure 4.7: TEM image of Al2O3-methanol nanofluid (0.05 vol%) ............ 50
Figure 4.8: TEM image of SiO2-methanol nanofluid (0.05 vol%) .............. 50
Figure 4.9: TEM image of TiO2-methanol nanofluid (0.05 vol%) .............. 51
Figure 4.10: Photograph of methanol based nanofluids just after preparation
and after 7 days preparation ...................................................... 52
Figure 4.11: UV–Vis spectrum of Al2O3–methanol nanofluids .................. 53
Figure 4.12: UV–Vis spectrum of SiO2–methanol nanofluids. ................... 54
Figure 4.13: UV–Vis spectrum of TiO2–methanol nanofluids .................... 54
Figure 4.14: Zeta potential of methanol based nanofluids as a function of
nanoparticle volume concentration ........................................... 55
Figure 4.15: Particle size in methanol based nanofluids as a function of
volume concentration ................................................................ 56
Figure 4.16: Thermal conductivity of Al2O3–methanol as a function of
temperature and particle volume concentration. ....................... 57

xii
Figure 4.17: Thermal conductivity of SiO2–methanol as a function of
temperature and particle volume concentration. ....................... 58
Figure 4.18: Thermal conductivity of TiO2–methanol as a function of
temperature and particle volume concentration. ....................... 58
Figure 4.19: Experimental values of thermal conductivity (Al2O3–methanol)
compared with the values from existing correlation ................. 59
Figure 4.20: Experimental values of thermal conductivity (SiO2–methanol)
compared with the values from existing correlation ................. 60
Figure 4.21: Experimental values of thermal conductivity (TiO2–methanol)
compared with the data from existing correlation ..................... 60
Figure 4.22: Comparison of thermal conductivity enhancement with reference
data. ........................................................................................... 61
Figure 4.23: Comparison of thermal conductivity ratio measured data with
proposed correlation .................................................................. 63
Figure 4.24: Shear stress and viscosity of Al2O3–methanol nanofluids for 0.05
vol% as a function of shear rate and temperature. .................... 64
Figure 4.25: Shear stress and viscosity of SiO2–methanol nanofluids for 0.05
vol% as a function of shear rate and temperature. .................... 65
Figure 4.26: Shear stress and viscosity of TiO2–methanol nanofluids for 0.05
vol% as a function of shear rate and temperature. .................... 65
Figure 4.27: Viscosity of Al2O3–methanol as a function of temperature and
particle volume concentration. .................................................. 66
Figure 4.28: Viscosity of SiO2–methanol as a function of temperature and
particle volume concentration. .................................................. 67
Figure 4.29: Viscosity of TiO2–methanol as a function of temperature and
particle volume concentration. .................................................. 67

xiii
Figure 4.30: Comparison of measured viscosity with the values from existing
correlation ................................................................................. 68
Figure 4.31: Comparison of viscosity ratio measured values with proposed
correlation ................................................................................. 69
Figure 4.32: Density of Al2O3–methanol as a function of temperature and
particle volume concentration. .................................................. 70
Figure 4.33: Density of SiO2–methanol as a function of temperature and
particle volume concentration. .................................................. 71
Figure 4.34: Density of TiO2–methanol as a function of temperature and
particle volume concentration. .................................................. 71
Figure 4.35: Comparison of density increment with the values from existing
correlation. ................................................................................ 72
Figure A.1: SEM image of Al2O3 nanoparticles during EDS analysis with the
marking of point 1 ..................................................................... 87
Figure A.2: EDS analysis of Al2O3 nanoparticles at point 1........................ 87
Figure A.3: SEM image of SiO2 nanoparticles during EDS analysis with the
marking of point 2. .................................................................... 88
Figure A.4: EDS analysis of SiO2 nanoparticles at point 2. ........................ 89
Figure A.5: SEM image of TiO2 nanoparticles during EDS analysis with the
marking of point 3. .................................................................... 89
Figure A.6: EDS analysis of TiO2 nanoparticles at point 3. ........................ 90
Figure B.1: TEM image of Al2O3-methanol nanofluids with the approximate
measurement of some particle’s diameter. ................................ 91
Figure B. 2: TEM image of SiO2-methanol nanofluids with the approximate
measurement of some particle’s diameter. ................................ 92
Figure B.3: TEM image of TiO2-methanol nanofluids with the approximate
measurement of some particle’s diameter. ................................ 92
Figure C.1: Volume distribution of nanoparticle size within the 0.10 vol% of
Al2O3-methanol nanofluids ....................................................... 93
xiv
Figure C.2: Volume distribution of nanoparticle size within the 0.05 vol% of
SiO2-methanol nanofluids ......................................................... 93
Figure C.3: Volume distribution of nanoparticle size within the 0.01 vol% of
TiO2-methanol nanofluids. ........................................................ 94

xv
LIST OF TABLE
Table 2.1: Summary of methanol based nanofluids synthesis process that
followed by the researchers ....................................................... 11
Table 2.2: Zeta potential absolute value and stability .................................. 15
Table 2.3: List of Classical models for nanofluid thermal conductivity ...... 17
Table 2.4: List of nanofluid thermal conductivity models derived from
Classical models ........................................................................ 18
Table 2.5: List of experimental studies on nanofluid thermal conductivity 20
Table 2.6: List of Classical models for nanofluid viscosity ......................... 24
Table 2.7: List of nanofluid viscosity models derived from classical
models ....................................................................................... 24
Table 2.8: List of experimental studies on nanofluid viscosity ................... 26
Table 2.9: Summary of the available literature about methanol based
nanofluids .................................................................................. 30
Table 3.1: Properties of nanoparticles .......................................................... 33
Table 3.2: Properties of Methanol ................................................................ 33
Table 3.3: List of equipment used in experiment ......................................... 34
Table 3.4: Experimental condition ............................................................... 36
Table A.1: Chemical Elemental composition of Al2O3 nanoparticles by EDS
analysis at point 1. ..................................................................... 88
Table A.2: Chemical Elemental composition of SiO2 nanoparticles by EDS
analysis at point 2. ..................................................................... 89
Table A.3: Chemical Elemental composition of TiO2 nanoparticles by EDS
analysis at point 3. ..................................................................... 90

xvi
LIST OF SYMBLES AND ABBREVIATIONS
Abbreviations
DW Distilled Water
DIW Deionized Water
EG Ethylene Glycol
EDS Energy dispersive spectrometry
HVAC Heating, ventilation and air conditioning system
JCPDS Joint Committee on Powder Diffraction Standards
KB Boltzmann constant
M Methanol
MBNF Methanol based nanofluids
SEM Scanning Electron Microscopy
TEM Transmission Electron Microscopy
W Water
XRD X-Ray Diffraction
Nomenclature
pC Specific heat (J/g K)
d Diameter of nanoparticles (nm)
h Inter particle spacing
k Thermal conductivity (W/m K)
m Mass (kg)
n Shape factor

xvii
r Radius of particle (nm)
T Temperature (K)
To Initial temperate (K)
Vol. Volume concentration of nanoparticles (%)
Greek Symbols
Volume concentration (%)
Density (kg/m3)
Viscosity (mPas)
β Ratio of nanolayer thickness (nm)
α Empirical constants
Dimensionless numbers
Re Reynolds number
Pr Prandtl number
Subscripts
np Nanoparticle
nf Nanofluid
bf Base fluid
xviii
LIST OF APPENDICES
APPENDIX A: CHEMICAL ELEMENTS COMPOSITION OF
NANOPARTICLES………………………………………….
87
APPENDIX B: NANOPARTICLES SIZE MEASUREMENT……………… 91
APPENDIX C: VOLUME DISTRIBUTION WITHIN THE NANOFLUIDS 93

1
CHAPTER 1 : INTRODUCTION
1.1 Background
Heat transfer plays an important role in industrial process, where heat must be efficiently
managed by adding, removing or moving into the system. Heat transfer fluids such as
water, ethylene glycol (EG), pumping oil, etc., have reached their limits for cooling
applications in the modern high performance devices due to their poor thermal
performance. It has been proved that adding solid particles to these conventional fluids
could enhance their thermal performance. However, the large size of particles in the scale
of milli or even micro-sized particle (Philip & Shima, 2014) suspension showed
insufficient enhancement for high-tech applications due to several technical problems
(Krishnamurthy et al., 2006) like slugging, faster settling time, abrasion of the surface,
erosion of the pipelines and increasing pressure drop. Therefore, researchers are looking
for highly efficient heat transfer fluids to solve the drawbacks of traditional fluids in the
cooling performance. However, from the last decade, Nanoscience and Nanotechnology
have offered nanofluids (NFs), which showed advancements of its thermophysical
properties as well as enhanced heat transfer performance of diverse field of modern high-
tech applications.
Nanofluids are defined as a colloidal suspension of solid nanoparticles with the size of
less than 100 nm dispersed in a conventional fluids and the solid particle concentration
of lower than 5 vol%. For the first time, Choi and Eastman (1995) at Argonne National
Laboratory in the USA coined the term nanofluids for fluids with suspended
nanoparticles. Nanofluids apply in different areas such as biomedical applications,
lubrication, surface coating, heat exchangers, automotive industry, power generation,
solar industry and petroleum industry (Saidur et al., 2011). The importance of nano-sized
particles and their benefits compared to micro particles has been investigated and it could
be stated that nanoparticles possess (Das et al., 2003): (a) longer suspension time (more

2
stable), (b) much higher surface area, (c) larger surface area/volume ratio (1000 times
larger), (d) higher thermal conductivity, (e) lower erosion and clogging, (f) lower demand
for pumping power, (g) reduction in inventory of heat transfer fluid and (h) significant
energy saving.
In order to evaluate the effectiveness of a nanofluid for heat transfer applications, it is
necessary to identify the thermophysical properties such as thermal conductivity,
viscosity, density, and specific heat of nanofluids. The thermophysical and transport
properties of nanofluids are influenced by several factors, which affect the heat transfer
coefficient as well as thermal performance of the system. The performance of nanofluids
depends on base fluids, concentration of nanoparticles, temperature, particle size, stability
of nanofluids, surfactants and pH of the base fluids (Beck et al., 2009; Duangthongsuk &
Wongwises, 2009; Xia et al., 2014). In heat transfer, one of the most significant
thermophysical properties of nanofluids, which is required to study in order to determine
the capability of nanofluids for heat transfer applications. This property influences the
Nusselt and Prandtl numbers, which are the most important parameters to know the heat
transfer characteristics of a flowing fluid in a system (Aravind et al., 2011). The
effectiveness of nanofluids depends on higher thermal conductivity for heat transfer
applications.
However, only higher thermal conductivity is not sufficient for using nanofluids as a heat
transfer fluid in the cooling applications. In order to choose the efficient nanofluids with
optimal characteristics for cooling applications, it is also essential to know the viscosity
of the nanofluids. Viscosity of nanofluids plays a critical role in all thermal applications
due to the internal resistance of the fluid to flow. The viscosity of nanofluids is expected
to be greater than their base fluids when nanoparticles are added. However, the
enhancement of viscosity creates a negative effect on the pumping power and the heat
transfer coefficient. For example, in the laminar flow regime, the pressure drop is directly

3
proportional to the viscosity (Herold & Rasooly, 2005). Further, Reynolds and Prandtl
numbers are also affected by the viscosity of the fluids which affects the heat transfer
coefficient (HTC). Thus, viscosity is as essential as thermal conductivity in all thermal
systems.
The density of the nanofluids is directly proportional to the volume ratio of the
nanoparticles in the base fluid. Moreover, the density of the nanoparticles is higher than
that of the base fluids. Therefore, it is expected that the density of nanofluids increases
with the dispersion of nanoparticles to the base fluid. Further, an extensive property
named the specific heat of the nanofluid is considered in the calculation of heat transfer
performance of a device. Generally, the solid nanoparticles have lower specific heat than
water. Hence, the effective specific heat of the nanofluid decreases after the dispersion of
nanoparticles in the pure water. Moreover, the specific heat is very much dependent on
the volume fraction of the nanoparticle due to it decreases gradually with the increasing
of the volume fraction. The methanol based nanofluids are a kind of heat transfer fluids
used in different heat pipe, heat exchangers. Garner (1996) used copper–methanol heat
pipes in application which operated below 0 ºC. Electronics cooling is to present a few of
the more common examples of demonstrate the heat pipe’s application. Dink (1996) used
methanol at metal hydride refrigeration system, as a working heat transfer medium for
the low-temperature. Recently, Firouzfar et al. (2011) used silver– methanol nanofluid in
thermosyphon heat exchanger of an air conditioning system to examine the energy
savings compared to pure methanol. Therefore, methanol based nanofluids can potentially
enhance the heat transfer rate of heat exchangers and save energy compared to pure
methanol. Since then, some experiments have been going on about methanol nanofluids
(Arab & Abbas, 2014; Lefèvre et al., 2012; Wong et al., 2012).
4
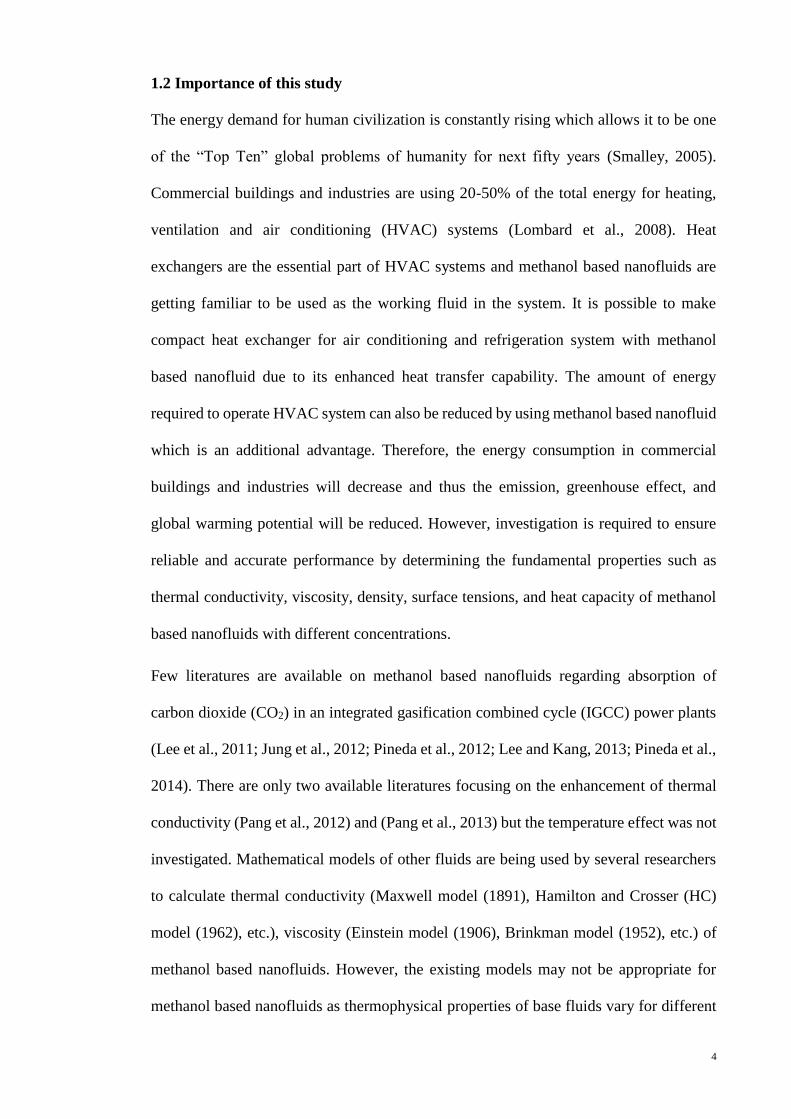
1.2 Importance of this study
The energy demand for human civilization is constantly rising which allows it to be one
of the “Top Ten” global problems of humanity for next fifty years (Smalley, 2005).
Commercial buildings and industries are using 20-50% of the total energy for heating,
ventilation and air conditioning (HVAC) systems (Lombard et al., 2008). Heat
exchangers are the essential part of HVAC systems and methanol based nanofluids are
getting familiar to be used as the working fluid in the system. It is possible to make
compact heat exchanger for air conditioning and refrigeration system with methanol
based nanofluid due to its enhanced heat transfer capability. The amount of energy
required to operate HVAC system can also be reduced by using methanol based nanofluid
which is an additional advantage. Therefore, the energy consumption in commercial
buildings and industries will decrease and thus the emission, greenhouse effect, and
global warming potential will be reduced. However, investigation is required to ensure
reliable and accurate performance by determining the fundamental properties such as
thermal conductivity, viscosity, density, surface tensions, and heat capacity of methanol
based nanofluids with different concentrations.
Few literatures are available on methanol based nanofluids regarding absorption of
carbon dioxide (CO2) in an integrated gasification combined cycle (IGCC) power plants
(Lee et al., 2011; Jung et al., 2012; Pineda et al., 2012; Lee and Kang, 2013; Pineda et al.,
2014). There are only two available literatures focusing on the enhancement of thermal
conductivity (Pang et al., 2012) and (Pang et al., 2013) but the temperature effect was not
investigated. Mathematical models of other fluids are being used by several researchers
to calculate thermal conductivity (Maxwell model (1891), Hamilton and Crosser (HC)
model (1962), etc.), viscosity (Einstein model (1906), Brinkman model (1952), etc.) of
methanol based nanofluids. However, the existing models may not be appropriate for
methanol based nanofluids as thermophysical properties of base fluids vary for different

5
fluids. Therefore, in order to analysis accurately the heat transfer, energy performance,
lubricity, and so on, calculations using the values of obtained thermosphysical properties
of methanol based nanofluids are expected to be more appropriate.
1.3 Problem statement
Nanofluid is a very efficient heat transfer fluids due to its enhanced thermophysical
properties. Methanol based nanofluids have been used as low temperature working fluids
in different types of heat pipes like conventional, vapour-dynamic thermosyphons heat
exchanger in HAVAC (heating, ventilation, and air conditioning) system, sorption,
micro/miniature heat pipe at temperature range of 200-500K. Methanol is useful in
gravity-aided, pool-boiling applications where water heat pipes would be subject to
freezing (Dincer & Kanoglu, 2010). This study intends to investigate the thermophysical
properties of methanol based nanofluids in order to implement the fluids in low
temperature applications (i.e, electronics cooling, HVAC system, refregerator etc.).
Specifically, the study seeks to answer:
(a) What is significance of different type of nanoparticles on methanol based
nanofluids preparation?
(b) How does nanoparticles type and volume concentration affect the stability of
nanofluids?
(c) How does volume concentration and temperature affect thermophysical properties
of nanofluids?
1.4 Objectives of this study
To be able to solve the state problems and to answer the research questions, the objectives
of the study are considered as follows:
1. To formulate and characterize methanol based nanofluids using selected
nanoparticles.
2. To assess the stability of methanol based nanofluids.
6
3. To determine and validate the thermophysical properties (e.g. thermal
conductivity, viscosity and density) of nanofluids.
1.5 Outline of the thesis
This dissertation comprises five chapters. The contents of the individual chapters have
been outlined as follows:
Chapter 1: This chapter starts with some background information about methanol based
nanofluids as well as describing the importance, aim, objectives, and limitations of the
dissertation.
Chapter 2: In this chapter, a review of the literature on preparation, characterization,
thermophysical properties (e.g. thermal conductivity, viscosity, and density), and stability
of methanol based nanofluids have been addressed.
Chapter 3: It describes the experimental set up, materials, procedures and equipment that
have been used during preparation, characterization, and determination of thermophysical
properties (e.g. thermal conductivity, viscosity, and density), and stability of methanol
based nanofluids.
Chapter 4: This chapter analyzes the outcomes of preparation, characterization,
thermophysical properties (e.g. thermal conductivity, viscosity, and density), and stability
of methanol based nanofluids.
Chapter 5: This is the last chapter and wraps up the dissertation with some concluding
remarks and recommendations for future work.

7
CHAPTER 2 : LITERATURE REVIEW
2.1 Introduction
The chapter contains an overview of other related studies, their approach development
and significance to this study in order to set up the objectives. Study has been conducted
through a sound collection related to PhD and Master thesis, journal articles, reports,
conference papers, internet sources, and books. It is noteworthy that about 80–90% of the
journal papers collected from most relevant and prestigious peer reviewed international
referred journals such as International Journal of Refrigeration, International Journal of
Heat and Mass Transfer, Applied Thermal Engineering, Energy and Buildings, Energy
Conversion and Management, Renewable and Sustainable Energy Reviews, Journal of
Nanoparticle Research, International Journal of Thermal Science, etc. Moreover, the
substantial amount of relevant information has been collected through personal contact
with the key researchers around the world in this research area.
2.2 Nanofluids
Modern technologies are able to produce metallic or non-metallic type of particles.
Nanomaterials have its unique properties such as mechanical, electrical, optical, magnetic
and thermal properties.
The term “nanofluid” was first introduced by Choi (1995) to describe a colloidal mixture
of nanoparticle with size from 1 to 100 nm and a base fluid such as water, oil and ethylene
glycol. Nanofluid technology is the new technology where nanoscience, nanotechnology
and thermal engineering are directly involved. The main objective of using nanofluid in
any purposes is to get maximum possible thermal properties with using minimum possible
volume concentrations.

8
2.2.1 Preparation of nanofluids
Preparation of nanofluid is considered one of the most important steps for improving the
thermal conductivity of nanofluid. Generally, there are two methods to prepare nanofluid
such as one step method and two step method. However, preparing nanofluid using
second step method is easier than one step method.
2.2.1.1 One step method
A simultaneous process of nanoparticle generation and dispersion in a specific fluid is
called one step method. This process is able to produce uniformly dispersed particles
which make the nanofluid stable. Generally, two methods are involved in preparing
nanofluid under these techniques: Physical vapour deposition method and chemical
reduction technique.
Single step method is generally applied when metal nanofluid is prepared. However, the
main drawback of using one step method is: fluids are incompatible with high vapour
pressure and low concentration of nanofluid. This aforementioned draw back actually
limits the uses of one step method.
One step method was initially used by few researchers. Zhu et al. (2004) scrutinized one
step method involving chemical method to prepare ethylene glycol based Cu nanofluid
by reducing copper sulphate penta hydrate with sodium hypophosphate under microwave
irradiation. Liu et al. (2006) prepared water based Cu nanofluid through chemical
reduction method. One step process forms of simultaneously making and dispersing
particles into base fluid and in this process, the agglomeration can be reduced by avoiding
the processes of drying, storage, transportation, and dispersion of nanoparticles.
Uniformly dispersed nanoparticles can be prepared using one step method and it can be
stably suspended into base fluid. Another method is also used to prepare nanofluid using
dielectric liquids. The nanoparticles prepared here represent square, polygonal, needle-
like and circular morphological shapes. It clearly thwarts the undesired particle from
9
aggregating. Synthesized nanofluids in large scale are not possible using one step method.
Even is not cost-effective as well. However, the one-step chemical method is improving
promptly.
2.2.1.2 Two-step method
This method is widely used in preparing nanofluid because it is an economical method.
In this method, nanoparticles are suspended into base fluid such as water, engine oil,
ethylene glycol etc. by means of external force. Scientist and researchers use two
techniques to disperse tiny particles into base fluid which are: Physical technique and
chemical technique.
For physical technique method, two types of stabilizing process such as mechanical and
ultrasonic can be considered. One way for mechanical dispersion is to apply shear force
to pull agglomeration. To create high shear force, high flow rate is required. This is why,
a rotor along with a stator is attached to create high shear. This comprises homogenizer,
high speed mixer, micro fluidizer and colloid mill. On the other hand, mechanical
dispersion means high impact mixing. It uses higher energy to break the tightly bound
aggregates apart or to shatter coherent solids into tiny pieces. To disperse particle or to
exert an impact on the material, a grinding material of small particle size is used.
Nowadays, the most widely used method to prepare nanofluid is Ultrasonication. It is a
form of mechanical vibratory energy that disseminates through a liquid medium as elastic
waves. The ultrasonic interactions within dispersion might be mechanical, thermal or
chemical. The activator inside the ultrasonic machine converts the regular line frequency
to a much higher level, which is eventually converted into mechanical vibrations in the
tips of various shapes.
A conventional bath type sonication which normally gives less energy density than tip
type one. Generally, the tip of the spindle is put into liquid where ultrasonic sonication
creates cavitation and which stirs the dispersion or breaks the agglomerates. There are

10
two kinds of stabilization methods:- which are electrostatic dispersion and physical
dispersion method. In electrostatic dispersion, electrostatic charges of sufficient amount
are disseminated on the surface of the suspended particles to resist one another and remain
in stable suspension. Besides, steric stabilization precludes nanoparticles from getting
close enough to merge.
Together with basefluids and nanoparticles, additives are utilized to increase stability of
nanofluids and toimprove dispersion behavior of them. More common nanoparticles and
basefluids exploited in synthesis would be tabulated as below ( Li et al., 2009):
Nanofluid
Metalic Metal Oxide Others
Water
Ethylene
Glycol
Engine
Oil
Acetone
Basefluid Nanoparticle Surfactant
Nano
droplet
Cu
Ag
Al
Au
Fe
CuO
Al2O3
SiO2
TiO2
Fe2O3
SDS
CTAB
NAD
DBS
AG
CNT
TNT
SiC
AIN
Figure 2.1: Common basefluids, nanoparticles, and surfactants for synthesizing
nanofluid
Table 2.1 shows typical synthesis method used by researchers to prepare methanol based
nanofluids. From the table it is clear that, researchers used two step method and ultrasonic
vibration for proper mixtures. For methanol based nanofluids preparation used ultrasonic
vibration for 60-120 min, electrical power 50-750 W and frequency 20 Hz to stabilize the
nanofluids.

11
Table 2.1: Summary of methanol based nanofluids synthesis process that followed by
the researchers
Reference method particle Base
fluid
Particle
size
(nm)
Volume
fraction
Sonication
time (min)
Power
(W)
Frequ
ency
(Hz)
Firouzfar et
al. (2011) Two-step Ag methanol 20 0.1 - - -
Kim et al.
(2014) Two-step Al2O3 methanol 40-50
0.001-
0.01 60 350 20
Pang et al.
(2012) Two-step
Al2O3
SiO2 methanol
40-50
10-20 0.005-0.5 120 750
20
@700
rpm
Pang et al.
(2013) Two-step Al2O3
Methanol
+ NaCl 40-50 0.01-0.1 60 750
20
@700
rpm
Pineda et al.
(2012) Two-step
Al2O3
SiO2 methanol
40-50
10-20 0.005-0.1 60 - -
Lee et al.
(2011) Two-step
Al2O3
SiO2 methanol
40-50
10-20
0.005-
0.05 60 750 20
Lee & Kang
(2013) Two-step
Al2O3
NaCl
aqueous
solution
40-50
0.005-0.1 80 750 20
Jung et al.
(2012) Two-step
Al2O3
methanol
40-50
0.005-0.1 60 50 20
2.3 Characterization of nanoparticles and nanofluids
X-Ray Diffraction (XRD), Scanning Electron Microscope (SEM) and Transmission
Electron Microscope (TEM) are some well-known instruments that have been used to
characterize the nanoparticles and nanofluids. Literature about characterization of
methanol based nanofluid is limited however there are some studies have been done based
on other fluids. However, now a days, these methods are widely used to measure the size
and shape of nanoparticles. Throughout this study, both of these types of equipment have
been used to measure the nanoparticles size, shape, and elemental composition.
2.3.1 XRD, SEM and TEM
The simplest and most widely used method is XRD for estimating the average
nanoparticle grain size. Philip & Shima (2014) used XRD of Ag nanoparticles to
characteristic peak match with the standard and the average crystallite size obtained from
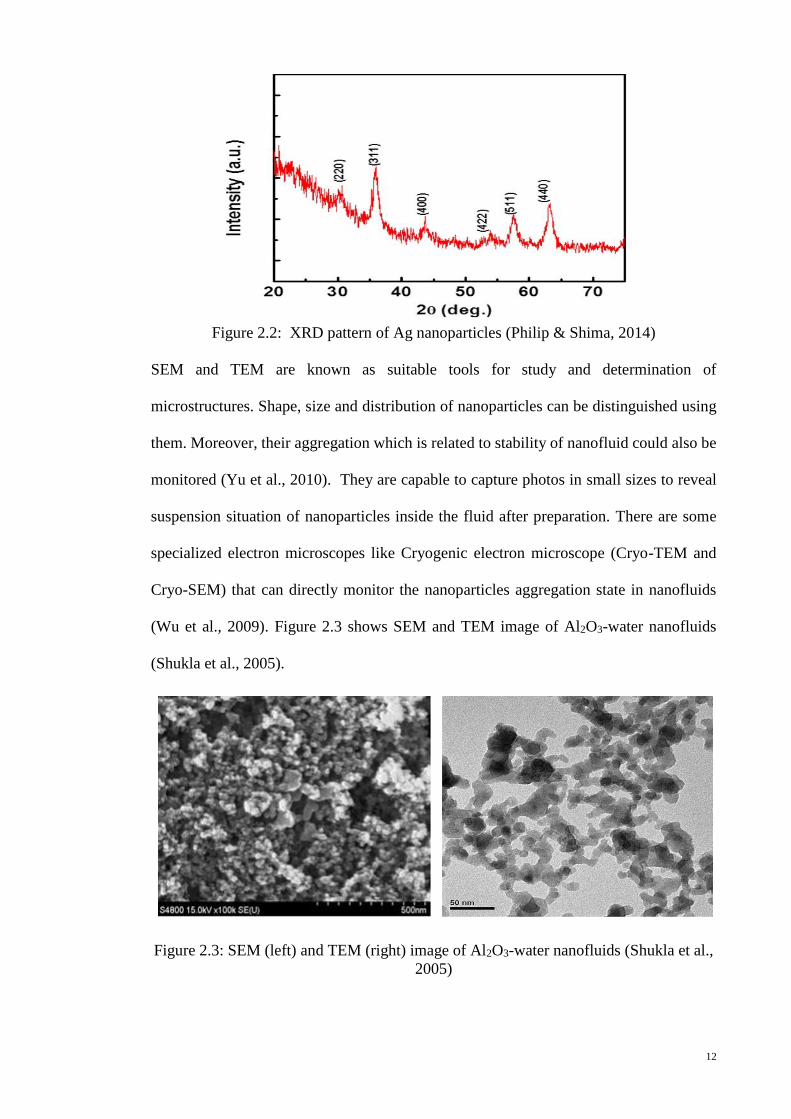
Debye-Scherrer formula. Figure 2.2 shows the XRD pattern of Ag nanoparticles.
12
Figure 2.2: XRD pattern of Ag nanoparticles (Philip & Shima, 2014)
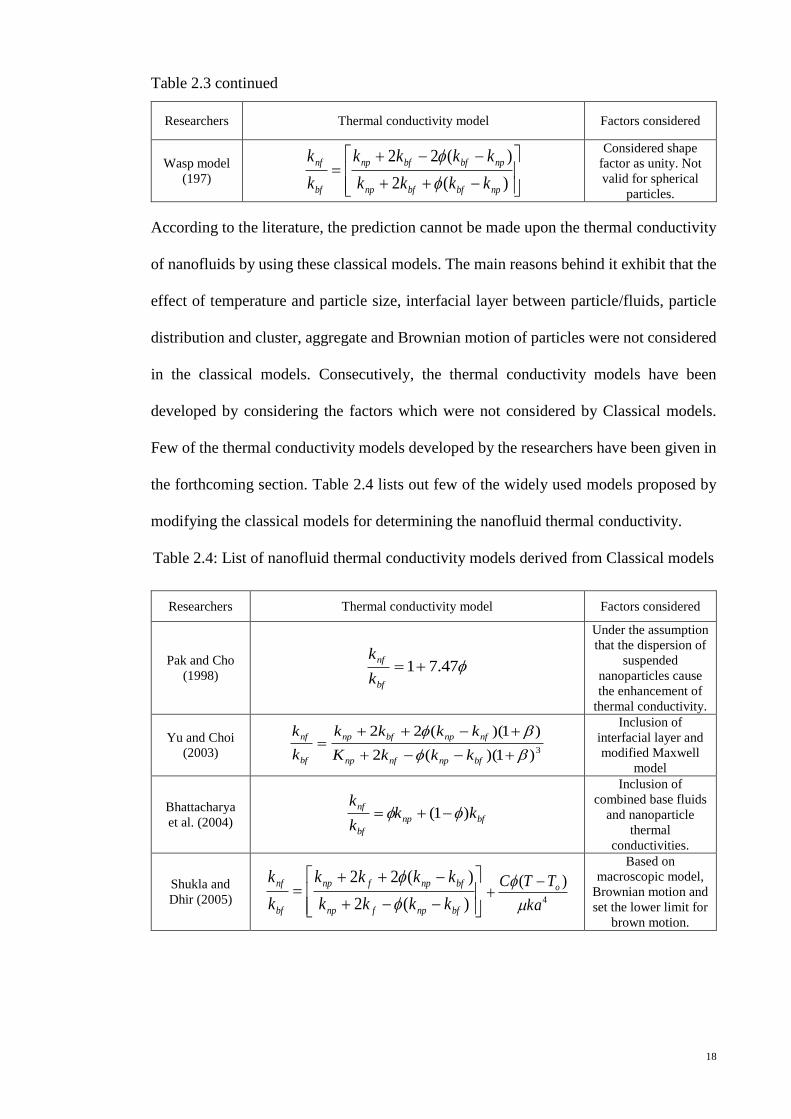
SEM and TEM are known as suitable tools for study and determination of
microstructures. Shape, size and distribution of nanoparticles can be distinguished using
them. Moreover, their aggregation which is related to stability of nanofluid could also be
monitored (Yu et al., 2010). They are capable to capture photos in small sizes to reveal
suspension situation of nanoparticles inside the fluid after preparation. There are some
specialized electron microscopes like Cryogenic electron microscope (Cryo-TEM and
Cryo-SEM) that can directly monitor the nanoparticles aggregation state in nanofluids
(Wu et al., 2009). Figure 2.3 shows SEM and TEM image of Al2O3-water nanofluids
(Shukla et al., 2005).
Figure 2.3: SEM (left) and TEM (right) image of Al2O3-water nanofluids (Shukla et al.,
2005)

13
2.4 Stability of nanofluids
Stability of nanofluids is an important phenomenon that needs to be characterized. If
nanofluids are not stable, clogging, aggregation and sedimentation would be happened
which declines the performance of suspensions via decreasing thermal conductivity and
increasing viscosity. Some apparatus and procedures have been introduced in literature
that can measure the comparative stability of nano-suspensions. UV-Visible
spectrophotometer, Sediment photograph capturing, zeta potential and zetasizer are some
well-known instruments those have been used to measure the relative stability of
nanofluids
2.4.1 Sediment photograph capturing
This is a basic, easy and cheaper method to find out the sedimentation of suspensions.
After the preparation of nanofluids, some percentages of the particles will be inside a test
tube or bottle (the bottles need to be clear enough so that the fluid inside could easily be
captured by camera). Usually, photos can be captured after certain period of time. From
the captured photo, sedimentation of suspension can be compared. Peng et al. (2009) used
this method to measure the stability of methanol based nanofluids. In this study, this
sediment photograph capturing method has been successfully implemented.
2.4.2 UV-Visible spectrophotometer
Generally, UV–Visible spectrophotometer quantitatively illustrates the colloidal stability
of nanofluids. A UV–Visible spectrophotometer exhibits that the light shows different
intensity during the absorption and scattering of it during travelling through a fluid.
Normally, the stability of nanofluid is determined by measuring the sediment volume
versus the sediment time. Nevertheless, this method is not suitable for nanofluids with
high concentration of particles. Particularly for the case of nanofluids with CNT
nanoparticles, the dispersions are dark enough to distinguish the sediment visibly. For the
first time, Jiang et al. (2003) investigated sedimentation estimation for nanofluids using

14
UV-Visible spectrophotometer. This method was used by Kim et al. (2007) and Lee et al.
(2009). To the best of author’s knowledge, there is no available literature for the evidence
of using UV-Visible spectrophotometer to characterize stability of methanol based
nanofluids. Furthermore, the author has used this method to characterize the methanol
based nanofluids.
2.4.3 Zeta potential and Zetasizer
Stabilization theory (Keblinski et al., 2005) states that increasing zeta potential, scientific
term for electro kinetic potential in colloidal system, results in high stability of the
suspension. It is also well known that electrostatic repulsion between the particles would
be increased in high absolute value of zeta potential (Yu et al., 2010). Stability of
methanol based nanoluids has been inspected by Pang et al. (2012) using zeta potential
test. Figure 2.4 shows the zeta potential of methanol based nanofluids as a function of
volume fraction and it is clear that the zeta potential vale increase with increasing volume
fraction except 0.5 vol%. The zeta potential value of Al2O3-methanol nanofluids is over
60 mV and for SiO2-methanol is over 30 mV. If the zeta potential value is over 30 mV
the nanofluid considered that the fluid becomes stable (Lee et al., 2008).
Figure 2.4: Zeta potential of methanol nanofluids as a function of nanoparticle volume
fraction (Pang et al., 2012)
-80
-60
-40
-20
0
20
40
60
80
100
0.001 0.01 0.1 1
Zet
a p
ote
nti
al (
mV
)
Volume fractionof nanoparticles (vol%)
Al2O3-methanol
SiO2-methanol
Al2O3‒methanol
SiO2‒methanol

15
Vandsburger (Maı̈Ga et al., 2004) tabulated different values of zeta potential in mV and
stated stability situation of the suspension in any specific zeta potential value which can
be observed from Table 2.2.
Table 2.2: Zeta potential absolute value and stability
Zeta potential [(Absolute value (mV)] Stability
0 Little or no stability
15 Some stability but settling lightly
30 Moderate stability
45 Good stability, possible settling
60 Very good stability, little settling
likely
Pang et al. (2012) declared that preparation of stable nanofluid would strongly depend on
particle size. Moreover, base fluid and particle should be chosen in such a way that density
difference of them would be kept as less as possible. Increasing viscosity of base fluid
would be another way to increase stability of particle. Figure 2.5 demonstrates that the
particle size of methanol based nanofluids as a function of volume fraction. From figure,
it can be seen that the particle size of Al2O3-methanol keeps at a value range form 120-
148 nm and the value from 280-410 nm for SiO2-methanol nanofluids. In the nanofluids
nanoparticle are contracted with each other and make a cluster and the cluster size is
larger than the particle size.

16
Figure 2.5: Particle size of methanol based nanofluids as a function of nanoparticle
volume fraction (Pang et al., 2012)
2.5 Thermophysical properties of nanofluids
This section is divided into three subsections according to the methodology to measure
thermal conductivity, viscosity, and density of methanol based nanofluids.
2.5.1 Thermal conductivity of nanofluids
The increment of thermal conductivity by nanofluids compare to the base fluids is one of
the major issues which attracts researchers to practice on it. Measuring thermal
conductivity is a challenge for a long time since different methods and techniques
presented different results. On comparing the effect of nanofluid density and specific heat
capacity, thermal conductivity and viscosity on heat transfer play key role in enhancing
heat transfer. Therefore, it is important to understand the theoretical studies and
experimental studies carried out on nanofluid thermal conductivity and viscosity.
2.5.1.1 Theoretical study on thermal conductivity
In 1873, an equation has been derived by Maxwell (1873) to calculate the effective
thermal conductivity of solid-liquid mixtures consisting of spherical particles and
showed its dependence on the temperature and pressure. Further, the idea of Maxwell
has been utilized to develop the thermal conductivity models. These models are named
as Classical models. Many researchers have modified the classical models by
incorporating the mechanism for thermal conductivity enhancement such as Brownian
-100
0
100
200
300
400
500
0.001 0.01 0.1 1
Par
ticl
e si
ze (
nm
)
Volume fraction of nanoparticles (vol%)
SiO2-methanol
Al2O3-mehanol
SiO2‒methanol
Al2O3‒methanol

17
motion, clustering, and shape and size of nanoparticles. These models are named as
models derived from classical models. Therefore, the nanofluid thermal conductivity
models are classified into two main types: Classical models and Models derived from
classical models. The gist of classical thermal conductivity models has been discussed
here.
The prediction about the thermal conductivity of a continuum medium with well-
dispersed solid-liquid mixtures has been made using the models given by Maxwell
(1873), Hamilton-Crosser (HC) (1962), Bruggeman (1935) and Wasp et al. (1977) are the
Classical models. For these classical models, some assumptions have been made on
nanoparticles having no bulky movement in the basefluids as well as the solid particles
are composite in the basefluids. The classical models considered the conduction is the
mode for enhanced thermal conductivity. Therefore, classical models are named as static
models or structural models. Table 2.3 lists out the classical models developed for
determining the nanofluid thermal conductivity.
Table 2.3: List of Classical models for nanofluid thermal conductivity
Researchers Thermal conductivity model Factors considered
Maxwell
(1873)
)(2
)(22
npbfbfnp
npbfbfnp
bf
nf
kkkk
kkkk
k
k
Based on effective
Medium theory
[EMT], randomly
dispersed, and
uniform sized
spherical particles.
Hamilton –
Crosser (HC
model)
(1962)
)()1(
)()1()1(
npbfbfnp
npbfbfnp
bf
nf
kkknk
kknknk
k
k
Applicable for
spherical and
cylindrical particles.
Developed by using
shape factor, n.
Bruggeman
model (1935)
4
])32()13[(4
1 bf
bfnpnf
kkkk
bf
np
bf
np
k
k
k
k22
2
99223213
For a binary mixture
of homogeneous
spherical and
randomly dispersed
nanoparticles.
Particles interaction
taken into account.
No limitations for
particle volume
concentration.
18
Table 2.3 continued
Researchers Thermal conductivity model Factors considered
Wasp model
(197)
)(2
)(22
npbfbfnp
npbfbfnp
bf
nf
kkkk
kkkk
k
k
Considered shape
factor as unity. Not
valid for spherical
particles.
According to the literature, the prediction cannot be made upon the thermal conductivity
of nanofluids by using these classical models. The main reasons behind it exhibit that the
effect of temperature and particle size, interfacial layer between particle/fluids, particle
distribution and cluster, aggregate and Brownian motion of particles were not considered
in the classical models. Consecutively, the thermal conductivity models have been
developed by considering the factors which were not considered by Classical models.
Few of the thermal conductivity models developed by the researchers have been given in
the forthcoming section. Table 2.4 lists out few of the widely used models proposed by
modifying the classical models for determining the nanofluid thermal conductivity.
Table 2.4: List of nanofluid thermal conductivity models derived from Classical models
Researchers Thermal conductivity model Factors considered
Pak and Cho
(1998) 47.71
bf
nf
k
k
Under the assumption
that the dispersion of
suspended
nanoparticles cause
the enhancement of
thermal conductivity.
Yu and Choi
(2003) 3)1)((2
)1)((22
bfnpnfnp
nfnpbfnp
bf
nf
kkkK
kkkk
k
k
Inclusion of
interfacial layer and
modified Maxwell
model
Bhattacharya
et al. (2004) bfnp
bf
nfkk
k
k)1(
Inclusion of
combined base fluids
and nanoparticle
thermal
conductivities.
Shukla and
Dhir (2005)
)(2
)(22
bfnpfnp
bfnpfnp
bf
nf
kkkk
kkkk
k
k
4
)(
ka
TTC o
Based on
macroscopic model,
Brownian motion and
set the lower limit for
brown motion.
19
Table 2.4 continued
Researchers Thermal conductivity model Factors considered
Li and
Peterson
(2006)
4621417.001868867.0764481.01 Tk
k
bf
nf
303734.001924.06108.31 Tk
k
bf
nf
Temperature
dependent model and
valid for 27 ºC -36ºC
and valid for
Al2O3/water,
CuO/water and
nanofluids
Timofeeva et
al. (2007) 31
bf
nf
k
k
Based on effective
medium theory for
Al2O3 nanofluids
with the effect of
agglomeration.
Chandrasekar
et al. (2009)
)()1()1(
)()1)(1()1(3
3
bfnpfnp
bfnpfnp
bf
nf
kkknk
kknknk
k
k
4
)(
ka
TTC o
Developed by
macroscopic model
of HC and inclusion
of Brownian motion
with respect to
temperature.
Chandrasekar
et al. (2010)
126.035.1023.0
,
nf
nf
p
nfp
bf
nf
M
M
c
c
k
k
Based on the
prediction of thermal
conductivity of water
and the molecular
weight of
nanoparticle and base
fluids.
abbaspoursani
et al. (2011) .....1 "
RR
T
T
dm
k
k
enpbf
nf
Accounts for the
interfacial shell,
Brownian motion,
and aggregation of
particles.
Shames et al.
(2012) dynamicstatic
bf
nfkk
k
k
By assuming the
nanoparticles are st
different sizes.
Considered the effect
of nanolayer.
Mallick et al.
(2013)
017.0
38.034.0035.0Re
PrPr35.0
BRnp
np
bfnp
bf
nf
Nk
k
By employing
Prandtl, Reynolds,
Brinkman numbers,
effects of micro-
convection, localized
turbulence.
2.5.1.2 Experimental study on thermal conductivity
Many experimental works have been carried out to measure the thermal conductivity.
This is because the predicted thermal conductivity results are not consistent for a
particular nanofluid. Most of the investigators used Transient Hot Wire (THW) technique
to measure the thermal conductivity of nanofluids. Table 2.5 lists out few of the widely
referred experimental results of nanofluid thermal conductivity.

20
Table 2.5: List of experimental studies on nanofluid thermal conductivity
Investigators Nanoparticles/Base
fluids
Particle
Volume
concentration
(%)
Maximum
thermal
conductivity
enhancement
(%)
Consideration
Masuda et al.
(1993)
Al2O3 / Water 1.30–4.30 32.4 31.85ºC –
86.85ºC TiO2/Water 3.10–4.30 10.8
Lee et al.
(1999)
Al2O3/Water 1.00–4.30 10
Room
Temperature Al2O3/ EG 1.00–5.00 18
TiO2/Water 0.50–5.00 33
Xie et al.
(2002)
Al2O3/Water/ EG 5.00 23 Room
Temperature Al2O3 / EG
5.00 29
Das et al.
(2003) Al2O3/Water 1.00–4.00 38.4 24 ºC-36 ºC
Li and
Peterson
(2006)
Al2O3/Water 2.00–10.00 29 27.5ºC – 34.7ºC
Beck et al.
(2009)
Al2O3/Water
Al2O3/ EG
1.86–4.00
2.00–3.01
20
19
Effect of
particle size
Mintsa et al.
(2009) Al2O3/Water 0–8 31 20ºC – 48ºC
Turgut et al.
(2009) TiO2/Water 0.2–3.0 7.4 13ºC – 55ºC
Chandrasekar et
al. (2010) Al2O3/Water 0.33-5 24
Effect of
particle volume
fraction
Vajjha and Das,
(2009) Al2O3/Water 1–4 2-16 1 to 40ºC
Pang et al.
(2012)
Al2O3/methanol
0.005-0.5
10.74
20 ºC
SiO2/methanol 14.29
Pang et al.
(2013) Al2O3/methanol/NaCl
10wt% NaCl, 40
vol% methanol
and 0.1 vol%
6.34 20 ºC
However, the authors noted that higher temperatures shows significant discrepancy
during thermal conductivity measurements. Natural convection effect in the transient hot-
wires method is the main cause of this discrepancy. Ju et al. (2008) showed that the
transient hot-wire method can give erroneous results if the measurements are carried out

21
just after the sonication. This is because the sonication increases temperature of the
nanofluid sample. Due to the above mentioned factor, almost same results were found
during the thermal conductivity measurement by (Li et al., 2008) and (Ju et al., 2008).
Another important reason for discrepancy in experimental data is the clustering of
nanoparticles (Hong et al., 2006). There are several parameters on which the level of
clustering is dependent. To increase the dispersion and stability along with preventing
clustering to some extent, some surfactants can be added as well as the adjustment should
be done for the pH value of the nanofluids (Wang et al. 2009). Hence, during experiments,
the type as well as the amount of the additives along with the pH value of the samples
should be considered.
Many researchers have revealed the factors which increase or decrease the thermal
conductivity of nanofluids. Some of the investigations and suggested factors have been
discussed in this section. The major factors which affect the nanofluid thermal
conductivity are a) Particle volume concentration, b) Particle materials, c) Brownian
Motion, d) Nanoparticle size, e) Particle shape/surface area, f) Temperature, g) Basefluid
materials, and h) pH value. The summary of important conclusions on nanofluid thermal
conductivity proposed by the researchers are: a) the thermal conductivity increases with
increasing particle volume concentration, b) the thermal conductivity enhancement of
metal nanoparticles is higher than the oxide nanoparticles, c) higher the Brownian motion
the higher thermal conductivity enhancement, d) smaller nanoparticles are better for
stability and enhancement of thermal conductivity, e) the rod-shaped particles thermal
conductivity is higher than the spherical nanoparticles, f) the thermal conductivity
increases with increasing temperature g) the nanofluid with water and ethylene glycol
mixture have good potential applications in cooling applications, and h) pH value affects
the thermal conductivity.

22
2.5.1.2.(a) Effect of volume fraction on thermal conductivity of nanofluids
It is well known that the thermal conductivity increases with increasing the volume
faction of nano particle. Figure 2.6 shows that thermal conductivity increases with the
enhancement of volume fraction. From the figure it is seen that, in most cases experimental
thermal conductivity increases abruptly (Murshed et al., 2008; Pang et al., 2012).
Figure 2.6: Thermal conductivity versus particle volume fraction
2.5.1.2.(b) Influence of temperature on thermal conductivity of nanofluids
Besides, it is found that the thermal conductivity increases accordingly with the
temperature of the nanofluids. This would be a good reason to apply nanofluids in heat
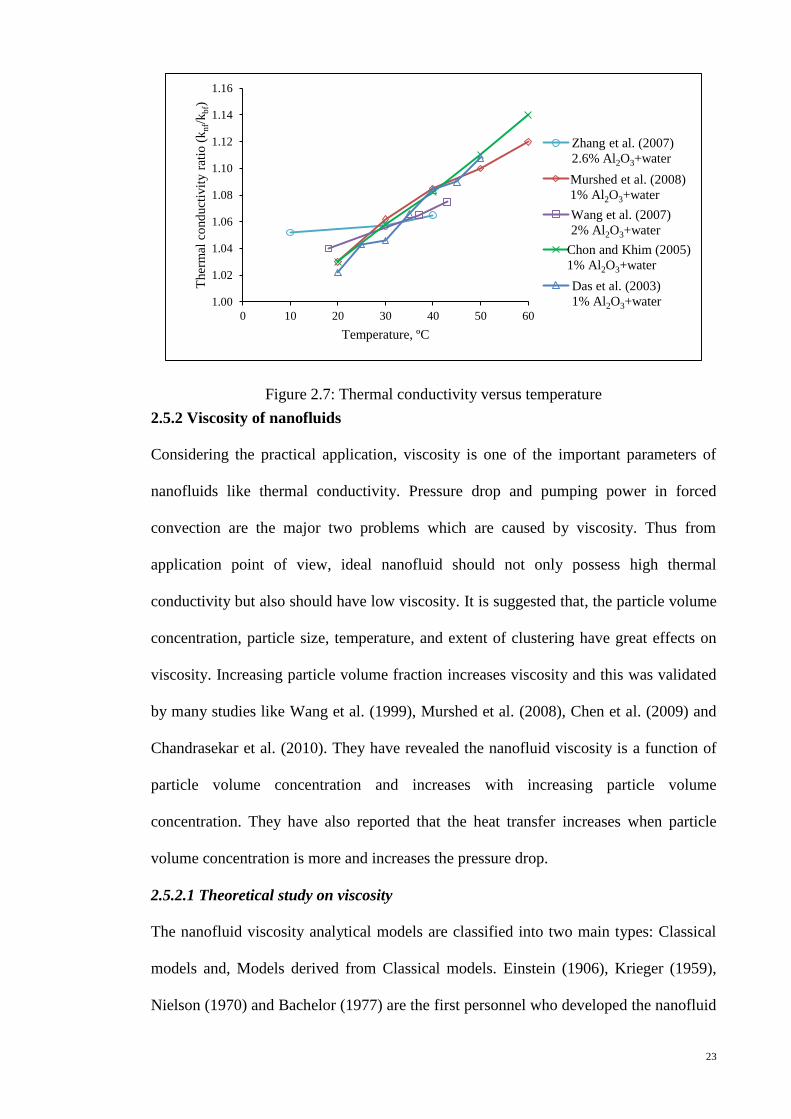
exchangers. Figure 2.7 shows that thermal conductivity augmented accordingly with the
increase of temperatures.
0.8
0.9
1.0
1.1
1.2
1.3
0.001 0.01 0.1 1 10
Ther
mal
co
nd
uct
ivit
y (
knf/
kbf)
Volume fraction, vol%
Murshed et al. (2008)
TiO2+EG
Murshed et al. (2008)
Al2O3+W
Pang et al. (2008)
SiO2+M
Pang et al. (2012)
Al2O3+M
Murshed et al. (2008)
TiO2+Ethylene Glycol
Murshed et al. (2008)
Al2O3+water
Pang et al. (2012)
SiO2+methanol
Pang et al. (2012)
Al2O3+methanol
23
Figure 2.7: Thermal conductivity versus temperature
2.5.2 Viscosity of nanofluids
Considering the practical application, viscosity is one of the important parameters of
nanofluids like thermal conductivity. Pressure drop and pumping power in forced
convection are the major two problems which are caused by viscosity. Thus from
application point of view, ideal nanofluid should not only possess high thermal
conductivity but also should have low viscosity. It is suggested that, the particle volume
concentration, particle size, temperature, and extent of clustering have great effects on
viscosity. Increasing particle volume fraction increases viscosity and this was validated
by many studies like Wang et al. (1999), Murshed et al. (2008), Chen et al. (2009) and
Chandrasekar et al. (2010). They have revealed the nanofluid viscosity is a function of
particle volume concentration and increases with increasing particle volume
concentration. They have also reported that the heat transfer increases when particle
volume concentration is more and increases the pressure drop.
2.5.2.1 Theoretical study on viscosity
The nanofluid viscosity analytical models are classified into two main types: Classical
models and, Models derived from Classical models. Einstein (1906), Krieger (1959),
Nielson (1970) and Bachelor (1977) are the first personnel who developed the nanofluid
1.00
1.02
1.04
1.06
1.08
1.10
1.12
1.14
1.16
0 10 20 30 40 50 60
Ther
mal
co
nd
uct
ivit
y r
atio
(k
nf/
kbf)
Temperature, ºC
Zhang et al. (2007) 2.6%
Al2O3+W
Murshed et al. (2008)
1% Al2O3+W
Wang et al. (2007) 2%
Al2O3+W
Chom and Kihm (2005)
1% Al2O3+W
Das et al. (2003) 1%
Al2O3+W
Zhang et al. (2007)
2.6% Al2O3+water
Murshed et al. (2008)
1% Al2O3+water
Wang et al. (2007)
2% Al2O3+water
Chon and Khim (2005)
1% Al2O3+water
Das et al. (2003)
1% Al2O3+water

24
viscosity model. These models are based on the assumption of dilute, suspended,
spherical particles and no interaction between the nanoparticles. These are valid only for
relatively low particle volume concentration. This is the motivation for developing
nanofluid viscosity model for higher particles volume concentration. Table 2.6 lists out
the classical viscosity models proposed by different researchers.
Table 2.6: List of classical models for nanofluid viscosity
Researchers Nanolfuid viscosity model Factors considered
Einstein
(1906)
5.21
bf
nf
Valid for spherical particles of low
particle volume fraction 0.02.
Krieger and
Dougherty
[K-D]model
(1959)
m
m
np
bf
nf
1
Based on randomly mono-dispersed
spheres. Valid for maximum
close packed particles of 0.64.
Nielson
(1970 ) m
np
enp
bf
nf
1
5.11
Power law model and more
appropriate for particle volume
fraction more than 0.02.
Bachelor
(1977)
25.65.21
bf
nf
Considered the effect of
Brownian motion
Many nanofluid viscosity models have been developed by modifying the classical models
by different investigators. Few of the widely used models have been listed in Table 2.7.
Table 2.7: List of nanofluid viscosity models derived from classical models
Researchers Nanolfuid viscosity model Factors considered
Brinkman
(1952) 5.21
1
bf
nf
Formulated by two
corrections of Einstein’s
model.
Pak and Cho
(1998 )
29.53311.391
bf
nf
Developed by taking the
room temperature as
reference.
Wang et al.
1999)
21233.71
bf
nf
Particle volume fraction is
the key factor for improved
viscosity.
Tseng and
Li (2003)
98.3547.13 e
bf
nf
Developed for
TiO2/water nanofluids
Maiga et al.
(2004) 13.7123 2
bf
nf
Derived for Al2O3 /water
nanofluids.
25
Table 2.7 continued
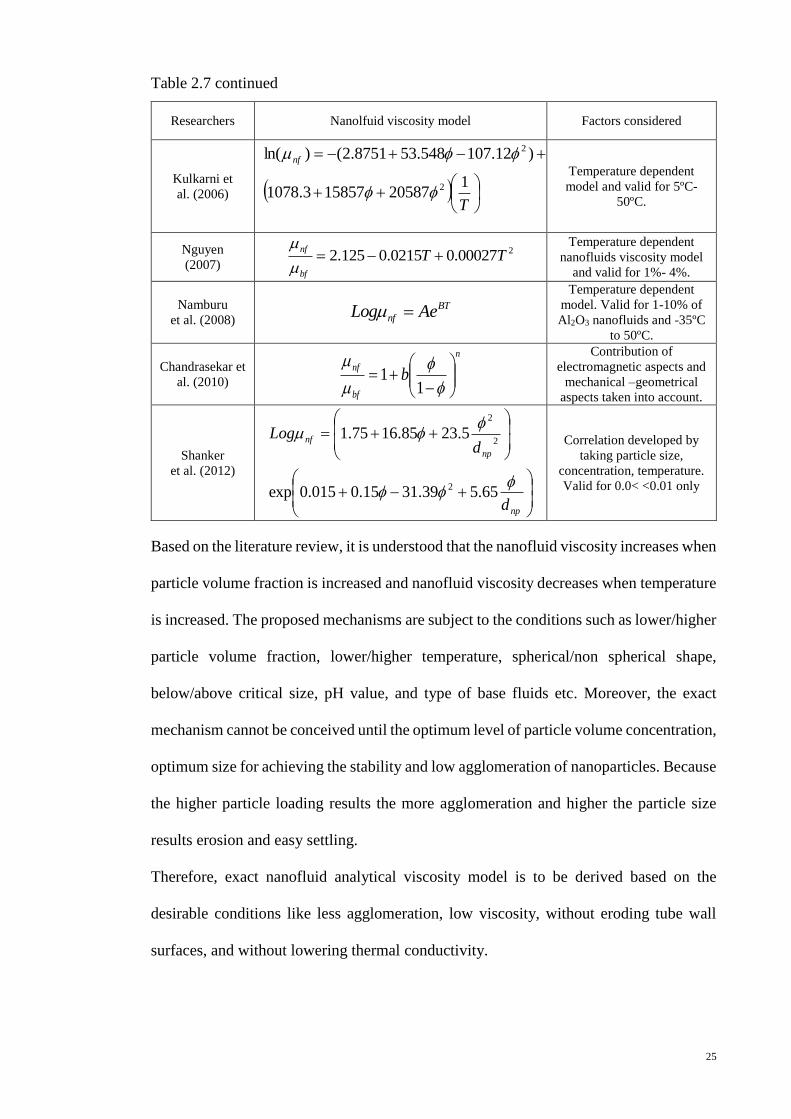
Researchers Nanolfuid viscosity model Factors considered
Kulkarni et
al. (2006)
T
nf
120587158573.1078
)12.107548.538751.2()ln(
2
2
Temperature dependent
model and valid for 5ºC-
50ºC.
Nguyen
(2007)
200027.00215.0125.2 TTbf
nf
Temperature dependent
nanofluids viscosity model
and valid for 1%- 4%.
Namburu
et al. (2008)
BT
nf AeLog
Temperature dependent
model. Valid for 1-10% of
Al2O3 nanofluids and -35ºC
to 50ºC.
Chandrasekar et
al. (2010)
n
bf
nfb
11
Contribution of
electromagnetic aspects and
mechanical –geometrical
aspects taken into account.
Shanker
et al. (2012)
np
np
nf
d
dLog
65.539.3115.0015.0exp
5.2385.1675.1
2
2
2
Correlation developed by
taking particle size,
concentration, temperature.
Valid for 0.0< <0.01 only
Based on the literature review, it is understood that the nanofluid viscosity increases when
particle volume fraction is increased and nanofluid viscosity decreases when temperature
is increased. The proposed mechanisms are subject to the conditions such as lower/higher
particle volume fraction, lower/higher temperature, spherical/non spherical shape,
below/above critical size, pH value, and type of base fluids etc. Moreover, the exact
mechanism cannot be conceived until the optimum level of particle volume concentration,
optimum size for achieving the stability and low agglomeration of nanoparticles. Because
the higher particle loading results the more agglomeration and higher the particle size
results erosion and easy settling.
Therefore, exact nanofluid analytical viscosity model is to be derived based on the
desirable conditions like less agglomeration, low viscosity, without eroding tube wall
surfaces, and without lowering thermal conductivity.

26
2.5.2.2 Experimental study on viscosity
The research groups Pak and Cho (1998), Das et al. (2003), Kulkarni et al. (2006), Liu et
al. (2006), and Chandrasekar et al. (2010) experimentally measured the viscosity of
different nanofluids. They have suggested that the experimental viscosity data is higher
than the predicted viscosity. Nevertheless, the general trend is that the viscosity increases
with increasing particle volume concentration. Nguyen et al. (2007) observed increasing
viscosity with increasing particle size. Nguyen et al. (2007), and Longo & Zilio (2011)
analyzed the effect of temperature on viscosity and observed a decrease in viscosity with
increasing temperature.
The researchers have presented that the measured viscosity values slightly deviates from
the calculated values. However, at present, it is difficult to obtain a consistent set of
experimental data for nanofluids that covers a wide range of particle size and particle
volume concentration. Table 2.8 lists out few of the widely referred experimental results
of nanofluid viscosity.
Table 2.8: List of experimental studies on nanofluid viscosity
Researchers Nanoparticles/Base
fluids
Particle
Volume
concentration
(%)
Maximum
Viscosity
increases
(%)
Consideration
Masuda et al.
(1993) TiO2/Water 1‒ 4.3 11 ‒ 60
31.85 ºC –
86.85 ºC
Wang et al.
(1999) Al2O3/EG 1.2 ‒ 3.5 7 ‒ 39
Room
temperature
Prasher et al.
(2006) Al2O3/PG 0.5 ‒ 3 7 ‒ 29
various shear
rates,
temperature,
nanoparticle
diameter, and
nanoparticle
volume fraction
Chevalier et al.
(2007) SiO2/Ethanol 1.2 ‒ 5 15 ‒ 95
Different particle
sies
Murshed et al.
(2008a)
Al2O3/DIW 1 ‒ 5
4 ‒ 82 20–60 ºC.
TiO2/DIW 24 ‒ 86
Nguyen et al.
(2008; 2007) Al2O3/Water 1 ‒ 13 12 ‒ 430 Up to 75 ºC.
Chen et al.
(2009b) TiO2/Water 0.25 ‒ 1.2 3 ‒ 11 20–60 ºC

27
Table 2.8 continued
Researchers Nanoparticles/Base
fluids
Particle
Volume
concentration
(%)
Maximum
Viscosity
increases
(%)
Consideration
Duangthongsuk
and Wongwises
(2009)
TiO2/Water 0.2 ‒ 2 4 ‒ 15 15 ºC to 35 ºC
Turgut et al.
(2009) TiO2/Water 0.2 ‒ 3 4 ‒ 135 13 ºC – 55 ºC
Chandrasekar et
al. (2010) Al2O3/Water 1 ‒ 5 14 ‒ 136
Effect of particle
volume fraction
Lee et al. (2011) SiC/DW 0.001 ‒ 3 1 ‒ 102 pH of 11
Kim et al. (2014) Al2O3/methanol 0.00‒ 0.010 11 20 ºC
2.5.2.2.(a) Viscosity of nanofluids as a function of volume fraction
Most of the available literatures about viscosity of nanofluids show that viscosity of
nanofluids increases accordingly with the augmentation of the volume concentrations.
For example, for 12 volume concentration (%) of Al2O3 with water, viscosity increased
5.3 times (Nguyen et al., 2008), and for 12 volume concentration (%) of TiO2 with water
viscosity increased 1200 times (Tseng & Lin, 2003). Seemingly, viscosities of metal
oxide based nanofluids have been broadly investigated and Al2O3 and TiO2 related
literatures are foremost among the accessible literatures on viscosity of nanofluids. The
graphical representations of viscosity of nanofluids with Al2O3 and TiO2 nanoparticles
have been presented in Figure 2.8.
Figure 2.8: Viscosity increases with the increase of particle volume fraction
0.5
0.7
0.9
1.1
1.3
1.5
1.7
1.9
2.1
0 0.01 0.02 0.03 0.04 0.05
Rel
ativ
e vis
cosi
ty,
(μn
f/μ
bf)
Volume fracction, vol%
Murshed et al. (2008)
TiO2+W
Murshed et al. (2008)
Al2O3+W
Masuda et al . (1993)
TiO2+W
Chevalier et al. (2007)
SiO2+EG
Wang et al. (1999)
Al2O3+W
Murshed et al.
(2008) TiO2+water
Murshed et al.
(2008) Al2O3+water
Masuda et al.
(1993) TiO2+waterChevalier et al.
(2007) SiO2+
Ethylene glycolWang et al. (1999)
Al2O3+water

28
2.5.2.2.(b) Effect of temperature on viscosity of nanofluids
There are some literatures available on the effect of temperature over viscosity of
nanofluids. Available literatures show, the researchers’ agreement over the fact that,
viscosity of nanofluid increases with the intensification of volume fraction. On the other
hand, there are debates about the effect of temperature over viscosity of nanofluids. Most
of the researchers showed that, viscosity of nanofluids decreases with the increase of
temperature like the viscosity of most of the base fluids decreases with the increase of
temperature. However, some of the researchers argued that, viscosity of nanofluids is
independent of temperature (Prasher et al., 2006). Figure 2.9 shows viscosity of
nanofluids decreases with the increase of temperature.
Figure 2.9: Viscosity increases with the increase of temperature
2.5.3 Density of nanofluids
Density of fluid is an important thermophysical property. Like viscosity, density of any
fluid also has direct impact over pressure drop and pumping power. There are some
literatures available about density of nanofluids. Still, there is no literature available on
density of methanol based nanofluids. However, Sommers et al. (2010) observed a linear
relationship between density and particle concentration for Al2O3–propanol nanofluid.
Correspondingly, Teng et al. (2010) found that the density of alumina Al2O3–water
0.0
0.5
1.0
1.5
2.0
2.5
3.0
3.5
4.0
4.5
0 10 20 30 40 50
Rel
ativ
e vis
cosi
ty (
μnf/
μbf)
Temperature, ºC
Nguyen et al. (2008) 9%
Al2O3+W
Turget et al. (2009) 3%
TiO2+W
Anoop et al. (2009) 6%
Al2O3+W
Mahbubul et al. (2012)
0.5% TiO2+R
Nguyen et al. (2008)
9% Al2O3+water
Turget et al. (2009)
3% TiO2+water
Anoop et al. (2009)
6% Al2O3+water
Mahbubul et al. (2012)
0.5% TiO2+refregerant

29
nanofluid increased with volume concentrations (0.5–1.5 wt %) and decreased with
increase in temperature (10–40 ºC). Elias et al. (2014) showed that the density of
nanofluids increases with the rising of volume fraction. Ho et al. (2010) compared the
measured and predicted density of nanofluid at a constant temperature and different
volume fraction with mixing theory. Figure 2.10 shows the relationship among volume
fraction and density of nanofluids.
Figure 2.10: Density increases with the increase of particle volume fraction
Mariano et al. (2013) experimented the density of SnO2-EG nanofluids at different
temperature and pressure and described the nanofluids density characterization as, it
increases with the increases of particle volume fraction and pressure however decreases
in temperature. Figure 2.11 shows the density increases with the increase of temperature.
0
200
400
600
800
1000
1200
1400
1600
0.1 1 10
Den
sity
, K
g/m
3
Volume fraction, vol%
Elias et al. (2014)
Al2O3+RC
Vajjah et al. (2012)
Al2O3+EG
Teng et al. (2012)
Al2O3+W
Sommers et al. (2010)
Al2O3+P
Elias et al. (2014)
Al2O3+rediator coolantVijjah et al. (2012)
Al2O3+Ethylene glycol
Teng et al. (2012)
Al2O3+water
Sommers et al. (2010)
Al2O3+propanol

30
Figure 2.11: Density increases with the increase of temperature
2.6 Summary of literature review
Most of the available literatures about methanol based nanofluids are about CO2
absorption performance, thermal conductivity measurement and energy performance of
HVAC system. This study has mainly focused on the analysis about preparation,
characterization, stability, thermal conductivity, viscosity and density of methanol based
nanofluids. The summary of available literature about methanol based nanofluids is
shown in Table 2.9.
Table 2.9: Summary of the available literature about methanol based nanofluids
Reference Nanofluids Findings
Firouzfar et al.
(2011) CH3OH-Ag
Energy saving around 8.8‒31.5% for cooling and 18‒
100% for reheating the supply air stream in HVAC
system.
Lee et al.
(2011)
CH3OH-SiO2 and
Al2O3
CO2 absorption rate enhanced up to 4.5% at 0.01 vol% of
Al2O3/methanol at 20 oC, and 5.6% at 0.01 vol% of
SiO2/methanol at -20 oC
Jung et al.
(2012) CH3OH-Al2O3
CO2 absorption rate enhanced up to ~8.3% compare to
pure methanol
Pineda et al.
(2012)
CH3OH-SiO2 and
Al2O3
CO2 maximum enhancement absorption rates of 9.4% and
9.7% for Al2O3 and SiO2 particles ( compare to pure
methanol) respectively
Pang et al.
(2012)
CH3OH-SiO2 and
Al2O3
Thermal conductivity enhancement up to 10.74% and
14.29% at the volume fraction of 0.05% for Al2O3 and
SiO2 nanoparticles, respectively.
Pang et al.
(2013)
CH3OH+ NaCl
aqueous solution +
Al2O3
Thermal conductivity enhancement up to 6.34% for 10
wt% NaCl, 40% vol% CH3OH and 0.1% vol% particle
concentration
Kim et al.
(2014) CH3OH-Al2O3
Mass transfer coefficient enhancement up to 26 % at 0.01
vol% compared with pure methanol
1000
1020
1040
1060
1080
1100
1120
1140
1160
1180
0 10 20 30 40 50
Den
sity
, K
g/m
3
Temperature, ºC
Elias et al. (2014) 1%
Al2O3+ RC
Pak & Choi (1998) 1%
Al2O3+EG
Vajjah et al. (2012) 1%
Al2O3+EG
Teng et al.( 2012) 1%
Al2O3+W
Elias et al. (2014) 1%
Al2O3+radiator coolant
Pak & Choi (1998) 1%
Al2O3+Ethylene glycol
Vajjah et al. (2012) 1%
Al2O3+Ethylene glycol
Teng et al. (2012) 1%
Al2O3+water

31
From the literature- it is evident that, there is very few study regarding methanol based
nanofluids. Most of the studies about methanol based nanofluids and nanofluids have
been done with metallic and nonmetallic oxide nanoparticles. Moreover, Al2O3, SiO2 and
TiO2 nanoparticles are most common and widely used in nanofluid. These oxides are
comparatively chemically stable. These are cheap and readily available as they are
produced industrially in large scale (Chen et al., 2007). Methanol is chosen as base fluid
as the freezing temperature of methanol is very low as -97 ºC in which temperature the
water would be freezing (Dincer & Kanoglu, 2010). Thus, methanol as a base fluid is a
very good choice for low temperature applications. The methanol also can be operated at
higher temperature than boiling point (64.7 ºC, 1atm) and it enhanced the mass transfer
(Kim et al., 2014). Therefore, these particles are used to analyze characterization,
nanofluids preparation and measure thermophysical properties of methanol based
nanofluids. To the best of authors’ knowledge, there are only few literatures about thermal
conductivity and no literature about viscosity and density of methanol based nanofluids.
As there is lack of information regarding methanol based nanofluid, this study aims to
minimize the gaps by preparing, characterizing, and analyzing thermal conductivity,
viscosity, density, and stability of methanol based nanofluids.

32
CHAPTER 3 : METHODOLOGY
3.1 Introduction
The aim of this chapter is to designate the materials, equipment, experimental settings
and to introduce various parameters that have been used to conduct the research. The
equations used in this research are also familiarized. The subsequent sections start with
description of the materials and their properties and brief information about the equipment
used. The sections are followed by preparation methods, characterization processes, and
the measuring procedure of thermophysical properties (e.g. thermal conductivity,
viscosity, and density). Flowchart of the experimental steps is presented in Figure 3.1.
Nano powder
Base fluid
Homogenizer
Nanofluid
XRD
SEM and EDS
TEM
Uv-vis
Spectroscopy
Zeta potential
meter
Thermal properties
analyzer
Programmable
rheometer
Density meter
Characterization
Stability analysis
Termophysical
properties database
Experiments Analysis
+
Ultrasonication
Manual mixing
Figure 3.1: Flowchart of experimental analysis
3.2 Experimental setup
This section is divided into materials and equipment that were used throughout this study.
3.2.1 Materials
Three nanoparticles named Al2O3, TiO2 and SiO2 have been used in this study for their
availability in the market and the sizes of all particles were small enough to apply classical

33
approach for thermophysical properties analysis. Table 3.1 shows the properties of Al2O3,
TiO2 and SiO2 nanoparticles. Each of the nanoparticles was purchased with different
sizes. Manufacturer defined size for Al2O3, TiO2, and SiO2 are ~13nm, ~21nm and
5~15nm respectively with a purity of 99.5%. All nanoparticles were purchased readily
from Sigma Aldrich (Malaysia).
Table 3.1: Properties of nanoparticles
Parameter Al2O3 SiO2 TiO2
Molecular mass (g/mol) 101.96 60.08 79.87
Average particle diameter (nm) ~13 5~15 ~21
Purity (%) 99.5 99.5 99.5
Density (kg/m3) 4000 2200 4260
Thermal conductivity (W/m K) 40.0 1.2 8.4
Methanol (CH3OH) with purity of 99.9% was purchased from R & M Chemical and used
as the base fluid. Table 3.2 shows the properties methanol at atmospheric pressure.
Table 3.2: Properties of Methanol
Parameter Methanol (Methyl Alcohol)
Chemical formula CH3OH
Molecular mass (g/mol) 32.04
Purity (%) 99.8
Acidity (mlN%) 0.02
Alkalinity (mlN%) 0.01
Melting point (ºC) -97.6
Boiling point (ºC) 64.7
Flash point (ºC) 11-12
Vapor pressure (kPa) 13.02
Parameter Methanol (Methyl Alcohol)
Density (kg/m3) 791.8
Viscosity (mPas) 0.59
Thermal conductivity (W/m K) 0.2040
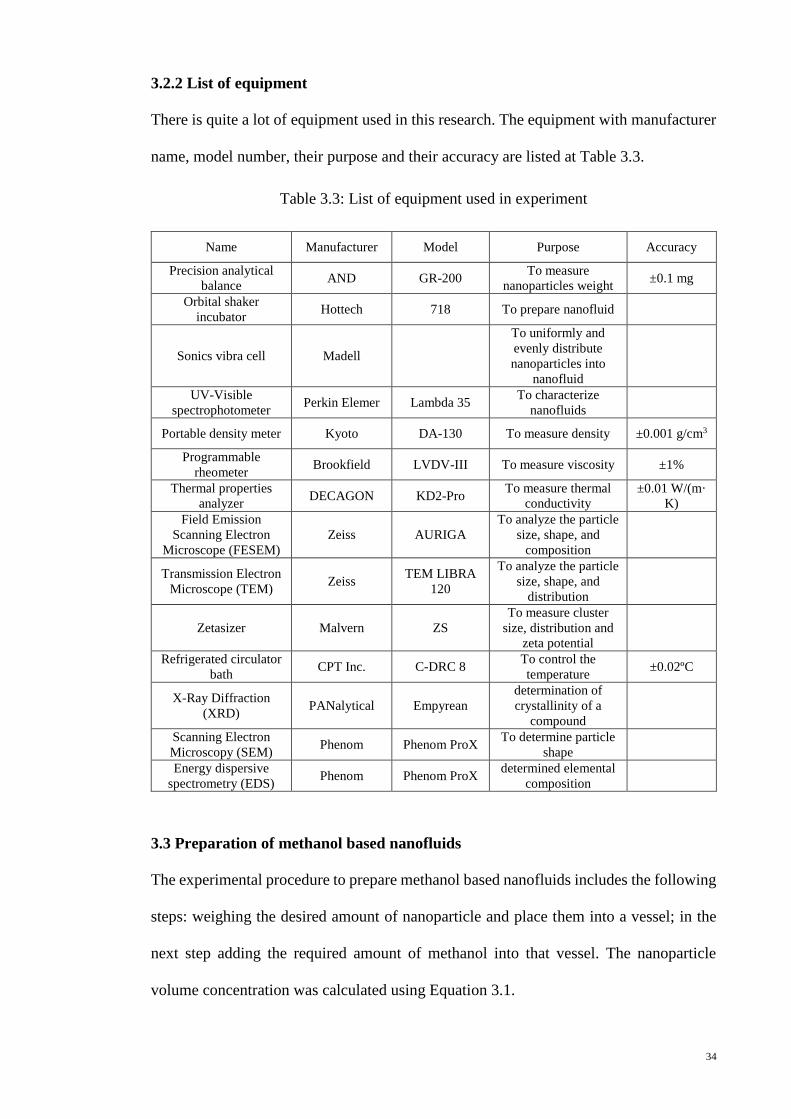
34
3.2.2 List of equipment
There is quite a lot of equipment used in this research. The equipment with manufacturer
name, model number, their purpose and their accuracy are listed at Table 3.3.
Table 3.3: List of equipment used in experiment
Name Manufacturer Model Purpose Accuracy
Precision analytical
balance AND GR-200
To measure
nanoparticles weight ±0.1 mg
Orbital shaker
incubator Hottech 718 To prepare nanofluid
Sonics vibra cell Madell
To uniformly and
evenly distribute
nanoparticles into
nanofluid
UV-Visible
spectrophotometer Perkin Elemer Lambda 35
To characterize
nanofluids
Portable density meter Kyoto DA-130 To measure density ±0.001 g/cm3
Programmable
rheometer Brookfield LVDV-III To measure viscosity ±1%
Thermal properties
analyzer DECAGON KD2-Pro
To measure thermal
conductivity
±0.01 W/(m·
K)
Field Emission
Scanning Electron
Microscope (FESEM)
Zeiss AURIGA
To analyze the particle
size, shape, and
composition
Transmission Electron
Microscope (TEM) Zeiss
TEM LIBRA
120
To analyze the particle
size, shape, and
distribution
Zetasizer Malvern ZS
To measure cluster
size, distribution and
zeta potential
Refrigerated circulator
bath CPT Inc. C-DRC 8
To control the
temperature ±0.02ºC
X-Ray Diffraction
(XRD) PANalytical Empyrean
determination of
crystallinity of a
compound
Scanning Electron
Microscopy (SEM) Phenom Phenom ProX
To determine particle
shape
Energy dispersive
spectrometry (EDS) Phenom Phenom ProX
determined elemental
composition
3.3 Preparation of methanol based nanofluids
The experimental procedure to prepare methanol based nanofluids includes the following
steps: weighing the desired amount of nanoparticle and place them into a vessel; in the
next step adding the required amount of methanol into that vessel. The nanoparticle
volume concentration was calculated using Equation 3.1.

35
Volume concentration, =
bf
bf
np
np
np
np
mm
m
(3.1)
Firstly, the nanoparticles were suspended into the base fluid (methanol) followed by
shaking in the incubator for 30 min 150 rpm. The mixture was disseminated afterwards
using an ultra-sonication homogenizer in order to distribute the nanoparticles evenly and
homogeneously. The sonication process was maintained at frequency of 20 KHz with
power equals to 500W and continued for 2h. Figure 3.2 shows the cluster size of
0.05vol% of Al2O3 concentration for different duration of ultrasonication time. The
cluster size found to be decreased with longer duration of sonication time. However, a
small change in the cluster size is observed after 100 min of total sonication time. Table
3.4 shows the experimental conditions of methanol based nanofluids.
Figure 3.2: Cluster size at different ultrasonication time (0.05vol% of Al2O3
concentration)
0
50
100
150
200
250
300
350
400
20 40 60 80 100 120
Clu
ster
siz
e, n
m
Time, min

36
Table 3.4: Experimental condition
Base fluid Methanol
Nanoparticle Al2O3 SiO2 TiO2
Nanoparticle size (nm) ~13 5~15 ~21
Nanoparticle type Spherical
Volume concentration (vol%) 0.005, 0.01, 0.05, 0.10 and 0.15
Shaking (@ 150rpm) Time [min] 30
Ultra‒sonicator
Time [min] 120
Power [W] 500
Frequency [kHz] 20
Pulse [s] 2
Term [s] 2
The limitation of preparing methanol based nanofluids by ultrasonication method is
demonstrated at Figure 3.3. Figure 3.3 (a) shows the beaker is filled with 0.05 volume
concentration (%) of A2O3-methanol, just before starting the ultra-sonication process.
From the figure it is obvious that, the level of liquid and solid mixture is 100 ml. Figure
3.3 (b) shows the level of mixture after 2h of ultra-sonication which is about 80 ml.
Approximately, 20ml of the methanol evaporated with the vibration of ultrasonic
amplitude. The same thing happened for SiO2-methanol and TiO2-methanol nanofluids.
Therefore, temperature control is an important factor for preparation of methanol based
nanofluids. In order to avoid evaporation, the temperature was maintained constant at 20
ºC using a thermal refrigerated bath during ultrasonication for methanol based nanofluids
preparation which is illustrated in Figure 3.4.

37
(a) Before ultrasonication (b) After 2h ultrasonication
Figure 3.3: Effect of evaporation on ultrasonication duration of Al2O3‒methanol (0.05
vol%) nanofluids (a) before ultrasonication (b) after 2h ultrasonication
Figure 3.4: Using thermal bath to control temperature during ultrasonication time to
prepare nanofluids
3.4 Characterization of nanoparticles and methanol based nanofluids
In order to apply nanofluids in practical situations, it is important to understand the
behavior of nanoparticles and nanofluids prepared from fundamental point of view in
order to apply nanofluids in practical situations. Therefore, the purchased dry
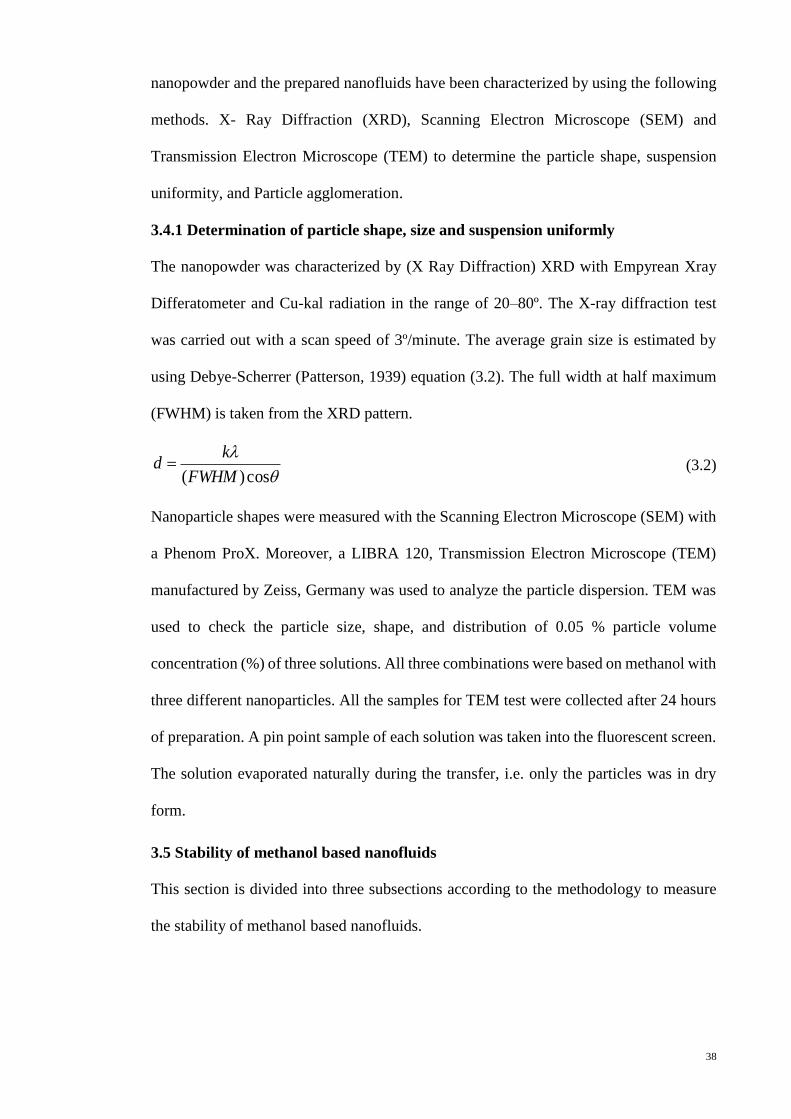
38
nanopowder and the prepared nanofluids have been characterized by using the following
methods. X- Ray Diffraction (XRD), Scanning Electron Microscope (SEM) and
Transmission Electron Microscope (TEM) to determine the particle shape, suspension
uniformity, and Particle agglomeration.
3.4.1 Determination of particle shape, size and suspension uniformly
The nanopowder was characterized by (X Ray Diffraction) XRD with Empyrean Xray
Differatometer and Cu-kal radiation in the range of 20–80º. The X-ray diffraction test
was carried out with a scan speed of 3º/minute. The average grain size is estimated by
using Debye-Scherrer (Patterson, 1939) equation (3.2). The full width at half maximum
(FWHM) is taken from the XRD pattern.
cos)(FWHM
kd (3.2)
Nanoparticle shapes were measured with the Scanning Electron Microscope (SEM) with
a Phenom ProX. Moreover, a LIBRA 120, Transmission Electron Microscope (TEM)
manufactured by Zeiss, Germany was used to analyze the particle dispersion. TEM was
used to check the particle size, shape, and distribution of 0.05 % particle volume
concentration (%) of three solutions. All three combinations were based on methanol with
three different nanoparticles. All the samples for TEM test were collected after 24 hours
of preparation. A pin point sample of each solution was taken into the fluorescent screen.
The solution evaporated naturally during the transfer, i.e. only the particles was in dry
form.
3.5 Stability of methanol based nanofluids
This section is divided into three subsections according to the methodology to measure
the stability of methanol based nanofluids.

39
3.5.1 Sediment photograph capturing
A Samsung digital camera was used to capture the photograph of methanol based
nanofluids. Photos of all nanofluids prepared by an orbital incubator shaker and
sonication were taken just after the preparation, and after seven (7) days to examine the
sedimentation and to validate the preparation method. The prepared methanol based
nanofluids were kept in closed glass bottle inside normal chamber of the domestic
refrigerator at temperature below 20 ºC to avoid evaporation.
3.5.2 UV-Visible spectrophotometer
In this investigation, the UV-Vis. spectrophotometer, Lambda 35 model, Perkin Elemer
make, absorption range of 190 nm to 1100nm was used to study the stability of nanofluid.
The inspection range is from 200 nm to 800nm. The U-V vis. spectrometer works under
the principal of Beer –Lamberts law. Beer –Lamberts law relates that an absorbance of
light and proportion of material through is passing. The lesser the suspended particles in
the solution makes the light absorption lesser.
In this method, the first step is to find the peak absorbance of the dispersed nanoparticles
at very dilute suspension by scanning. The relative stability measurement is followed by
preparing the desired concentration of nanofluid and keep aside for a couple of days.
Whenever it is needed to check the relative stability, the supernatant concentration is
measured by UV–Vis spectrophotometer and the absorbance is plotted against
wavelength.
3.5.3 Zeta potential and zetasizer
Zetasizer zs from Malvern was used to measure size distribution of nanoparticles in
nanofluids with a nanometer to several microns using dynamic light scattering. The same
zetasizer was also used to measure the zeta potential of nanofluids at different
concentrations of all methanol nanofluids using electrophoretic light scattering. To

40
evaluate the stability of nanoparticles inside the base fluid, Stokes law, suggesting an
equation for sedimentation velocity calculation of small spherical particles, states that:
)(9
2
bfnp
r
(3.3)
Buoyancy force, drag force and body force are acting on the suspended nanoparticles.
Among these three forces, buoyancy and drag forces are acting upward and resisting
against body force acting downwards resulting from gravitational attraction. As it was
mentioned earlier, higher suspension time is desired in nanofluids. Therefore, some
remedies can be offered extracting from Stokes law to improve the stability of nanofluids.
In order to decrease sedimentation velocity as much as possible, radius of particles should
be kept as small as possible. Since sedimentation velocity is proportional to square of
radius, reducing size of nanoparticles will lessen it dramatically.
3.6 Thermophysical properties of methanol based nanofluids
This section is divided into three subsections according to the methodology to measure
thermal conductivity, viscosity, and density of methanol based nanofluids.
3.6.1 Thermal conductivity measurement
The thermal conductivity measurement by steady-state methods is not suitable for liquids,
because it needs a longer time and the heat loss during this period cannot be quantified,
which may lead to large errors in results. Moreover, natural convection might take place
during this period causing an additional error in the results. In this study, thermal
conductivity was measured by using a KD2 pro thermal conductivity meter (Made by
Decagon, USA). This device measures thermal conductivity by transient hot wire method
over the range of 0.02–2.00 W/m K. The accuracy of the equipment is ±0.001% for
measurement within the mentioned range. Thermal conductivity of Al2O3–methanol,
SiO2–methanol and TiO2–methanol at various volume fractions (0.005%, 0.01%, 0.05%,
0.1% and 0.15%) was measured at temperatures of 1, 5, 10, 15 and 20 °C, respectively.
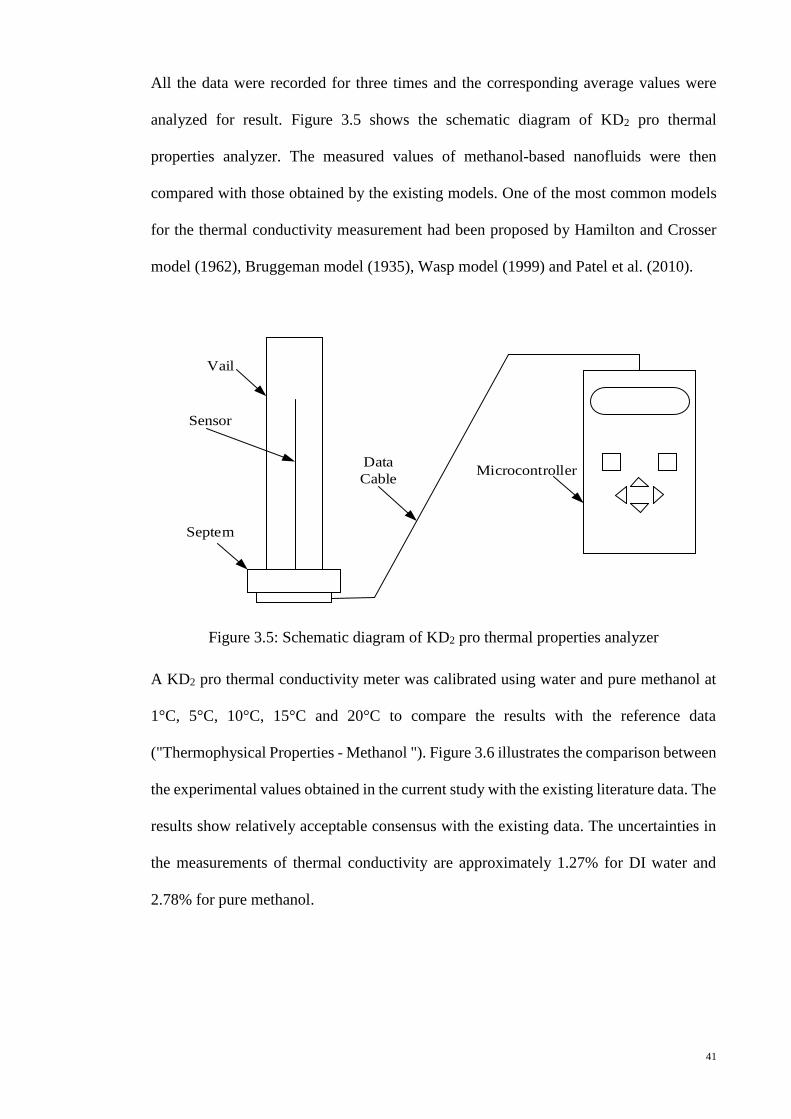
41
All the data were recorded for three times and the corresponding average values were
analyzed for result. Figure 3.5 shows the schematic diagram of KD2 pro thermal
properties analyzer. The measured values of methanol-based nanofluids were then
compared with those obtained by the existing models. One of the most common models
for the thermal conductivity measurement had been proposed by Hamilton and Crosser
model (1962), Bruggeman model (1935), Wasp model (1999) and Patel et al. (2010).
Vail
Sensor
Septem
MicrocontrollerData
Cable
Figure 3.5: Schematic diagram of KD2 pro thermal properties analyzer
A KD2 pro thermal conductivity meter was calibrated using water and pure methanol at
1°C, 5°C, 10°C, 15°C and 20°C to compare the results with the reference data
("Thermophysical Properties - Methanol "). Figure 3.6 illustrates the comparison between
the experimental values obtained in the current study with the existing literature data. The
results show relatively acceptable consensus with the existing data. The uncertainties in
the measurements of thermal conductivity are approximately 1.27% for DI water and
2.78% for pure methanol.

42
Figure 3.6: Thermal conductivity comparison with measured and reference data
3.6.2 Viscosity measurement
The viscosity of nanofluids was measured by the most widely used LVDV series-(LVDV
II, LVDV III and LVDV III ultra-programmable) Viscometer. To measure the viscosity
of low viscous fluids, these LV series are very suitable.
In this experiment, several parameters such as the viscosity and shear stress at different
shear rates, volume fractions and temperatures were measured by Brookfield (LVDV III
ultra-programmable) rheometer. In order to collect and store the measured data, a
computer was connected with the viscometer. The spindle of the viscometer was
submerged into the nanofluids. The viscous effect was developed against the spindle due
to deflection of calibrated spring with the help of Ultra Low Adapter (ULA). The viscosity
measurement range of this equipment is 0.1–6,000,000 mPa.s. In this experiment, the
viscosity and shear stress data of all samples were measured within a shear rate range of
61.15s−1 while the spindle rotation was 60 rpm.
The viscosity of Al2O3–methanol, SiO2–methanol and TiO2–methanol at various volume
fractions (0.005%, 0.01%, 0.05%, 0.1% and 0.15%) was measured at temperatures of 1,
5, 10, 15 and 20 °C, respectively. All data were recorded for three times and the
corresponding averaged values were plotted. The temperature was controlled by
0
0.1
0.2
0.3
0.4
0.5
0.6
0.7
0 5 10 15 20 25
Ther
mal
Co
nd
uct
ivit
y,
W/m
K
Temperature, °C
Referance data (DI
water)
Experimental data (DI
water)
Referance data
(Methanol)
Experimental data
(Methanol)

43
connecting a refrigerated circulating bath to the ULA attached with the rheometer. The
rheometer was connected with a computer where rheocalc 32 software had been installed
to obtain the rheological data of methanol based nanofluids. Schematic diagram of the
experimental set up is shown in Figure 3.7. After recording the all the data at least for
three times, the corresponding averages are plotted. Then the measured value of
viscosities for 0.01 to 0.15 vol.% of methanol based nanofluids at 20 °C were compared
with the existing familiar models as well as some previous experimental studies Einstein,
(1906), Brinkman (1952), Batchelor (1977) and Song et al. (2005). In
pu
t P
ipe
Ou
tpu
t P
ipe
Rheometer
Personal
Computer
Da
ta C
ab
le
Refr
iger
ate
d C
ircu
lar B
ath
Adapter
Temp.
Display
Figure 3.7: Schematic diagram of viscosity measurement
The viscosity of methanol was first measured to calibrate the experimental apparatus. The
viscosity was measured at temperature 1, 5, 10, 15 and 20 ºC and then compared with
reference data ("Thermophysical Properties - Methanol "). Figure 3.8 shows the
comparison between measured data obtained from experiment in this study with existing
literature data. The results show relatively acceptable consensus with the existing data.
The uncertainty in the measurement of viscosity is approximately 2.98%.

44
Figure 3.8: Viscosity comparison with measured and reference data
3.6.3 Density measurement
The density of methanol based nanofluids was measured by using a density meter, KEM-
DA 130N (Kyoto, Japan). This device measures a density in a range of 0 to 2000 kg/m3.
The accuracy of the equipment is ± 0.001% kg/m3. The density was measured at different
temperatures and volume concentrations in this study. All data were recorded for three
times and the mean values were considered to be plotted against temperature. There are
no experimental data available in the literature. Then the experimental results compared
with equation (3.13).
npbfnf 1 (3.13)
The density meter was calibrated using water and pure methanol at 1°C, 5°C, 10°C, 15°C
and 20°C comparing the results with the reference data ("Thermophysical Properties -
Methanol "). Figure 3.9 shows the comparison between the experimental values obtained
in the current study with the existing data in literature. The results show relatively
acceptable consensus with the existing data. The uncertainties in the measurements of
density are approximately 3.30% for pure methanol.
0.55
0.60
0.65
0.70
0.75
0.80
0.85
0 5 10 15 20
Vis
cosi
ty (
mP
as)
Temperature (ºC)
Measured data
Reference data
Measured data (pure
methanol)
Reference data (pure
methanol)
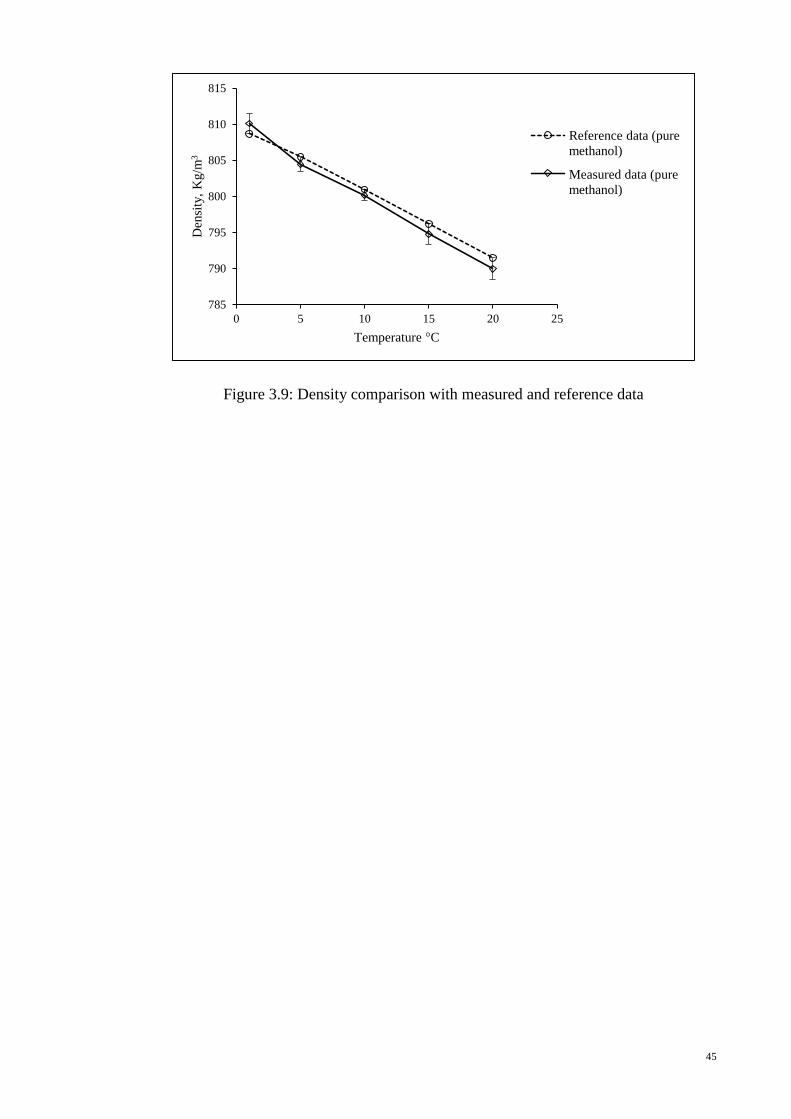
45
Figure 3.9: Density comparison with measured and reference data
785
790
795
800
805
810
815
0 5 10 15 20 25
Den
sity
, K
g/m
3
Temperature °C
Reference data
Measured data
Reference data (pure
methanol)
Measured data (pure
methanol)

46
CHAPTER 4 : RESULTS AND DISCUSSIONS
4.1 Introduction
This chapter focuses on the presentation of results of the experiments and analysis that
were obtained based on the methodology described in Chapter Three. The data obtained
throughout the investigation are interpreted and presented. This chapter is divided into
three sections and several subsection based on the objectives of the study.
4.2 Characterization of nanoparticles and methanol based nanofluids
The results and discussions about characterization of nanoparticles and methanol based
nanofluid section are divided into three subsections which are presented below.
4.2.1 X-ray Diffraction (XRD) image analysis
The characterization of Al2O3, SiO2 and TiO2 nanoparticles was performed by XDR for
phase identification, crystallite size and crystal structure determination. Figures 4.1, 4.2
and 4.3 show XRD pattern of Al2O3, SiO2 and TiO2 nanoparticles respectively. The
diffraction peaks of (302), (217), (317) and (442) have been indexed to tetragonal phase
of Al2O3 nanoparticles shows in the Figure 4.1 which is the result match with Cava et al.
(2007) results. The characteristic peaks match with the standard Joint Committee on
Powder Diffraction Standards (JCPDS) card no. 00-047-1770. The average crystallite size
obtained from the most intense peak of (302) by using Debye-Scherrer formula (equation
3.2) and is found to be ~11nm. Similarly, the diffraction peaks of (201), (020) and (231)
have been indexed to anorthic phase for SiO2 nanoparticle and (101), (103), (200), (211)
and (220) have been indexed to tetragonal phase for TiO2 nanoparticle. The characteristic
peaks match with the JCPDS card no. 98-000-1440 and 03-065-5714 and the average
particle size 5~15 nm and 20~25nm for SiO2 and TiO2 nanoparticles, respectively. The
XRD pattern results ware match for SiO2 and TiO2 nanoparticles with ( Murshed, 2005;
"SiO2 XRD pattern ").

47
Figure 4.1: XRD pattern of Al2O3 nanoparticles
Figure 4.2: XRD pattern of SiO2 nanoparticles
Figure 4.3: XRD pattern of TiO2 nanoparticles
0
3000
6000
9000
12000
15000
0 10 20 30 40 50 60 70 80
Co
unts
2-Theta
(302)
(217)
(317)
(442)
0
5000
10000
15000
20000
25000
0 10 20 30 40 50 60 70 80
Co
unts
2-Theta
(025)
(201)(020)
0
7000
14000
21000
28000
35000
42000
0 10 20 30 40 50 60 70 80
Co
unts
2-Theta
(101)
(103)(200)
(211)
(220)

48
4.2.2 Scanning electron microscope (SEM) image Analysis
The particle shape is an important characterization to analyze the fundamental properties.
Wu et al. (2009) suggested the SEM is the powerful tool to study the shape, and
suspension uniformity. Xie et al. (2002) reported that particles shape and suspension
uniformity as spherical shape particles gives higher thermal conductivity enhancement
than cylindrical particles. Figures 4.4, 4.5 and 4.6 exhibit SEM micrograph of Al2O3, SiO2
and TiO2, respectively. Primarily all nanoparticles are approximately spherical. However,
due to strong Van der Wall’s attractive force, nearly all three nanoparticles are in the form
of dried agglomerates with larger dimensions than the primary particles. In order to break
down the large agglomerates, ultrasonication is applied. The percentage of chemical
components in three nanoparticles are analysed by Energy dispersive spectrometry (EDS)
and have been presented in Appendix A.
Figure 4.4: SEM image of Al2O3 nanoparticles

49
Figure 4.5: SEM image of SiO2 nanoparticles
Figure 4.6: SEM image of TiO2 nanoparticles
4.2.3 TEM image analysis
Transmission Electron Microscope (TEM) is reckoned as the most important tool to
determine the size distribution and the morphology of the synthesized nanoparticles. It
uses electron beam to create the image of samples.

50
Figure 4.7: TEM image of Al2O3-methanol nanofluid (0.05 vol%)
Figure 4.8: TEM image of SiO2-methanol nanofluid (0.05 vol%)
500 nm
500nm

51
Figure 4.9: TEM image of TiO2-methanol nanofluid (0.05 vol%)
Figures 4.7, 4.8 and 4.9 demonstrate the TEM image of Al2O3-methanol, SiO2-methanol
and TiO2-methanol nanofluids at 0.05 vol%, respectively. As indicated in the TEM
images three nanoparticles are spherical in shape. The TEM image shows less
agglomeration for this solution even after 24 hours of preparation. Some area of TEM
image have the most severe agglomeration this is because the over loading of dispersant
which agglomerates the particles. The particle size measurement by TEM has been
presented in Appendix B.
4.3 Stability of methanol based nanofluids
The agglomeration of nanoparticles results in clogging and settlement and thus reduces
the thermal conductivity of nanofluids. So, stability analysis is a crucial circumstance in
context to its application. In order to evaluate the stability of nanofluids, sedimentation,
Uv-vis spectrometer, and zeta potential analysis are the three basic reliable methods.
4.3.1 Sedimentation image analysis
Figure 4.10 demonstrates the picture of five volume concentrations (0.005, 0.01, 0.05,
0.10 and 0.15 vol(%)) of Al2O3–methanol, SiO2–methanol and TiO2–methanol nanofluids
just after preparation and after seven (7) days of preparation. From Figure 4.10, it is
500 nm

52
observed that, not much sedimentation occurs in Al2O3-methanol nanofluids after seven
days but for other two nanofluids, there is sedimentation at the bottom of the bottles.
Generally, the sedimentation of mixtures is measured from the bottom of the specimen.
It could be possible when there are slurries obvious at the bottom of the sample. From
figures it is also obvious that low concentration suspension has low sedimentation
compare to high concentration. From the visualization Al2O3-methanol nanofluid is more
stable compare to SiO2-methanol and TiO2-methanol nanofluids.
Nanofluids Just after preparation After 7 days
Al2O3-
methano
SiO2-
methanol
TiO2-
methanol
Figure 4.10: Photograph of methanol based nanofluids just after preparation and after 7
days preparation
4.3.2 Inspection stability by Uv-Visible spectrophotometer
Characterization for stability of methanol based nanofluids was analyzed with the UV-
Visible spectrophotometer. Figures 4.11, 4.12 and 4.13 show the spectrum image of 0.005
vol% of Al2O3–methanol, SiO2–methanol and TiO2–methanol just after preparation by
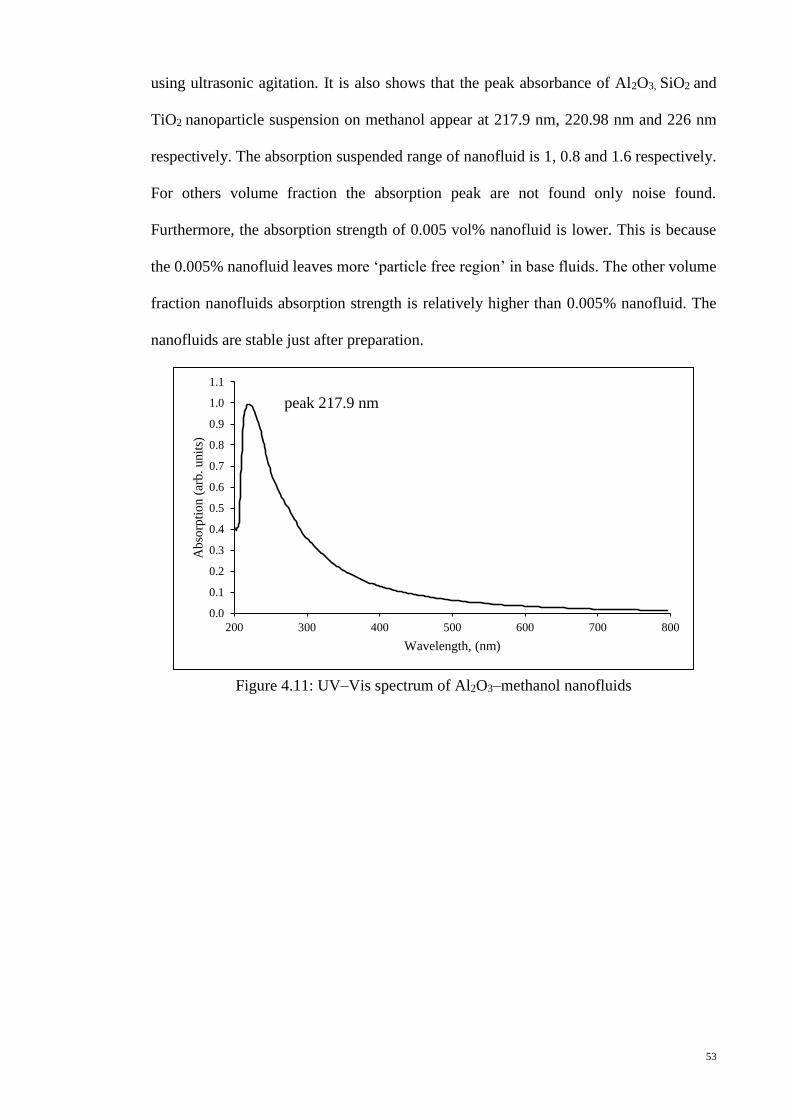
53
using ultrasonic agitation. It is also shows that the peak absorbance of Al2O3, SiO2 and
TiO2 nanoparticle suspension on methanol appear at 217.9 nm, 220.98 nm and 226 nm
respectively. The absorption suspended range of nanofluid is 1, 0.8 and 1.6 respectively.
For others volume fraction the absorption peak are not found only noise found.
Furthermore, the absorption strength of 0.005 vol% nanofluid is lower. This is because
the 0.005% nanofluid leaves more ‘particle free region’ in base fluids. The other volume
fraction nanofluids absorption strength is relatively higher than 0.005% nanofluid. The
nanofluids are stable just after preparation.
Figure 4.11: UV–Vis spectrum of Al2O3–methanol nanofluids
0.0
0.1
0.2
0.3
0.4
0.5
0.6
0.7
0.8
0.9
1.0
1.1
200 300 400 500 600 700 800
Ab
sorp
tio
n (
arb
. unit
s)
Wavelength, (nm)
peak 217.9 nm

54
Figure 4.12: UV–Vis spectrum of SiO2–methanol nanofluids.
Figure 4.13: UV–Vis spectrum of TiO2–methanol nanofluids
4.3.3 Stability inspection by Zeta potential and Zetasizer test
The stability of methanol based nanofluids is analyzed with zeta potential test result.
Figure 4.14 demonstrates the zeta potential result as a function of nanoparticle volume
concentrations. It is seen that the absolute zeta potential value for Al2O3-methano
nanofluids increases with increasing volume concentration accept 0.15 vol% but other
two nanofluids increases or decreases arbitrary. The absolute zeta potential value for
0.0
0.1
0.2
0.3
0.4
0.5
0.6
0.7
0.8
0.9
1.0
200 300 400 500 600 700 800
Ab
sorp
tio
n
(arb
. unit
s)
Wavelength, (nm)
peak 220.98 nm
0.0
0.2
0.4
0.6
0.8
1.0
1.2
1.4
1.6
1.8
200 300 400 500 600 700 800
Ab
sorp
tio
n (
arb
. unit
s)
Wavelength, (nm)
peak 226.1 nm
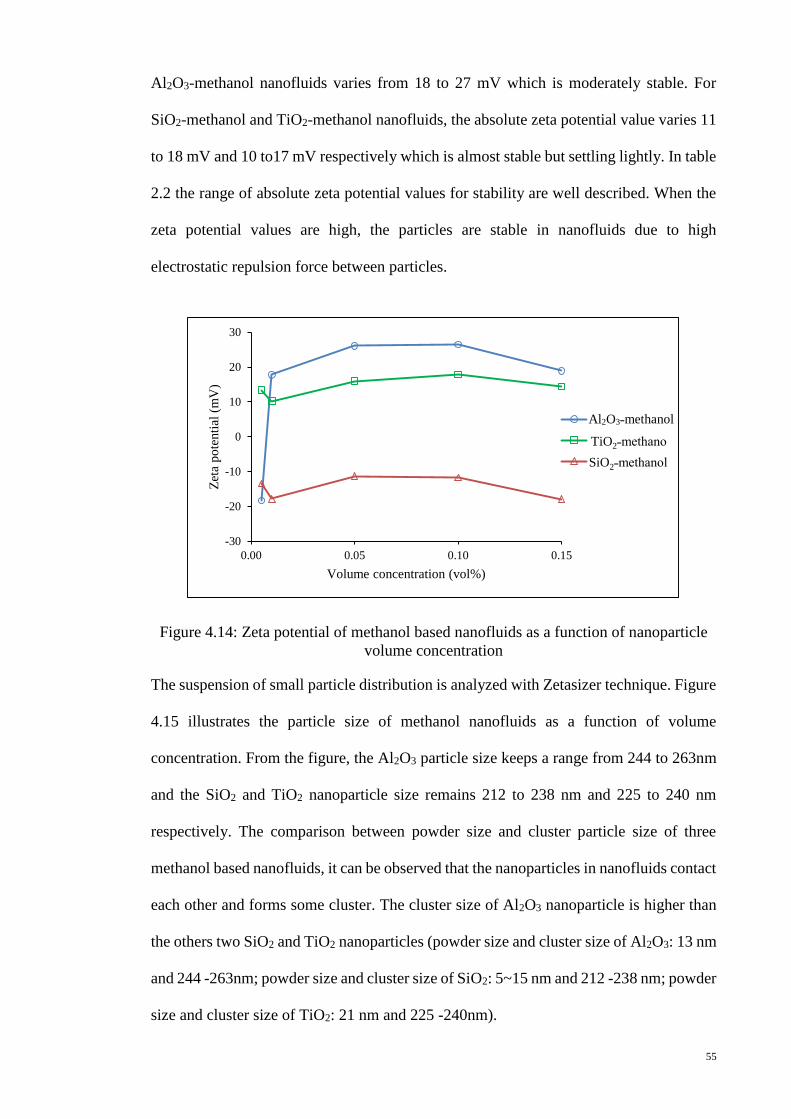
55
Al2O3-methanol nanofluids varies from 18 to 27 mV which is moderately stable. For
SiO2-methanol and TiO2-methanol nanofluids, the absolute zeta potential value varies 11
to 18 mV and 10 to17 mV respectively which is almost stable but settling lightly. In table
2.2 the range of absolute zeta potential values for stability are well described. When the
zeta potential values are high, the particles are stable in nanofluids due to high
electrostatic repulsion force between particles.
Figure 4.14: Zeta potential of methanol based nanofluids as a function of nanoparticle
volume concentration
The suspension of small particle distribution is analyzed with Zetasizer technique. Figure
4.15 illustrates the particle size of methanol nanofluids as a function of volume
concentration. From the figure, the Al2O3 particle size keeps a range from 244 to 263nm
and the SiO2 and TiO2 nanoparticle size remains 212 to 238 nm and 225 to 240 nm
respectively. The comparison between powder size and cluster particle size of three
methanol based nanofluids, it can be observed that the nanoparticles in nanofluids contact
each other and forms some cluster. The cluster size of Al2O3 nanoparticle is higher than
the others two SiO2 and TiO2 nanoparticles (powder size and cluster size of Al2O3: 13 nm
and 244 -263nm; powder size and cluster size of SiO2: 5~15 nm and 212 -238 nm; powder
size and cluster size of TiO2: 21 nm and 225 -240nm).
-30
-20
-10
0
10
20
30
0.00 0.05 0.10 0.15
Zet
a p
ote
nti
al (
mV
)
Volume concentration (vol%)
Al2O3-methanol
TiO2-methanol
SiO2-methanol
TiO2˗methano
SiO2˗methanol
Al2O3˗methanol

56
Figure 4.15: Particle size in methanol based nanofluids as a function of volume
concentration
The dispersion stability of nanofluids evaluate with hydrodynamic diameter of the
particles measured by Zetasizer zs. The volume distribution of particle size within the
methanol nanofluids were shown in the Appendix C.
4.4 Thermophysical properties of methanol based nanofluids
This section is divided into three subsections according to the results and discussions of
thermal conductivity, viscosity, and density of methanol based nanofluids. Each of the
subsection firstly, describes the effect of volume concentrations and finally, describes the
effect of temperature.
4.4.1 Thermal conductivity of methanol based nanofluids
Figures 4.16, 4.17 and 4.18 show the thermal conductivity of Al2O3-methanol, SiO2-
methanol and TiO2-methanol nanofluids as a function of temperature and particles
volume fraction. The results indicate that the thermal conductivity of methanol-based
nanofluids increases with the increase of particle volume fraction and temperature
compared with that of the base fluids. For example, at 20 ºC temperature, the thermal
conductivity value 0.264 W/mK for 0.15 vol% and 0.245 W/mK for 0.005 vol%. The
difference of thermal conductivity is 0.019W/mK for 0.145 vol%. Similarly, the
180
200
220
240
260
280
0.00 0.05 0.10 0.15
Par
ticl
e si
ze (
nm
)
Volume concentration (vol%)
Al2O3-methanol
TiO2-methanol
SiO2-methanol
TiO2˗methanol
SiO2˗methanol
Al2O3˗methanol

57
difference of thermal conductivity is 0.018W/mK and 0.023 W/mK for SiO2-methanol
and TiO2-methanol nanofluids. For all cases, the maximum thermal conductivity
enhancement was found at 0.15 vol% and 20°C. The results also show that thermal
conductivity improved from 1.47 to 8.33%, 0.98 to 7.35% and 1.47 to 6.86% for Al2O3-
methanol, SiO2-methanol and TiO2-methanol, respectively with every 0.05 vol% increase
in nanoparticles volume fraction. This is because of more particles loading has higher
particle surface to volume ratio. The mechanism for this enhancement may be because of
particle to particle interactions, nanoparticle cluster and Brownian motion. It is also noted
that the thermal conductivity increased with every 5°C increase in temperature (0.49 to
3.92%, 0.49 to 3.43% and 0.49 to 3.92% for Al2O3-methanol, SiO2-methanol and TiO2-
methanol, respectively). It was because increased temperature decreased viscosity which
intensified the Brownian motion and the effects of nanoconvection. Thermal conductivity
increases due to the rotational motion of spherical nanoparticles according to
nanoconvection model (Hojjat et al., 2009). These results agree well with the measured
thermal conductivity data suggested by Das et al. (2003), and Chandrasekar et al. (2010)
for Al2O3 water nanofluid at low particle volume concentration.
Figure 4.16: Thermal conductivity of Al2O3–methanol as a function of temperature and
particle volume concentration.
0.200
0.210
0.220
0.230
0.240
0.250
0.260
0.270
0.280
0 5 10 15 20 25
Ther
mal
Co
nd
uct
ivit
y,
W/m
K
Temperature, °C
0.15% vol
0.10% vol
0.05% vol
0.01% vol
0.005% vol
Base fluid

58
Figure 4.17: Thermal conductivity of SiO2–methanol as a function of temperature and
particle volume concentration.
Figure 4.18: Thermal conductivity of TiO2–methanol as a function of temperature and
particle volume concentration.
Figures 4.19, 4.20 and 4.21 represent comparisons between the measured data and the
predicted values using existing correlations for the three nanofluids. The results are
presented for the measured values of thermal conductivity measured at 20 °C with some
existing model for Al2O3–methanol, SiO2-methanol and TiO2–methanol. The figures
show that the thermal conductivity of methanol based nanofluids increases with
nanoparticle volume concentration enhancement. The increment rate with the
augmentation of concentration expected to be linear. The experimental values for this
0.200
0.210
0.220
0.230
0.240
0.250
0.260
0 5 10 15 20 25
Ther
mal
Co
nd
uct
ivit
y,
W/m
K
Temperature, °C
0.15% vol
0.10% vol
0.05% vol
0.01% vol
0.005% vol
Base fluid
0.200
0.210
0.220
0.230
0.240
0.250
0.260
0.270
0 5 10 15 20 25
Ther
mal
Co
nd
uct
ivit
y,
W/m
K
Temperature, °C
0.15% vol
0.10% vol
0.05% vol
0.01% vol
0.005% vol
Base fluid
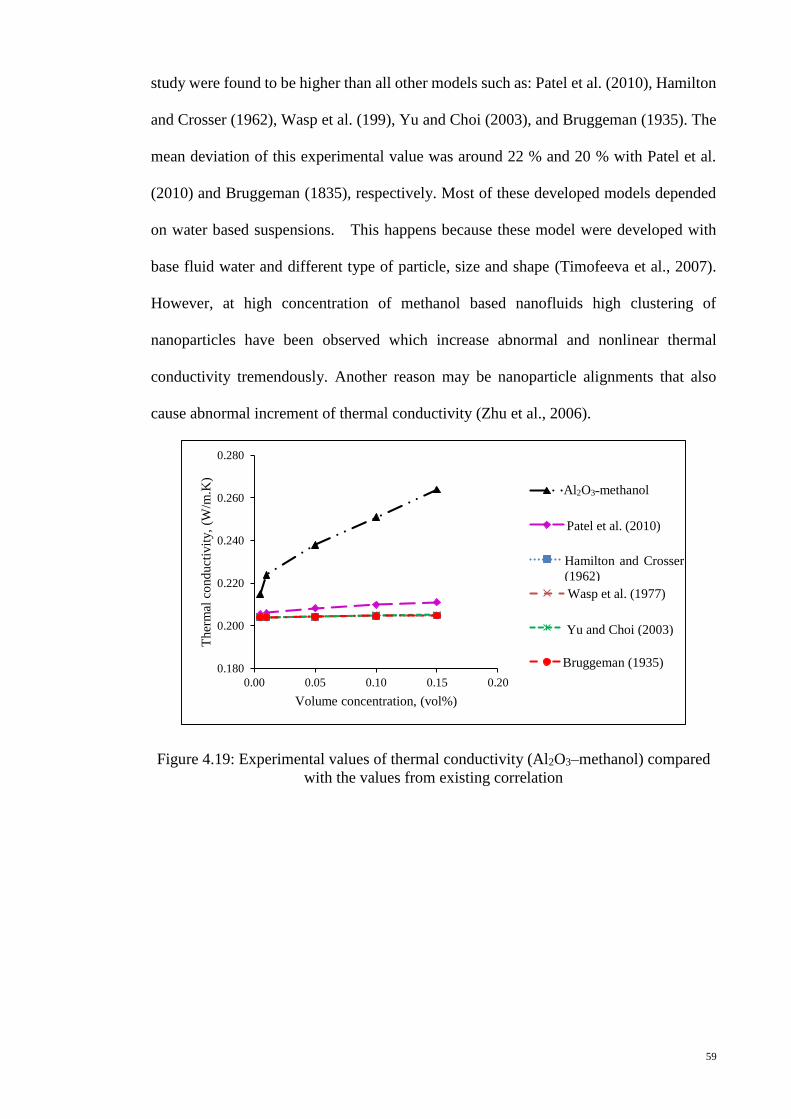
59
study were found to be higher than all other models such as: Patel et al. (2010), Hamilton
and Crosser (1962), Wasp et al. (199), Yu and Choi (2003), and Bruggeman (1935). The
mean deviation of this experimental value was around 22 % and 20 % with Patel et al.
(2010) and Bruggeman (1835), respectively. Most of these developed models depended
on water based suspensions. This happens because these model were developed with
base fluid water and different type of particle, size and shape (Timofeeva et al., 2007).
However, at high concentration of methanol based nanofluids high clustering of
nanoparticles have been observed which increase abnormal and nonlinear thermal
conductivity tremendously. Another reason may be nanoparticle alignments that also
cause abnormal increment of thermal conductivity (Zhu et al., 2006).
Figure 4.19: Experimental values of thermal conductivity (Al2O3–methanol) compared
with the values from existing correlation
0.180
0.200
0.220
0.240
0.260
0.280
0.00 0.05 0.10 0.15 0.20
Ther
mal
co
nd
uct
ivit
y,
(W/m
.K)
Volume concentration, (vol%)
Al2O3–methanol
Patel et al.
Hamilton and Crosser
model
Wasp model
Yu and Choi model
Bruggemann model
Al2O3˗methanol
Patel et al. (2010)
Hamilton and Crosser
(1962)
Wasp et al. (1977)
Yu and Choi (2003)
Bruggeman (1935)

60
Figure 4.20: Experimental values of thermal conductivity (SiO2–methanol) compared
with the values from existing correlation
Figure 4.21: Experimental values of thermal conductivity (TiO2–methanol) compared
with the data from existing correlation
Figure 4.22 shows the enhancement in thermal conductivity of different nanoparticle
volume fractions at 20°C for methanol-based nanofluids. The results show that the
thermal conductivity augmented compared with the pure base fluid. It is observed from
Figure 4.22 that thermal conductivities improved up to 29.41%, 23.03% and 24.51% at
volume concentrations of 0.15vol% for the three nanoparticles. It is also clear that Al2O3-
methanol owns higher values of thermal conductivity compared with the other two
0.180
0.200
0.220
0.240
0.260
0.00 0.05 0.10 0.15 0.20
Ther
mal
co
nd
uct
ivit
y,
(W/m
.K)
Volume concentration, (vol%)
SiO2–methanol
Patel et al.
Hamilton and
Crosser modelWasp model
Yu and Choi model
Bruggemann model
0.180
0.190
0.200
0.210
0.220
0.230
0.240
0.250
0.260
0.00 0.05 0.10 0.15 0.20
Ther
mal
co
nd
uct
ivit
y,
(W/m
.K)
Volume concentration, (vol%)
TiO2–methanol
Patel et al.
Hamilton and Crosser
model
Wasp model
Yu and Choi model
Bruggemann model
SiO2˗methanol
TiO2˗methanol
Patel et al. (2010)
Patel et al. (2010)
Hamilton and Crosser
(1962)
Wasp et al. (1977)
Wasp et al. (1977)
Yu and Choi (2003)
Yu and Choi (2003)
Bruggeman (1935)
Bruggeman (1935)
Hamilton and Crosser
(1962)

61
nanofluids as Al2O3 nanoparticles have higher thermal conductivity compared to SiO2
and TiO2 nanoparticles. Moreover, the nanoparticles in the fluid are moving due to the
Brownian motion of these nanoparticle suspensions. This motion resulting from the
fundamental thermal properties of the nanoparticles and hence arise the effective thermal
conductivity of these nanoparticle suspensions. The nanoparticles thermal conductivity
influenced the enhancement of nanofluids thermal conductivity (Hojjat et al., 2009) and
(C. H. Li and Peterson, 2006). Another reason may have the clustering effect of
nanoparticle. Gao et al. (2009) suggested that clustering size held the key to enhance the
thermal conductivity. In Figure 4.15 describe the cluster size of methanol based
nanofluids. The comparison between measured data from the current study and those from
the experiments done by Pang et al. (2012) at the same operating temperature are shown
in Figure 4.22. The difference between these results may vary for various factors such as
a difference in particle size, preparation method, source, as well as measurement
techniques (Duangthongsuk and Wongwises, 2009).
Figure 4.22: Comparison of thermal conductivity enhancement with reference data.
Thermal conductivity of methanol based nanofluids depends on nanoparticles volume
fraction and temperature. The similar trend was also observed by Pang et al. (2012) for
methanol-based Al2O3 and SiO2 nanofluids. Thus, it is obvious that relative thermal
conductivity of methanol based nanofluids is a function of particle volume fraction and
0
5
10
15
20
25
30
35
0.001 0.01 0.1 1
Ther
mal
co
nd
uct
ivit
y e
nhan
cem
ent,
%
Volume Concentration, %
Measured Al2O3-
methanol data
Measured TiO2-
methanol data
Measured SiO2-
methanol data
Pang et al. SiO2-
methanol data
Pang et al. Al2O3-
methanol data
Experimental
Al2O3˗methanol data
Experimental
TiO2˗methanol data
Experimental
SiO2˗methanol data
Pang et al. (2012)
SiO2˗methanol data
Pang et al. (2012)
Al2O3˗methanol data
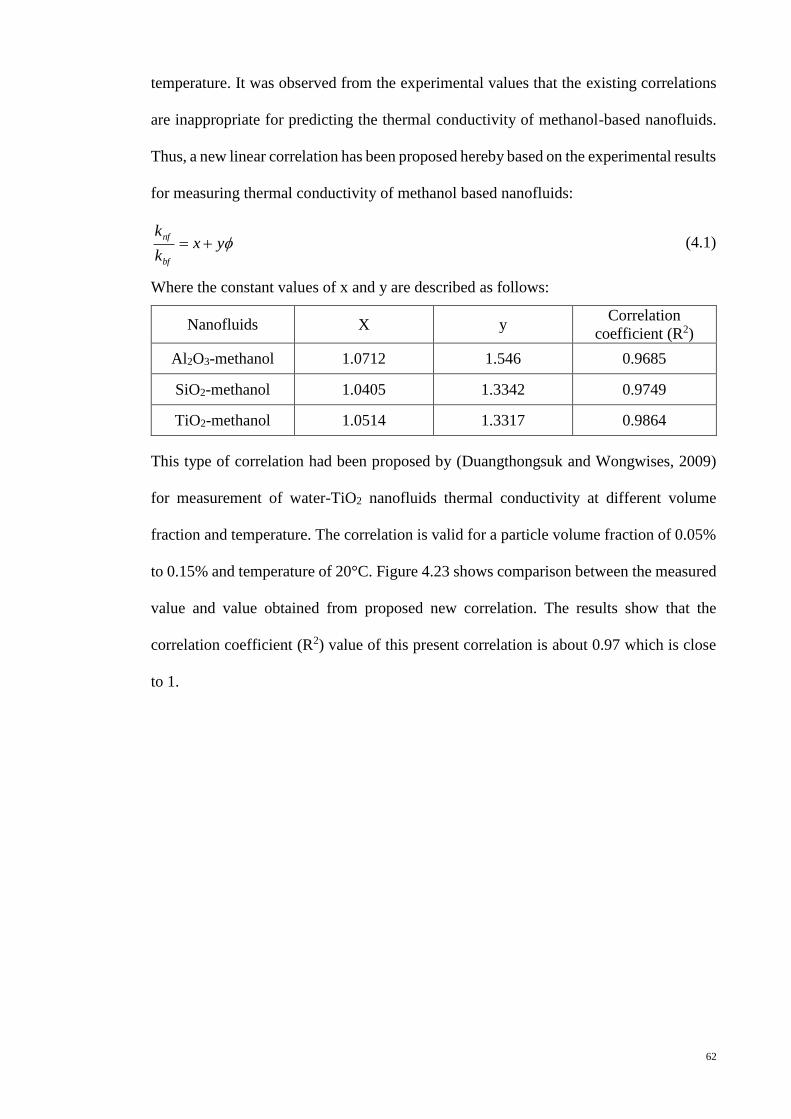
62
temperature. It was observed from the experimental values that the existing correlations
are inappropriate for predicting the thermal conductivity of methanol-based nanofluids.
Thus, a new linear correlation has been proposed hereby based on the experimental results
for measuring thermal conductivity of methanol based nanofluids:
yxk
k
bf
nf (4.1)
Where the constant values of x and y are described as follows:
Nanofluids X y Correlation
coefficient (R2)
Al2O3-methanol 1.0712 1.546 0.9685
SiO2-methanol 1.0405 1.3342 0.9749
TiO2-methanol 1.0514 1.3317 0.9864
This type of correlation had been proposed by (Duangthongsuk and Wongwises, 2009)
for measurement of water-TiO2 nanofluids thermal conductivity at different volume
fraction and temperature. The correlation is valid for a particle volume fraction of 0.05%
to 0.15% and temperature of 20°C. Figure 4.23 shows comparison between the measured
value and value obtained from proposed new correlation. The results show that the
correlation coefficient (R2) value of this present correlation is about 0.97 which is close
to 1.

63
Figure 4.23: Comparison of thermal conductivity ratio measured data with proposed
correlation
4.4.2 Viscosity of methanol based nanofluids
The effects of nanoparticles volume fraction and temperature on rheological behavior of
methanol based nanofluids were studied. The experimental data were measured based on
the shear stress and viscosity with respect to shear rate. Figures 4.24, 4.25 and 4.26
illustrate the shear stress and viscosity vs. shear rate at 0.05 vol% for Al2O3–methanol,
SiO2–methanol and TiO2–methanol nanofluids. The solid line represents the relationship
between shear stress and shear rate. The figures indicate that shear stress increased with
an increase of shear rate and decrease with temperature accordingly. The increasing trend
of shear stress of all types of methanol based nanofluids was almost similar for every
volume concentration. The increasing trend was nonlinear and the phenomenon of shear
stress vs. shear rate behaves like a non-Newtonian fluid with a shear thickening or dilatant
behavior. The decreasing rate of shear stress was more prominent at higher shear rate. For
example, at shear rate of 61.15 s−1, shear stress of 0.01 vol% was 0.56 and 0.46 D/cm2 (a
difference of 0.10 D/cm2) at 1 and 20 °C, respectively; while the shear stress was 5.69
and 5.06 D/cm2 (a difference of 0.59 D/cm2) respectively at shear rate of 305.8 s−1. Shear
stress also depends on particle volume concentration as with increasing particle volume
concentration, shear stress increased at the same shear rate. For example, the shear stress
0.95
1.00
1.05
1.10
1.15
1.20
1.25
1.30
1.35
1.40
0 0.05 0.1 0.15 0.2
Ther
mal
Co
nd
uct
ivit
y r
atio
, (W
nf/
Wbf)
Volume concentration, (vol %)
Series1
Series2
Series3
Linear
(Series1)
Linear
(Series2)
Linear
(Series3)
Measured Data
Present Correlation
Al2O3-methanol
Al2O3-methanol
SiO2-methanol
SiO2-methanol
TiO2-methanol
TiO2-methanol

64
values were 5.06 and 5.48 D/cm2 for 0.01 and 0.10 vol% respectively at shear rate of
305.80 s−1. The shear stress value for TiO2–methanol nanofluids was higher than Al2O3–
methanol, and SiO2–methanol nanofluids at the same shear rate, volume fraction and
temperature. For example, the shear stress values were 5.24 and 5.06 D/cm2 for TiO2–
methanol and Al2O3–methanol nanofluids respectively at shear rate of 305.80 s−1,
concentration of 0.01 vol% and temperature of 20 °C. Similar results were obtained for
SiO2–methanol nanofluids at different volume fractions and temperatures.
Figure 4.24: Shear stress and viscosity of Al2O3–methanol nanofluids for 0.05 vol% as a
function of shear rate and temperature.
0.0
0.5
1.0
1.5
2.0
2.5
3.0
0
1
2
3
4
5
6
7
0 50 100 150 200 250 300 350
Vis
cosi
ty (
mP
as)
Shea
r st
ress
(D
/cm
2)
Shear rate (1/s)
1 5 10 15 20
1 5 10 15 20
ºC ºC ºC ºC ºC
ºC ºC ºC ºC ºC

65
Figure 4.25: Shear stress and viscosity of SiO2–methanol nanofluids for 0.05 vol% as a
function of shear rate and temperature.
Figure 4.26: Shear stress and viscosity of TiO2–methanol nanofluids for 0.05 vol% as a
function of shear rate and temperature.
The viscosity of Al2O3-methanol, SiO2-methanol and TiO2-methanol at various volume
concentration and temperatures is shown in Figure 4.27, 4.28 and 4.29, respectively.
According to this figures, the viscosity increases with increasing volume concentration
and decreases with rising temperatures in all cases. The increasing and decreasing trend
are nonlinear. For Al2O3-methanol based nanofluid, at 0.15 vol% the viscosity vale 0.90
mPas and 0.72 mPas at 1ºC and 20ºC temperature respectively. Similar results were found
for SiO2-methano and TiO2-methano nanofluids. The same trend for decrease of viscosity
0.0
0.5
1.0
1.5
2.0
2.5
0
1
2
3
4
5
6
0 50 100 150 200 250 300 350
Vis
cosi
ty (
mP
as)
Shea
r st
ress
(D
/cm
2)
Shear rate (1/s)
1 5 10 15 20
1 5 10 15 20
ºC ºC ºC ºC ºC
ºC ºC ºC ºC ºC
0.0
0.5
1.0
1.5
2.0
2.5
3.0
0
1
2
3
4
5
6
7
0 50 100 150 200 250 300 350V
isco
sity
(m
Pas
)
Shea
r st
ress
(D
/cm
2)
Shear rate (1/s)
1 5 10 15 20
1 5 10 15 20
ºC ºC ºC ºC ºC
ºC ºC ºC ºC ºC

66
with the increase of temperature were found by some other researchers (Kulkarni et al.,
2006; Namburu et al., 2007) It is also demonstrated that the viscosity decreased with an
increase in volume fraction and temperature for both nanofluids due to the weakening
adhesion force of the particle. When the temperature increases, the interaction time
between neighboring molecules of a fluid decreases due to increased velocities of
individual molecules. High temperature also influences the Brownian motion of
nanoparticles and hence decreases the viscosity of nanofluids. The present viscosity
results hold good agreement with the experimental data presented by Choi (1999), Wang
et al. (1999) Murshed et al. (2008), Kulkarni et al. (2002), Das et al. (2003), Maiga et al.
(2004), Chen et al. (2009), Nguyen et al. (2007), and Chandrasekar et al. (2010).
Therefore, it is expected that the higher the particle concentration may increase the
pressure drop and pumping power.
Figure 4.27: Viscosity of Al2O3–methanol as a function of temperature and particle
volume concentration.
0.55
0.60
0.65
0.70
0.75
0.80
0.85
0.90
0.95
1.00
0 5 10 15 20
Vis
cosi
ty,
mP
as
Temperature, °C
0.15 vol%
0.10 vol%
0.05 vol%
0.01 vol%
0.005 vol%
0.00 vol%

67
Figure 4.28: Viscosity of SiO2–methanol as a function of temperature and particle
volume concentration.
Figure 4.29: Viscosity of TiO2–methanol as a function of temperature and particle
volume concentration.
Figure 4.30 show the comparison of measured viscosity compared with some existing
equation at 20ºC temperature. The increasing trend of viscosity for all fluids was
nonlinear. It was also observed that the measured viscosity of three nanofluids showed
higher value than the value obtained from correlations. Thus, the model are not suitable
for evaluating the viscosity of methanol based nanofluids (Mahbubul et al., 2012) because
these models were generalized models developed to estimate the viscosity of a
0.55
0.60
0.65
0.70
0.75
0.80
0.85
0.90
0.95
0 5 10 15 20
Vis
cosi
ty,
mP
as
Temperature, °C
0.15 vol%
0.10 vol%
0.05 vol%
0.01 vol%
0.005 vol%
0.00 vol%
0.55
0.60
0.65
0.70
0.75
0.80
0.85
0.90
0.95
1.00
0 5 10 15 20
Vis
cosi
ty,
mP
as
Temperature, °C
0.15 vol%
0.10 vol%
0.05 vol%
0.01 vol%
0.005 vol%
0.00 vol%

68
suspension. Therefore, agglomeration cluster of nanoparticles can be considered as one
of the reasons for higher viscosity.
Figure 4.30: Comparison of measured viscosity with the values from existing
correlation
Figure 4.31 shows the effective viscosity ratio of methanol based nanofluids at 20 ºC. It
is observed that the viscosity TiO2-methanol is higher than the Al2O3-methanol and SiO2-
methanol nanofluids. The maximum viscosity increases is found to be 17.8%, 16.1% and
11.1% for TiO2-methanol, Al2O3-methanol and SiO2-methanol nanofluids respectively.
Mahbubul et al. (2013) observed 214 times greater than base fluid for 5ºC and 2 volume
concentration (%) of particles. Tseng and Lin (2003) found a higher relative viscosity
compared to that in this experimental value. They observed that the viscosity increased
up to 1200 times more than the base fluid for 12 volume concentration (%) of TiO2 with
water.
0.60
0.62
0.64
0.66
0.68
0.70
0.72
0.74
0.00 0.05 0.10 0.15 0.20
Vis
cosi
ty,
mP
as
Volume concentration, (vol %)
TiO2-methanol
Al2O3-metanol
SiO2-methanol
Song et al.
Einstein eq.
Brinkman eq
TiO2˗methanol
Al2O3˗methanol
SiO2˗methanol
Song et al. (2005)
Einstein (1906)
Brinkman (1952)

69
Figure 4.31: Comparison of viscosity ratio measured values with proposed correlation
Theoretically, these are classical models estabilished to estimate the viscosity of a
suspension that the agglomeration cluster of nanoparticles had not been taken into
consideration. So it is reasonable that these models are not suitable for the nanofluids.
However, it appears difficult to build a perfect equation with obtained results due to
various factors such as the variation of the nanoparticles or base liquid as well as the
differences in the shape of nanoparticles. For computing purpose, the following
correlations (Eq. 4.2) have been proposed for methanol-based Al2O3, SiO2 and TiO2
nanoparticles for a particle volume fraction of 0.05% to 0.15% and temperature of 20°C:
Cbf
nf
0367.17839.8581.31 23 (4.2)
Nanofluids Constant
Al2O3–methanol 1.0970
SiO2-methanol 1.0486
TiO2-methanol 1.1131
4.4.3 Density of methanol based nanofluids
The density of Al2O3–methanol, SiO2-methanol and TiO2-methanol nanofluids as a
function of different temperatures and different volume concentration are shown in
1.02
1.05
1.08
1.11
1.14
1.17
1.20
0.00 0.05 0.10 0.15 0.20
Vis
cosi
ty r
atio
, (μ
nf/
μbf)
Volume concentration, (vol%)
Series3
Series2
Series1
Poly. (Series3)
Poly. (Series2)
Poly. (Series1)
Al2O3˗methanol
SiO2˗methanol
TiO2˗methanol
Al2O3˗methanol
SiO2˗methanol
TiO2˗methanol

70
Figures 4.32, 4.33 and 4.34, respectively. The results indicate the density of methanol
based nanofluids increases in volume concentration. The density of nanofluids shows
higher values than the base fluids. For example, at temperature 1 ºC the value of density
is 809.29 kg/m3 for 0.005 vol% and 818.42 kg/m3 for 0.15 vol% for Al2O3–methanol. At
volume concentration 0.15 vol% the density value 807.45 kg/m3 for 20 ºC and 818.42
kg/m3 for 1 ºC. Similar results were found in all volume concentration and SiO2-methanol
and TiO2-methanol nanofluids due to higher density of nanoparticles dispersed in base
fluids. From Figures 4.32, 4.33 and 4.34, the density of methanol nanofluids decrease
with increase in temperature. For example, the density of Al2O3-methanol nanofluids at
0.15 vol% is 818.56 kg/m3 at 01ºC and 807.12 kg/m3 at 20 ºC. The difference in density
is 11.44 kg/m3 for Al2O3-methanol nanofluids. Similar results were found for SiO2-
methanol and TiO2-methanol nanofluids. This is because, when the temperature
decreases, the viscosity as well as the density of base fluids also decreases.
Figure 4.32: Density of Al2O3–methanol as a function of temperature and particle
volume concentration.
790
795
800
805
810
815
820
825
0 5 10 15 20
Den
sity
, K
g/m
3
Temperature, °C
0.15 vol%
0.10 vol%
0.05 vol%
0.01 vol%
0.005 vol%
0.00 vol%

71
Figure 4.33: Density of SiO2–methanol as a function of temperature and particle volume
concentration.
Figure 4.34: Density of TiO2–methanol as a function of temperature and particle volume
concentration.
The experimental value of density increases of methanol based nanofluids at 20 ºC was
compared with the model given by Pak and Choi (1998) shown in Figure 4.35. The
experimental value was slightly higher than the existing correlation due to the difference
in the density of the base fluids and water based nanofluids whereas Pak and Cho’s model
was proposed for the latter. The highest increases observed for TiO2-methanol then
Al2O3-methanol and SiO2-methanol nanofluids. It may happen due to nanoparticles
density difference.
790
795
800
805
810
815
820
825
0 5 10 15 20
Den
sity
, K
g/m
3
Temperature, °C
0.15 vol%
0.10 vol%
0.05 vol%
0.01 vol%
0.005 vol%
0.00 vol%
785
790
795
800
805
810
815
820
825
0 5 10 15 20
Den
sity
, K
g/m
3
Temperature, °C
0.15 vol%
0.10 vol%
0.05 vol%
0.01 vol%
0.005 vol%
0.00 vol%

72
Figure 4.35: Comparison of density increment with the values from existing correlation.
4.5 Implication of this study
The findings of this study demonstrated an enhanced thermophysical properties of
methanol based nanofluids compared with base fluids. Thus, the enhanced experimental
values of thermophysical properties would allow methanol based nanofluids to be used
in low temperature applications to avoid the freezing of working fluids. Methanol based
working fluids can be applied in gravity aided and pool boiling applications in various
heat pipe, electronics cooling, refrigeration and HVAC system.
0.00
0.50
1.00
1.50
2.00
2.50
0.00 0.05 0.10 0.15 0.20
Den
sity
incr
emen
t, %
Volume Concentration, %
TiO2-methanol
Al2O3-methanol
SiO2-methanol
Pak and choi eq.
TiO2˗methanol
Al2O3˗methanol
SiO2˗methanol
Pak and Choi
(1998)

73
CHAPTER 5 : CONCLUSIONS AND RECOMMENDATIONS
5.1 Introduction
The study was set out to explore the characterization of nanoparticles and thermophysical
properties of methanol based nanofluids. Experiments were conducted to characterize
Al2O3, SiO2 and TiO2 nanoparticles, formulation of methanol based nanofluids, observe
the stability and measure the thermal conductivity, viscosity and density of methanol
based nanofluids. The section starts with some concluding remarks and finally concludes
with some recommendations for future work.
5.2 Conclusions
From the comparative analysis and evaluation, the conclusions can be drawn as follows:
First of all, the characteristic peak of XRD results match with Join committee on Powder
Diffraction Standards (JCPDS) of Al2O3, SiO2 and TiO2 nanoparticles and the particle
size are almost as supplier mentioned.
The nanoparticles dispersed well and less agglomeration were found from Transmission
Electron Microscope (TEM) viewing. TEM was also used to check the suspension
uniformity, particle agglomeration and confirm the size distribution of particle in
nanofluids.
In the second part, Al2O3-methanol nanofluids found to be more stable compared to SiO2-
methanol and TiO2-methanol nanofluids from sedimentation photograph captured to
observe the sediment of suspension. UV-Visible spectrophotometer test and zeta potential
test are also used to check the stability of methanol based nanofluids. The results shows,
the absolute zeta potential value of Al2O3-methanol nanofluids found higher compared to
SiO2-methano and TiO2-methanol nanofluids.
Finally, the thermophysical properties of methanol based nanofluids is investigated. The
thermal conductivity of methanol based nanofluids has increased with the increase of

74
nanoparticle volume fraction and temperature. Thermal conductivity enhancement was
about 29.41%, 23.03% and 24.51% compared to base fluids for Al2O3, SiO2 and TiO2
nanoparticles, respectively with nanoparticles volume fraction of 0.15vol% and at
temperature of 20°C. The values for thermal conductivity enhancement of Al2O3-
methanol were approximately 6% and 5% higher compared to SiO2 and TiO2
nanoparticles for the same volume concentration and operating temperature. The
experimental results show that, methanol based nanofluids is a non-Newtonian fluid.
Volume fractions and temperature have significant effects over viscosity of methanol
based nanofluids. Results indicate that viscosity increases with the increase of the particle
volume fractions. However, viscosity decreases when temperature increases. The
maximum viscosity increases is found to be 1.78%, 1.61% and 1.11% higher over the
base fluids for TiO2-methanol, Al2O3-methanol and SiO2-methanol nanofluids
respectively. Like viscosity, the density of methanol based nanofluids also increases with
the enhancement of volume fraction. Similarly, it decreases with the increase of
temperature. The highest increment observed for TiO2-methanol than Al2O3-methanol
and SiO2-methanol nanofluids and the enhancement is 2.2%.
Finally, it can be concluded that Al2O3-methanol nanofluids have comparative good
stability and good thermophysical properties. The types of nanoparticles, variation of
temperature and volume concentrations have significant effect on thermophysical
properties of methanol based nanofluids.
5.3 Recommendations for future work
The stability of methanol based nanofluids is not in satisfactory level. There are several
techniques to improve the stability of the nanofluids for instance, addition of surfactant
and pH control. Sodium dodecyl sulfate (SDS), Sodium dodecyl benzene sulphonate
(SDBS), Dodecyl trimethyl ammonium bromide (DTAB), Sodium octanoate (SOCT),
Hexadecyl trimethyl ammonium bromide (HCTAB), Polyvinylpyrrolidone (PVP) and

75
Arabic gum (AG) are the common surfactants used to improve stability of nanofluids.
Therefore, the effect of surfactant on stability and thermophysical properties of methanol
based nanofluids need to be investigated.
According to literature, pH value of 7-9 for Alumina (Huang et al., 2009) and pH 1-4 for
Titania (Penkavova et al., 2011) provide good stability and the pH value are important
for explaining the thermal conductivity of nanofluids (Prasher et al., 2006). Therefore,
the variation of pH value of methanol based nanofluids need to be investigated.
Specific heat capacity, surface tension and latent heat of vaporization are the important
properties of nanofluids. These properties need to be determined experimentally for
methanol based nanofluids as they are directly related to the heat transfer performance
analysis.

76
REFERENCES
Arab, M., & Abbas, A. (2014). A model-based approach for analysis of working fluids in
heat pipes. Applied Thermal Engineering, 73(1), 749-761.
Aravind, S. J., Baskar, P., Baby, T. T., Sabareesh, R. K., Das, S., & Ramaprabhu, S.
(2011). Investigation of structural stability, dispersion, viscosity, and conductive
heat transfer properties of functionalized carbon nanotube based nanofluids. The
Journal of Physical Chemistry C, 115(34), 16737-16744.
Batchelor, G. (1977). The effect of Brownian motion on the bulk stress in a suspension
of spherical particles. Journal of Fluid Mechanics, 83(01), 97-117.
Beck, M. P., Yuan, Y., Warrier, P., & Teja, A. S. (2009). The effect of particle size on
the thermal conductivity of alumina nanofluids. Journal of Nanoparticle
Research, 11(5), 1129-1136.
Bhattacharya, P., Saha, S., Yadav, A., Phelan, P., & Prasher, R. (2004). Brownian
dynamics simulation to determine the effective thermal conductivity of
nanofluids. Journal of Applied Physics, 95(11), 6492-6494.
Brinkman, H. (1952). The viscosity of concentrated suspensions and solutions. The
Journal of Chemical Physics, 20, 571.
Bruggeman, D. A. G., (1935). Calculation of various physics constants in heterogenous
substances I-dielectricity constants and conductivity of mixed bodies from
isotropic substances. Annalen der Physik, Leipzig, 24, (7), 636-679.
Cava, S., Tebcherani, S., Souza, I., Pianaro, S., Paskocimas, C., Longo, E., & Varela, J.
(2007). Structural characterization of phase transition of Al2O3 nanopowders
obtained by polymeric precursor method. Materials Chemistry and Physics,
103(2), 394-399.
Chandrasekar, M., & Suresh, S. (2009). A review on the mechanisms of heat transport in
nanofluids. Heat Transfer Engineering, 30(14), 1136-1150.
Chandrasekar, M., Suresh, S., & Chandra Bose, A. (2010). Experimental investigations
and theoretical determination of thermal conductivity and viscosity of
Al2O3/water nanofluid. Experimental Thermal and Fluid Science, 34(2), 210-216.
Chandrasekar, M., Suresh, S., Srinivasan, R., & Bose, A. C. (2009). New analytical
models to investigate thermal conductivity of nanofluids. Journal of nanoscience
and nanotechnology, 9(1), 533-538.

77
Chen, H., Ding, Y., Lapkin, A., & Fan, X. (2009). Rheological behaviour of ethylene
glycol-titanate nanotube nanofluids. Journal of nanoparticle research, 11(6),
1513-1520.
Chen, H., Ding, Y., & Tan, C. (2007). Rheological behaviour of nanofluids. New Journal
of Physics, 9(10), 367.
Chen, H., Witharana, S., Jin, Y., Kim, C., & Ding, Y. (2009). Predicting thermal
conductivity of liquid suspensions of nanoparticles (nanofluids) based on
rheology. Particuology, 7(2), 151-157.
Chevalier, J., Tillement, O., & Ayela, F. (2007). Rheological properties of nanofluids
flowing through microchannels. Applied physics letters, 91(23), 233103-233103-
233103.
Choi, S. U., & Eastman, J. (1995). Enhancing thermal conductivity of fluids with
nanoparticles: Argonne National Lab., IL (United States).
Chon, C.H., Kihm, K.D., Lee, S. P., & Choi, S. U. S. (2005). Empirical correlation finding
the role of temperature and particle size for nanofluid (Al2O3) thermal
conductivity enhancement Applied physics letters, 87 (15)
Clerk Maxwell, J. (1873). A treatise on electricity and magnetism. Also available on
enwikisource. org/wiki/A_Treatise_on_Electricity_and_M agnetism.
Das, S. K., Choi, S. U., Yu, W., & Pradeep, T. (2008). Nanofluids: science and
technology: Wiley-Interscience Hoboken, NJ.
Das, S. K., Putra, N., & Roetzel, W. (2003). Pool boiling characteristics of nano-fluids.
International Journal of Heat and Mass Transfer, 46(5), 851-862.
Dincer, I., & Kanoglu, M. (2010). Refrigeration Systems and Applications: Wiley.
Dinh, K (1996) Heat pipe in HVAC, in Heat Pipe Technology. Perganon, London. Pp
357-363.
Duangthongsuk, W., & Wongwises, S. (2009). Measurement of temperature-dependent
thermal conductivity and viscosity of TiO2-water nanofluids. Experimental
Thermal and Fluid Science, 33(4), 706-714.
Einstein, A. (1906). A new determination of molecular dimensions. Annalen der Physik,
19 (4), 289-306.
78
Elias, M. M., Mahbubul, I. M., Saidur, R., Sohel, M. R., Shahrul, I. M., Khaleduzzaman,
S. S., & Sadeghipour, S. (2014). Experimental investigation on the thermo-
physical properties of Al2O3 nanoparticles suspended in car radiator coolant.
International Communications in Heat and Mass Transfer, 54(0), 48-53.
Feng, Y., Yu, B., Xu, P., & Zou, M. (2007). The effective thermal conductivity of
nanofluids based on the nanolayer and the aggregation of nanoparticles. Journal
of Physics D: Applied Physics, 40(10), 3164.
Firouzfar, E., Soltanieh, M., Noie, S. H., & Saidi, S. H. (2011). Energy saving in HVAC
systems using nanofluid. Applied Thermal Engineering, 31(8–9), 1543-1545.
Gamer , S. D. (1996) Heat pipe for electronics cooling application. Electronics cooling
Spetember 1-9.
Gao, J., Zheng, R., Ohtani, H., Zhu, D., & Chen, G. (2009). Experimental investigation
of heat conduction mechanisms in nanofluids. Clue on clustering. Nano letters,
9(12), 4128-4132.
H. Masuda, A. E., K. Terama, N. Hishinuma,. (1993). Alteration of thermal conductivity
and viscosity of liquid by dispersing ultra-fine particles (Dispersion of Al2O3,
SiO2 and TiO2 ultra-fine particles). Netsu Bussei (Japan), 7, 227-233.
Hamilton, R., & Crosser, O. (1962). Thermal conductivity of heterogeneous two-
component systems. Industrial & Engineering chemistry fundamentals, 1(3), 187-
191.
Herold, K. E, & Rasooly, A. (2009). Lab on a Chip Technology: Fabrication and
microfluidics (Vol. 1): Horizon Scientific Press.
Ho, C., Liu, W., Chang, Y., & Lin, C. (2010). Natural convection heat transfer of alumina-
water nanofluid in vertical square enclosures: an experimental study.
International Journal of Thermal Sciences, 49(8), 1345-1353.
Hojjat, M., Etemad, S. G., Bagheri, R., & Thibault, J. (2009). The thermal conductivity
of non-Newtonian nanofluids. Paper presented at the 8th World Congress of
Chemical Engineering, Montreal, Canada.
Hong, K., Hong, T.-K., & Yang, H.-S. (2006). Thermal conductivity of Fe nanofluids
depending on the cluster size of nanoparticles. Applied Physics Letters, 88(3),
031901.

79
Huang, J., Wang, X., Long, Q., Wen, X., Zhou, Y., & Li, L. (2009). Influence of pH on
the stability characteristics of nanofluids. Paper presented at the Photonics and
Optoelectronics, 2009. SOPO 2009. Symposium on.
Jiang, L., Gao, L., & Sun, J. (2003). Production of aqueous colloidal dispersions of carbon
nanotubes. Journal of Colloid and Interface Science, 260(1), 89-94.
Ju, Y. S., Kim, J., & Hung, M.-T. (2008). Experimental study of heat conduction in
aqueous suspensions of aluminum oxide nanoparticles. Journal of Heat Transfer,
130(9), 092403.
Jung, J.-Y., Lee, J. W., & Kang, Y. T. (2012). CO2 absorption characteristics of
nanoparticle suspensions in methanol. Journal of mechanical science and
technology, 26(8), 2285-2290.
Keblinski, P., Eastman, J. A., & Cahill, D. G. (2005). Nanofluids for thermal transport.
Materials Today, 8(6), 36-44.
Kim, J.-K., Jung, J. Y., & Kang, Y. T. (2007). Absorption performance enhancement by
nano-particles and chemical surfactants in binary nanofluids. International
Journal of Refrigeration, 30(1), 50-57.
Kim, J. H., Jung, C. W., & Kang, Y. T. (2014). Mass transfer enhancement during CO2
absorption process in methanol/Al2O3 nanofluids. International Journal of Heat
and Mass Transfer, 76(0), 484-491.
Krieger, I. M., & Dougherty, T. J. (1959). A Mechanism for Non‐Newtonian Flow in
Suspensions of Rigid Spheres. Transactions of The Society of Rheology (1957-
1977), 3(1), 137-152.
Krishnamurthy, S., Bhattacharya, P., Phelan, P., & Prasher, R. (2006). Enhanced mass
transport in nanofluids. Nano Letters, 6(3), 419-423.
Kulkarni, D. P., Das, D. K., & Chukwu, G. A. (2006). Temperature dependent rheological
property of copper oxide nanoparticles suspension (nanofluid). Journal of
nanoscience and nanotechnology, 6(4), 1150-1154.
Lee, J.-H., Hwang, K. S., Jang, S. P., Lee, B. H., Kim, J. H., Choi, S. U., & Choi, C. J.
(2008). Effective viscosities and thermal conductivities of aqueous nanofluids
containing low volume concentrations of Al2O3 nanoparticles. International
Journal of Heat and Mass Transfer, 51(11), 2651-2656.

80
Lee, J. W., Jung, J.-Y., Lee, S.-G., & Kang, Y. T. (2011). CO2 bubble absorption
enhancement in methanol-based nanofluids. International Journal of
Refrigeration, 34(8), 1727-1733.
Lee, J. W., & Kang, Y. T. (2013). CO2 absorption enhancement by Al2O3 nanoparticles
in NaCl aqueous solution. Energy, 53(0), 206-211.
Lee, K., Hwang, Y., Cheong, S., Kwon, L., Kim, S., & Lee, J. (2009). Performance
evaluation of nano-lubricants of fullerene nanoparticles in refrigeration mineral
oil. Current Applied Physics, 9(2), e128-e131.
Lee, S., Choi, S. U., Li, S., and, & Eastman, J. (1999). Measuring thermal conductivity
of fluids containing oxide nanoparticles. Journal of Heat Transfer, 121(2).
Lee, S. W., Park, S. D., Kang, S., Bang, I. C., & Kim, J. H. (2011). Investigation of
viscosity and thermal conductivity of SiC nanofluids for heat transfer
applications. International Journal of Heat and Mass Transfer, 54(1–3), 433-438.
Lefèvre, F., Conrardy, J.-B., Raynaud, M., & Bonjour, J. (2012). Experimental
investigations of flat plate heat pipes with screen meshes or grooves covered with
screen meshes as capillary structure. Applied Thermal Engineering, 37(0), 95-
102.
Li, C. H., & Peterson, G. (2006). Experimental investigation of temperature and volume
fraction variations on the effective thermal conductivity of nanoparticle
suspensions (nanofluids). Journal of Applied Physics, 99(8), 084314.
Li, X., Zhu, D., Wang, X., Wang, N., Gao, J., & Li, H. (2008). Thermal conductivity
enhancement dependent pH and chemical surfactant for Cu-H2O nanofluids.
Thermochimica Acta, 469(1), 98-103.
Li, Y., Zhou, J. e., Tung, S., Schneider, E., & Xi, S. (2009). A review on development of
nanofluid preparation and characterization. Powder Technology, 196(2), 89-101.
Liu, M.-S., Lin, M. C.-C., Tsai, C., & Wang, C.-C. (2006). Enhancement of thermal
conductivity with Cu for nanofluids using chemical reduction method.
International Journal of Heat and Mass Transfer, 49(17), 3028-3033.
Longo, G. A., & Zilio, C. (2011). Experimental measurement of thermophysical
properties of oxide–water nano-fluids down to ice-point. Experimental Thermal
and Fluid Science, 35(7), 1313-1324.
81
Lu, W.-Q., & Fan, Q.-M. (2008). Study for the particle's scale effect on some
thermophysical properties of nanofluids by a simplified molecular dynamics
method. Engineering analysis with boundary elements, 32(4), 282-289.
Mahbubul, I., Saidur, R., & Amalina, M. (2012). Investigation of viscosity of R123-TiO2
nanorefrigerant. Int. J. Mech. Mater. Eng, 7(2), 146-151.
Mahbubul, I. M., Saidur, R., & Amalina, M. A. (2012). Latest developments on the
viscosity of nanofluids. International Journal of Heat and Mass Transfer, 55(4),
874-885.
Mahbubul, I. M., Saidur, R., & Amalina, M. A. (2013). Influence of particle concentration
and temperature on thermal conductivity and viscosity of Al2O3/R141b
nanorefrigerant. International Communications in Heat and Mass Transfer, 43(0),
100-104.
Maı̈ga, S. E. B., Nguyen, C. T., Galanis, N., & Roy, G. (2004). Heat transfer behaviours
of nanofluids in a uniformly heated tube. Superlattices and Microstructures,
35(3), 543-557.
Mallick, K., Jarvis, A., Fisher, J. B., Tu, K. P., Boegh, E., & Niyogi, D. (2013). Latent
Heat Flux and Canopy Conductance Based on Penman–Monteith, Priestley–
Taylor Equation, and Bouchet’s Complementary Hypothesis. Journal of
Hydrometeorology, 14(2), 419-442.
Mariano, A., Pastoriza-Gallego, M. J., Lugo, L., Camacho, A., Canzonieri, S., & Piñeiro,
M. M. (2013). Thermal conductivity, rheological behaviour and density of non-
Newtonian ethylene glycol-based SnO2 nanofluids. Fluid Phase Equilibria, 337,
119-124.
Mintsa, H. A., Roy, G., Nguyen, C. T., & Doucet, D. (2009). New temperature dependent
thermal conductivity data for water-based nanofluids. International Journal of
Thermal Sciences, 48(2), 363-371.
Murshed, S. M. S., Leong, K. C., & Yang, C. (2008). Investigations of thermal
conductivity and viscosity of nanofluids. International Journal of Thermal
Sciences, 47(5), 560-568.
Namburu, P. K., Kulkarni, D. P., Misra, D., & Das, D. K. (2007). Viscosity of copper
oxide nanoparticles dispersed in ethylene glycol and water mixture. Experimental
Thermal and Fluid Science, 32(2), 397-402.
Nguyen, C. T., Desgranges, F., Galanis, N., Roy, G., Maré, T., Boucher, S., & Angue
Mintsa, H. (2008). Viscosity data for Al2O3–water nanofluid—hysteresis: is heat

82
transfer enhancement using nanofluids reliable? International Journal of Thermal
Sciences, 47(2), 103-111.
Nguyen, C. T., Desgranges, F., Roy, G., Galanis, N., Maré, T., Boucher, S., & Angue
Mintsa, H. (2007). Temperature and particle-size dependent viscosity data for
water-based nanofluids – Hysteresis phenomenon. International Journal of Heat
and Fluid Flow, 28(6), 1492-1506.
Nielsen, L. E. (1970). Generalized equation for the elastic moduli of composite materials.
Journal of Applied Physics, 41(11), 4626-4627.
Pak, B. C., & Cho, Y. I. (1998). Hydrodynamic and heat transfer study of dispersed fluids
with submicron metallic oxide particles. Experimental Heat Transfer an
International Journal, 11(2), 151-170.
Pang, C., Jung, J.-Y., & Kang, Y. T. (2013). Thermal conductivity enhancement of Al2O3
nanofluids based on the mixtures of aqueous NaCl solution and CH3OH.
International Journal of Heat and Mass Transfer, 56(1–2), 94-100.
Pang, C., Jung, J.-Y., Lee, J. W., & Kang, Y. T. (2012). Thermal conductivity
measurement of methanol-based nanofluids with Al2O3 and SiO2 nanoparticles.
International Journal of Heat and Mass Transfer, 55(21–22), 5597-5602. doi:
Perez-Lombard, L., Ortiz, J., & Pout, C. (2008). Areview on building energy consumption
information Energy and buildings, 40(3), 394-398.
Patel, H. E., Sundararajan, T., & Das, S. K. (2010). An experimental investigation into
the thermal conductivity enhancement in oxide and metallic nanofluids. Journal
of Nanoparticle Research, 12(3), 1015-1031.
Peng, H., Ding, G., Jiang, W., Hu, H., & Gao, Y. (2009). Heat transfer characteristics of
refrigerant-based nanofluid flow boiling inside a horizontal smooth tube.
International journal of refrigeration, 32(6), 1259-1270.
Penkavova, V., Tihon, J., & Wein, O. (2011). Stability and rheology of dilute TiO2-water
nanofluids. Nanoscale research letters, 6(1), 1-7.
Philip, J., & Shima, P. D. (2014). Role of Thermal Conductivity of Dispersed
Nanoparticle on Heat Transfer Properties of Nanofluids. Industrial & Engineering
Chemistry Research.
Pineda, I. T., Choi, C. K., & Kang, Y. T. (2014). CO2 gas absorption by CH3OH based
nanofluids in an annular contactor at low rotational speeds. International Journal
of Greenhouse Gas Control, 23(0), 105-112.

83
Prasher, R., Phelan, P. E., & Bhattacharya, P. (2006). Effect of aggregation kinetics on
the thermal conductivity of nanoscale colloidal solutions (nanofluid). Nano
Letters, 6(7), 1529-1534.
S.M.S. Murshed, K. C. L., C. Yang. (2005). Enhanced thermal conductivity of TiO2-water
based nanofluids. International Journal of Thermal Sciences, 44, 367.
Saidur, R., Leong, K. Y., & Mohammad, H. A. (2011). A review on applications and
challenges of nanofluids. Renewable and Sustainable Energy Reviews, 15(3),
1646-1668.
Shames, A., Osipov, V. Y., Von Bardeleben, H., & Vul, A. Y. (2012). Spin S= 1 centers:
a universal type of paramagnetic defects in nanodiamonds of dynamic synthesis.
Journal of Physics: Condensed Matter, 24(22), 225302.
Shanker, N. S., Reddy, M. C. S., & Rao, V. B. (2012). On prediction of viscosity of
nanofluids for low volume fractions of nanoparticles. Paper presented at the
International Journal of Engineering Research and Technology.
Shukla, R., Bansal, V., Chaudhary, M., Basu, A., Bhonde, R. R., & Sastry, M. (2005).
Biocompatibility of gold nanoparticles and their endocytotic fate inside the
cellular compartment: a microscopic overview. Langmuir, 21(23), 10644-10654.
Shukla, R. K., & Dhir, V. K. (2005). Study of the effective thermal conductivity of
nanofluids. Paper presented at the ASME 2005 International Mechanical
Engineering Congress and Exposition.
SiO2 XRD pattern ). Retrieved 12.01.2015, from http://www.sigmaaldrich.com
Smalley, R. E. (2005). Future global energy prosperity: the terawatt challenge. Mrs
Bulletin, 30(06), 412-417.
Song, S., Peng, C., Gonzalez-Olivares, M. A., Lopez-Valdivieso, A., & Fort, T. (2005).
Study on hydration layers near nanoscale silica dispersed in aqueous solutions
through viscosity measurement. Journal of Colloid and Interface Science, 287(1),
114-120..
Sommers, A. D., & Yerkes, K. L. (2010). Experimental investigation into the convective
heat transfer and system-level effects of Al2O3-propanol nanofluid. Journal of
Nanoparticle Research, 12(3), 1003-1014.
Thermophysical Properties - Methanol ). Retrieved 11.09.2013, from
http://www.engineeringtoolbox.com

84
Timofeeva, E. V., Gavrilov, A. N., McCloskey, J. M., Tolmachev, Y. V., Sprunt, S.,
Lopatina, L. M., & Selinger, J. V. (2007). Thermal conductivity and particle
agglomeration in alumina nanofluids: experiment and theory. Physical Review E,
76(6), 061203.
Torres Pineda, I., Lee, J. W., Jung, I., & Kang, Y. T. (2012). CO2 absorption enhancement
by methanol-based Al2O3 and SiO2 nanofluids in a tray column absorber.
International Journal of Refrigeration, 35(5), 1402-1409.
Tseng, W. J., & Lin, K.-C. (2003). Rheology and colloidal structure of aqueous TiO2
nanoparticle suspensions. Materials Science and Engineering: A, 355(1–2), 186-
192.
Turgut, A., Tavman, I., Chirtoc, M., Schuchmann, H., Sauter, C., & Tavman, S. (2009).
Thermal conductivity and viscosity measurements of water-based TiO2
nanofluids. International Journal of Thermophysics, 30(4), 1213-1226.
Vajjha, R. S., & Das, D. K. (2009). Experimental determination of thermal conductivity
of three nanofluids and development of new correlations. International Journal of
Heat and Mass Transfer, 52(21–22), 4675-4682.
Wang, X.-j., & Zhu, D.-s. (2009). Investigation of pH and SDBS on enhancement of
thermal conductivity in nanofluids. Chemical Physics Letters, 470(1), 107-111.
Wang, X.-Q., & Mujumdar, A. S. (2007). Heat transfer characteristics of nanofluids: a
review. International Journal of Thermal Sciences, 46(1), 1-19.
Wasp, E. J., Kenny, J. P., & Gandhi, R. L. (1977). Solid--liquid flow: slurry pipeline
transportation.[Pumps, valves, mechanical equipment, economics]. Ser. Bulk
Mater. Handl.;(United States), 1(4).
Wong, S.-C., Lin, Y.-C., & Liou, J.-H. (2012). Visualization and evaporator resistance
measurement in heat pipes charged with water, methanol or acetone. International
Journal of Thermal Sciences, 52(0), 154-160.
Wu, D., Zhu, H., Wang, L., & Liu, L. (2009). Critical issues in nanofluids preparation,
characterization and thermal conductivity. Current Nanoscience, 5(1), 103-112.
Xia, G., Jiang, H., Liu, R., & Zhai, Y. (2014). Effects of surfactant on the stability and
thermal conductivity of Al2O3/de-ionized water nanofluids. International Journal
of Thermal Sciences, 84(0), 118-124.

85
Xie, H., Wang, J., Xi, T., Liu, Y., Ai, F., & Wu, Q. (2002). Thermal conductivity
enhancement of suspensions containing nanosized alumina particles. Journal of
Applied Physics, 91(7), 4568-4572.
Yu, W., & Choi, S. (2003). The role of interfacial layers in the enhanced thermal
conductivity of nanofluids: a renovated Maxwell model. Journal of Nanoparticle
Research, 5(1-2), 167-171.
Yu, W., Xie, H., Chen, L., & Li, Y. (2010). Enhancement of thermal conductivity of
kerosene-based Fe3O4 nanofluids prepared via phase-transfer method. Colloids
and Surfaces A: Physicochemical and Engineering Aspects, 355(1), 109-113.
Zhang, X., Gu, H., & Fujii, M. (2007). Effective thermal conductivity and thermal
diffusivity of nanofluids containing spherical and cylindrical nanoparticles.
Experimental Thermal and Fluid Science, 31(6), 593-599.
Zhu, H.-t., Lin, Y.-s., & Yin, Y.-s. (2004). A novel one-step chemical method for
preparation of copper nanofluids. Journal of colloid and interface science, 277(1),
100-103.
Zhu, H., Zhang, C., Liu, S., Tang, Y., & Yin, Y. (2006). Effects of nanoparticle clustering
and alignment on thermal conductivities of Fe3O4 aqueous nanofluids. Applied
Physics Letters, 89(2), 023123.

86
LIST OF PUBLICATION AND PRESENTATION
Journal paper:
1. R.M. Mostafizur, M.H.U. Bhuiyan, R. Saidur, A.R. Abdul Aziz, Thermal
conductivity variation for methanol based nanofluids, International Journal of
Heat and Mass Transfer, 76(0) (2014) 350-356. (Q1, IF: 2.38)
2. R.M. Mostafizur, A.R. Abdul Aziz, R. Saidur, M.H.U. Bhuiyan, I.M. Mahbubul,
Effect of temperature and volume fraction on rheology of methanol based
nanofluids, International Journal of Heat and Mass Transfer, 77(0) (2014) 765-
769. (Q1, IF: 2.38)
3. R.M. Mostafizur, R. Saidur, A.R. Abdul Aziz, M.H.U. Bhuiyan, Thermophysical
properties of methanol based Al2O3 nanoluids, International Journal of Heat and
Mass Transfer, 85 (0) (2015) 414-419. (Q1, IF: 2.38)
Conference paper:
1. R.M. Mostafizur, R. Saidur, A.R. Abdul Aziz, M.H.U. Bhuiyan, Investigation
on stability and density of methanol based TiO2 nanofluids, 7th International
Conference on Cooling & Heating Technologies (ICCHT 2014), 4th – 6th
November 2014, Subang Jaya, Selangor, Malaysia.
2. R.M. Mostafizur, R. Saidur, A.R. Abdul Aziz, M.H.U. Bhuiyan, Viscosity
measurement of methanol based SiO2 nanofluids , 6th BSME International
Conference on Thermal Engineering (ICTE 2014) December 19-21, 2014,
Dhaka, Bangladesh.

87
APPENDIXES
APPENDIX A: CHEMICAL ELEMENTS COMPOSITION OF NANOPARTICLES
The element composition of Al2O3, SiO2 and TiO2 nanoparticles are analyzed using
Energy dispersive spectrometry (EDS) system.
Figure A.1: SEM image of Al2O3 nanoparticles during EDS analysis with the marking
of point 1
Figure A.2: EDS analysis of Al2O3 nanoparticles at point 1.
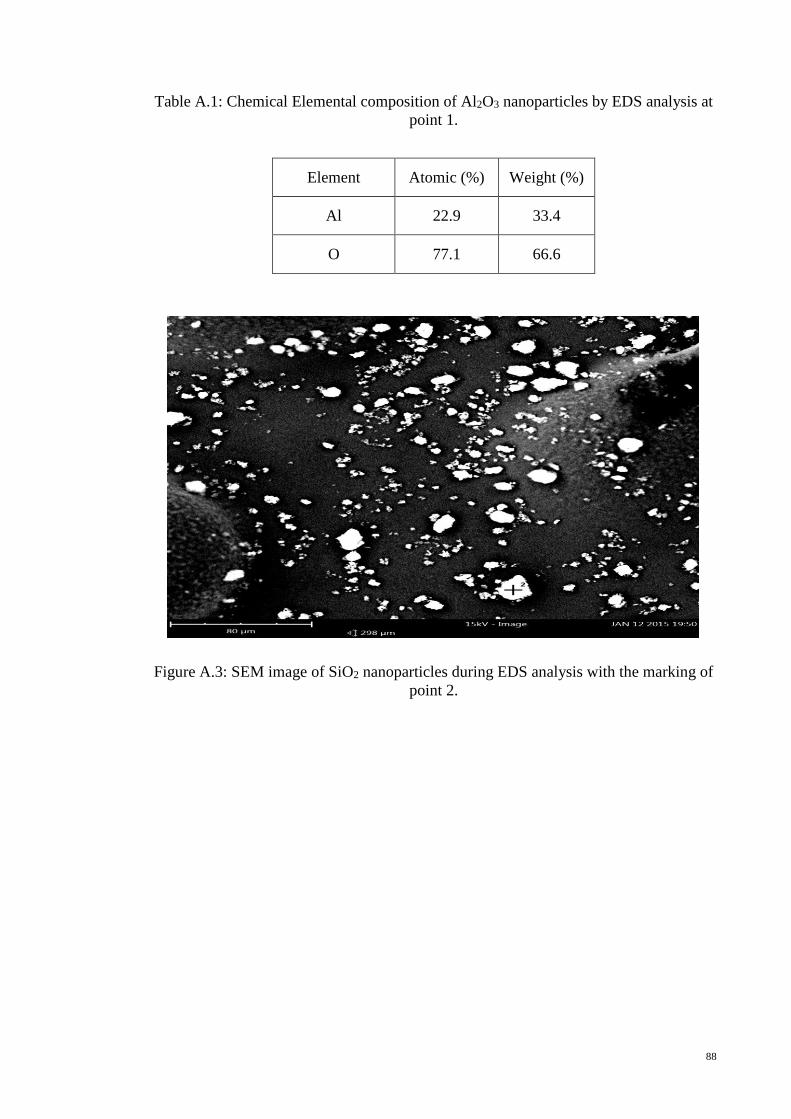
88
Table A.1: Chemical Elemental composition of Al2O3 nanoparticles by EDS analysis at
point 1.
Element Atomic (%) Weight (%)
Al 22.9 33.4
O 77.1 66.6
Figure A.3: SEM image of SiO2 nanoparticles during EDS analysis with the marking of
point 2.

89
Figure A.4: EDS analysis of SiO2 nanoparticles at point 2.
Table A.2: Chemical Elemental composition of SiO2 nanoparticles by EDS analysis at
point 2.
Element Atomic (%) Weight (%)
Si 19.8 30.3
O 80.2 69.7
Figure A.5: SEM image of TiO2 nanoparticles during EDS analysis with the marking of
point 3.

90
Figure A.6: EDS analysis of TiO2 nanoparticles at point 3.
Table A.3: Chemical Elemental composition of TiO2 nanoparticles by EDS analysis at
point 3.
Element Atomic (%) Weight (%)
Ti 13.4 31.7
O 86.6 68.3
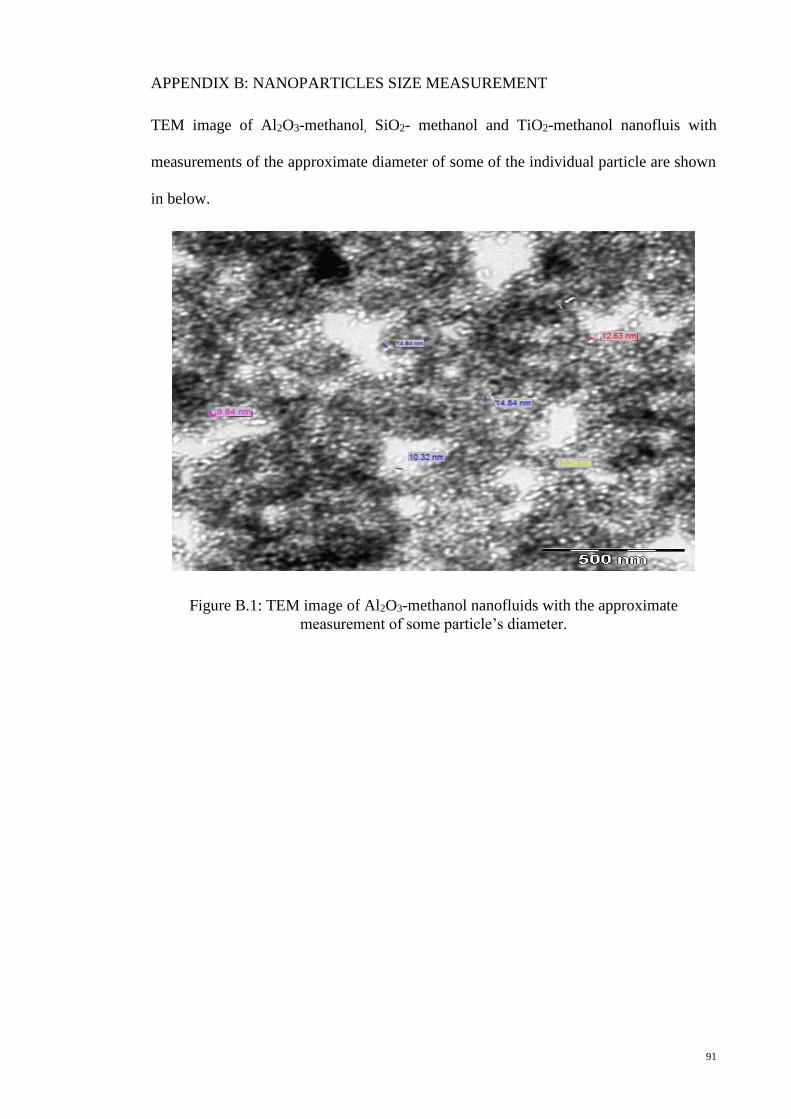
91
APPENDIX B: NANOPARTICLES SIZE MEASUREMENT
TEM image of Al2O3-methanol, SiO2- methanol and TiO2-methanol nanofluis with
measurements of the approximate diameter of some of the individual particle are shown
in below.
Figure B.1: TEM image of Al2O3-methanol nanofluids with the approximate
measurement of some particle’s diameter.

92
Figure B. 2: TEM image of SiO2-methanol nanofluids with the approximate
measurement of some particle’s diameter.
Figure B.3: TEM image of TiO2-methanol nanofluids with the approximate
measurement of some particle’s diameter.

93
APPENDIX C: VOLUME DISTRIBUTION WITHIN THE NANOFLUIDS
Figure C.1: Volume distribution of nanoparticle size within the 0.10 vol% of Al2O3-
methanol nanofluids
Figure C.2: Volume distribution of nanoparticle size within the 0.05 vol% of SiO2-
methanol nanofluids
0
10
20
30
40
50
60
70
80
90
100
0
2
4
6
8
10
12
10 24.36 68.06 190.1 531.2 1484 4145
Cum
ula
tive
volu
me
(%)
Dif
fere
nti
al V
olu
me
(%)
Diameter (nm)
0
10
20
30
40
50
60
70
80
90
100
0
5
10
15
20
25
10 24.36 68.06 190.1 531.2 1484 4145
Cum
ula
tive
volu
me
(%)
Dif
fere
nti
al V
olu
me
(%)
Diameter (nm)
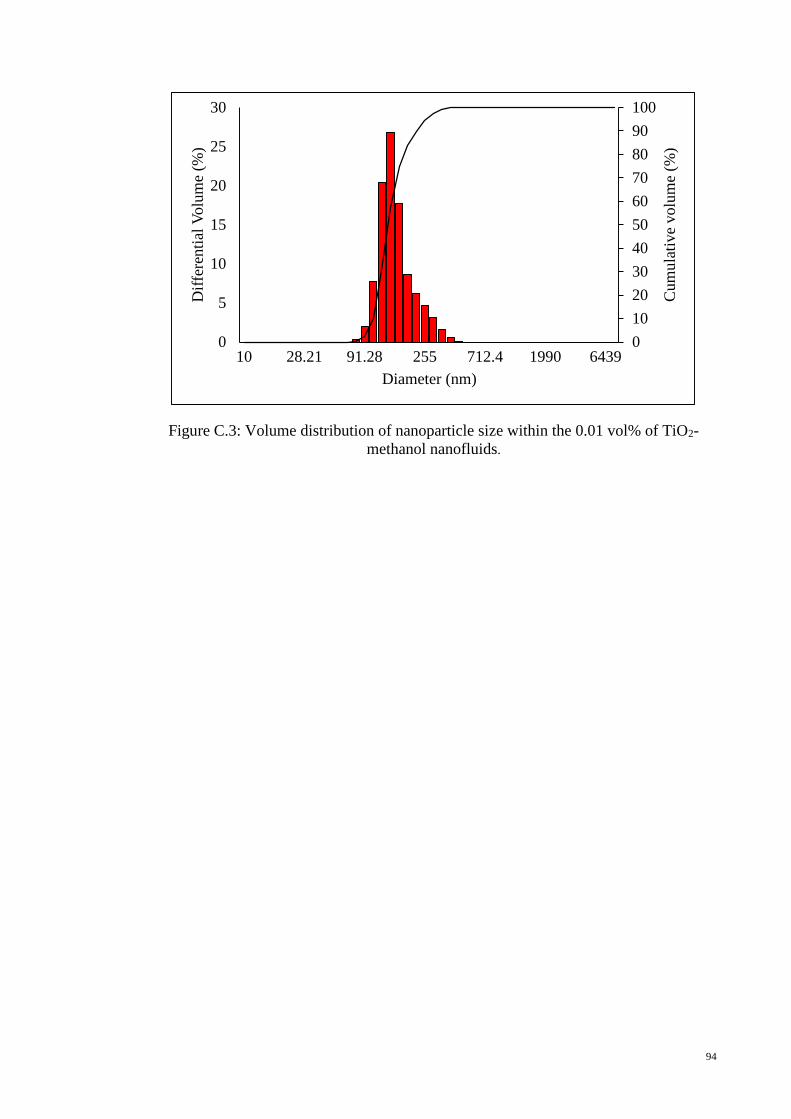
94
Figure C.3: Volume distribution of nanoparticle size within the 0.01 vol% of TiO2-
methanol nanofluids.
0
10
20
30
40
50
60
70
80
90
100
0
5
10
15
20
25
30
10 28.21 91.28 255 712.4 1990 6439
Cum
ula
tive
volu
me
(%)
Dif
fere
nti
al V
olu
me
(%)
Diameter (nm)


![BAROPS2010(Reminders)[1] by Prof. Maria Zarah v. Castro](https://img.dokumen.tips/doc/110x75/552637c94a7959bc488b4ee4/barops2010reminders1-by-prof-maria-zarah-v-castro.jpg)