Embed Size (px)
Citation preview

MOE Reporting Capabilities of Controller Closed-loop and Centralized System Software
Subsystem
(Combine all of the local controllers, controlled by master controllers)
Master controller
Description: There are two types of signal system software; one is closed-loop system software, and one is centralized system software. Each type of software has different capabilities to report MOE. Definition: Closed-loop System Software: The term “Closed-loop” is use to describe a method of interconnecting several local signalized intersection controllers with a master controller; the central computer can connect with the master controller via modem or phone line. Meanwhile, local controllers compose a subsystem to communicate with the master controller via fiber optic cables, electrical cables, or twisted pair wire, sending back information regarding their operations. It is common to assign one master controller for each subsystem. These allow an operator to change signal timing functions through a central office computer and to monitor on-street masters and their subsystems. Close-loop system component: central controller, master controller, and local controllers.
Central computer
MM M
Local
controller
Closed-loop system : Operation process
: Definition Centralized System Software: Centralized System is a computer control system in which the central computer, central communication facilities, and display equipment are all situated at the same location, and the center interconnects and communicates directly with each local controller. From this center, an operator can coordinate and control traffic signals or other traffic control functions throughout the whole area. Centralized system component: central controller and local controllers.

Central control
Local controller Local controller Local controller
Centralized system * The central controller can connect with the local controllers directly.
ifference between Closed-loop and Centralized System
The Closed-loop system needs to set several master controllers to be a bridge between local controllers
oftware reporting capabilities:
amily controllers.
) can be presented in table or
D -
and central controller. These bridges connect the central controller to the local controllers and use this method to control and manage the local controllers. In a centralized system, the central controller can connect and manage the local controllers directly. It doesn’t need the master controllers to communicate with the local controllers.
S
A. Closed-loop system software
1) Aries ( By ECONOLITE)
- Compatible with model ASC/2 f
- Plot/Export Feature: Detector log data (i.e. volume occupancy and speedplot format.
Figure 1: Aries Detector Log File Format (Plot)

Figure 2: Aries Detector Log File Format(Table)
Aries Log Files Manager: (All data can be sorted by each date and zone)
1. Detecto cy and speed data that are
2. aging
3. ces that happened in the
-
(Zone: It is a manager system of one assigned location. E.g. City of Moscow can consider to a zone, and we can construct some networks/ or intersections in that zone)
r log Files: Aries logs the data such as vehicle volume, occupancollected by each local controller. The report is presented in a plot or table format. The process for aggregating these data is defined in the Aries Manuel chapter eight and seventeen.)
Detector Group Profiles: This function will help you to organize the data recorded in each detector log file. You can use this function to compare different detector log files. (For mandetector files refer to Aries Manuel chapter eight and seventeen.)
Event Log Files: The event log files contain records of recorded occurrenassigned zone such as phase sequence and signal operation that were collected by the assigned controller. You need to set up the time period that you want before logging the event data. The result is presented in a table format. (as show below) (Chapter 17 of the Aries Manual describesthe aggregation process.)
Figure 3: Aries Event Log File

4. Event Group Profiles: This function will help you to organize the historical data that you recorded
- Main ce of information and
-
can be accumulated from multiple intersections simultaneously.
ed splits.
rs.
in previously in event log files. (refer to Aries Manuel chapter seventeen.)
reports from detector data: Volume, Occupancy, and Speed data. (The sourdata present format has mentioned in “detector logging files”.)
Split Monitor Report:
1. The phase split data
2. The report contains actual phase split and usage comparing actual splits and programm
a. Actual splits: The actual phase split collected by controllers in the field.
b. Programmed splits: The percentage of phase split that we set in controlle
Figure 4: Aries Split Monitor Report
ss than the programmed phase
rammed phase usage time should be the combination of Green + Yellow + Red for each phase.
The negative value corresponds to the actual phase usage begin leusage time. In figure 4, the positive value corresponds to the actual phase usage begin more than the programmed phase usage time. If the phase is forced off, the “F” will append by the end of the number.
The ProgThe Green time, determined by subtracting the Yellow and Red times from the Split, may
not necessarily be the Max 1 or Max 2 values programmed into the controller. But it will be the maximum amount of Green time allocated to the phase when that particular Cycle / Split combination is used. It can able to identify if the phase Max out or Gap out from this report, by comparing the different value of programmed phase usage time and the actual split time.

B. Centralized system software
is central system software that can be used to administer 2070 local contro
- Plot/Export Feature: Detector log data can be presented in Data Base File format.
uicNet logs detector data such as vehicle volume, occupancy and speed data
uel
1) QuicNet/4: (By BI Tran)
The QuicNet/4 software llers. It can communicate with local controllers and control their signal functions; data
accumulated and time base coordination.
- Log Files Manager:
Detector log Files: Qcollected by each local controller. The report uses a data base file format. QuicNet also offers aggregate group data, where detectors are assigned to groups before logging the data from local controllers. Figure 5 below shows detector logging report set up form. (Refer to the QuicNet Manpage 35~40.)
Figure 5: QuicNet System Detector Report
- S
lit data of both recurring and one-time split monitor observations. It can be
2
plit Monitoring Report:
1. Collect the phase spaccumulated from multiple intersections simultaneously.
. Reports actual phase split and usage for each controller.

Figure 6: QuicNet Split Monitor Report
QuicNet can plot the Time-space Diagram. This is one of the most powerful tools embedded in QuicNet/4 to help visualize actual traffic flows which aggregate form the detector log files.
Figure 7: QuicNet Real-Time Green Band Display.
2) ICONS (By SIEMENS)
ICONS is an advanced Traffic Management System that provides a centralized integrated platform for traffic signal control, information management and graphical data display, it is only compatible with model ASC/2 or 2070 with NextPhase controllers.
The ICONS likes QuicNet also can receive controller status and detector data. It also can upload and download local controller parameters to and from each intersection. - Plot/Export Feature: Detector log data can be presented in table and plot formats.
- Log Files Manager:
1. Detector log Files: The ICONS system is able to collect, log, display, and export vehicle system detector data (aggregate the data from local detectors) consisting of vehicle Volume, Occupancy, and Speed (VOS). (VOS is a special term in ICONS.) The VOS operation is able to collect this traffic
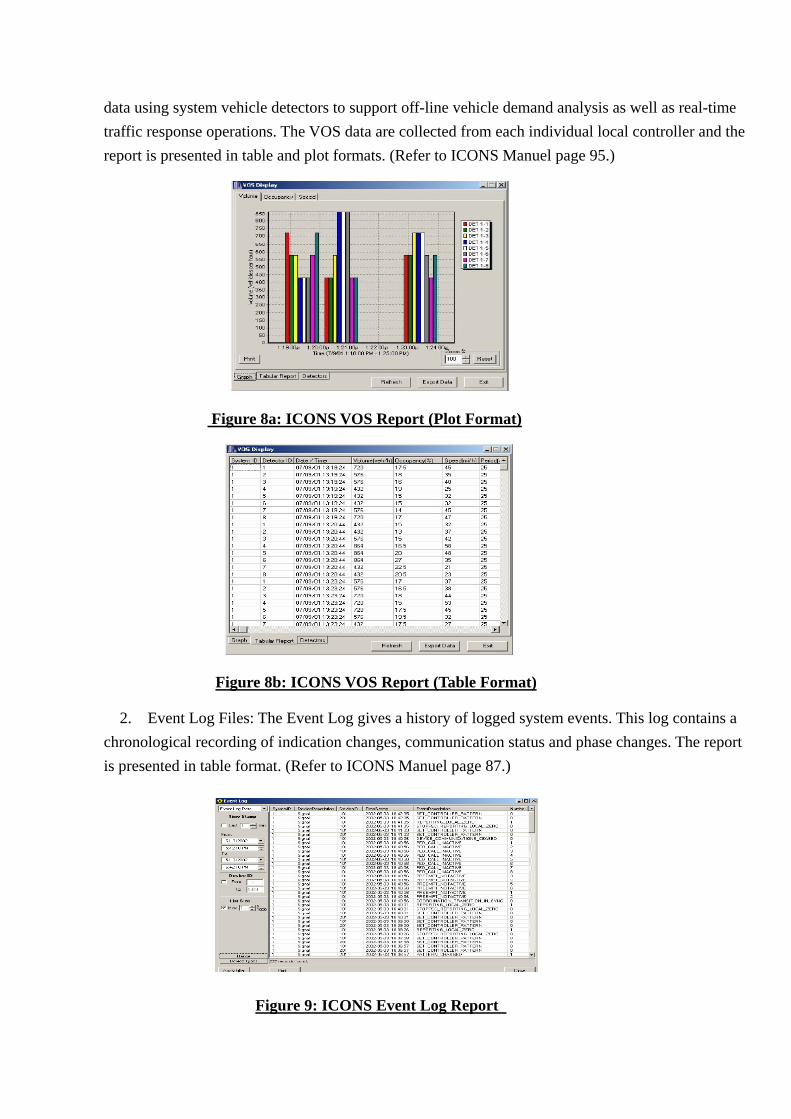
data using system vehicle detectors to support off-line vehicle demand analysis as well as real-time traffic response operations. The VOS data are collected from each individual local controller and the report is presented in table and plot formats. (Refer to ICONS Manuel page 95.)
Figure 8a: ICONS VOS Report (Plot Format)
Figure 8b: ICONS VOS Report (Table Format)
2. Event Log Files: The Event Log gives a history of logged system events. This log contains a chronological recording of indication changes, communication status and phase changes. The report is presented in table format. (Refer to ICONS Manuel page 87.)
Figure 9: ICONS Event Log Report

- Time-space Diagram. The Time-Space diagram is a tool to analyze progression and coordination along a defined route. It displays progression color bands from multiple intersections in coordinated operation allowing an operator to verify the level of optimization based on various parameters. The Time-Space Diagram uses phase data transition information that is stored by the ICONS database for a selected controller.
Figure 10: ICONS Time-Space Diagram Report
Split Monitoring Report:
1. The phase utilization data for each individual signals can be accumulated from multiple intersections simultaneously.
2. Reports actual split usage for each controller.
Figure 11: ICONS Split Monitor Report
(Bar graphs show comparison of programmed and actual splits, local time zero, phases (in dual ring configuration) and percentages of the utilization of each phase)

C. Including Closed-loop System and Centralized System software
Actra (By SIEMENS)
ACTRA is a PC based transportation management software. It allows the user to enter, monitor, and maintain information for intersections and groups of intersections from a central computer or workstation. ACTRA can generate a series of historical system reports at Master Group and Local Levels, for a user selected time range.
- Plot/Export Feature: Detector log data can be presented in table or plot format.
- ACTRA Log Files Manager:
1. Detector log Files (Intersection System Detector Report): This report summarizes the vehicle volume, raw occupancy, speed, average volume and average occupancy on each detector for a selected intersection for a specified interval of time. The data are collected by local detectors. The report is presented in plot format. (Raw occupancy is the amount of time that the detector is on (seconds). Average occupancy is the percentage of detector occupancy time divided by time interval
* Time interval is an interval assigned by the operator.
Figure 12a: ACTRA Detector Log File Report (Raw Volume and Raw Occupancy)
Figure 12b: ACTRA Average Volume and Average Occupancy
2. Event Log Files: ACTRA can generate a series of historical system reports at master groups

and local levels for a user selected time range. This log contains a chronological recording of significant signal changes, such as communication status and phase changes.
- Intersection Cycle MOE Report: ACTRA can report the cycle phase utilization. ACTRA reports the per cycle phase utilization in seconds, i.e., the negative value corresponds to
the actual phase usage less than the programmed phase usage time and the positive value corresponds to the actual phase usage more than the programmed phase usage time. It also can able to identify if the phase Max out or Gap out from this report by comparing the different value of programmed phase usage time and the actual split time like the Aries . In cycle MOE report list below, it uses different symbols to present the phase utilization status. (i.e. #: phase split time greater than the used time, #F: phase forced off)
Figure 13: ACTRA Cycle MOE Report
- MOE Report different than other software: This report includes the intersection delay, which is
calculated as the product of number of cars waiting and waiting time (second).
Figure 14: ACTRA MOE Report - Split Monitoring Report:
1. The phase split data can be accumulated from multiple intersections simultaneously.
2. Reports actual split usage for each controller.

Figure 15: ACTRA Split Monitor Report
Bar graphs show comparison of programmed and actual splits, local time zero, phases (in dual ring configuration) and percentages of the utilization of each phase Table1: Comparison the MOE reporting Capabilities:
Aries Actra Quicknet Icon ActraVolume Yes Yes Yes Yes YesOccupancy Yes Yes Yes Yes YesSpeed Yes Yes Yes Yes YesDelay No Yes No No YesQueue length No No No No NoSplit Usage Monitoring Yes Yes Yes Yes YesTime Space Diagram No No Yes Yes NoGreen Splits Yes Yes Yes Yes YesAverage Green Utility No Yes Yes Yes YesGap's/F.O.s/Max's No Yes No No YesTravel Time No No No No NoStops No No No No No
Closed-loop Software Centralized SoftwareMeasures ofEffectiveness

Table2: Comparison the Function of Each Controller Software
Software Centralized SoftwareClosed-loop
Aries Actra Quicknet ICON ActraDetector Logging File Format Plot/Table Plot Table Plot/Table PlotDetector Logging Data V/O/S V/O/S* V/O/S V/O/S V/O/S*
Cycle Data Logging( Detector Log File) No Yes No No YesRaw Data File( Detector Log File) No Yes No No YesSpecify Time Interval Other Than Cycle Yes Yes Yes Yes YesReal-Time Availablity Yes Yes Yes Yes YesHistorical Data Yes Yes Yes Yes YesSplit Monitor Report Yes Yes Yes Yes YesPhase Terminate Data* Yes Yes Yes Yes Yes
V/O/S: Volume/ Occupancy/SpeedV/O/S*: Volume/ Raw Occupancy/Speed
Phase Terminate Data* : 1. Can determine the phase terminate or not by analysis the programmedsplit and actual split in split monitor report. 2. Can determine which phase Max out/Forced Off/ GapOut in aplit monitor report
Name


![Closed loop Urbanism [Autosaved]](https://img.dokumen.tips/doc/110x75/58edac181a28aba90c8b4605/closed-loop-urbanism-autosaved.jpg)