Embed Size (px)
Citation preview
ModuleSupply and Demand:Supply and Equilibrium
KRUGMAN'SMACROECONOMICS for AP*
6
Margaret Ray and David Anderson

What you will learnWhat you will learn
in thisin this ModuleModule::• What the supply curve is
• The difference between movements along the supply curve and changes in supply
• The factors that shift the supply curve
• How supply and demand curves determine a market's equilibrium price and equilibrium quantity
• In the case of a shortage or surplus, how price moves the market back to equilibrium

The Supply Schedule and the The Supply Schedule and the Supply CurveSupply Curve
• Supply schedule
• Quantity supplied
• Supply Curve
• Law of supply
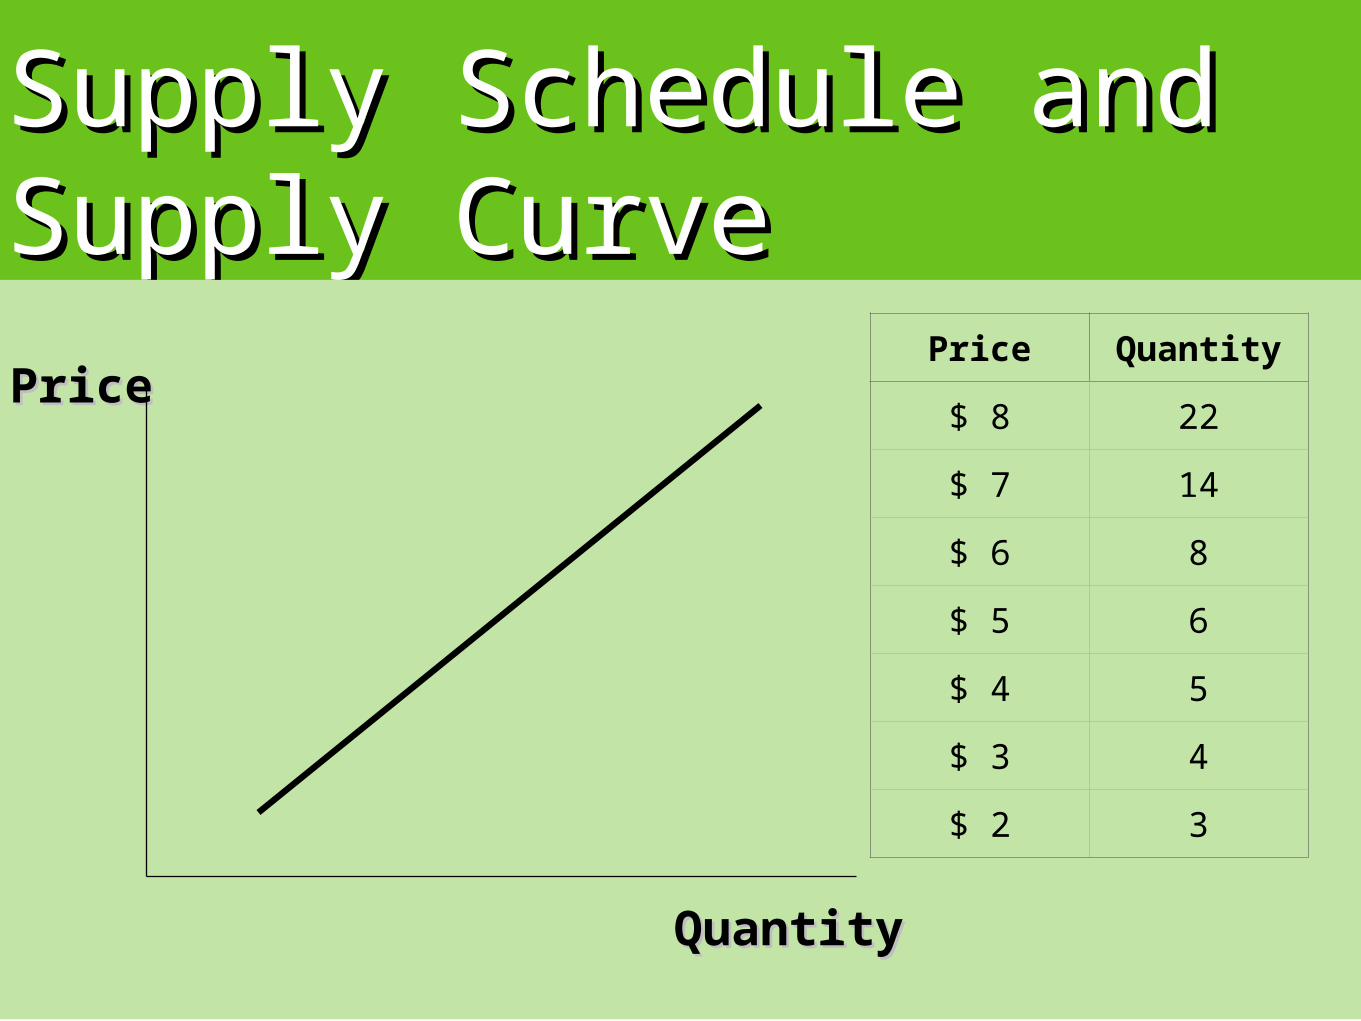
Supply Schedule and Supply Schedule and Supply CurveSupply Curve
Price Quantity
$ 8 22
$ 7 14
$ 6 8
$ 5 6
$ 4 5
$ 3 4
$ 2 3
QuantityQuantity
PricePrice

Understanding Shifts of the Understanding Shifts of the Supply CurveSupply Curve
• Increase = right, decrease = left
• T.R.I.C.E. shifts supply
• Technology
• Related prices (complements in production, substitutes in production)
• Input prices
• Competition (number of producers)
• Expectations

• Equilibrium
• Equilibrium price
• Equilibrium quantity
• Market-clearing price
Supply, Demand, and EquilibriumSupply, Demand, and Equilibrium

Finding the Equilibrium Price Finding the Equilibrium Price and Quantityand Quantity
equilibriumEequilibriumprice
equilibriumquantity

Why Does the Market Price Fall If It Why Does the Market Price Fall If It Is Above the Equilibrium Price?Is Above the Equilibrium Price?
• Surplus
• Producer's Incentive

Why Does the Market Price Rise If It Why Does the Market Price Rise If It is Below the Equilibrium Price?is Below the Equilibrium Price?
• Shortage
• Consumer's Incentive
• The tendency towards equilibrium

Figure 6.1 The Supply Schedule and the Supply CurveRay and Anderson: Krugman’s Economics for AP, First Edition
Copyright © 2011 by Worth Publishers

Figure 6.2 An Increase in SupplyRay and Anderson: Krugman’s Economics for AP, First Edition
Copyright © 2011 by Worth Publishers

Figure 6.3 Movement Along the Supply Curve Versus Shift of the Supply Curve
Ray and Anderson: Krugman’s Economics for AP, First EditionCopyright © 2011 by Worth Publishers

Figure 6.4 Shifts of the Supply CurveRay and Anderson: Krugman’s Economics for AP, First Edition
Copyright © 2011 by Worth Publishers

Figure 6.5 The Individual Supply Curve and the Market Supply Curve
Ray and Anderson: Krugman’s Economics for AP, First Edition
Copyright © 2011 by Worth Publishers

Table 6.1 Factors That Shift SupplyRay and Anderson: Krugman’s Economics for AP, First Edition
Copyright © 2011 by Worth Publishers

Figure 6.6 Market EquilibriumRay and Anderson: Krugman’s Economics for AP, First Edition
Copyright © 2011 by Worth Publishers

Figure 6.7 Price Above Its Equilibrium Level Creates a Surplus
Ray and Anderson: Krugman’s Economics for AP, First EditionCopyright © 2011 by Worth Publishers
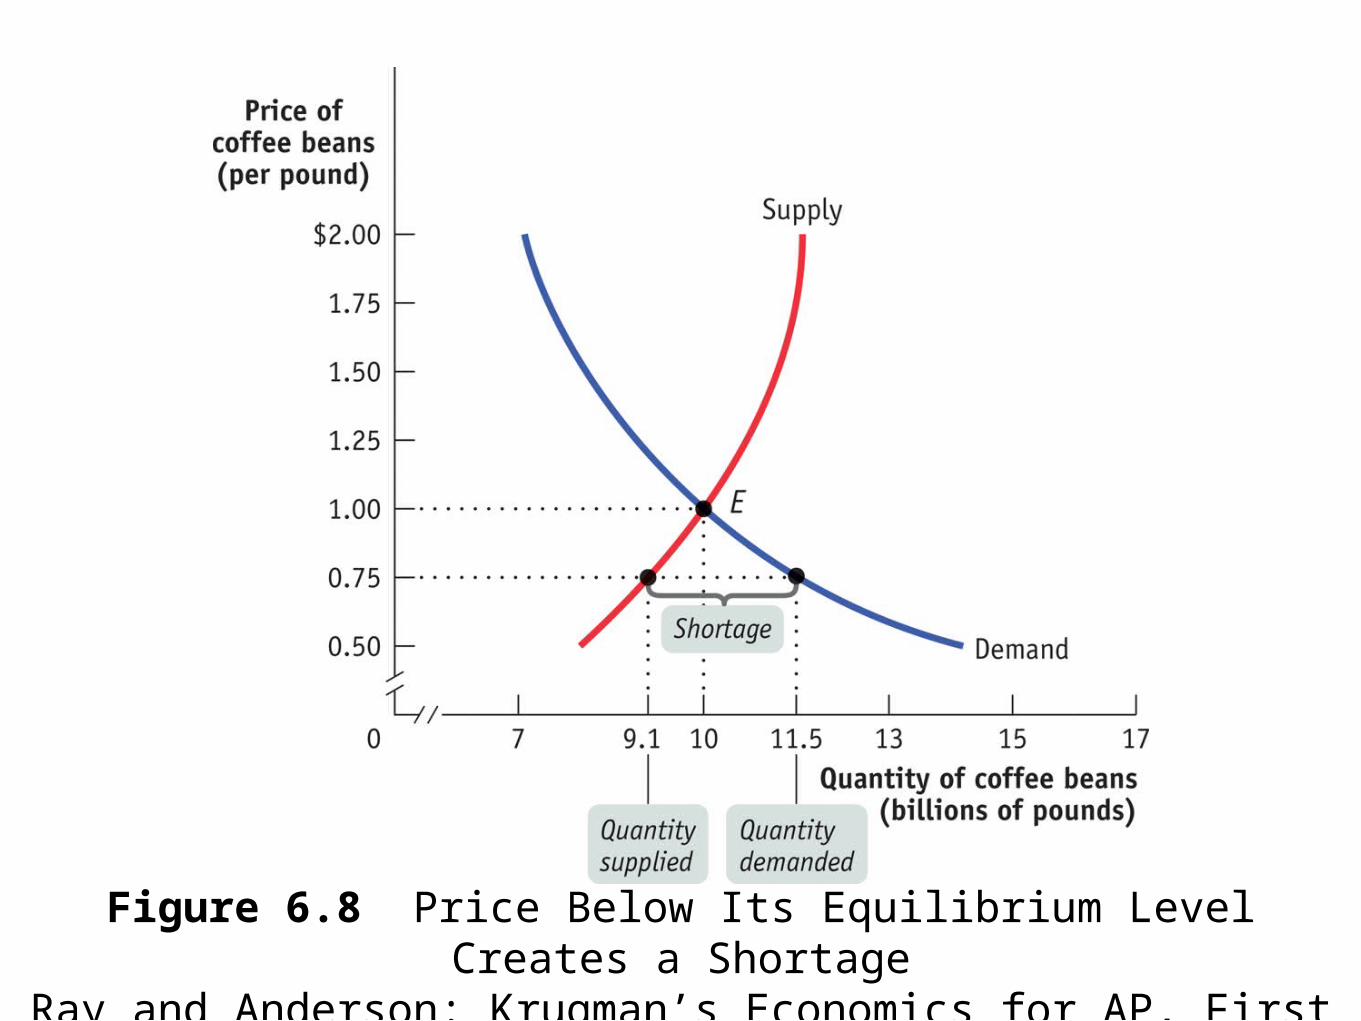
Figure 6.8 Price Below Its Equilibrium Level Creates a Shortage
Ray and Anderson: Krugman’s Economics for AP, First EditionCopyright © 2011 by Worth Publishers