Embed Size (px)
Citation preview
1Michigan Technological University
Module 2. Environmentally Conscious Design of Processes
NSF Summer Institute on Nano Mechanics and Materials:A Short Course on Nanotechnology, Biotechnology, and Green
Manufacturing for Creating Sustainable Technologies
June 20-24 , 2005
David R. Shonnard
Associate Professor
Department of Chemical Engineering
Michigan Technological University
2Michigan Technological University
Principles of Green Engineering
Green Engineering: A design approach for
environmental sustainability
Estimating environmental properties of pollutants
(chapter 5)
Estimating fate and exposure of pollutants (chapter 6)
Estimating pollutant emissions from processes
(chapter 8)
Pollution prevention: 4 examples (chapter 9)
Module 2 outline

3Michigan Technological University
Principles of Green Engineering*
Engineer processes and products holistically, use systems analysis, and integrate environmental impact assessment tools.
Conserve and improve natural ecosystems while protecting human health and well-being.
Use life-cycle thinking in all engineering activities.
Ensure that all material and energy inputs and outputs are as inherently safe and benign as possible.
Minimize depletion of natural resources.
Strive to prevent waste.
Develop and apply engineering solutions, while being cognizant of local geography, aspirations, and cultures.
Create engineering solutions beyond current or dominant technologies; improve, innovate, and invent (technologies) to achieve sustainability.
Actively engage communities and stakeholders in development of engineering solutions.
*as developed by more than 65 engineers and scientists at the Green Engineering: Defining the Principles Conference, held in Sandestin, Florida in May of 2003.
Principles of Green Engineering
4Michigan Technological University
12 Principles of Green Engineering*
Inherent rather than circumstantial.
Prevention rather than treatment.
Design for separation.
Maximize mass, energy, space, and time efficiency.
“Output pulled” rather than “input pushed”.
View complexity as an investment.
Durability rather than immortality.
Need rather than excess.
Minimize material diversity.
Integrate local material and energy flows.
Design for a commercial “afterlife”.
Renewable and readily available.
*Anastas, P.A. and Zimmerman, J.B. 2003, Environmental Science and Technology, Vol. 37(5), 94A-101A.
12 Principles of Green Engineering

5Michigan Technological University
Green Engineering: A Design Approach for Environmental Sustainability
Molecular level to global scale» Chemical structure ⇒ environmental fate properties
Hierarchy of design activities» Early to detailed flowsheet assessment
Beyond the plant boundary considerations» Life cycle assessment and industrial ecology
Integration of traditional disciplines» Environmental science into engineering design» Total cost accounting
6Michigan Technological University
2-minute discussion
Where does your research / teaching fit in this environmentally conscious design approach?Do you work at the molecular scale in the development of new materials?
Does your work involve process applications?
Are most or your efforts on the systems scale?
How do we evaluate environmental issues at these scales?

7Michigan Technological University
Tools for Environmentally-Conscious Process Design and Analysis
E-CD
Environmental Fate Properties• databases• estimation
Chemical Process Properties• thermodynamics• reactions• transport
Chemical Process Models• simulation• waste generation and release
Environmental Fate Models• single compartment• multi-media
Environmental Impacts Models• midpoint vs endpoint• normalization• valuation
Pollution Prevention• mass integration• heat integration• energy sources
Process Optimization• multi-objective• mixed integer• non-linear
Hierarchical Design
8Michigan Technological University
Hierarchical approach toenvironmentally conscious design
Environmental Assessments
Simple (“tier 1”)toxicity potential, raw material costs
“tier 2” – material/energy intensity, emissions, costs
“tier 3” – emissions, environmental fate, risk,discounted cash flow
Level 1. Input Informationiproblem definition
Level 2. Input-Output Structureimaterial selection ireaction pathways
Levels 3 & 4.irecycle iseparation system
Levels 5 - 8.ienergy integration idetailed evaluation
icontrol isafety
Process Design Stages
Douglas, J.M., Ind. Eng. Chem. Res., Vol. 41, No. 25, pp. 2522, 1992
Allen, D.T. and Shonnard, D.R.Green Engineering : EnvironmentallyConscious Design of Chemical Processes,Prentice Hall, pg. 552, 2002.

9Michigan Technological University
Compilation in: Appendix F.Allen, D.T. and Shonnard, D.R., Green Engineering : Environmentally-Conscious Design of Chemical Processes, Prentice Hall, pg. 552, 2002
Web Resources24 sites with information on many aspects of green engineering
On-Line DatabasesEnvironmental properties, human and ecosystem toxicity, solvent substitution
SoftwareEmissions from process units (air, water, and land), workplace exposure, property estimation, environmental fate modeling, prediction of toxicity, solvent design, expert system for green chemistry, flowsheet impact assessment.
Computer-aided tools
10Michigan Technological University
Environmental properties areneeded to predict exposure
Multiple pathwaysare possible
Exposure Routes1. Inhalation2. Ingestion3. Dermal (skin)

11Michigan Technological University
Chemical properties for environmental decision-making (chapter 5)
Table 5.1-1 Chemical properties needed to pe rform environmental risk screeningsEnvironmental Process Relevant PropertiesEstimates of dispersion and fate Volatility, density, melting point, water
solubility, octanol-water partitioncoefficient, soil sorption coefficient
Persistence in the environment Atmospheric oxidation rate, aqueoushydrolysis rate, photolysis rate, rate ofmicrobial degradation
Uptake by organisms Volatility, lipophilicity, molecular size,degradation in organism
Human uptake Transport across dermal layers, transportrates across lung membrane, degradationrates within the human body
Toxicity and other health effects Dose-response relationships
12Michigan Technological University
Environmental properties
Table 5.2-1 Properties that influence environmental phase partitioningProperty Definition Significance in estimating
environmental fate and risksMelting point (Tm) Temperature at which solid and
liquid coexist at equilibriumSometimes used as a correlatingparameter in estimating otherproperties for compounds that aresolids at ambient or near-ambientconditions
Boiling point (Tb) Temperature at which the vaporpressure of a compound equalsatmospheric pressure; normalboiling points (temperature atwhich pressure equals oneatmosphere) will be used in thistext
Characterizes the partitioning betweengas and liquid phases; frequently usedas a correlating variable in estimatingother properties
Vapor pressure (Pvp) Partial pressure exerted by a vaporwhen the vapor is in equilibriumwith its liquid
Characterizes the partitioning betweengas and liquid phases

13Michigan Technological University
Environmental properties (cont.)
Henry’s law constant (H) Equilibrium ratio of the concentration of a compound in the
gas phase to the concentration of the compound in a dilute aqueous solution (sometimes reported as atm-m3/mol; dimensionless form
will be used in this text)
Characterizes the partitioning between gas and aqueous phases
Octanol-water partition coefficient (Kow)
Equilibrium ratio of the concentration of a compound in
octanol to the concentration of the compound in water
Characterizes the partitioning between hydrophilic and hydrophobic phases
in the environment and the human body; frequently used as a correlating variable in estimating other properties
Water solubility (S) Equilibrium solubility in mol/L Characterizes the partitioning between
hydrophilic and hydrophobic phases in the environment
14Michigan Technological University
Environmental properties (cont.)
Soil sorption coefficient(Koc)
Equilibrium ratio of the mass of acompound adsorbed per unitweight of organic carbon in a soil(in µg/g organic carbon) to the
concentration of the compound in aliquid phase (in µg/ml)
Characterizes the partitioning betweensolid and liquid phases in soil whichin turn determines mobility in soils;frequently estimated based onoctanol-water partition coefficient,and water solubility
Bioconcentration factor(BCF)
Ratio of a chemicalÕs concentrationin the tissue of an aquatic organismto its concentration in water(reported as L/kg)
Characterizes the magnification ofconcentrations through the food chain

15Michigan Technological University
Assumption:
A molecule is composed of a collection of functional groups or molecular fragments and that each group or fragment contributes in a well-defined manner to the properties of the molecule.
Property estimation methods based on chemical structure
16Michigan Technological University
KOW - octanol-water partitioningDescribes partitioning of organic pollutants between the water phase and octanol
Functional groups
log Kow = 0.229 + Σ ni fi + Σ nj cj
n = number of functional groups of types i or jfi = contribution to log Kow of group i cj = correction factor for functional group j

17Michigan Technological University
Functional groups1,1-Dichloroethylene example
the molecular structure, CH2= CCl2
one =CH2 group From Table 5.2-6one =CH- or =C< grouptwo –Cl (olefinic attachment) groups
log Kow = 0.229 + 0.5184 + 0.3836 + 2(0.4923) = 2.11(no correction groups)
Experimental log Kow = 2.13
18Michigan Technological University
H - Henry’s law constantDescribes partitioning of organic pollutants between the water phase and air in the environment
Bond types
-log H = Σ ni hi + Σ nj cj
n = number of bonds of types i or jhi = contribution to H of bond type icj = functional group correction factor

19Michigan Technological University
Bond types:1-propanol example
the molecular structure, H H H⎥ ⎥ ⎥
H – C – C – C – O - H⎥ ⎥ ⎥H H H
From Table 5.2-137 C-H bonds, 2 C-C bonds, 1 C-O bond, and 1 O-H bond
-log H = 7(-0.1197) + 2(0.1163) + 1.0855 + 3.2318 = 3.7112
w correction; - log H = 3.7112 - 0.20 = 3.5112 Table 5.2-14linear or branched alcohols
Experimental -log H = 3.55
20Michigan Technological University
KOC - Organic carbon-water partition coeff.Describes partitioning of organic pollutants between the water phase and natural organic matter in soils / sediments
Molecular connectivity
log Koc = 0.531χ + 0.62 + Σ njPj
1χ = 1st order molecular connectivity indexnj = number of groups of type jPj = correction factor for group j

21Michigan Technological University
Molecular connectivity1-hexanol example
the molecular structure, see Appendix B for details
CH3 – CH2 – CH2 – CH2 – CH2 – CH2 – O - Hδ (1) (2) (2) (2) (2) (2) (1) - C atom connectivity
(δi,δj) (1,2) (2,2) (2,2) (2,2) (2,2) (2,1) - bond connectivity
1χ = Σ(δI* δj)-0.5
1χ = (1/√2) + (1/√4) + (1/√4) + (1/√4) + (1/√4) + (1/√2) = 3.41
log Koc = 0.531χ + 0.62 + Σ njPj
log Koc = 0.53 (3.41) + 0.62 + (-1.519) = 0.91
Experimental log Koc = 1.01aliphatic alcohol
22Michigan Technological University
Chemical structure provides an incomplete description of
molecular interactions leading to observable properties
Correction Factors for intermolecular forces» Electronic interactions
» Multiple hydrogen bonding
» Substituent effects
Correction factors

23Michigan Technological University
Software
EPIWIN collection of software programs -Properties covered:Properties used to estimate partitioning: boiling point, vapor pressure, octanol-water partition coefficient, bioconcentration factor, Henry’s law coefficient, soil sorption
Properties that govern environmental fate:
atmospheric lifetimes, biodegradation rates
Downloadable Version, http://www.epa.gov/oppt/exposure/docs/episuite.htm
24Michigan Technological University
Mackay et al., “Illustrated Handbook of Physical-Chemical Properties and Environmental Fate for Organic Chemicals”, Lewis Publishers, 1992
Water Compartment Only
1 kg Hexachlorobenzene (Hx)
105 m3 volume of water
10-3kg organic carbon / m3 water
0.1 kg fish / 100 m3 water
Case study 1:Environmental partitioning case study
Human Exposure : Fish Ingestion
0.5 kg of fish consumed
Dose due to ingestion?
Concentration in the Fish (mg/kg)?
25Michigan Technological University
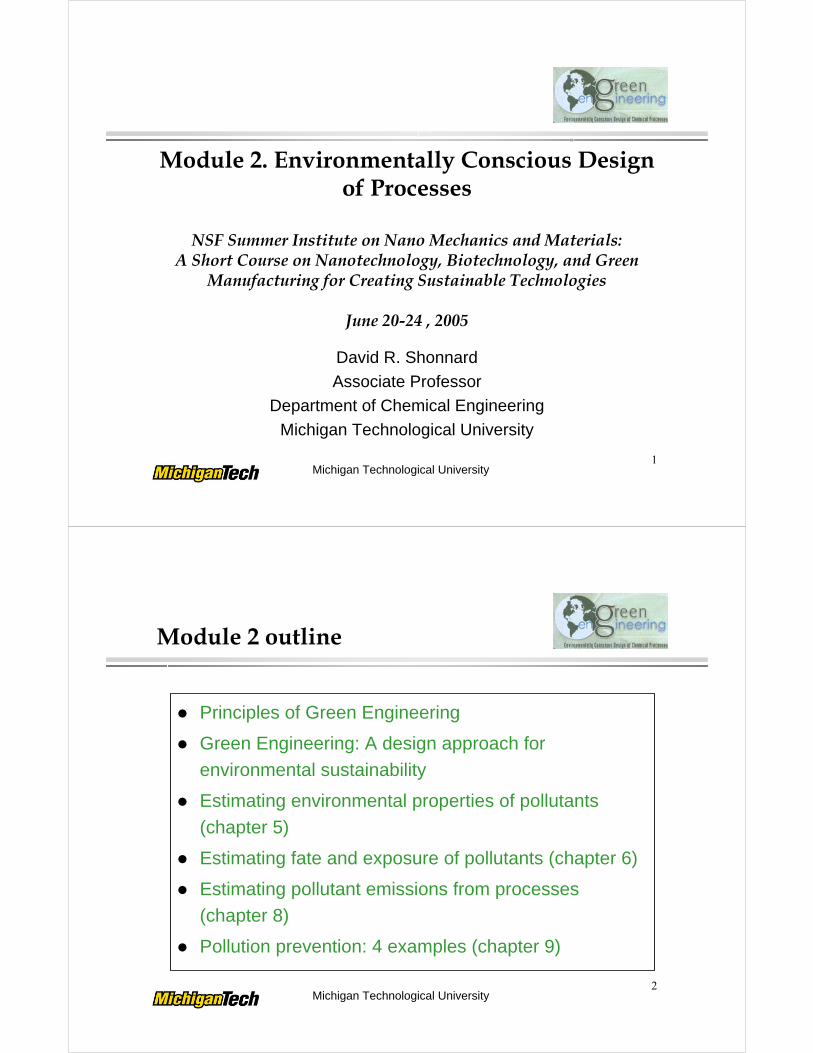
Case study 1:Mass balance equation for Hx 118-74-1
MHx = MHx ,W + MHx ,S + MHx , F = VW CW + VWρoc KocCW + VWρF BCF CW
26Michigan Technological University
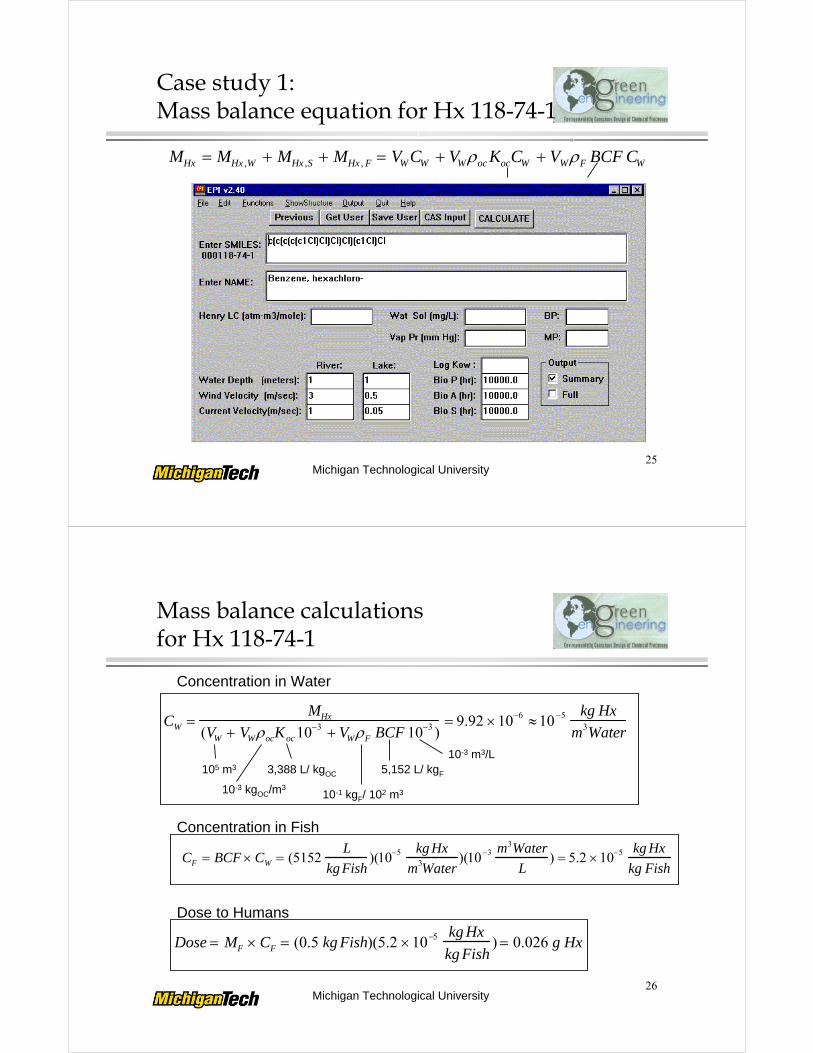
Mass balance calculations for Hx 118-74-1
CW =MHx
(VW + VWρocKoc 10−3 + VWρF BCF 10−3 )= 9.92 ×10⁻⁶ ≈10−5 kg Hx
m3Water
105 m3
10-3 kgOC/m3
3,388 L/ kgOC
10-1 kgF/ 102 m3
5,152 L/ kgF
10-3 m3/L
Concentration in Water
Concentration in Fish
CF = BCF × CW = (5152L
kg Fish)(10−5 kg Hx
m3Water)(10−3 m3Water
L) = 5.2 ×10⁻⁵ kg Hx
kg Fish
Dose to Humans
Dose = MF × CF = (0.5 kg Fish)(5.2 ×10⁻⁵ kg Hx
kg Fish) = 0.026 g Hx

27Michigan Technological University
Maleic anhydride 108-31-6EPIWIN (estimates) vs ChemFate (data)
Properties EPIWIN ChemFateBioling Pt. (°C)
Melting Pt. (°C)
Vapor Press. @25°C (mm Hg)
log KOW
Water Solubility (mg/L)
H (atm•m3/mole)
Biodegradation half life
Hydrolysis half life
Atmos. Oxidation half life (d)
log KOC
Bioconcentration Factor
156.4
-51.6
2.97
1.62
4912
1.9x10⁻⁶
weeks
-----
4.71
0
0.546
202
52.8
.25
-----
-----
-----
-----
1 minute
0.7
-----
-----
No data becauseMA hydrolyzes in 1 minute in water
Syracuse Research Corporation, http://www.syrres.com/efdb.htm
28Michigan Technological University
Benzene 71-43-2EPIWIN (estimates) vs ChemFate (data)
Properties EPIWIN ChemFate Bioling Pt. (°C)
Melting Pt. (°C)
Vapor Press. @25°C (mm Hg)
log KOW
Water Solubility (mg/L)
H (atm•m3/mole)
Biodegradation half life
Hydrolysis half life
Atmos. Oxidation half life (d)
log KOC
Bioconcentration Factor
102.24
-77.92
34
1.99
2000
5.39x10⁻³
weeks-months
-----
5.5
2.22
0.94
80.09
5.53
95
2.13
1790
5.55x10⁻³
week
-----
10
1.69
1.0

29Michigan Technological University
1. Identify waste release sources in process flowsheetsand mechanisms for unit operations
2. Methods for estimating air emissions from processes
3. Case study - Benzene to Maleic Anhydride process evaluation
Identifying and estimating air emissions(chapter 8)
30Michigan Technological University
1. Waste streams from process units
2. Major equipment - vents on reactors, column separators, storage tanks, vacuum systems, ..
3. Fugitive sources - large number of small releases from pumps, valves, fittings, flanges, open pipes, ..
4. Loading/unloading operations
5. Vessel clean out, residuals in drums and tanks
6. Secondary sources - emissions from wastewater treatment, other waste treatment operations, on-site land applications of waste, ..
7. Spent catalyst residues, column residues and tars, sludges from tanks, columns, and wastewater treatment, …
8. Energy consumption - criteria air pollutants, traces of hazardous air pollutants, greenhouse gases
Typical waste emission sources from chemical processes

31Michigan Technological University
Distillation column emission and waste generation mechanisms
FeedTank
Distillation Column
Condenser
Vent air emissions
Reboiler
DistillateD, xD, xD,I
BottomsB, xB, xB,I=0
FeedF, xF, xF,I
N2
Still Bottoms Waste (sludges)
High temperature degradation reactions
Inert gas for safety
32Michigan Technological University
Distillation column emissions: Vent air emissions - N2 mass balance
D = F (xF − xB
xD − xB
)
xF, I =0.98{exp[xF ln(HEtOH ) +(1− xF )ln(HH2 O)]}−1
xD,I = 0.98{exp[xD ln(HEtOH ) +(1− xD)ln( HH2O)]}−1
F: Moles of feed.xF: Mole fraction of ethanol in the feed.xF,I: Mole fraction nitrogen in the feed.D: Moles of overhead product.xD: Mole fraction of ethanol in the overheads produc t.xD,I: Mole fraction of nitrogen in the overheads product.B: Moles of bottoms product.xB: Mole fraction of ethanol in the bottoms product.xB,I: Mole fraction of nitrogen in the bottoms product = 0
Vent emissions of EtOH = (dI/dt)(VPEtOH/1 atm)
Vapor pressure of EtOH at condenser Temp.
dtdI = F x
F,I - D x
D,I - B x
B,I

33Michigan Technological University
Distillation column emissions: Vent air emissions - N2 mass balance
Distillation Column Inert Gas Mole Balance
xF (feed mole fraction)
0.00E+00
1.00E-05
2.00E-05
3.00E-05
4.00E-05
5.00E-05
6.00E-05
7.00E-05
8.00E-05
9.00E-05
1.00E-04
0 0.2 0.4 0.6 0.8
H2/H1=.02
H2/H1=.05
H2/H1=.1
H2/H1=.2
H2/H1=.5
H2/H1=1
H2/H1=2
H2/H1=5
H2/H1=10
H2/H1=20
H2/H1=50
Figure 2a. Inert gas mole balance in a distillation column for F = 1 mole/hr, xD = 0.99, and xB = 0.01. Positive values of dI/dt indicate a potential for emission to the environment for all values of feed mole fraction when H2/H1 ≥ 0.5. This situation occurs for the most part when the inert gas is less soluble in the more volatile component.
dIdt
34Michigan Technological University
Wastewater generation and RCRA sludges
10 kg sludge/kg pptRCRA waste
Petroleum refinerywater processes
Reverse Osmosis

35Michigan Technological University
Liquid storage tank air emissions and waste generation mechanisms
Vertical Fixed Roof Storage Tank
Tank Bottoms Waste (sludges)
Vent air emissions
36Michigan Technological University
Liquid storage tank emissions and waste generation mechanisms
Domed External Roof Storage Tank
Tank Bottoms Waste (sludges)
Vent air emissions

37Michigan Technological University
Emission Mechanisms; Fixed Roof Tank
LTOTAL = LSTANDING + LWORKING
Roof Column
Vent
∆T
∆P
LiquidLevel
- Weather, paint color/quality
- Weather
- liquid throughput, volume oftank
Vapor pressure of liquid drives emissions
Mechanisms of air emissions from storage tanks
38Michigan Technological University
Module 4: Storage tank comparison -TANKS 4.0 Demonstration
Storage Tank Type Vertical Internal Domed External
Fixed Roof Floating Roof Floating Roof
Annual Emissions (lb)
White Paint 337.6 66.2 42.8
Grey (Medium) Paint 489.1 85.1 52.4
Heated (White) 313.5
Poor (Grey/Medium) 509.7 81.0 51.5
Toluene Storage Tank Calculation• Toluene emissions only• 516,600 gal/yr flowrate of toluene• 15,228.5 gallon tank for each comparison

39Michigan Technological University
Emission factors -CO2 from energy consumption
Ei (lb i / yr) =EFav (lb i / 103gal) × ED(Btu / yr)
HV(Btu / 103 gal) × BE
AP-42, Chapter 1, section 1.3, Air CHIEF CD, www.epa.gov/ttn/chief/airchief.htm
40Michigan Technological University
Emission factors -pollutants from energy consumption
Ei (lb i / yr) =EFav (lb i / 103gal) × ED(Btu / yr)
HV(Btu / 103 gal) × BEAP-42, Chapter 1, section 1.3, Air CHIEF CD, www.epa.gov/ttn/chief/airchief.htm

41Michigan Technological University
Pollution Prevention Example:Comparison of NG, oil, and coal
Natural Gas Coal No.6 Fuel Oil No.2 Fuel Oil
Lower Heating Value (MJ/kg) 55 28 42.5 42.5
% C (wt.) 74.8 78.0 87.3 87.3
% H (wt.) 25.23 - 10.5 12.6
% S (wt.) - 1.0 0.84 0.22
% O (wt.) 0.0073 - 0.64 0.04
% N (wt.) - - 0.28 0.006
% Ash (wt.) - - 0.04 <0.01
CO2 Emissions (g / MJ) 50 100 75 75
SOx Emissions (g / MJ) 0 .71 0.40 0.10
Natural Gas is inherently less polluting energy source than petroleum or coal
42Michigan Technological University
Emission Factors - major equipment
Table 8.3.2 Average Emission Factors for Chemical Process UnitsCalculated from the US EPA L&E Database
Process Unit EFav ; (kg emitted/103 kg throughput) Reactor Vents 1.50 Distillation Columns Vents 0.70 Absorber Units 2.20 Strippers 0.20 Sumps/Decanters 0.02 Dryers 0.70 Cooling Towers 0.10

43Michigan Technological University
Emission factors -fugitive sources; minor equipment
Ei (kg i / yr) = mi × EFav ×Ns × 24 ×365
44Michigan Technological University
Software Tools
Storage tanks
TANKS 4.0 - program from EPA - www.epa.gov/ttn/chief/tanks.html
Wastewater treatment
WATER8 - on Air CHIEF CD - www.epa.gov/ttn/chief/airchief.html
EPI Suite - Epiwin
Treatment storage and disposal facility (TSDF) processes
CHEMDAT8 - on Air CHIEF CD
Emission correlations/models -storage tanks and waste treatment

45Michigan Technological University
Principles of Green Engineering
Green Engineering: A design approach for
environmental sustainability
Estimating environmental properties of pollutants
Estimating fate and exposure of pollutants
Estimating pollutant emissions from processes
Pollution prevention: 4 examples
Module 2 Overview
46Michigan Technological University
Green Chemistry principles
Inherently green chemical reactions
Atom economy / mass economy
Pollution prevention for chemical reactions
Early design evaluation of reaction pathways
Expansion of system boundaries
Module 3 preview