Embed Size (px)
Citation preview

Modulation of DNA loop lifetimes by the free energy ofloop formationYi-Ju Chena,1, Stephanie Johnsonb,c,1, Peter Mulligand,1, Andrew J. Spakowitzd, and Rob Phillipse,f,2
Departments of aPhysics, bBiochemistry and Molecular Biophysics, eApplied Physics, and fBiology, California Institute of Technology, Pasadena, CA 91125;cDepartment of Biochemistry and Biophysics, University of California, San Francisco, CA 94158; and dDepartment of Chemical Engineering, StanfordUniversity, Stanford, CA 94305
Edited by L. B. Freund, University of Illinois at Urbana–Champaign, Urbana, IL, and approved October 20, 2014 (received for review August 13, 2014)
Storage and retrieval of the genetic information in cells isa dynamic process that requires the DNA to undergo dramaticstructural rearrangements. DNA looping is a prominent example ofsuch a structural rearrangement that is essential for transcriptionalregulation in both prokaryotes and eukaryotes, and the speedof such regulations affects the fitness of individuals. Here, weexamine the in vitro looping dynamics of the classic Lac repressorgene-regulatory motif. We show that both loop association andloop dissociation at the DNA-repressor junctions depend on theelastic deformation of the DNA and protein, and that both loopingand unlooping rates approximately scale with the looping J factor,which reflects the system’s deformation free energy. We explainthis observation by transition state theory and model the DNA–protein complex as an effective worm-like chain with twist. Weintroduce a finite protein–DNA binding interaction length, in com-petition with the characteristic DNA deformation length scale, asthe physical origin of the previously unidentified loop dissociationdynamics observed here, and discuss the robustness of this behav-ior to perturbations in several polymer parameters.
protein-mediated DNA looping | loop-modulated kinetic rates |transition state
Many key cellular processes, from gene regulation to me-tabolism, require the coordinated physical interaction of
biological macromolecules. A classic example is the coordinationof DNA and proteins in DNA loop formation, which is a re-curring design principle from viruses (1) to animals (2). Despitetheir prevalence, many questions remain about how these loopsform and function in vitro and in vivo (3, 4). Here, we ask howthe mechanics of the protein and DNA in a protein-mediatedloop govern looping and unlooping dynamics, an issue that hasonly recently begun to be explored (5).Recent advances in single-molecule techniques have allowed
precise quantification and deeper understanding of the physicalproperties of DNA (6, 7), and we have taken advantage of onesuch technique here, in combination with a classic bacteriallooping protein. The polymer physics implications of this work,however, are more general than the particular system we focuson. The looping protein we examine here, the Lac repressor, sonamed because of its role in repressing transcription at the lacpromoter in the bacterium Escherichia coli, was one of the first-described examples of a genetic regulator that acts throughspecific DNA–protein interactions. Looping is accomplished bymeans of two DNA binding domains per Lac repressor molecule,allowing it to bind two of its specific DNA sites (“operators”)simultaneously, with the intervening DNA adopting a loopedconformation (8), as shown schematically in Fig. 1A. To measureloop formation and breakdown, we make use of the in vitrosingle-molecule tethered particle motion (TPM) assay (9–12),a simple but powerful technique for investigating DNA–proteininteractions. In TPM, a micrometer-sized bead is tethered to oneend of a linear DNA, with the other end attached to a micro-scope coverslip (Fig. 1B). The motion of the bead gives a readoutof the effective length of the bead’s DNA “tether,” such thatloop formation induced by the binding of the Lac repressor to its
two operators results in a quantifiable reduction of the bead’s motion.We record the trajectory of looping and unlooping for each DNAmolecule as a function of time in thermal equilibrium (Fig. 1C).These trajectories contain a wealth of information about the
DNA–protein interactions in our system. One such quantity thatwe will focus on here is the looping J factor, Jloop = ð1 MÞe−βΔF ,which encapsulates the thermodynamic cost ΔF to deform theDNA (and possibly the protein) into the looped conformation,related to the cyclization J factor often used to measure theflexibility of DNA in vitro (13). We previously measured Jloop forlooping constructs generated by a library of DNAs with differentloop lengths and sequences (Fig. 1C and SI Appendix, Fig. S1), toexamine how DNA mechanics affect the energetics of loop for-mation (12, 14). We showed that this library of constructsallowed us to tune Jloop over two orders of magnitude.Here, we will instead focus on the looping and unlooping
“lifetimes” (durations; Fig. 1C) for this same library of DNAs.We find that the loop breakdown process at the DNA–proteininterface is sensitive to the whole loop’s deformation, with bothlooping and unlooping kinetics exhibiting rather simple forms ofscaling with the looping free energy. Such a dependence has not,to our knowledge, been previously reported experimentally (10,15) or considered in standard physical models for DNA looping(16–20), and suggests DNA looping as a member of a broaderclass of phenomena where applied force (21–25) or internalstress stored in polymers (5, 7, 26, 27) modulates biochemicalreaction rates. Moreover, this result implies possible influence ofDNA mechanics on evolution, because both the speeds ofturning gene regulation “on” and “off” may be critical for fitness.We provide an explanation for the molecular origins of thisdependence and develop a theory of looping kinetics, allowing us
Significance
Storage and retrieval of the genetic information in cells is a dy-namic process that requires the DNA to undergo dramatic struc-tural rearrangements. One prominent but still incompletelyunderstood example of such rearrangements is protein-mediatedDNA looping. Here, we use a single-molecule biophysical tech-nique to show that the elasticity of the DNA and protein affectsthe kinetics of both loop formation and, unexpectedly, loopbreakdown, and we develop a theory based on polymer physicsto explain the origin of these observations. Our results demon-strate a previously unidentified way to probe the looping reactionpathway and quantify the effects of both the DNA and proteinelasticity in looping kinetics, and therefore better understand theirroles in many gene-regulatory processes.
Author contributions: R.P. designed research; Y.-J.C., S.J., P.M., and A.J.S. performed re-search; Y.-J.C., S.J., and P.M. analyzed data; and Y.-J.C., S.J., P.M., A.J.S., and R.P. wrotethe paper.
The authors declare no conflict of interest.
This article is a PNAS Direct Submission.1Y.-J.C., S.J., and P.M. contributed equally to this work.2To whom correspondence should be addressed. Email: [email protected].
This article contains supporting information online at www.pnas.org/lookup/suppl/doi:10.1073/pnas.1415685111/-/DCSupplemental.
www.pnas.org/cgi/doi/10.1073/pnas.1415685111 PNAS Early Edition | 1 of 6
PHYS
ICS
BIOPH
YSICSAND
COMPU
TATIONALBIOLO
GY

to probe experimentally inaccessible details of the looping pathwayand the looping transition state.
Results and DiscussionIn this work, we use the common single-molecule analysis techniqueof half-amplitude thresholding (see details in SI Appendix, sectionS1) to obtain distributions of the amount of time each TPM tetherspends in the looped or unlooped state, called looped or unloopedlifetimes. We begin by developing a simple kinetic framework forunderstanding what the measured state lifetimes tell us about theunderlying physics of the system, with the basic elements given inFig. 2. As discussed in more detail in SI Appendix, section S2.1.2–4,using standard kinetic analyses we can express the mean unloopedstate lifetime, hτunloopedi, in terms of the repressor concentration [R]and the rate constants diagrammed in Fig. 2, as follows:
�τunlooped
�=
1+
kAoff½R�kAon
! 1+
kBoff½R�kBon
!
kαonkAoff
½R�kAon+ kβon
kBoff½R�kBon
: [1]
Note that hτunloopedi contains two different kinds of rates: fkAon=off ;kBon=offg, for the binding/unbinding of the first repressor head tothe DNA (we are distinguishing between binding and unbindingto operator A versus operator B, because several operators withdifferent affinities for repressor have been described), as well asfkαon; kβong for the binding of a second operator when the repres-sor has already bound the first one, which we here allow to differfrom the rates for the initial binding event (Fig. 2). On the otherhand, hτloopedi= 1=ðkαoff + kβoff Þ contains only the loop-affecteddissociation rates fkαoff ; kβoffg, which we made no a priori assump-tions and allow to differ from the simple unbinding eventsfkAoff ; kBoffg. Experimental measurements of the unlooped and
looped lifetimes then tell us how looping affects kα=βon and kα=βoff ,respectively. Regulation of association rates by flexible linkersand polymer ring closure rates have been discussed in the frame-work of confined diffusion (16–20), and the effect of confineddiffusion from the elastic DNA-repressor loop is likely to dom-inate fkαon; kβong in our case as well. However, dissociation ratesare usually thought of as local phenomena and dependent onlyon the interaction strength at the molecular interface, a hypoth-esis implicitly used in previous works on DNA looping kinetics(5, 10, 15, 28). In contrast, in force spectroscopy experiments, anapplied force changes a reaction free energy profile by adding alinear term to it. As a result, the equilibrium constant of the re-action, as well as both the on and off rates (e.g., association anddissociation of chemical bonds, folding and unfolding of RNA ornucleosomes), depend on the pulling force (21–25). With ourkinetic measurements, we can address the question of to whatdegree the dissociation process (i.e., the looped lifetime) is sim-ply a local interaction and to what degree it is affected by theelastic deformation energies of the protein and DNA chain.As exemplified by Fig. 3A for sequence dA (Fig. 1B), the
unlooped and looped state lifetimes extracted from our TPMdata show a modulation with loop length, just as the J factor(equivalently, the deformation free energy of the system) does.The other sequences are similarly plotted in SI Appendix, Fig.S11, and exhibit more complex behavior when loop length variesmore than one helical repeat. Although the unlooped and loopedstate lifetimes are complicated functions of the loop length andDNA sequence, they are approximately monotonic when plottedversus the J factor, as shown in Fig. 3B. Moreover, this behavioris roughly independent of both loop sequence and, within therange of lengths examined here, loop length, as shown in Fig. 3 Cand D: unlooped and looped state lifetimes for five differentsequences spanning one to two helical periods of DNA all followthe same trend with J. Because J is known to be a function ofloop length and DNA sequence, it can be viewed as encom-passing the effects of the polymer parameters (within the rangeexamined here) on the looping dynamics.In contrast to the common view that dissociation rates are
local phenomena only, these data suggest that the loop dissoci-ation and association kinetics are both regulated by Jloop. Wenote that the looping J factor is sometimes interpreted as ef-fective cohesive-end concentration or effective repressor con-centration, and increasing effective concentration is thought tofacilitate association kinetics (29, 30). However, this conceptdoes not explain how the dissociation kinetics is modulated by aneffective concentration: according to the simple kinetic frame-work discussed above, the looped-state lifetime should not de-pend on repressor concentration [R]. If we take the effectiveconcentration interpretation of Jloop literally, the fact that thedissociation kinetics, i.e., the looped lifetime shown in Fig. 3,depends on Jloop is inconsistent with this framework. Explainingthe dependence of the dissociation kinetics on Jloop requiresa different interpretation of Jloop beyond effective concentrationand more akin to how applied force distorts bonding free energyin force spectroscopy experiments (21–25). We first apply tran-sition state theory to obtain some intuition about how Jloop canmodulate loop formation and breakdown rates, and then turn toa more sophisticated framework that more explicitly models thepolymer mechanics. We note that our analysis based on free-energy landscapes is theoretically equivalent to expressing theeffect of polymer deformation in terms of force and torqueacting on the bond (5, 26, 27), and we used the free-energytreatment because of its conceptual simplicity.The magenta curve in Fig. 2C shows a pathway between one
unlooped state, where operator A is bound, and the loopedstate with both operators bound. The transition state on this pathhas an unknown structure and a total free energy Ftransition. Theactivation energies for the forward and reverse transitions aregiven by ΔF‡
unloop = ðFtransition −FunloopedÞ and ΔF‡loop = ðFtransition −
FloopedÞ= ðΔF‡
unloop −ΔF +EBÞ, where ΔF is the free energy of
C
B
A
Fig. 1. DNA looping dynamics measured by tethered particle motion. (A)Loop formation requires the DNA chain to bend and twist to bring thebinding sites together and properly orient them. (B) The TPM setup, in whichsingle DNAmolecules tether microscopic beads to a slide. Looping due to theLac repressor binding the two operators on the DNA reduces the bead’smotion. (C) Sample TPM trajectory, hRi versus time, recorded from a singletether and segmented into unlooped (blue) and looped (red) states. Thelifetime of a state is how long a trajectory remains in that state beforetransitioning to a different one.
2 of 6 | www.pnas.org/cgi/doi/10.1073/pnas.1415685111 Chen et al.
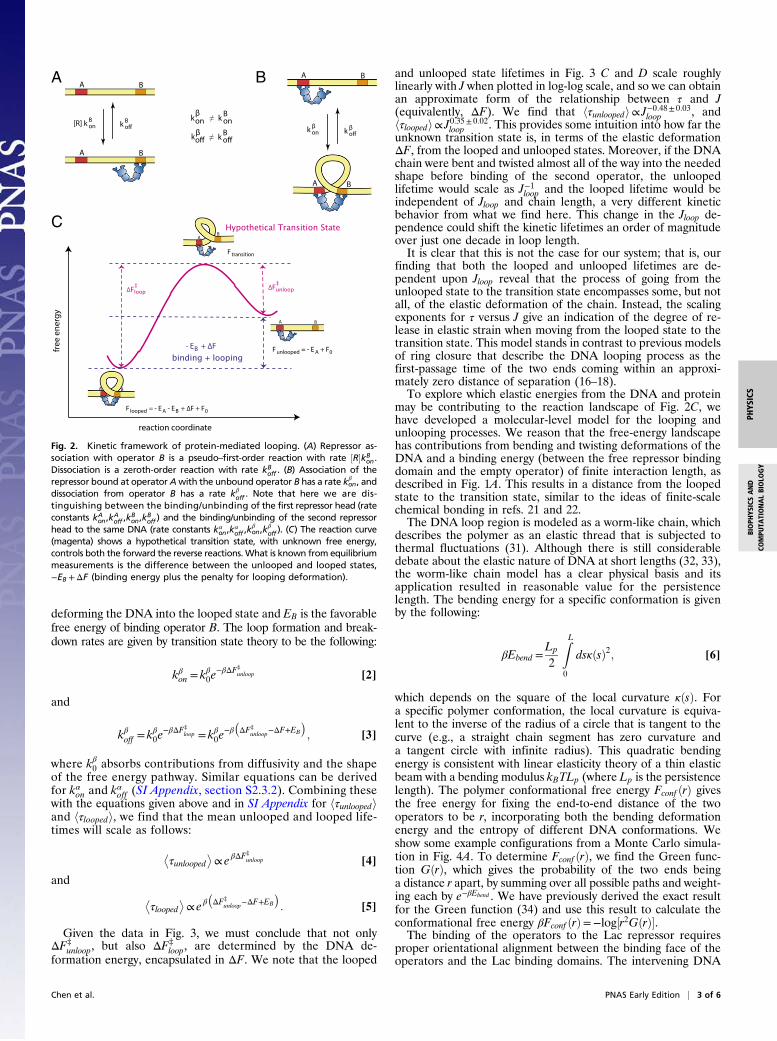
deforming the DNA into the looped state and EB is the favorablefree energy of binding operator B. The loop formation and break-down rates are given by transition state theory to be the following:
kβon = kβ0e−βΔF‡
unloop [2]
and
kβoff = kβ0e−βΔF‡
loop = kβ0e−β�ΔF‡
unloop−ΔF+EB
�; [3]
where kβ0 absorbs contributions from diffusivity and the shapeof the free energy pathway. Similar equations can be derivedfor kαon and kαoff (SI Appendix, section S2.3.2). Combining thesewith the equations given above and in SI Appendix for hτunloopediand hτloopedi, we find that the mean unlooped and looped life-times will scale as follows:
�τunlooped
�∝ e βΔF
‡
unloop [4]
and �τlooped
�∝ e β
�ΔF‡
unloop−ΔF+EB
�: [5]
Given the data in Fig. 3, we must conclude that not onlyΔF‡
unloop, but also ΔF‡
loop, are determined by the DNA de-formation energy, encapsulated in ΔF. We note that the looped
and unlooped state lifetimes in Fig. 3 C and D scale roughlylinearly with J when plotted in log-log scale, and so we can obtainan approximate form of the relationship between τ and J(equivalently, ΔF). We find that hτunloopedi∝ J−0:48± 0:03
loop , andhτloopedi∝ J0:35± 0:02
loop . This provides some intuition into how far theunknown transition state is, in terms of the elastic deformationΔF, from the looped and unlooped states. Moreover, if the DNAchain were bent and twisted almost all of the way into the neededshape before binding of the second operator, the unloopedlifetime would scale as J−1loop and the looped lifetime would beindependent of Jloop and chain length, a very different kineticbehavior from what we find here. This change in the Jloop de-pendence could shift the kinetic lifetimes an order of magnitudeover just one decade in loop length.It is clear that this is not the case for our system; that is, our
finding that both the looped and unlooped lifetimes are de-pendent upon Jloop reveal that the process of going from theunlooped state to the transition state encompasses some, but notall, of the elastic deformation of the chain. Instead, the scalingexponents for τ versus J give an indication of the degree of re-lease in elastic strain when moving from the looped state to thetransition state. This model stands in contrast to previous modelsof ring closure that describe the DNA looping process as thefirst-passage time of the two ends coming within an approxi-mately zero distance of separation (16–18).To explore which elastic energies from the DNA and protein
may be contributing to the reaction landscape of Fig. 2C, wehave developed a molecular-level model for the looping andunlooping processes. We reason that the free-energy landscapehas contributions from bending and twisting deformations of theDNA and a binding energy (between the free repressor bindingdomain and the empty operator) of finite interaction length, asdescribed in Fig. 1A. This results in a distance from the loopedstate to the transition state, similar to the ideas of finite-scalechemical bonding in refs. 21 and 22.The DNA loop region is modeled as a worm-like chain, which
describes the polymer as an elastic thread that is subjected tothermal fluctuations (31). Although there is still considerabledebate about the elastic nature of DNA at short lengths (32, 33),the worm-like chain model has a clear physical basis and itsapplication resulted in reasonable value for the persistencelength. The bending energy for a specific conformation is givenby the following:
βEbend =Lp
2
ZL0
dsκðsÞ2; [6]
which depends on the square of the local curvature κðsÞ. Fora specific polymer conformation, the local curvature is equiva-lent to the inverse of the radius of a circle that is tangent to thecurve (e.g., a straight chain segment has zero curvature anda tangent circle with infinite radius). This quadratic bendingenergy is consistent with linear elasticity theory of a thin elasticbeam with a bending modulus kBTLp (where Lp is the persistencelength). The polymer conformational free energy Fconf ðrÞ givesthe free energy for fixing the end-to-end distance of the twooperators to be r, incorporating both the bending deformationenergy and the entropy of different DNA conformations. Weshow some example configurations from a Monte Carlo simula-tion in Fig. 4A. To determine Fconf ðrÞ, we find the Green func-tion GðrÞ, which gives the probability of the two ends beinga distance r apart, by summing over all possible paths and weight-ing each by e−βEbend . We have previously derived the exact resultfor the Green function (34) and use this result to calculate theconformational free energy βFconf ðrÞ=−log½r2GðrÞ�.The binding of the operators to the Lac repressor requires
proper orientational alignment between the binding face of theoperators and the Lac binding domains. The intervening DNA
C
A B
Fig. 2. Kinetic framework of protein-mediated looping. (A) Repressor as-sociation with operator B is a pseudo–first-order reaction with rate ½R�kB
on.Dissociation is a zeroth-order reaction with rate kB
off . (B) Association of therepressor bound at operator Awith the unbound operator B has a rate kβ
on, anddissociation from operator B has a rate kβ
off . Note that here we are dis-tinguishing between the binding/unbinding of the first repressor head (rateconstants kA
on,kAoff ,k
Bon,k
Boff ) and the binding/unbinding of the second repressor
head to the same DNA (rate constants kαon,k
αoff ,k
βon,k
βoff ). (C) The reaction curve
(magenta) shows a hypothetical transition state, with unknown free energy,controls both the forward the reverse reactions. What is known from equilibriummeasurements is the difference between the unlooped and looped states,−EB +ΔF (binding energy plus the penalty for looping deformation).
Chen et al. PNAS Early Edition | 3 of 6
PHYS
ICS
BIOPH
YSICSAND
COMPU
TATIONALBIOLO
GY

length determines the undeformed orientation of the DNA helixat the operator, and proper alignment for binding incurs ener-getically costly twist deformation upon rotating the DNA into itsproper orientation (which is in fact the origin of the modulationof J with loop length, noted in the text accompanying Fig. 3A).We define the twist angle θ to be the angle of rotation about theDNA axis at the unbound operator away from the ground-stateuntwisted angle (i.e., θ= 0 is untwisted). We consider a simplemodel for the twist free energy βFtwistðθÞ= ðLt=2LÞθ2, which isquadratic in the local twist deformation and evenly distributesthe twist deformation over the length of the DNA between theoperators. The twist persistence length Lt represents the re-sistance to twist deformation. This model neglects the geometriccoupling between twist and writhe of the chain, which becomesmore relevant at longer chain lengths where out-of-plane con-formations are not prohibited by the bending deformation en-ergy (34, 35).The binding free energy, which drives the formation of the
looped state, is modeled as a potential well with depth e0 andan interaction length scale δ. The separation of the twooperators at the surface of the DNA strands is given by
raðr; θÞ=ffiffiffiffiffiffiffiffiffiffiffiffiffiffiffiffiffiffiffiffiffiffiffiffiffiffiffiffiffiffiffiffiffiffiffiffiffiffiffiffiffiffiffiffiffiffiffiffiffiffiffiffiffiffiffiffiffiffiffiffiffiffiffiffiffiffiffiffiffiffiffiðr− aÞ2 + a2 − 2ðr− aÞa cosðθ− θopÞ
q, where r is the
end-to-end distance of the DNA strands and θ is the twist angleat the unbound operator (see SI Appendix, Fig. S5, for an illus-tration). The preferred twist angle θop = 2πðL=LturnÞ+ θ0 givesthe twist angle that orients the empty operator to face the Lacrepressor binding domain, where θ0 defines the twist anglenecessary for docking DNA into Lac repressor even at integerDNA helical repeats. The representative images in Fig. 4A showhow the DNA twists to orient the Lac repressor with the un-bound operator as the ends are brought together. The DNAstructure dictates the cross-sectional radius a (assumed to bea = 1 nm) (36) and the helical length Lturn (assumed to beLturn = 10:46 bp× 0:34 nm) (34). The binding free energy Fbind isthen given by the following:
βFbindðr; θÞ=
8>><>>:
−2e0
1+ exp�raðr; θÞ
δ
�; r> 2a;
∞; r≤ 2a;
[7]
which includes a steric cutoff at r= 2a to account for the overlapof DNA backbone segments. This simple binding model aims tomodel the basic interaction between the DNA operator and Lacrepressor by introducing only the binding affinity e0 and the in-teraction length δ to capture the physical interaction. More de-tailed models of interaction could include more molecular detail,but our goal is to give the simplest representation of bindingwithout introducing additional parameters that do not havewell-defined values.The three thermodynamic contributions Fconf ðrÞ, FtwistðθÞ,
and Fbindðr; θÞ combine to give the total free-energy landscapeFtotalðr; θÞ, as shown in Fig. 4A for L= 101 bp and parameterse0 = 23:5 (in kBT units), δ= 1:3 nm, Lp = 48 nm, Lt = 15 nm, andθ0 = 0:003 π. We find the minimum free-energy path from thelooped state X, over the transition state Y, to the unlooped stateZ, and plot each of the three free energy contributions, as well asthe total free energy along this path, in Fig. 4B. From transitionstate theory, the looped lifetime is simply proportional toe−βΔF
‡
loop , and the unlooped lifetime is proportional to e−βΔF‡
unloop ,as given in Eqs. 4 and 5 above. We use the more sophisticatedFokker–Planck formalism and treat the reaction from the loopedto unlooped state (and vice versa) as diffusion on a one-dimensionalpotential-energy landscape, given by FtotalðrÞ along the minimumfree-energy path shown in Fig. 4B. Twist angle relaxation is muchfaster than changes in the end-to-end distance (37), and we avoidintroducing an additional, poorly characterized parameter forthe twist angle diffusivity by reducing the problem down to onedimension. We calculate the mean looped lifetime as the averagefirst passage time from anywhere in r< rY to leaving the transi-tion state at r= rY , and similarly for the mean unlooped lifetime.The looping J factor is calculated from the polymer free energydifference:
Jloop = ð1 MÞe−βΔF = ð1 MÞexph−βF looppoly −F unloop
poly
i: [8]
Here, F looppoly and F unloop
poly are calculated by averaging only thepolymer elastic energies ðFconf +FtwistÞ (i.e., excluding the bind-ing energy) over the end-to-end distance r smaller and largerthan r= rY , respectively, with a Boltzmann weight given bye−βFtotalðrÞ. We refer the reader to SI Appendix, section S2.4,for more details.To compare these theoretical results with the experimental
results of Fig. 3, we find model parameters for the elasticparameters Lp, Lt, which could vary with DNA sequence, and thebinding parameters e0, δ, and θ0, which should be consistentacross all sequences with the same operators. We obtainθ0 = 0:003 π by looking at the peaks in the Jloop data (see figure 2in ref. 14), which occur when the twist-free orientation 2πL=Lturnis aligned with θ0. The model is able to reproduce the basicqualitative features of the data across a range of parameters, andwe chose values of e0 = 23:5 (in kBT units), and δ= 1:3 nm asrepresentative of a good fit to the data across all five sequencesfor the set of operators used here. These parameters are withinthe expected range, given the size of the Lac repressor arm(around 3–4 nm from the crystal structure) (8) and the bindingenergy of the repressor to DNA of approximately 16 kBT (38).We then varied the elastic parameters to find the best fit for eachsequence, obtaining values of the persistence length Lp rangingfrom 48 to 51 nm and the twist persistence length Lt rangingfrom 10 to 70 nm. The values for Lp are close to the canonicalvalue for dsDNA of Lp = 53 nm (39). Although our twist per-sistence differs from the canonical value of Lt = 110 nm (37), wenote that our twist model is much simplified. We do not include
A
C D
B
Fig. 3. Experimentally measured state lifetimes. (A) Looping J factor (black),mean unlooped lifetime (blue), and mean looped lifetime (red), for onehelical period of the “dA” sequence. (B) The same data as in A, but withlifetimes plotted versus the J factor and the loop length (in base pairs)marked for the looped lifetime curve. (C) Mean looped state lifetime and (D)mean unlooped state lifetime versus Jloop, for one helical repeat each forthree sequences (“dA,” “5S,” “CG”), and two helical repeats for twosequences (“E8,” “TA”).
4 of 6 | www.pnas.org/cgi/doi/10.1073/pnas.1415685111 Chen et al.

the details of the end orientations, twist angle entropic effects,and twist–writhe coupling, all of which could lead to the lowervalue of Lt that we determined.Theoretical predictions for the unlooped and looped mean
lifetimes are shown in Fig. 4 C and D, using the same values as inFig. 4A, and a full comparison with each sequence is given in SIAppendix (SI Appendix, Fig. S6). The theoretical lifetimes (blackcurves) exhibit an approximate power-law trend with Jloop forthe lengths ranging from 89 to 115 bp. Notably, the value ofJloop exhibits both oscillations and an average increase as thelength is increased from 89 to 115 bp. In this regard, the quan-tity Jloop serves as a critical determinant of the looped andunlooped lifetimes.One usually unrecognized feature introduced in our molecular
model for looping is the treatment of the protein binding energythat has a well depth of e0 and an interaction radius of δ. Theseparameters are specifically dependent upon the properties of theprotein and the operator binding interface. In addition to thedata shown in Fig. 3, we also analyzed TPM trajectories witha different set of operators, specifically with the O1 operatorreplaced by the slightly weaker O2. These data are plotted asblue dots in Fig. 5. We have previously determined the energeticdifference between these two operators to be 1:5 kBT (38). Be-cause only one operator’s affinity was changed, we would expectthe resulting value of e0 to be reduced by 0:75 kBT. (We notethat in these operator-swap experiments, the sequence of theloop was somewhat altered as well, but not its total length, andas such we expect most or all of the change to be due to the
difference in the binding well depth e0). Our model prediction,given in black in Fig. 5, clearly agrees well with the experimentalresults when e0 is reduced by 0:75kBT and all other parametersare kept the same as in Fig. 4.Consistent with our theory, only the looped lifetimes are af-
fected by the change of operator. In the free-energy plot in Fig.4B, we see that the binding energy (blue) only begins to affect thetotal free-energy curve (black) once the configuration is to theleft of the transition state; i.e., it is in the looped state. Likewise,we see that the twist energy (red) only begins at end-to-enddistances less than the transition state end-to-end distance rY .Thus, our molecular-level model has given us clear insight intothe elastic deformation present at the transition state, and thisagrees well with our experimental measurements.The other major parameter introduced for the binding energy
was a finite length scale for the DNA–protein interaction. Thisparameter is critical to explain our findings that both the loopedand unlooped lifetimes depend upon the J factor. The finitelength scale of interaction δ affects the transition state Y bychanging the end-to-end distance and twist angle at which thisstate occurs. For large δ, the transition state would occur at afarther end-to-end distance and thus exhibit a notable release ofdeformation energy compared with the looped state X, leadingto a dependence of the looped lifetime on Jloop. This parameter δphenomenologically models both the size (8) and flexibility (40) ofthe protein mediating the loop, and could also account for othereffects such as electrostatic interactions or nonspecific bindingleading to sliding along the DNA chain (41). Thus, in experi-ments with proteins of smaller size or flexibility than Lac re-pressor, we would expect a decreased scaling exponent and hencedecreased dependence of the looped lifetime on Jloop. We willexplore the effect of this interaction distance further in anupcoming manuscript.
ConclusionUsing the single-molecule technique of tethered particle motionto examine looping and unlooping lifetimes by the classic Lacrepressor looping protein, we have shown here that both thelooped and unlooped lifetimes depend upon the J factor, in-dicating that the dissociation rate is dependent upon the DNAand protein elasticity. These findings are unexpected based onthe common treatment of the J factor as an effective proteinconcentration, and have been ignored by previous studies ofDNA looping. We also note that the J factor-modulated statelifetimes, having a 1- to 10-min dynamical range, are comparableto E. coli’s cell division time. The state lifetimes are sensitive to
A B
C D
Fig. 4. Molecular model for DNA looping. (A) Total free-energy surfaceversus end-to-end distance r and twist angle θ. In this plot, L=101 bp andthe parameters are e0 = 23:5 (in kBT units), δ= 1:3 nm, Lp = 48 nm, Lt = 15 nm, and θ0 = 0:003 π. The black curve indicates the minimum free-energypath between the looped state (X) and the unlooped state (Z ), passingthrough the transition state (Y ). Representative DNA conformations (aspredicted by Monte Carlo simulation) at five different end-to-end separa-tions are shown to the right of the free-energy surface, where the degree oftwisting is indicated by the DNA coloration ranging from blue for θ=0 to redfor θ= 0:678 π. (B) Free energy along the minimum free-energy path. Thetotal free energy (black) is a combination of the polymer free energy(green), the twisting free energy (red), and the binding free energy (blue).The free-energy barriers to leave the looped and unlooped states are ΔF‡loopand ΔF‡unloop, respectively. (C) Unlooped lifetime behavior. The experimen-tally determined unlooped lifetimes (red dots) are plotted versus Jloop, withthe black line corresponding to the theoretical prediction as L is varied from89 to 115 bp. (D) Looped lifetime behavior. The looped lifetimes from theexperiments (red dots) and theory (black line) are plotted using the sameparameters as in C.
A B
Fig. 5. Changing operator affinity shifts looped lifetimes. (A) Looped life-time behavior. The experimentally determined looped lifetimes (blue) for allfive sequences with Oid and O2 operators, instead of Oid and O1 as in Fig. 3,are plotted versus Jloop, with the black line corresponding to the theoreticalprediction as L is varied from 89 to 115 bp. All of the model parameters arethe same as in Fig. 4 except e0 has been reduced to 22:75 kBT . For reference,the light gray dots are the data from the Oid and O1 operators, and the darkgray line is the theory curve from Fig. 4. (B) Unlooped lifetime behavior. Theunlooped lifetimes for the Oid and O2 operators (blue) and theory (blackline) are plotted, the same as in A.
Chen et al. PNAS Early Edition | 5 of 6
PHYS
ICS
BIOPH
YSICSAND
COMPU
TATIONALBIOLO
GY

how they scale with J, and within a decade of loop length vari-ation the response times can change an order of magnitude. It istherefore interesting to explore how DNA mechanics modulatesthe in vivo looping and unlooping rates and assess its influenceon how individual cells respond to nutrient fluctuations. To ex-plain our experimental results, we have developed a molecular-level model that accounts for the role of both the polymer andprotein deformation in DNA looping and unlooping kinetics.This model includes a simple but straightforward and physicallyderived picture for the three energies necessary to explainlooping in short, stiff chains: bending, twisting, and binding. Thebinding energy used allows us to incorporate the protein elas-ticity through the introduction of a finite length scale of in-teraction that modulates the degree of favorable binding de-pending upon the end-to-end distance. We find the lifetimescalculated from this model to be in good agreement with ourexperimental results with realistic physical parameters, and thatthe model provides additional insights into the properties of thetransition state and how the elastic energy changes during thecourse of the looping reaction. Finally, we note that long-rangeordering of opening and closing kinetics by the system’s freeenergy landscape should be a general framework that goes be-yond the DNA or repressor-specific variables, and can be appliedto other elastic systems such as ligand–receptor reaction (42) orprotein assembly (43), where flexible tethers are important forthe biological functions.
Materials and MethodsTPM experiments were performed as previously described (12, 14). Briefly,a micrometer-sized bead is tethered to one end of a linear DNA, with theother end attached to a microscope coverslip. The motion of the beaddepends on the effective length of the DNA such that loop formation in-duced by the binding of the Lac repressor to its two operators results ina quantifiable change of the bead’s motion. We record the trajectory oflooping and unlooping for each DNA molecule, under various experimentalconditions such as Lac repressor concentration and DNA sequence. We usea thresholding procedure to quantify the looped and unlooped lifetimesfrom the recorded trajectories. Details of our implementation of the half-amplitude thresholding procedure are given in SI Appendix, section S1, anda comparison of our results to those in previous studies using TPM to mea-sure Lac repressor looping and unlooping rates, showing good agreementbetween our results and these previous studies, is given in SI Appendix,section S3.2. Experimental errors are reported as SEs on the means, calcu-lated according to the bootstrapping method described in SI Appendix,section S1.
ACKNOWLEDGMENTS. We are grateful to Martin Lindén, Justin Bois,Mattias Rydenfelt, Yun Mou, James Boedicker, Robert Brewster, and ArbelTadmor for helpful discussions and comments, and to David Wu, David VanValen, Heun Jin Lee, Geoff Lovely, Hernan Garcia, Franz Weinert, Chao Liu,Luke Breuer, and Matthew Johnson for help with experimental setup andanalysis. This work was supported by the National Institutes of Health[Grants DP1 OD000217A (Directors Pioneer Award), R01 GM085286, R01GM085286-01S1, and 1 U54 CA143869 (Northwestern Physical Sciences–Oncology Center)], the National Science Foundation through a graduatefellowship (to S.J.) and through a grant from the National Science Founda-tion (PHY-1305516) (to P.M. and A.J.S.), and the Fondation Pierre Gilles deGennes (R.P.).
1. Griffith J, Hochschild A, Ptashne M (1986) DNA loops induced by cooperative bindingof lambda repressor. Nature 322(6081):750–752.
2. Zeller RW, et al. (1995) A multimerizing transcription factor of sea urchin embryoscapable of looping DNA. Proc Natl Acad Sci USA 92(7):2989–2993.
3. Peters JP, 3rd, Maher LJ (2010) DNA curvature and flexibility in vitro and in vivo. Q RevBiophys 43(1):23–63.
4. Li G-W, Berg O, Elf J (2009) Effects of macromolecular crowding and DNA looping ongene regulation kinetics. Nat Phys 5:294–297.
5. Laurens N, et al. (2012) DNA looping by FokI: The impact of twisting and bendingrigidity on protein-induced looping dynamics. Nucleic Acids Res 40(11):4988–4997.
6. Gross P, et al. (2011) Quantifying how DNA stretches, melts and changes twist undertension. Nat Phys 7:731–736.
7. Vafabakhsh R, Ha T (2012) Extreme bendability of DNA less than 100 base pairs longrevealed by single-molecule cyclization. Science 337(6098):1097–1101.
8. Lewis M, et al. (1996) Crystal structure of the lactose operon repressor and its com-plexes with DNA and inducer. Science 271(5253):1247–1254.
9. Schafer DA, Gelles J, Sheetz MP, Landick R (1991) Transcription by single molecules ofRNA polymerase observed by light microscopy. Nature 352(6334):444–448.
10. Finzi L, Gelles J (1995) Measurement of lactose repressor-mediated loop formationand breakdown in single DNA molecules. Science 267(5196):378–380.
11. Nelson PC, et al. (2006) Tethered particle motion as a diagnostic of DNA tether length.J Phys Chem B 110(34):17260–17267.
12. Johnson S, Lindén M, Phillips R (2012) Sequence dependence of transcription factor-mediated DNA looping. Nucleic Acids Res 40(16):7728–7738.
13. Crothers DM, Drak J, Kahn JD, Levene SD (1992) DNA bending, flexibility, and helicalrepeat by cyclization kinetics. Methods Enzymol 212:3–29.
14. Johnson S, Chen Y-J, Phillips R (2013) Poly(dA:dT)-rich DNAs are highly flexible in thecontext of DNA looping. PLoS One 8(10):e75799.
15. Vanzi F, Broggio C, Sacconi L, Pavone FS (2006) Lac repressor hinge flexibility and DNAlooping: Single molecule kinetics by tethered particle motion. Nucleic Acids Res34(12):3409–3420.
16. Jun S, Bechhoefer J, Ha B-Y (2003) Diffusion-limited loop formation of semiflexiblepolymers: Kramers theory and the intertwined time scales of chain relaxation andclosing. Europhys Lett 64:420–426.
17. Hyeon C, Thirumalai D (2006) Kinetics of interior loop formation in semiflexiblechains. J Chem Phys 124(10):104905.
18. Toan NM, Morrison G, Hyeon C, Thirumalai D (2008) Kinetics of loop formation inpolymer chains. J Phys Chem B 112(19):6094–6106.
19. Van Valen D, Haataja M, Phillips R (2009) Biochemistry on a leash: The roles of tetherlength and geometry in signal integration proteins. Biophys J 96(4):1275–1292.
20. Reeves D, Cheveralls K, Kondev J (2011) Regulation of biochemical reaction rates byflexible tethers. Phys Rev E Stat Nonlin Soft Matter Phys 84(2 Pt 1):021914.
21. Bell GI (1978) Models for the specific adhesion of cells to cells. Science 200(4342):618–627.
22. Merkel R, Nassoy P, Leung A, Ritchie K, Evans E (1999) Energy landscapes of receptor-ligand bonds explored with dynamic force spectroscopy. Nature 397(6714):50–53.
23. Dudko OK, Hummer G, Szabo A (2008) Theory, analysis, and interpretation of single-molecule force spectroscopy experiments. Proc Natl Acad Sci USA 105(41):15755–15760.
24. Liphardt J, Onoa B, Smith SB, Tinoco I, Jr, Bustamante C (2001) Reversible unfolding ofsingle RNA molecules by mechanical force. Science 292(5517):733–737.
25. Mihardja S, Spakowitz AJ, Zhang Y, Bustamante C (2006) Effect of force on mono-nucleosomal dynamics. Proc Natl Acad Sci USA 103(43):15871–15876.
26. Joseph C, Tseng C-Y, Zocchi G, Tlusty T (2014) Asymmetric effect of mechanical stresson the forward and reverse reaction catalyzed by an enzyme. PLoS One 9(7):e101442.
27. Le TT, Kim HD (2014) Probing the elastic limit of DNA bending. Nucleic Acids Res42(16):10786–10794.
28. Chen YF, Milstein JN, Meiners JC (2010) Femtonewton entropic forces can control theformation of protein-mediated DNA loops. Phys Rev Lett 104(4):048301.
29. Law SM, Bellomy GR, Schlax PJ, Record MT, Jr (1993) In vivo thermodynamic analysisof repression with and without looping in lac constructs. Estimates of free and locallac repressor concentrations and of physical properties of a region of supercoiledplasmid DNA in vivo. J Mol Biol 230(1):161–173.
30. Krishnamurthy VM, Semetey V, Bracher PJ, Shen N, Whitesides GM (2007) De-pendence of effective molarity on linker length for an intramolecular protein-ligandsystem. J Am Chem Soc 129(5):1312–1320.
31. Saitô N, Takahashi K, Yunoki Y (1967) The statistical mechanical theory of stiff chains.J Phys Soc Jpn 22:219–226.
32. Wiggins PA, et al. (2006) High flexibility of DNA on short length scales probed byatomic force microscopy. Nat Nanotechnol 1(2):137–141.
33. Geggier S, Vologodskii A (2010) Sequence dependence of DNA bending rigidity. ProcNatl Acad Sci USA 107(35):15421–15426.
34. Spakowitz AJ (2006) Wormlike chain statistics with twist and fixed ends. EurophysLett 73:684–690.
35. Shimada J, Yamakawa H (1984) Ring-closure probabilities for twisted wormlikechains. Application to DNA. Macromolecules 17:689–698.
36. Sinden RR (1994) DNA Structure and Function (Academic, San Diego).37. Bryant Z, et al. (2003) Structural transitions and elasticity from torque measurements
on DNA. Nature 424(6946):338–341.38. Garcia HG, Phillips R (2011) Quantitative dissection of the simple repression input-
output function. Proc Natl Acad Sci USA 108(29):12173–12178.39. Smith SB, Finzi L, Bustamante C (1992) Direct mechanical measurements of the
elasticity of single DNA molecules by using magnetic beads. Science 258(5085):1122–1126.
40. Czapla L, Grosner MA, Swigon D, Olson WK (2013) Interplay of protein and DNAstructure revealed in simulations of the lac operon. PLoS One 8(2):e56548.
41. Kalodimos CG, et al. (2004) Structure and flexibility adaptation in nonspecific andspecific protein-DNA complexes. Science 305(5682):386–389.
42. Jeppesen C, et al. (2001) Impact of polymer tether length on multiple ligand-receptorbond formation. Science 293(5529):465–468.
43. Zappulla DC, Cech TR (2004) Yeast telomerase RNA: A flexible scaffold for proteinsubunits. Proc Natl Acad Sci USA 101(27):10024–10029.
6 of 6 | www.pnas.org/cgi/doi/10.1073/pnas.1415685111 Chen et al.