Embed Size (px)
Citation preview

MODIS On-Orbit Thermal Emissive Bands Lifetime Performance
Sriharsha Madhavan1, Aisheng Wu1, Na Chen1, and Xiaoxiong Xiong2
1Science Systems and Applications Inc., 10210, Greenbelt Road, Lanham, MD 20706
2Sciences and Exploration Directorate, NASA/GSFC, Greenbelt, MD 20771
ABSTRACT
MODerate resolution Imaging Spectroradiometer (MODIS), a leading heritage sensor in the fleet
of Earth Observing System for the National Aeronautics and Space Administration (NASA) is in
space orbit on two spacecrafts. They are the Terra (T) and Aqua (A) platforms. Both instruments
have successfully continued to operate beyond the 6 year design life time, with the T-MODIS
currently functional beyond 15 years and the A-MODIS operating beyond 13 years respectively.
The MODIS sensor characteristics include a spectral coverage from 0.41 µm – 14.4 µm, of
which wavelengths ranging from 3.7 µm – 14. 4 µm cover the thermal infrared region also
referred to as the Thermal Emissive Bands (TEBs). The TEBs is calibrated using a v-grooved
BlackBody (BB) whose temperature measurements are traceable to the National Institute of
Standards and Technology temperature scales. The TEBs calibration based on the onboard BB is
extremely important for its high radiometric fidelity. In this paper, we provide a complete
characterization of the lifetime instrument performance of both MODIS instruments in terms of
the sensor gain, the Noise Equivalent difference Temperature, key instrument telemetry such as
the BB lifetime trends, the instrument temperature trends, the Cold Focal Plane telemetry and
finally, the total assessed calibration uncertainty of the TEBs.
Keywords: MODIS, Terra, Aqua, Thermal Emissive bands, Blackbody, Calibration
1. Introduction
The MODerate-resolution Imaging Spectroradiometer (MODIS) is a legacy space borne sensor
in the fleet of Earth Observing System (EOS) for the National Aeronautics and Space
Administration (NASA). The instrument is in space orbit on two spacecrafts, namely the Terra
(T) and Aqua (A) platforms [1-4]. The T-platform is on a sun synchronous morning orbit while
the A-platform is on a similar sun synchronous afternoon orbit. They have an equatorial crossing
time of approximately 10:30 AM and 1:30 PM local time, respectively. Hence, the Earth is
covered by both MODIS instruments within a day, which has significantly helped the scientific
community to capture any observable diurnal changes in the Earth’s climate. MODIS is a paddle
broom scanning radiometer that includes a 360° rotating double-sided scan mirror and several
on-board calibrators (OBCs) as illustrated in Figure 1. The MODIS instruments remotely capture
the top of atmosphere (TOA) radiance from the Earth in 36 spectral bands varying from 0.41 µm
https://ntrs.nasa.gov/search.jsp?R=20170003351 2019-02-03T13:56:12+00:00Z

to 14.4 µm, at three different geospatial resolutions of 250 m, 500 m, and 1 km, respectively. The
spectral wavelengths long ward of 3.7 µm covers the thermal infrared region which is split into
16 Thermal Emissive Bands (TEBs). The 36 spectral bands are located on four Focal Plane
Assemblies (FPAs) that includes the visible FPA, the near infrared FPA, the Short and Middle
wave InfraRed (SMIR) FPA, and the Long Wave InfraRed (LWIR) FPA. The SMIR and LWIR
FPAs house the thermal sensors that are maintained at a nominally cooled temperature of
approximately 83 K. Figure 2 shows the four FPAs along with the detector layout for each of the
MODIS bands, the red outline highlighting the cold FPAs, including all the TEB detectors. The
TEB detectors are calibrated using a well referenced source that comprises of a v-grooved
BlackBody (BB). Figure 1 shows the setup of the various OBCs, and in particular the BB in
highlight is used for the detector calibration for each of the TEBs [5]. The TEB calibration is a
two point calibration with the BB raw counts providing the calibrating signal at a nominal
temperature while the Space-View (SV) signal is used to determine the background signal digital
number (DN) that would help correct the electronic offsets and thermal background from the
actual measurements [6]. Table 1 gives the key design parameters including the calibration
requirements for the detector noise and the primary application for each of the TEBs.
With the given instrument background, the rest of the paper is organized as follows. Section 2
briefly goes over the fundamental calibration equation and the methodology. This is followed by
the TEB performance which covers the following subsetted aspects. The subsections include the
long term instrument gain and noise characterization, various instrument related telemetry and
the assessed calibration uncertainty over the lifetime. Finally, the paper is closed with an overall
synopsis of the lifetime TEB performance for both T- and A-MODIS respectively.
Figure 1. MODIS Instrument setup with On-board Calibrators.

Figure 2. MODIS Focal Plane layout (red box highlighting the TEB).
Table 1. MODIS spectral band design specifications. CW is center wavelength in m; BW is bandwidth in m;
Ttyp is typical temperature in °K; NEdT is noise equivalent difference temperature in °K.
TEB Band CW BW Ttyp NEdT Primary Use
20 3.75 0.18 300 0.05
Surface/cloud temperature 21 3.96 0.06 335 0.20
22 3.96 0.06 300 0.07
23 4.05 0.06 300 0.07
24 4.47 0.07 250 0.25 Atmospheric temperature
25 4.52 0.07 275 0.25
27 6.72 0.36 240 0.25 Water vapor
28 7.33 0.30 250 0.25
29 8.55 0.30 300 0.05 Cloud properties
30 9.73 0.30 250 0.25 Ozone
31 11.03 0.50 300 0.05 Surface/cloud temperature
32 12.02 0.50 300 0.05
33 13.34 0.30 260 0.25
Cloud top altitude 34 13.64 0.30 250 0.25
35 13.94 0.30 240 0.25
36 14.24 0.30 220 0.35
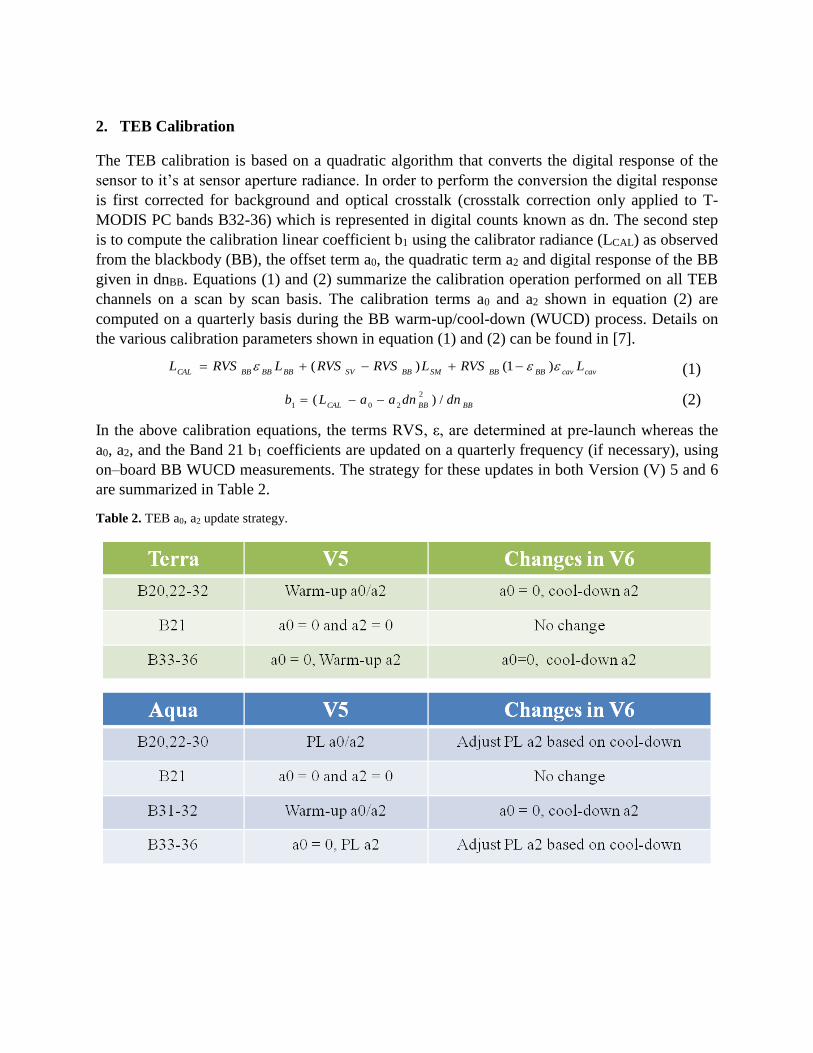
2. TEB Calibration
The TEB calibration is based on a quadratic algorithm that converts the digital response of the
sensor to it’s at sensor aperture radiance. In order to perform the conversion the digital response
is first corrected for background and optical crosstalk (crosstalk correction only applied to T-
MODIS PC bands B32-36) which is represented in digital counts known as dn. The second step
is to compute the calibration linear coefficient b1 using the calibrator radiance (LCAL) as observed
from the blackbody (BB), the offset term a0, the quadratic term a2 and digital response of the BB
given in dnBB. Equations (1) and (2) summarize the calibration operation performed on all TEB
channels on a scan by scan basis. The calibration terms a0 and a2 shown in equation (2) are
computed on a quarterly basis during the BB warm-up/cool-down (WUCD) process. Details on
the various calibration parameters shown in equation (1) and (2) can be found in [7].
(1)
(2)
In the above calibration equations, the terms RVS, ε, are determined at pre-launch whereas the
a0, a2, and the Band 21 b1 coefficients are updated on a quarterly frequency (if necessary), using
on–board BB WUCD measurements. The strategy for these updates in both Version (V) 5 and 6
are summarized in Table 2.
Table 2. TEB a0, a2 update strategy.
cavcavBBBBSMBBSVBBBBBBCALLRVSLRVSRVSLRVSL )1()(
BBBBCALdndnaaLb /)(
2
201
3. TEB Performance
Three key aspects of the MODIS TEB performance are discussed. These include the instrument
gain for all bands (also referred to as the reciprocal of the linear calibration term b1), associated
sensor noise characterized in terms of the Noise Equivalent difference Temperature (NEdT) [8],
various instrument telemetries such as the BB, instrument, and focal plane temperature trends,
and lastly the instrument assessed calibration uncertainty.
3.1 Sensor Gain and Noise
Based on the long term gain trends for both T-MODIS and A-MODIS as shown in Figure 3, a
more or less stable detector response is noticed for the SMIR bands excluding sensor
configuration changes and instrument reset events. However, in the case of T-MODIS PV LWIR
bands (27-30), large downward drifts in gain are observe which have been identified to be due to
the electronic crosstalk contamination [9]. The PC LWIR bands of T-MODIS are relatively
stable with maximum changes in the order of approximately 2% over lifetime. In contrast, A-
MODIS has exhibited stable long term variations for the PV LWIR bands. However, due to the
loss of cold focal plane cooler margin [10], the instrument response for the PC LWIR bands has
caused significant oscillations due to the seasonal changes in the cold focal plane temperatures.
In order to highlight the differences in the noise performance for T- and A- MODIS, the lifetime
normalized NEdT (weekly sampled, scan averaged) trends for good detectors are provided.
Figure 4 gives the normalized NEdT trend for both T-MODIS and A-MODIS respectively. The
trend clearly shows that these detectors meet the design specifications for the almost entirety of
their mission. It is noted that the noisy nature for T-MODIS PV LWIR bands have increased
since 2010, is chiefly attributed to the severe degradation in the electronic circuitry of these
bands due to electronic crosstalk. In comparison, the normalized band averaged NEdT trends for
A-MODIS clearly meet the noise requirements; furthermore, the noise levels are lower by at
least a factor of 2 in comparison to the normalized specification line of 1.0.

a.
b.
Figure 3. Long-term gain (1/b1) trending for TEBs of a. T-MODIS b. A-MODIS.

a.
b.
Figure 4. Long-term normalized NEdT trending for TEBs of a. T-MODIS b. A-MODIS.
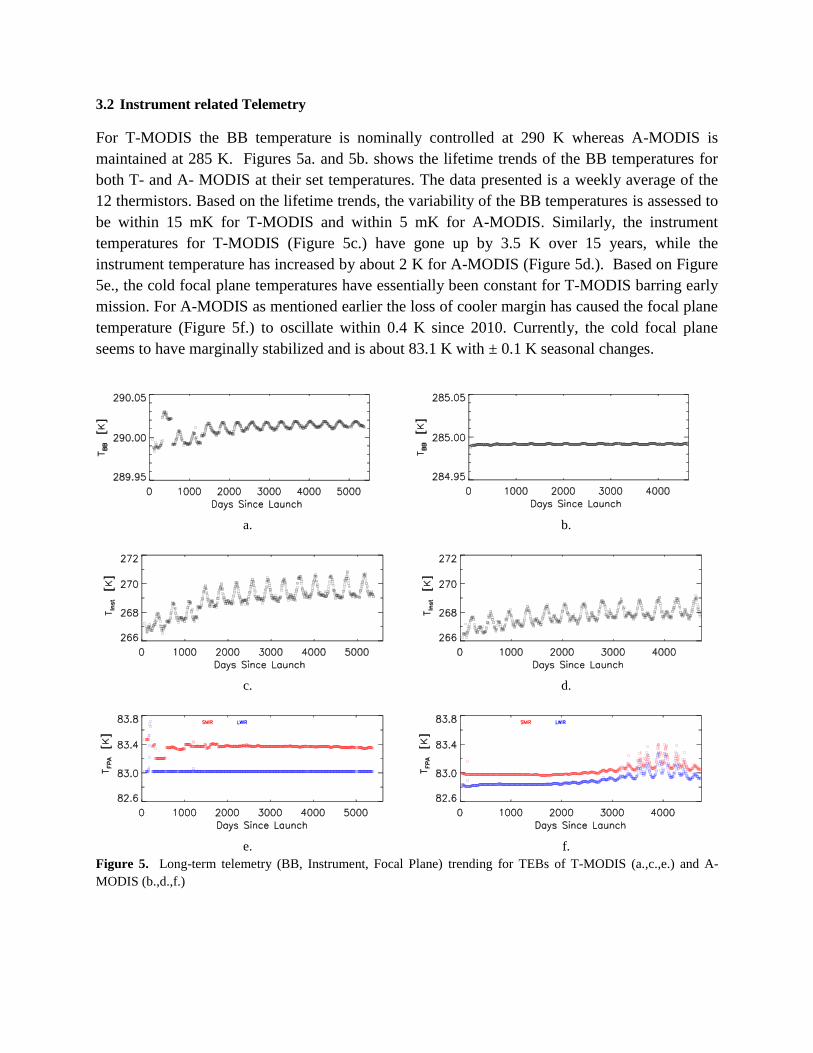
3.2 Instrument related Telemetry
For T-MODIS the BB temperature is nominally controlled at 290 K whereas A-MODIS is
maintained at 285 K. Figures 5a. and 5b. shows the lifetime trends of the BB temperatures for
both T- and A- MODIS at their set temperatures. The data presented is a weekly average of the
12 thermistors. Based on the lifetime trends, the variability of the BB temperatures is assessed to
be within 15 mK for T-MODIS and within 5 mK for A-MODIS. Similarly, the instrument
temperatures for T-MODIS (Figure 5c.) have gone up by 3.5 K over 15 years, while the
instrument temperature has increased by about 2 K for A-MODIS (Figure 5d.). Based on Figure
5e., the cold focal plane temperatures have essentially been constant for T-MODIS barring early
mission. For A-MODIS as mentioned earlier the loss of cooler margin has caused the focal plane
temperature (Figure 5f.) to oscillate within 0.4 K since 2010. Currently, the cold focal plane
seems to have marginally stabilized and is about 83.1 K with ± 0.1 K seasonal changes.
a. b.
c. d.
e. f.
Figure 5. Long-term telemetry (BB, Instrument, Focal Plane) trending for TEBs of T-MODIS (a.,c.,e.) and A-
MODIS (b.,d.,f.)

3.3 Calibration Uncertainty
The total TEB uncertainty is expressed as root sum of squares of each individual uncertainty
term. The uncertainty term in principle is evaluated via a partial derivative of the Earth view
retrieval equation with respect to each individual calibration term. Details on the mechanism can
be found in [7]. Figure 6 shows the bar chart of the assessed uncertainties for the TEBs of T- and
A- MODIS evaluated at different years. Also, these are evaluated for typical scene radiance
levels and close to ‘at nadir’ acquisitions. Based on the charts shown, the uncertainties assessed
for T-MODIS band 30 currently exceeds the design requirement of 1%. As aforementioned, the
electronic crosstalk impact has severely impacted the calibration terms a0, a2 and b1 due to which
the uncertainties have significantly increased. Apart from that most of the other bands meet the
design requirements with the exception of band 36. It was assessed at pre-launch that all
detectors violated the uncertainty requirements and have behaved more or less in a similar
fashion on-orbit. For A-MODIS, the TEBs have met the required calibration uncertainty since
launch to date.
a.
b.
Figure 6. Uncertainty bar-chart for TEBs of a. T-MODIS, b. A-MODIS

4. Summary
MODIS a key legacy sensor on the T- and A- platforms has successfully operated in space far
exceeding their individual design lifetime of 6 years. Both sensors have exhibited very stable
performance in terms of the instrument and BB temperatures. The cold focal plane of A-MODIS
was found to have an issue of maintaining its set point of 83 K starting 2007 and had reached a
high point of close to 83.4 K by 2011~2012. Thereafter a marginal return of stability in the
LWIR cooler margin has been assessed. The impact on the calibration due to the loss of cooler
margin is found to be minimal since the TEB calibration is based on a scan-by-scan basis. A
majority of the impact is captured by the linear calibration term. For T-MODIS the cold focal
plane has been essentially constant throughout the lifetime. In terms of sensor performance A-
MODIS has exhibited very slow changes in terms of gain and NEdT. However, in the case of T-
MODIS the PV LWIR bands have shown large downward drifts in instrument gain, with
correlating increase in the NEdT since 2010. Electronic crosstalk contamination in these bands
has been identified to be the root cause. Finally, the assessed TEB uncertainties corroborate the
sensor performance, have found to be meeting the design requirements barring the exceptions
noted earlier. Thus, an accurate sensor calibration is extremely important to achieve high
radiometric fidelity as in the case of MODIS, which in turn allows high quality geophysical
retrievals that are impactful for various climate and environmental studies.
Acknowledgements
The authors would like to thank all current and past members of the MCST for their many and
varied contributions over the years. In addition thanks go to the science team members we have
collaborated with, leading to greater understanding of instrument performance, impacts on the
science products and improvements in our calibration methodologies.
References
[1] Esaias, W. E., M. R. Abbott, I. Barton, O. W. Brown, J. W. Campbell, K. L. Carder, D. K. Clark, R.
L. Evans, F. E. Hoge, H. R. Gordon, W. P. Balch, R. Letelier, and P. J. Minnett, “An Overview of
MODIS Capabilities for Ocean Science Observations,” IEEE Trans. Geosci. Remote Sensing, 36,
1250-1265 (1998).
[2] Justice, C. O., E. Vermote, J. R. G. Townshend, R. Defries, D. P. Roy, D. K. Hall, V. V.
Salomonson, J. L. Privette, G. Riggs, A. Strahler, W. Lucht, R. B. Myneni, P. Lewis, and M. J.
Barnsley, “The Moderate Resolution Imaging Spectroradiometer (MODIS): Land Remote Sensing for
Global Change Research,” IEEE Trans. Geosci. Remote Sensing, 36, 1228-1249 (1998).
[3] King, M. D., W. P. Menzel, Y. J. Kaufman, D. Tanre, B. C. Gao, S. Platnick, S. A. Ackerman, L. A.
Remer, R. Pincus, and P. A. Hubanks, “Cloud and Aerosol Properties, Precipitable Water, and
Profiles of Temperature and Water Vapor from MODIS,” IEEE Trans. Geosci. Remote Sensing, 41,
442-458 (2003).
[4] Parkinson, C. L., “Summarizing the first ten years of NASA’s Aqua mission,” IEEE Journal of
Selected Topics in Applied Earth Observations and Remote Sensing, 6(3), 1179-1188 (2013).

[5] Xiong, X., K. Chiang, A. Wu, W. Barnes, B. Guenther, and V. Salomonson, “Multiyear on-orbit
calibration and performance of Terra MODIS thermal emissive bands,” IEEE Trans. Geosci. Remote
Sens. 46, 1790-1803 (2008).
[6] Xiong, X., B. Wenny, A. Wu, and W. Barnes, "MODIS On-board Blackbody Function and
Performance", IEEE Trans. Geosci. Remote Sens. 47, (2009).
[7] Xiong, X., A. Wu, B. N. Wenny, S. Madhavan, Z. Wang, Y. Li, N. Chen, W. Barnes, and V.
Salomonson, “Terra and Aqua MODIS Thermal Emissive Bands On-orbit Calibration and
Performance”, IEEE Transactions on Geoscience and Remote Sensing, 53, 5709 - 5721, (2015).
[8] Madhavan, S., X. Xiong, A. Wu, B. N. Wenny, K. Chiang, N. Chen, Z. Wang, Y. Li, “Noise
Characterization and Performance of MODIS Thermal Emissive Bands”, IEEE Transactions on Geo
science and Remote Sensing (10.1109/TGRS.2015.2514061), (2016).
[9] Sun, J., S. Madhavan, X. Xiong, and M. Wang, “Electronic crosstalk in Terra MODIS thermal
emissive bands”, Proc. SPIE 9607, 960730 (2015).
[10] Wang, Z., S. Madhavan, X. Xiong, A. Wu, and B.N. Wenny, “Monitoring and assessment of the
temperature fluctuation of Aqua MODIS cold focal plane assembly”, Proceedings of SPIE- Earth
Observing Systems XVII, vol. 8510, issue 85100K, 2012.