Embed Size (px)
Citation preview

SAND REPORT
SAND2003-0154 Unlimited Release Printed January 2003 Modification of TOUGH2 for Enhanced Coal Bed Methane Simulations
Stephen W. Webb Prepared by Sandia National Laboratories Albuquerque, New Mexico 87185 and Livermore, California 94550 Sandia is a multiprogram laboratory operated by Sandia Corporation, a Lockheed Martin Company, for the United States Department of Energy under Contract DE-AC04-94AL85000. Approved for public release; further dissemination unlimited.

2
Issued by Sandia National Laboratories, operated for the United States Department of Energy by Sandia Corporation.
NOTICE: This report was prepared as an account of work sponsored by an agency of the United States Government. Neither the United States Government, nor any agency thereof, nor any of their employees, nor any of their contractors, subcontractors, or their employees, make any warranty, express or implied, or assume any legal liability or responsibility for the accuracy, completeness, or usefulness of any information, apparatus, product, or process disclosed, or represent that its use would not infringe privately owned rights. Reference herein to any specific commercial product, process, or service by trade name, trademark, manufacturer, or otherwise, does not necessarily constitute or imply its endorsement, recommendation, or favoring by the United States Government, any agency thereof, or any of their contractors or subcontractors. The views and opinions expressed herein do not necessarily state or reflect those of the United States Government, any agency thereof, or any of their contractors. Printed in the United States of America. This report has been reproduced directly from the best available copy. Available to DOE and DOE contractors from
U.S. Department of Energy Office of Scientific and Technical Information P.O. Box 62 Oak Ridge, TN 37831 Telephone: (865)576-8401 Facsimile: (865)576-5728 E-Mail: [email protected] Online ordering: http://www.doe.gov/bridge
Available to the public from
U.S. Department of Commerce National Technical Information Service 5285 Port Royal Rd Springfield, VA 22161 Telephone: (800)553-6847 Facsimile: (703)605-6900 E-Mail: [email protected] Online order: http://www.ntis.gov/help/ordermethods.asp?loc=7-4-0#online

3
SAND2003-0154 Unlimited Release
Printed January 2003
Modification of TOUGH2 for Enhanced Coal Bed Methane Simulations
Stephen W. Webb
Environmental Technologies Department Sandia National Laboratories
P.O. Box 5800 Albuquerque, NM 87185-0719
Abstract
The GEO-SEQ Project is investigating methods for geological sequestration of CO2. This project, which is directed by LBNL and includes a number of other industrial, university, and National Laboratory partners, is evaluating computer simulation models including TOUGH2. One of the problems to be considered is Enhanced Coal Bed Methane (ECBM) recovery. In this scenario, CO2 is pumped into methane-rich coal beds. Due to adsorption processes, the CO2 is sorbed onto the coal, which displaces the previously sorbed methane (CH4). The released methane can then be recovered, at least partially offsetting the cost of CO2 sequestration. Modifications have been made to the EOS7R equation of state in TOUGH2 to include the extended Langmuir isotherm for sorbing gases, including the change in porosity associated with the sorbed gas mass. Comparison to hand calculations for pure gas and binary mixtures shows very good agreement. Application to a CO2 well injection problem given by Law et al. (2002) shows good agreement considering the differences in the equations of state.

4
Table of Contents 1.0 Introduction....................................................................................................................9 2.0 Code Modifications......................................................................................................10 3.0 Verification ..................................................................................................................12 3.1 Isotherms................................................................................................................12 3.2 Law et al. (2002) Problem .....................................................................................14 4.0 Summary and Discussion.............................................................................................18 5.0 References....................................................................................................................20 Appendix Input for ECBM Modifications.........................................................................21

5
List of Figures Figure 1. Volume Nomenclature........................................................................................11 Figure 2. Pure Gas Isotherms.............................................................................................13 Figure 3. CH4-CO2 Sorption at 500 psia............................................................................13 Figure 4. CH4-N2 Sorption at 1000 psia.............................................................................13 Figure 5. CH4-CO2 Splits at 500 psia ................................................................................13 Figure 6. CH4-N2 Splits at 1000 psia .................................................................................13 Figure 7. Well Bottom-Hole Pressure................................................................................19 Figure 8. CH4 and CO2 Production Rates ..........................................................................19
List of Tables
Table 1. Langmuir Parameters (Arri et al., 1992)..............................................................13 Table 2. Radial Grid System..............................................................................................15 Table 3. Relative Permeability Relationships....................................................................16 Table 4. Coalbed Characteristics .......................................................................................17 Table 5. Problem Parameters .............................................................................................17

6
Nomenclature
Gs gas storage capacity (sm3/kg; scf/ton) GsL dry, ash-free Langmuir storage capacity (sm3/kg; scf/ton) p pressure (kPa, psia) pL Langmuir pressure (kPa, psia) x sorbed phase mole fraction y gas phase mole fraction wa ash weight fraction wwe equilibrium moisture weight fraction Greek α separation factor subscripts y mole fraction of component i in the gas phase i component i nc number of components

7
Acknowledgments I want to thank Karsten Pruess and Curt Oldenburg of LBNL for their thorough reviews. This work was sponsored through the GEO-SEQ Project at Lawrence Berkeley National Laboratory by Dr. Curtis M. Oldenburg. Sandia is a multiprogram laboratory operated by Sandia Corporation, a Lockheed Martin Company, for the United States Department of Energy under Contract DE-AC04-94AL85000.

8
Intentionally Left Blank

9
1.0 Introduction The GEO-SEQ Project is investigating methods for geological sequestration of CO2. This project, which is directed by LBNL and includes a number of other industrial, university, and National Laboratory partners, is evaluating computer simulation models including TOUGH2. As part of an earlier effort, Webb (2001) modified the gas diffusion formulation in TOUGH2 from Fick’s law to the more mechanistic Dusty Gas Model. The present investigation continues with modifications of TOUGH2, this time for Enhanced Coal Bed Methane (ECBM) recovery. In this scenario, CO2 is pumped into methane-rich coal beds. Due to adsorption processes, the CO2 is sorbed onto the coal, which displaces the previously sorbed methane (CH4). The released methane can then be recovered, at least partially offsetting the cost of CO2 sequestration. A number of papers discuss the mechanics of ECBM. Hall et al. (1994) compare their experimental data for adsorption of methane, nitrogen, and carbon dioxide and the binary mixtures on wet Fruitland coal with numerous models including the extended Langmuir and loading ratio (LRC) correlations, as well as three versions of 2-d EOS, the van der Waals, Eyring, and EOS-S. For the mixture data, the ideal adsorbed solution (IAS) approach is also evaluated. The details of the various models are beyond the scope of the present document, and the interested reader is referred to the original reference. For pure gas adsorption, the extended Langmuir model performed the poorest with a %AAD (absolute average percent deviation) of about 2.5; the other models were similar to each other with a %AAD ranging from 0.6 to 1.8 for the various pure gases, or almost within the experimental uncertainty. For binary mixtures, the Langmuir and LRC models performed the poorest while the other models were about equal. The %AAD for the Langmuir model is 19 and 11 for the individual gases and 6 for the total. For the LRC, the corresponding values are 28, 6 and 8. For the other models, the average corresponding values are about 13, 9, and 5. The relatively poor performance of the Langmuir model is probably due to the fact that it has only 2 model constants to fit the experimental data for pure gas adsorption, while the other approaches have 3 model constants. Note that all the data fits were done for the pure gas adsorption data, not for the mixture data. Arri et al. (1992) came to similar conclusions about the performance of the extended Langmuir model. The Langmuir model seems to perform well at 500 psia but not as well at 1000 and 1500 psia. The overall conclusion can be reached that the extended Langmuir model provides a reasonable prediction of the adsorption processes of ECBM, especially for scoping studies. However, for more accurate predictions, investigation of the use of other more complex models may be necessary.

10
2.0 Code Modifications For the purposes of this report, the extended Langmuir model is considered to be adequate for the prediction of ECBM. The extended Langmuir isotherm is given below (Law et al., 2002). The gas storage capacity for a single gas species is given by the Langmuir relationship
(1) where Gs gas storage capacity GsL dry, ash-free Langmuir storage capacity wa ash weight fraction wwe equilibrium moisture weight fraction p pressure pL Langmuir pressure The individual Langmuir parameters from equation (1) are used to model multiple gas species through the extended Langmuir isotherm
(2) where y mole fraction of component i in the gas phase i component i nc number of components The sorbed gases lead to coal bed volume changes. The density of the sorbed gases determines the sorbed volume and resultant coal bed shrinkage or swelling. The sorbed gas density is not well defined. Arri et al. (1992) suggest that the sorbed gas density can be approximated as the liquid density at the atmospheric boiling point, which is 421. kg/m3 for methane. Because CO2 is a solid at the atmospheric boiling point, they suggest the saturated liquid density at the triple point, or 1180 kg/m3. As part of the present effort, TOUGH2 has been modified to include the extended Langmuir isotherm, which is then applied to ECBM. In order to describe coalbed shrinking and swelling, the sorbed gases change the local porosity as determined by the sorbed gas density and the amount of gas sorbed. Two porosities or volumes are defined;
( )[ ]L
weasLs pppwwGG+
+−= 1
( )[ ]∑=
++−=
nc
j Lj
j
Li
i
weasLisi
py
p
pyp
wwGG
1
11
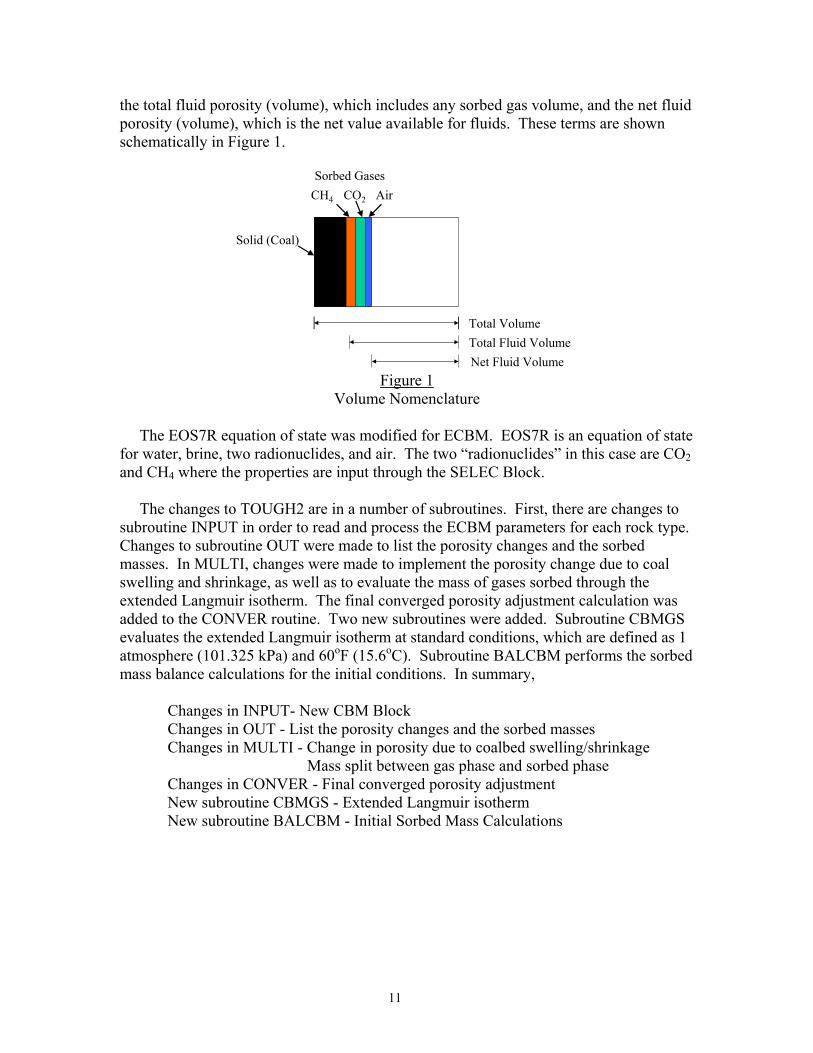
11
the total fluid porosity (volume), which includes any sorbed gas volume, and the net fluid porosity (volume), which is the net value available for fluids. These terms are shown schematically in Figure 1.
Figure 1 Volume Nomenclature
The EOS7R equation of state was modified for ECBM. EOS7R is an equation of state for water, brine, two radionuclides, and air. The two “radionuclides” in this case are CO2 and CH4 where the properties are input through the SELEC Block. The changes to TOUGH2 are in a number of subroutines. First, there are changes to subroutine INPUT in order to read and process the ECBM parameters for each rock type. Changes to subroutine OUT were made to list the porosity changes and the sorbed masses. In MULTI, changes were made to implement the porosity change due to coal swelling and shrinkage, as well as to evaluate the mass of gases sorbed through the extended Langmuir isotherm. The final converged porosity adjustment calculation was added to the CONVER routine. Two new subroutines were added. Subroutine CBMGS evaluates the extended Langmuir isotherm at standard conditions, which are defined as 1 atmosphere (101.325 kPa) and 60oF (15.6oC). Subroutine BALCBM performs the sorbed mass balance calculations for the initial conditions. In summary,
Changes in INPUT- New CBM Block
Changes in OUT - List the porosity changes and the sorbed masses Changes in MULTI - Change in porosity due to coalbed swelling/shrinkage
Mass split between gas phase and sorbed phase Changes in CONVER - Final converged porosity adjustment New subroutine CBMGS - Extended Langmuir isotherm New subroutine BALCBM - Initial Sorbed Mass Calculations
Solid (Coal)
CH4 CO2 AirSorbed Gases
Total VolumeTotal Fluid VolumeNet Fluid Volume

12
3.0 Verification Verification of the modifications to TOUGH2 is provided through comparison of the output from the code to literature results. The first verification exercise compares the results from extended Langmuir isotherm calculations with the results presented by Arri et al. (1992). These results are for pure gas and binary gas sorption, where the extended Langmuir parameters are specified by Arri et al. (1992). The second verification exercise is for a sample problem presented by Law et al. (2002), which has been used for comparison of various ECBM simulators. 3.1 Isotherms Arri et al. (1992) present the results of isotherm calculations for pure gas and binary gas conditions for CH4, CO2, and N2. The results from the present calculation are presented in the same English units used in the original reference for ease of comparison. Figure 2 shows the pure gas isotherm results; the extended Langmuir values are summarized in Table 1. The solid line is the isotherm given earlier by equation (1) with zero ash and moisture weight fractions, while the circles are the results from the modified TOUGH2 code. The agreement is excellent. Figures 3 through 6 present results for binary gas adsorption using the extended Langmuir isotherm constants given in Table 1. Figure 3 shows the CH4-N2 binary gas sorption isotherms at 500 psia calculated with the modified TOUGH2 program as given by the circles. The solid lines are the analytical solution given by equation (2). Figure 4 presents the CH4-CO2 isotherm at 1000 psia. In both cases, the agreement is excellent between the analytical solution and the results from the modified TOUGH2 program. The species splits in the gas phase and the sorbed phase are shown in Figures 5 and 6 for the two mixtures given above. These curves are independent of pressure because it is completely defined by the pure gas Langmuir isotherms as discussed by Arri et al. (1992). The separation factor, α, is given by
j
ii
yx
yx
=α (3)
where x is the sorbed phase mole fraction and y is the gas phase mole fraction, and i and j are the two gases. The value of the separation factor can be calculated from (Arri, et al., 1992)
( )( ) jLsL
iLsLi pG
pG//
=α (4)

13
Table 1. Langmuir Parameters (Arri et al., 1992) Gas GSL(SCF/ton) pL (psia) CO2 1128 204.5 CH4 759 362.3 N2 616 1458.
Figure 2 Pure Gas Isotherms
Figure 3 Figure 4 CH4-CO2 Sorption at 500 psia CH4-N2 Sorption at 1000 psia Figure 5 Figure 6 CH4-CO2 Splits at 500 psia CH4-N2 Splits at 1000 psia
0.0 0.1 0.2 0.3 0.4 0.5 0.6 0.7 0.8 0.9 1.0
Mole Fraction CH4 in Gas Phase
0100200300400500600700800900
Gas
Con
tent
- SC
F/to
n dr
y co
al
CO2
CH4
Total
0.0 0.1 0.2 0.3 0.4 0.5 0.6 0.7 0.8 0.9 1.0
Mole Fraction CH4 in Gas Phase
0100200300400500600700800900
Gas
Con
tent
- SC
F/to
n dr
y co
al
N2
CH4
Total
0.0 0.1 0.2 0.3 0.4 0.5 0.6 0.7 0.8 0.9 1.0
Mole Fraction in Sorbed Phase
0.000.100.200.300.400.500.600.700.800.901.00
Mol
e Fr
actio
n in
Gas
Pha
se
CO2
CH4
0 300 600 900 1200 1500 1800 2100 2400
Pressure (psia)
0100200300400500600700800900
1000
Gas
Con
tent
- SC
F/to
n dr
y co
al
CO2
CH4
N2
0.0 0.1 0.2 0.3 0.4 0.5 0.6 0.7 0.8 0.9 1.0
Mole Fraction in Sorbed Phase
0.000.100.200.300.400.500.600.700.800.901.00
Mol
e Fr
actio
n in
Gas
Pha
se
N2
CH4

14
which is not a function of pressure. For a binary gas mixture, equation can be rearranged to give the gas phase mole fraction of component i as
11
1−
−+=
i
iii x
xy α (5)
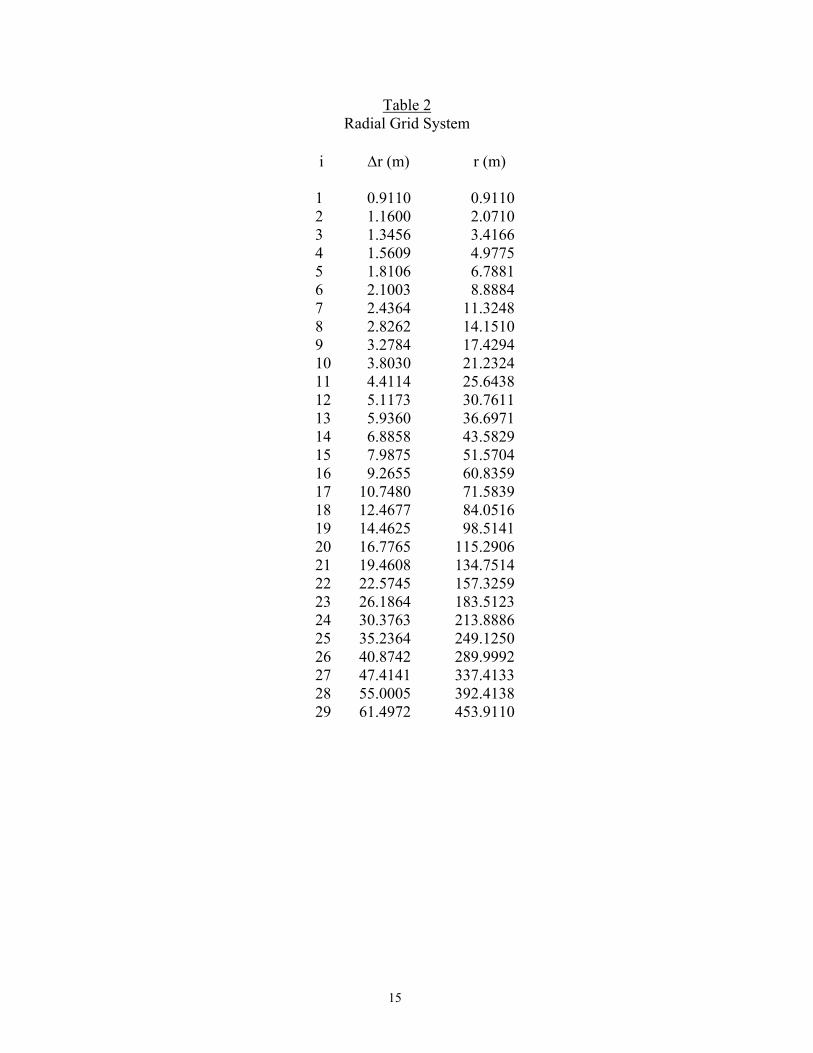
which is the solid line in the figures. Again, the agreement between the results from the modified TOUGH2 code and the analytical solutions is excellent. 3.2 Law et al. (2002) Problem Recently, Law et al. (2002) have presented a comparison of ECBM simulators for two simplified problem sets. The first problem is a single-well CO2 injection test, while the second problem is a 5-spot CO2-ECBM recovery process. The geometry and relative permeability functions are explicitly defined by Law et al. (2002); note that there is no capillary pressure. The first problem (single well CO2 injection) will be analyzed with the modified TOUGH2 code in this section. The problem involves injecting pure CO2 into a coal seam. Flow occurs in natural fractures that have a small natural porosity of 0.001 and a permeability of 3.65 millidarcies. The initial conditions of the reservoir are 7650 kPa, 45oC, and a gas saturation of 0.408 of pure CH4. Coal matrix swelling/shrinkage is neglected. The problem chronology is an initial 15 days of CO2 injection followed by a 45-day shut-in period, a 60-day production period, and a 62.5-day shut-in period. The mesh is specified as a 29x1x1 cylindrical grid with given spacing as detailed in Table 2. The well radius is 0.0365 m. For this problem, a new relative permeability function had to be added to TOUGH2. The relative permeabilities for water and gas are specified as a tabular function of water saturation as given in Table 3. Details of the coalbed characteristics are given in Table 4, while the test parameter details are summarized in Table 5. No coal swelling or shrinking is included in the problem. This behavior was modeled by specifying the sorbed gas density as artificially high (1010 kg/m3) in order to effectively disable effect of sorbed gases on the porosity. In the present simulations using the modified version of TOUGH2, CO2 and CH4 are modeled as ideal gases. CO2 is obviously not an ideal gas, especially for the conditions encountered in this problem, but this assumption had to be made for the present simulations due to the use of EOS7R for the ECBM modifications.
15
Table 2 Radial Grid System
i ∆r (m) r (m) 1 0.9110 0.9110 2 1.1600 2.0710
3 1.3456 3.4166 4 1.5609 4.9775 5 1.8106 6.7881 6 2.1003 8.8884 7 2.4364 11.3248 8 2.8262 14.1510 9 3.2784 17.4294 10 3.8030 21.2324 11 4.4114 25.6438 12 5.1173 30.7611 13 5.9360 36.6971 14 6.8858 43.5829 15 7.9875 51.5704 16 9.2655 60.8359 17 10.7480 71.5839 18 12.4677 84.0516 19 14.4625 98.5141 20 16.7765 115.2906 21 19.4608 134.7514 22 22.5745 157.3259 23 26.1864 183.5123 24 30.3763 213.8886 25 35.2364 249.1250 26 40.8742 289.9992 27 47.4141 337.4133 28 55.0005 392.4138 29 61.4972 453.9110

16
Table 3 Relative Permeability Relationships
Water Saturation Relative Permeability Water Gas
1.00 1.000 0.000 0.975 0.814 0.0035 0.950 0.731 0.007 0.90 0.601 0.018 0.85 0.490 0.033 0.80 0.392 0.051 0.75 0.312 0.070 0.70 0.251 0.090 0.65 0.200 0.118 0.60 0.154 0.147 0.55 0.116 0.180 0.50 0.088 0.216 0.45 0.067 0.253 0.40 0.049 0.295 0.35 0.035 0.342 0.30 0.024 0.401 0.25 0.015 0.466 0.20 0.007 0.537 0.15 0.002 0.627 0.10 0.0013 0.720 0.05 0.0006 0.835 0.00 0.000 1.000

17
Table 4 Coalbed Characteristics
Coal Seam Thickness 9 m Top of Coal Seam 1253.6 m Absolute Permeability of Natural Fractures 3.65 md Relative Permeabilities see Table 3 Porosity of Natural Fracture System 0.001 Effective Compressibility 1.45 x 10⁻⁷ kPa-1
Initial Conditions Temperature 45oC Pressure (uniform) 7650 kPa Gas Saturation 0.408 (100% CH4) Liquid Saturation 0.592
Pure Gas Adsorption Isotherms In-Situ Coal Density 1434 kg/m3 In-Situ Moisture Content (by wt.) 0.0672 In-Situ Ash Content (by wt.) 0.156 CH4 GsL 0.0152 sm3/kg pL 4688.5 kPa CO2 GsL 0.0310 sm3/kg pL 1903. kPa N2 GsL 0.0150 sm3/kg pL 27,241. kPa
Water Properties - Specified in Problem Definition – internal TOUGH2 properties used instead
Table 5
Problem Parameters
Cylindrical Grid (r-θ-z): 29x1x1 Inner radius 0.0365 m Outer Radius 454 m
Mesh see Table 2
15-day CO2 Injection period (0 - 15 days) - CO2 Injection Rate - 28,316.82 sm3/d - Maximum Bottom-Hole Pressure - 15,000 kPa
45-day Shut-In (15 - 60 days) 60-day Production period (60 - 120 days)
- Maximum Production rate - 100,000 sm3/d - Minimum Bottom-Hole Pressure - 275 kPa
62.5-day Shut-In Period (120 - 182.5 days)

18
The simulations had some difficulties converging, possibly because the single-phase gas equation of state has not been fully implemented in EOS7R as noted in the source code. Therefore, the borehole conditions were specified as two-phase with a small liquid saturation of 0.01. In addition, the final shut-in period had to be altered in order to obtain results. With zero capillary pressure, which is part of the problem definition, the simulation wouldn’t run to completion because the element next to the borehole became completely saturated, which caused the time steps to become very small. Capillary pressure was added to the rock parameters in order to obtain convergence and reasonable time steps. The addition of capillary pressure is not expected to significantly influence the results. Because the main interest of the problem is the general ECBM behavior and not a direct comparison with the results of Law et al. (2002), this modification is acceptable. One of the parameters from the various codes that is compared in Law et al. (2002) is the initial gas-in-place for the CH4. The values for the five codes range from 6.0315 x 10⁷ to 6.1681 x 10⁷ sm3. The present code predicts 6.112 x 10⁷ sm3. The predicted bottom-hole pressure as a function of time is shown in Figure 7. The general behavior compares well to the results presented by Law et al. (2002) except that the borehole pressure during CO2 injection is low. This difference may due to the treatment of the borehole, which was treated explicitly in the present simulations, or by differences in CO2 properties. Figure 8 gives the gas production rate results. The relative flow rates of CH4 and CO2 are in agreement with the results given in Law et al. (2002). There are some differences in that the flow rate of CO2 decreases more rapidly in the present simulations than in the results in Law et al. (2002); again, this difference may be due to property differences or the borehole treatment. In general, the agreement is good considering the differences in physical properties and the fact that EOS7R has not fully implemented single-phase gas. Further comparisons should be made when the present modifications are incorporated into an equation of state that properly treats CO2 and CH4. 4.0 Summary and Discussion Based on the above results, the ECBM code modifications to TOUGH2 seem to be working correctly. Comparisons to isotherms for single and multiple gases compare very well. The results from a borehole injection problem given by Law et al. (2002) compare favorably considering differences in properties between the simulations. Additional comparisons should be performed when these modifications are incorporated into an equation of state that properly treats CO2 and CH4.

19
Figure 7 – Well Bottom-Hole Pressure
Figure 8 – CH4 and CO2 Production Rates
0 20 40 60 80 100 120 140160 180
Time (days)
0
10
20
30
40
50
(Tho
usan
ds)
Gas
Pro
duct
ion
(sm
3 /day
)
CO2
CH4
0 20 40 60 80 100 120 140160 180
Time (days)
0
2
4
6
8
10
12
14
16
(Tho
usan
ds)
Botto
mho
le P
ress
ure
(kPa
)
Pressure Falloff
CO2 Injection
Gas Production
Pressure Buildup

20
5.0 References Arri, L.E., D. Yee, W.D. Morgan, and M.W. Jeansonne, 1992, “Modeling Coalbed Methane Production With Binary Gas Sorption,” SPE 24363, SPE Rocky Mountain Regional meeting, Casper, Wyoming, May 18-21, 1992. Hall, F.E., C. Ahou, K.A.M. Gasem, R.L. Robinson, Jr., and D. Yee, “Adsorption of Pure Methane, Nitrogen, and Carbon Dioxide and Their Binary Mixtures on Wet Fruitland Coal,” SPE 29194, 1994 Eastern Regional Conference & exhibit, Charleston, West Virginia, November 8-10, 1994. Law, D. H.-S., L.G.H. van der Meer, and W.D. Gunter, 2002, “Numerical Simulator Comparison Study for Enhanced Coalbed Methane Recovert Processes, Part 1: Pure Carbon Dioxide Injection, SPE 75669, SPE Gas Technology Symposium, Calgary, Alberta, 30 April – 2 May 2002. Webb, S.W., 2001, Modification of TOUGH2 to include the Dusty Gas Model for Gas Diffusion, SAND2001-3214, Sandia National Laboratories, Albuquerque, NM.

21
Appendix
Input for ECBM Modifications
The input for the ECBM modifications are in a new block named CBM. The extended Langmuir isotherm is only applied to specified materials, or rock types. The average in-situ moisture content, wwe, and average in-situ ash content, wa, are input as are the Langmuir parameters pL and GsL for each component. In the present case of EOS7R, there are 5 components. The sorbed gas density is also input to model coal swelling and shrinkage. The input format is as follows: CBM – Block for ECBM Input Material Name From ROCKS Block – format A5 wa and wwe – format 2f10.3 GsL (sm3/kg), pL (Pa), and Sorbed Gas Density (kg/m3) for all 5 components (water,
brine, radionuclide 1, radionuclide 2, air) Additional sets of material names and corresponding properties can be added to model heterogeneous properties. Sample CBM Block Input CBM coal 0.156 0.0672 0. 0. 0. 0. 0. 0. 0.0152 4688.5e3 421. 0.0310 1903.e3 1180. 0.0150 27241.e3 808. Note that while there are no Langmuir parameters for the water and brine components, they must be input.

22
Distribution
External Curtis M. Oldenburg (5) Earth Sciences Division Lawrence Berkeley National Laboratory 1 Cyclotron Road Berkeley, CA 94720 Karsten Pruess Earth Sciences Division Lawrence Berkeley National Laboratory 1 Cyclotron Road Berkeley, CA 94720 George Moridis Earth Sciences Division Lawrence Berkeley National Laboratory 1 Cyclotron Road Berkeley, CA 94720
Stefan Finsterle Earth Sciences Division Lawrence Berkeley National Laboratory 1 Cyclotron Road Berkeley, CA 94720 Sally Benson Earth Sciences Division Lawrence Berkeley National Laboratory 1 Cyclotron Road Berkeley, CA 94720
Internal MS-0719 S.M. Howarth, 6131 MS-0719 S.W. Webb, 6131 (5) MS-0701 P.B. Davies, 6100 MS-0701 W.R. Cieslak, 6100 MS-0750 D.J. Borns, 6116 MS-0750 H.R. Westrich, 6118 MS-9018 Central Technical Files, 8945-1 MS-0899 Technical Library, 9616 (2) MS-0612 Review and Approval Desk, 9612 for DOE/OSTI


![Chemically modified bitumens with enhanced rheology and ... · additives employed in the bitumen modification are waste polymer [7,8] (plastic from agriculture, crumb tyre rubber,](https://img.dokumen.tips/doc/110x75/5e9fb9f2f69cc877e74efe35/chemically-modified-bitumens-with-enhanced-rheology-and-additives-employed-in.jpg)