Embed Size (px)
Citation preview

MODFLOW USG – the next step in mathematical modelling of
underground water
DRAGAN KALUDJEROVIĆ1 & GORAN VIŽINTIN2
1Roscoe Moss Company, www.advancegwt.com, email: [email protected],
2University of Ljubljana, Faculty of Natural Sciences and Engineering, Aškerčeva cesta 12, SI-1000 Ljubljana, Slovenia; E-mail: [email protected],
ABSTRACT
Since the first software that has been documented in detail and widely accessible to all engineers in the world, the PLASM[1], and until recently the mainstream in mathematical modelling of underground water have been clearly the finite difference and finite elements methods. In 1988 the MODFLOW software package appeared and due to a soft estimation nowadays some 10000 engineers are using this software package. Besides the fact that other methods have only been used in scientific circles and that no other software gained such popularity as MODFLOW did, all of those have been based on the method of finite difference or finite elements. In the early 2013 the USGS (United States Geological Survey) website published the world premiere of MODFLOW USG. The abbreviation USG is for unstructured grid what represents a new approach in mathematical modelling of underground water. The reaction of GUI (graphical user interface) software developers was rapid and the new version of Groundwater Vistas (ver. 6) implemented this software package. In this paper, the basic characteristics of MODFLOW USG software package that tends to set new standards in groundwater modelling are presented.
Key words: MODFLOW USG, Groundwater Vistas, control volumes, finite differences, PEST
Introduction
Prior to MODFLOW USG software package description a short review of some historically important, preceding software packages is given.
The first software that has been documented in detail and widely accessible is the PLASM[1]. This software package was designed for 2D simulations using the numerical method of finite differences. Numerous authors progressively implemented various

additional options and in 1981 the option “Random Walk” for contamination transport simulation was added. This software package constitutes the beginning of wider use of numerical methods in hydrogeology of that time.
Considering contamination transport the first successful simulations are related to USGS MOC[2] software package. It is meant for 2D simulations of contamination transport by the method of characteristics and is well documented as well.
Next step represents the launch of MODFLOW software package in 1988 by USGS. This software package has been adopted rapidly throughout the world for many reasons and being well documented may be the quite important one. In the middle of nineties the first GUI (graphical user interface) packages appeared such as Groundwater Vistas, Visual MODFLOW and Model CAD working under WINDOWS operating system and making a precondition for comfort application of 3D numerical modelling.
As an open to all (free of charge) software package the MODFLOW obtained many improvements and upgrades, many new physical processes have been implemented as various contamination transport simulations (MT3DMS, RT3D, PHT3D) too. The current state of the software package is available on USGS website. The most significant fact is that the basic concept represented by continuous layers, orthogonal grid and classical formulation of underground water flow[3], hasn’t been changed since 1968.
In the early 2013 the official version of MODFLOW USG software package appeared on USGS website. The abbreviation USG is for unstructured grid what represents a new approach in mathematical modelling of underground water. The reaction of GUI (graphical user interface) software developers was rapid and the new version of Groundwater Vistas (ver. 6) implemented this software package. In the next section the basic characteristics of the MODFLOW USG software package are given.
MODFLOW USG software package fundamentals
As already said the official version of MODFLOW USG software package appeared on the USGS website in March 2013. The leading author is Dr. Sorab Pandey and co-authors are Chris Langevin, USGS, Reston, Rich Niswonger, USGS, Carson City, Joe Hughes, USGS, Tamp and Motomu Ibaraki, Ohio State University. The main advantage of the MODFLOW USG software package is the flexibility in numerical grid design. Looking at finite differences method condensing the numerical grid in the zone of interest shows the influence onto the whole model and very often at the very edge some very irregular shapes of fields and cells occur resulting in inaccurate results and extended time of model calculation. When comparing with MODFLOW USG this problem can not appear as the grid condensation is limited to the desired part of the model.

Figure 1. Possible variants of discretization in MODFLOW USG software package[4]
As shown on Figure 1 the layers in MODFLOW USG do not need to be continuous but it is possible to simulate faults and discontinued layers thus considerably improving the conceptual model of the treated aquifer.
Numerical method implemented in MODFLOW USG software package bases on the finite volume method called CVFD (control volume finite difference) that enables the flexibility of grid elements geometry, field dimensions and elements that can easily be modified and customized. (Figures 2 and 3).
Figure 2. Numeric grid in software package MODFLOW USG [4]

Figure 3. Elements’ shapes in CVFD method[4]
It is also important to mention that the cells have to be of prismatic shape, having vertical sides and flat top and bottom and also have to be convex. (Figure 3).
Speaking of discretization in the profile, some various options are possible (Figure 4): Figure 4a shows that it is still possible to mark the layers in the profile both pre- and post- result processing. Figure 4b shows the possibility of discontinued layers and Figure 4c shows the possibility to define several layers in one layer at only specific part of the model.
There are a few conditions on which the precision of the method is dependant. The most important condition is to have a right angle between the line connecting two nodes of the cell and the line at the contact of two cells (Figure 5). In the Groundwater Vistas software package the option Ghost Node Correction (GNC) is implemented enabling to define fictive nodes that meet this condition (Figure 6).
Some of basic MODFLOW USG software package characteristics were described above. It is important to note that this package is most effective in case of big hydraulic gradients (rivers, wells) and/or complex geology in the model (Figure 1).

Figure 4. Layers in MODFLOW USG [4]
Figure 5. Condition for precision of CVFD method[5]

Figure 6. Ghost Node correction in Groundwater Vistas software package, ver.6[5]
A practical example of MODFLOW USG software package usage
implemented in GUI Groundwater Vistas - regional model of water
source "Grmić" in Bijeljina
Basic data on the water source
Water supply system of the Bijeljina town and the surroundings gets the potable water from the water source “Grmić” located in the alluvium on the left bank of Drina river, very close to the town zone. “Grmić” water source is being exploited since 1961, when ten wells were made together with the pumping station of 105 l/s capacity and 80 l/s of backup. Later the capacity rose up to 335 l/s due to addition of new wells. Between 1991 and 1995 a rapid increase of inhabitants occur because of war operations. In 1995 the initial number of inhabitants doubled to reach round 80 000. Underground water exploitation of the water source in 1995 (470 l/s + 50 l/s backup) resulted in underground water regime change and in increased risk for contamination by the potential pollutants located nearby and upstream (cesspits, cemetery, illegal dumps, hospital waste, etc.)
Due to preventive reasons the first five wells (western part, closer to town) were excluded from the water supply system Bijeljina in the beginning of 1995. Exclusion

resulted in loss of round 130l/s of the total capacity but the latest data from 2006 show that the capacity is still round 520 l/s.
Figure 7. Satellite image of “Grmić” water source and wider surroundings
3D Geological model of Semberija aquifer
In the general hydrogeological profile of Semberija three unities can be observed:
1) surface roof horizon, low permeability, composed of clays or sandy clays, 5-7 m thick in the southern, southeastern and northern part of Semberija, but 0.5 – 2.5 m thick in the central part.
2) Aquifer, very good permeability, consists of two layers:
- gravel, alluvial origin, 10 -15 m thick in the southern and southwestern part of Semberija, but 30 – 35 m thick in the northern, northeastern and eastern part.
Drina river
Sava river
Water source “Grmi}”

- gravel – sandy sedimentary compleks of Qaternary age, possibly of lacustrine origin. In the western and southern part of the region the thickness ranges from 10 – 40 m, but in the northern and eastern part 60 – 90m.
3) Floor strata made of clayey – sandy sediments of Pliocene age.
Following a detailed analysis of all the available studies and projects the geological model has been finished for the regional Semberija aquifer, shown on Figures 8 and 9. This is a computer generated and not a drawn model.
Figure 8. Semberija aquifer - computer generated geological profile North – South.
Gravel – sandy complex

Figure 9. Semberija aquifer - computer generated geological profile East – West.
The 3D hydrodynamic model of Semberija aquifer
The 3D geological model served as a base of a 3D hydrodynamic model. To make the model complete it is required to do the discretization, to set the boundary conditions, to input the water balance values and measured water table values and to calibrate the model.
Aquifer discretization is shown on Figure 10. The model area measures round 32 x 25 km. Discretization has been done using various field size for the edge 550 x 550 m and for the water source zone round 250 x 250 m. Vertical division is described in the previous section so the model is composed of three unities.
Borders of the regional underground water flow model in Semberija are the following:
- Drina river in the East; border to constant potential and the given gradient.
Alluvial complex
Gravel – sandy complex
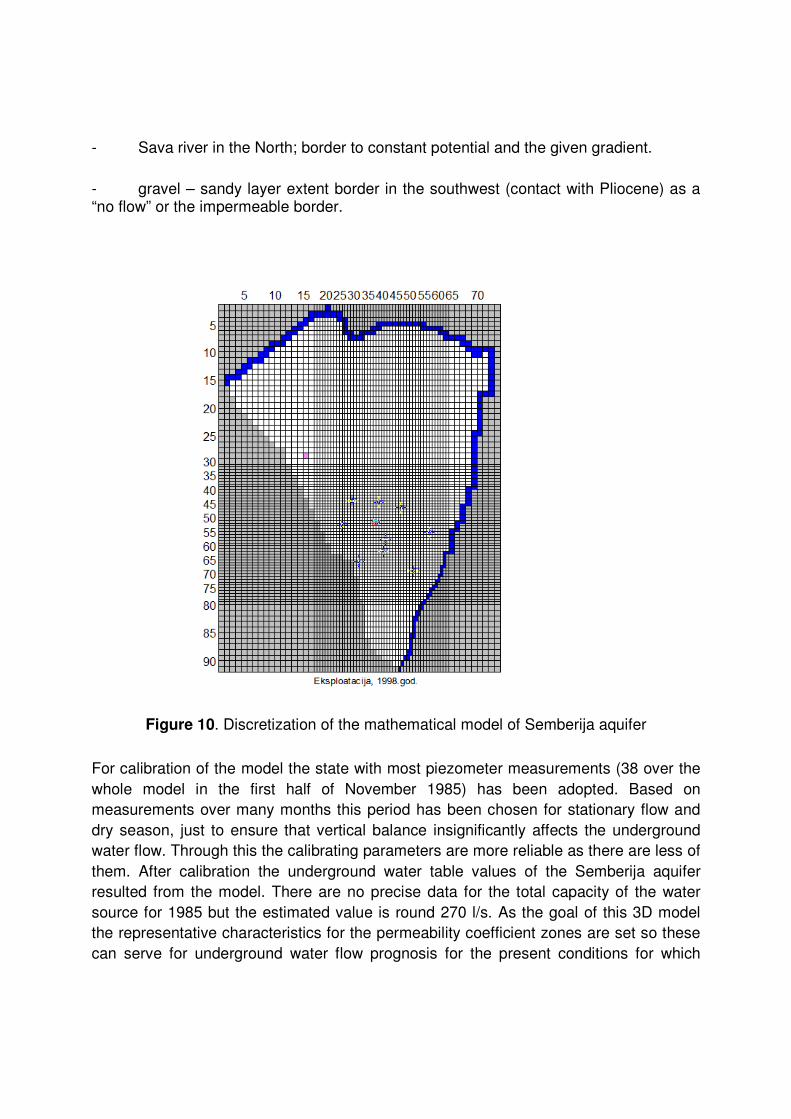
- Sava river in the North; border to constant potential and the given gradient.
- gravel – sandy layer extent border in the southwest (contact with Pliocene) as a “no flow” or the impermeable border.
Figure 10. Discretization of the mathematical model of Semberija aquifer
For calibration of the model the state with most piezometer measurements (38 over the whole model in the first half of November 1985) has been adopted. Based on measurements over many months this period has been chosen for stationary flow and dry season, just to ensure that vertical balance insignificantly affects the underground water flow. Through this the calibrating parameters are more reliable as there are less of them. After calibration the underground water table values of the Semberija aquifer resulted from the model. There are no precise data for the total capacity of the water source for 1985 but the estimated value is round 270 l/s. As the goal of this 3D model the representative characteristics for the permeability coefficient zones are set so these can serve for underground water flow prognosis for the present conditions for which

there are not nearly as much measurements of water table in piezometers as for the earlier periods. Figure 12 shows the distribution of permeability coefficient in the model for the second layer, the Alluvial gravels[6].
Figure 11. Contour lines of the water table level in November 1985.
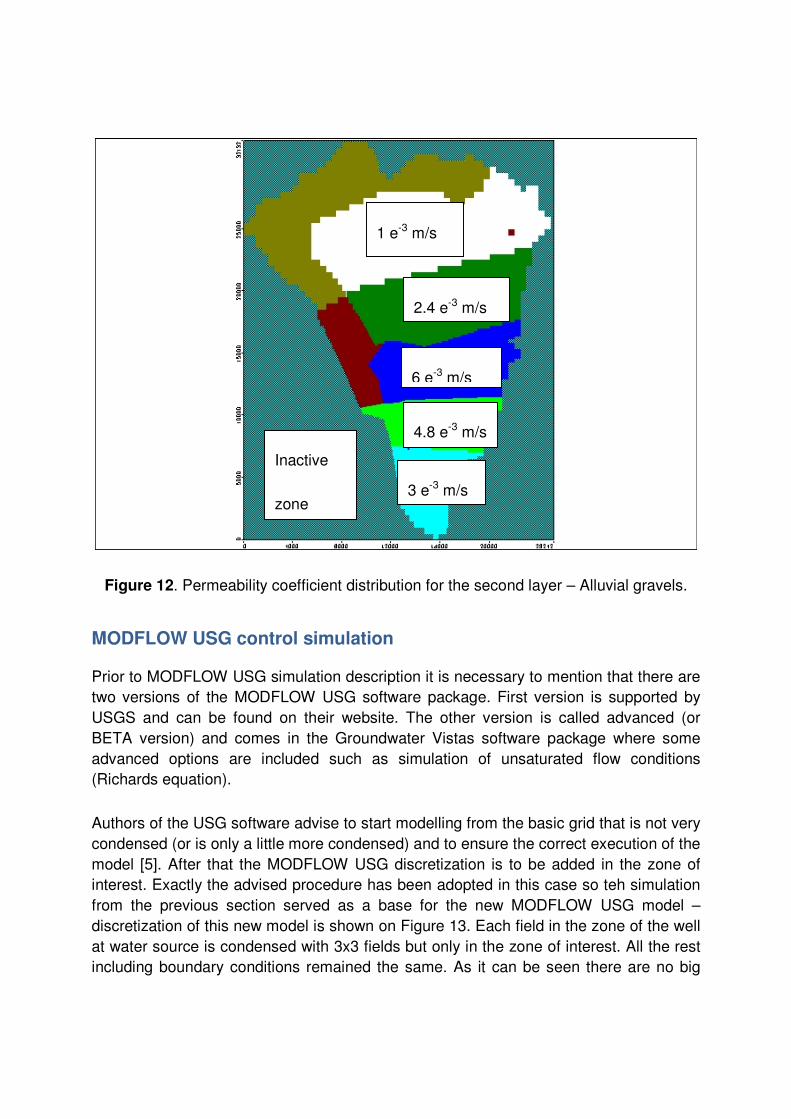
Figure 12. Permeability coefficient distribution for the second layer – Alluvial gravels.
MODFLOW USG control simulation
Prior to MODFLOW USG simulation description it is necessary to mention that there are two versions of the MODFLOW USG software package. First version is supported by USGS and can be found on their website. The other version is called advanced (or BETA version) and comes in the Groundwater Vistas software package where some advanced options are included such as simulation of unsaturated flow conditions (Richards equation).
Authors of the USG software advise to start modelling from the basic grid that is not very condensed (or is only a little more condensed) and to ensure the correct execution of the model [5]. After that the MODFLOW USG discretization is to be added in the zone of interest. Exactly the advised procedure has been adopted in this case so teh simulation from the previous section served as a base for the new MODFLOW USG model – discretization of this new model is shown on Figure 13. Each field in the zone of the well at water source is condensed with 3x3 fields but only in the zone of interest. All the rest including boundary conditions remained the same. As it can be seen there are no big
6 e-3 m/s
4.8 e-3 m/s
2.4 e-3 m/s
1 e-3 m/s
3 e-3 m/s
Inactive
zone
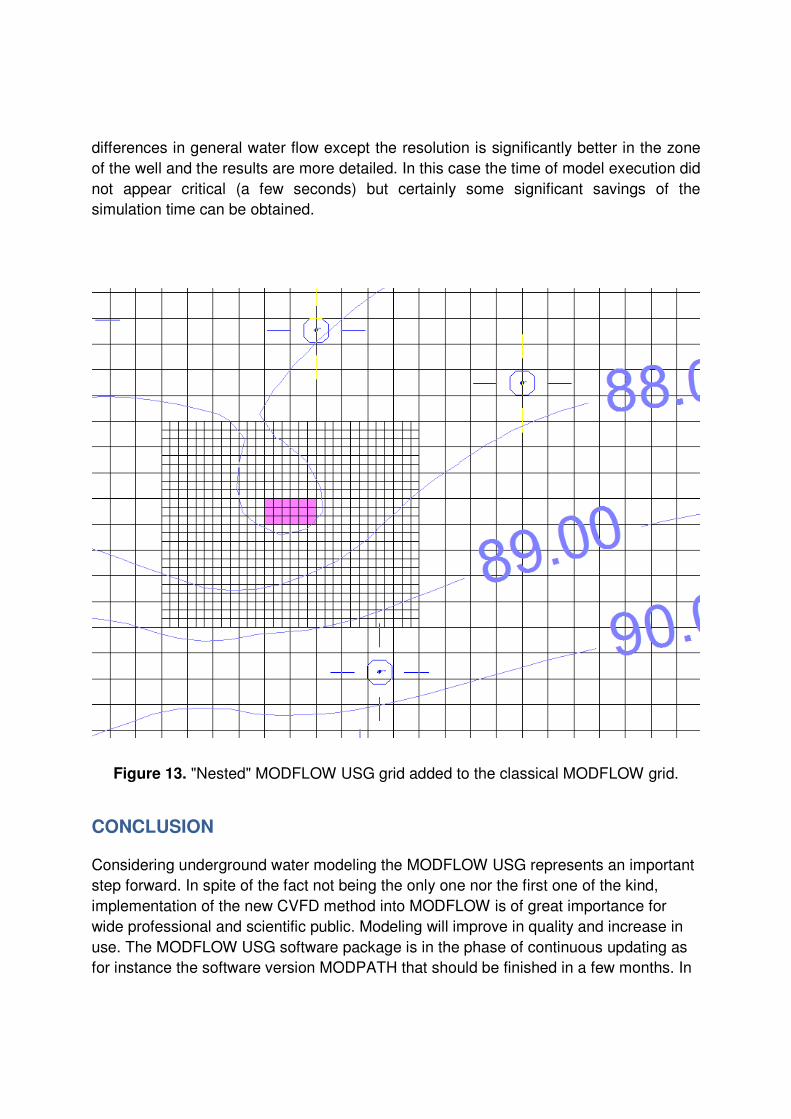
differences in general water flow except the resolution is significantly better in the zone of the well and the results are more detailed. In this case the time of model execution did not appear critical (a few seconds) but certainly some significant savings of the simulation time can be obtained.
Figure 13. "Nested" MODFLOW USG grid added to the classical MODFLOW grid.
CONCLUSION
Considering underground water modeling the MODFLOW USG represents an important step forward. In spite of the fact not being the only one nor the first one of the kind, implementation of the new CVFD method into MODFLOW is of great importance for wide professional and scientific public. Modeling will improve in quality and increase in use. The MODFLOW USG software package is in the phase of continuous updating as for instance the software version MODPATH that should be finished in a few months. In

case of contamination transport simulation the MODFLOW USG is not compatible to MT3DMS but has got its own transport in the advanced version based on the TVD numerical method. In this field a broad application of MODFLOW USG software is anticipated especially bearing in mind the numeric dispersions and bogus oscillations due to big fields in the grid. It is important to mention that the PEST software is compliant with MODFLOW USG software package so all the benefits from using PEST are valid for MODFLOW USG too.
Literature
[1] Prickett, T.A. and C.G. Lonnquist. (1971): Selected Digital Computer Techniques for
Groundwater Resources Evaluation. Illinois State Water Survey Bulletin 55, 62p.
[2] Konikow, L.F., and Bredehoeft, J.D., (1978): Computer model of two-dimensional solute
transport and dispersion in ground water: U.S. Geological Survey Techniques of Water-
Resources Investigations, book 7, chap. C2, 90 p.
[3] Anderson, M. P., and Woessner, W. W., 1992, Applied Groundwater Modeling: Simulation of Flow and Advective Transport: New York, NY, Academic Press, 361 p.
[4] Panday, S., Langevin, C.D., Niswonger, R.G., Ibaraki, M., and Hughes, J.D., (2013): MODFLOW–USG version 1: An unstructured grid version of MODFLOW for simulating groundwater flow and tightly coupled processes using a control volume finite-difference formulation: U.S. Geological Survey Techniques and Methods, book 6, chap. A45, 66 p.
[5] Environmental Simulation, (2013): Groundwater Vistas 6, USA
[6] Kaluđerović,D. (2012): Prilog kalibraciji I oceni parametara matematičkih modela podzemnih voda – poređenje manuelne, automatske i ’pilot point’ metode sa regularizacijom, Vodoprivreda, 258-260, s. 233-240