Embed Size (px)
Citation preview

Modern Systems Analysisand Design
Seventh Edition
Jeffrey A. Hoffer Joey F. George
Joseph S. Valacich
Chapter 7Analysis: Process Modeling
Outline
• Analysis (Milestone 3)– Solutions Document– DFDs– ERD– Structured English– Data Dictionary– Alternatives
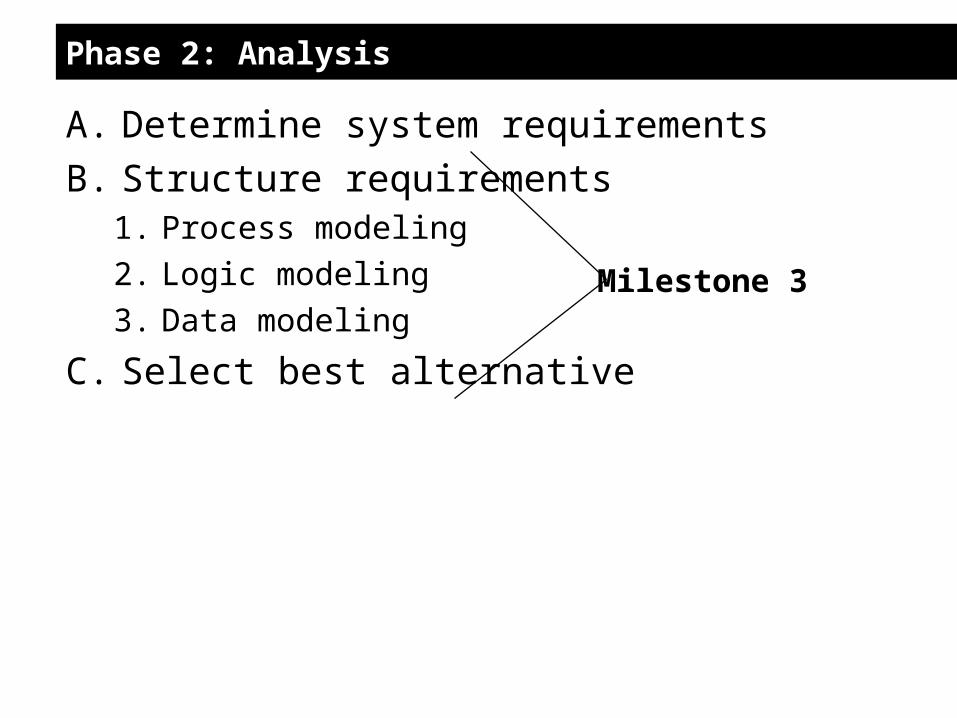
Phase 2: Analysis
A. Determine system requirements
B. Structure requirements1. Process modeling
2. Logic modeling
3. Data modeling
C. Select best alternative
Milestone 3
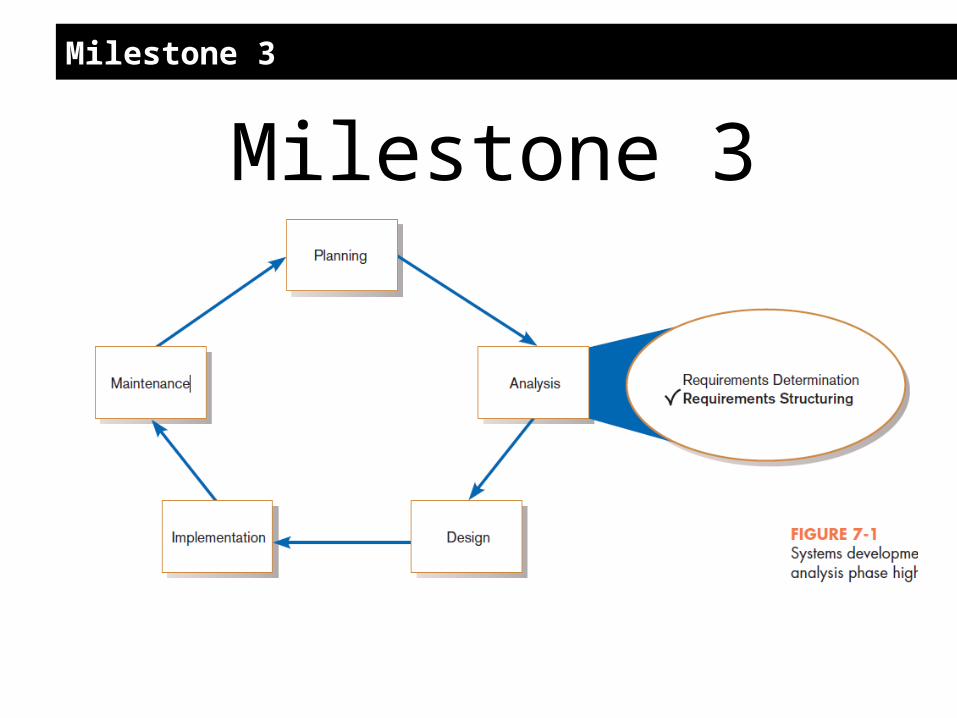
Milestone 3
Milestone 3

Solutions Document
• List the problems identified in Milestone 2.• For each problem, identify how they will be solved
with the new system design.

Phase 2B: Structure Requirements
• Create conceptual design that fulfills user requirements
• Use models to represent conceptual design• Facts gathered and analyzed during analysis provide
the basis
• Two broad techniques for modeling (design):– Object-oriented design– Structured design

Features of Structured Design
• Modularization• Top-down decomposition• Process driven• Modeling tools• Iteration• Parallel activities• Development automation
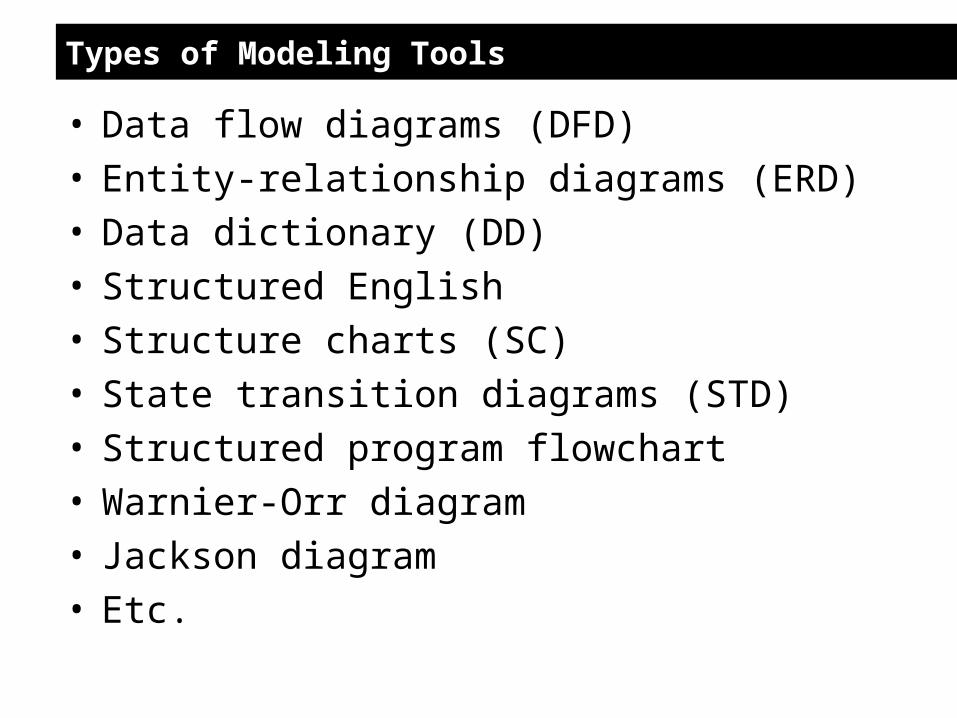
Types of Modeling Tools
• Data flow diagrams (DFD)• Entity-relationship diagrams (ERD)• Data dictionary (DD)• Structured English• Structure charts (SC)• State transition diagrams (STD)• Structured program flowchart• Warnier-Orr diagram• Jackson diagram• Etc.

Models: Logical and Physical
• Model – A representation of reality.
– Just as a picture is worth a thousand words, most models are pictorial representations of reality.
• Logical Models – Show what a system is or does.
– They are implementation independent; that is, they depict the system independent of any technical implementation.
• Physical Models – Show not only what a system is or does, but also how the
system is (to be) physically and technically implemented.
– They are implementation dependent because they reflect technology choices.
Process Modeling
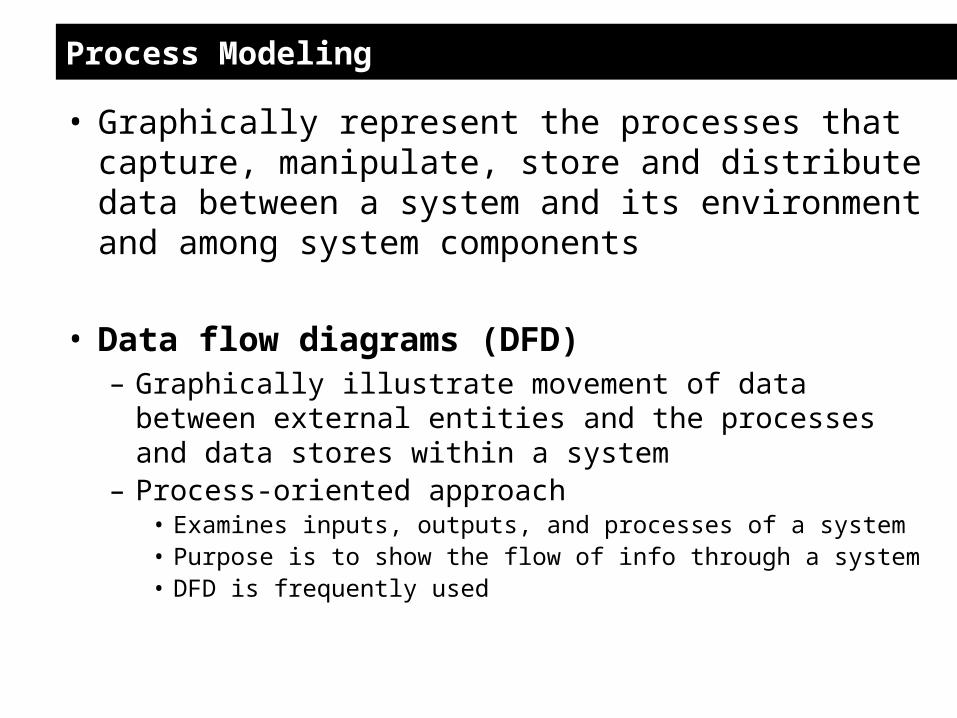
• Graphically represent the processes that capture, manipulate, store and distribute data between a system and its environment and among system components
• Data flow diagrams (DFD)– Graphically illustrate movement of data between external
entities and the processes and data stores within a system– Process-oriented approach
• Examines inputs, outputs, and processes of a system• Purpose is to show the flow of info through a system• DFD is frequently used
Data Flow Diagrams
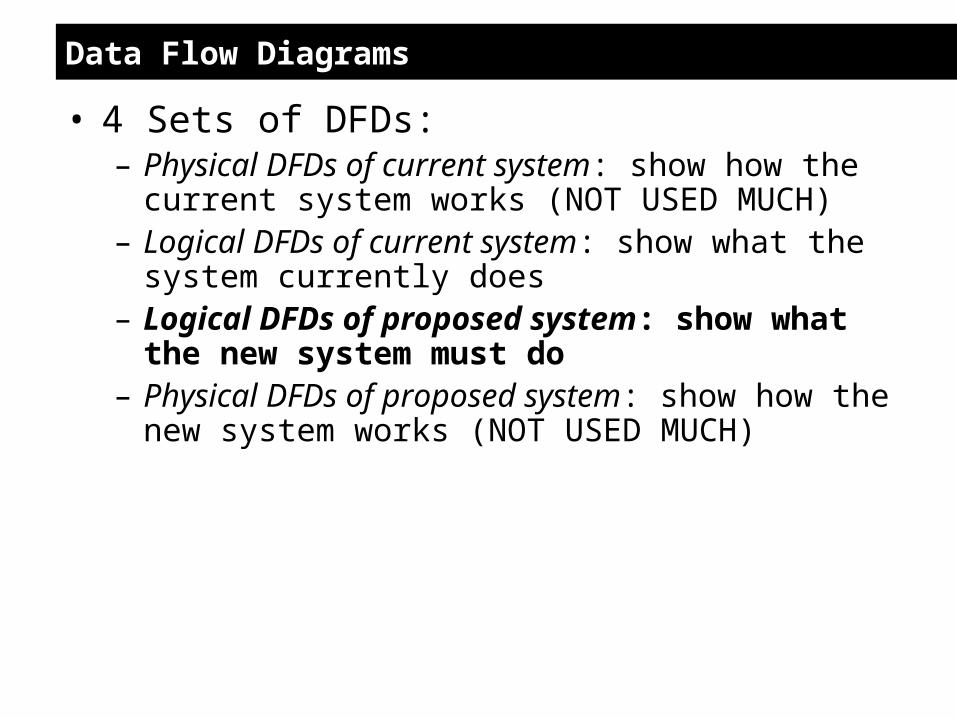
• 4 Sets of DFDs:– Physical DFDs of current system: show how the
current system works (NOT USED MUCH)– Logical DFDs of current system: show what the system
currently does– Logical DFDs of proposed system: show what the
new system must do– Physical DFDs of proposed system: show how the new
system works (NOT USED MUCH)

DFD Symbols
FIGURE 7-2Comparison of DeMarco and
Yourdonand Gane and Sarson
DFD symbol sets
Symbols on a DFD
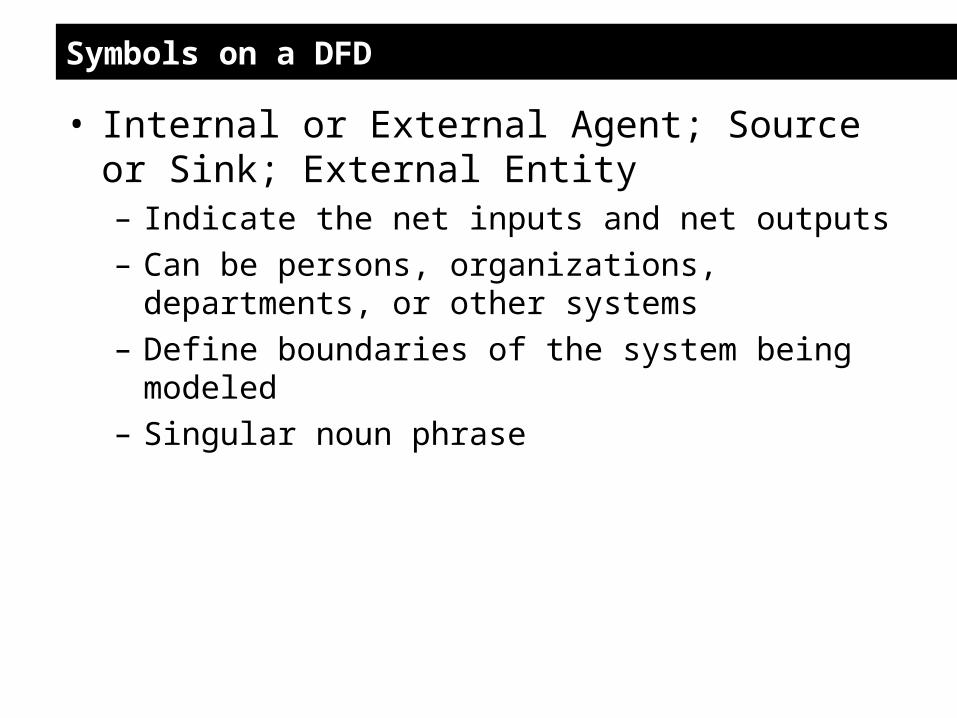
• Internal or External Agent; Source or Sink; External Entity– Indicate the net inputs and net outputs
– Can be persons, organizations, departments, or other systems
– Define boundaries of the system being modeled
– Singular noun phrase
Symbols on a DFD
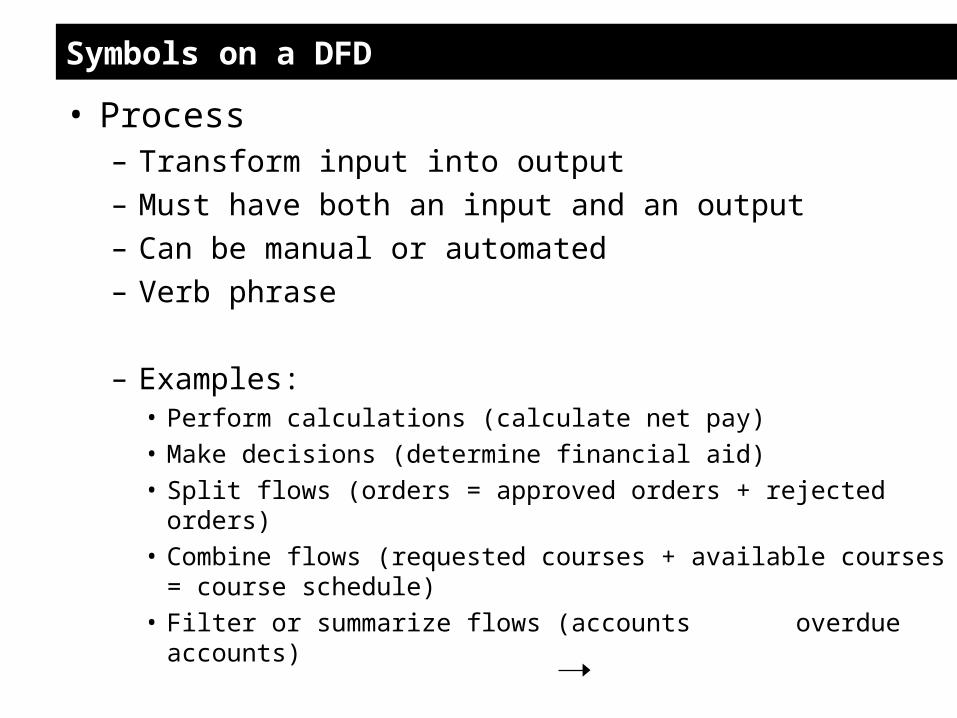
• Process– Transform input into output
– Must have both an input and an output
– Can be manual or automated
– Verb phrase
– Examples:• Perform calculations (calculate net pay)
• Make decisions (determine financial aid)
• Split flows (orders = approved orders + rejected orders)
• Combine flows (requested courses + available courses = course schedule)
• Filter or summarize flows (accounts overdue accounts)

Symbols on a DFD
• Data Store– A file of any kind (paper, magnetic, optical, etc.)– Only processes can connect to data stores– Only processes can use or update data in data stores– Plural noun phrase
• Data Flow– Represents the transfer of data among data stores,
sources/sinks, and processes– Either initiates a process or is the result from a process– Singular noun phrase

Data Flow Diagramming Rules
• Basic rules that apply to all DFDs– Inputs to a process are always different than outputs
– Objects always have a unique name
– In order to keep the diagram uncluttered, you can repeat data stores and sources/sinks on a diagram

Data Flow Diagramming Rules
• Process– No process can have only
outputs (a miracle)
– No process can have only inputs (black hole)
– A process has a verb phrase label
• Source/Sink– Data cannot move directly
from a source to a sink
– A source/sink has a noun phrase label
• Data Store– Data cannot be moved directly
from one store to another
– Data cannot move directly from an outside source to a data store
– Data cannot move directly from a data store to a data sink
– Data store has a noun phrase label

Data Flow Diagramming Rules
• Data Flow– A data flow has only one direction of flow between symbols
– A fork means that exactly the same data goes from a common location to two or more processes, data stores or sources/sinks
– A join means that exactly the same data comes from any two or more different processes, data stores or sources/sinks to a common location
– A data flow cannot go directly back to the same process it leaves
– A data flow to a data store means update
– A data flow from a data store means retrieve or use
– A data flow has a noun phrase label
Advanced Rules for DFDs
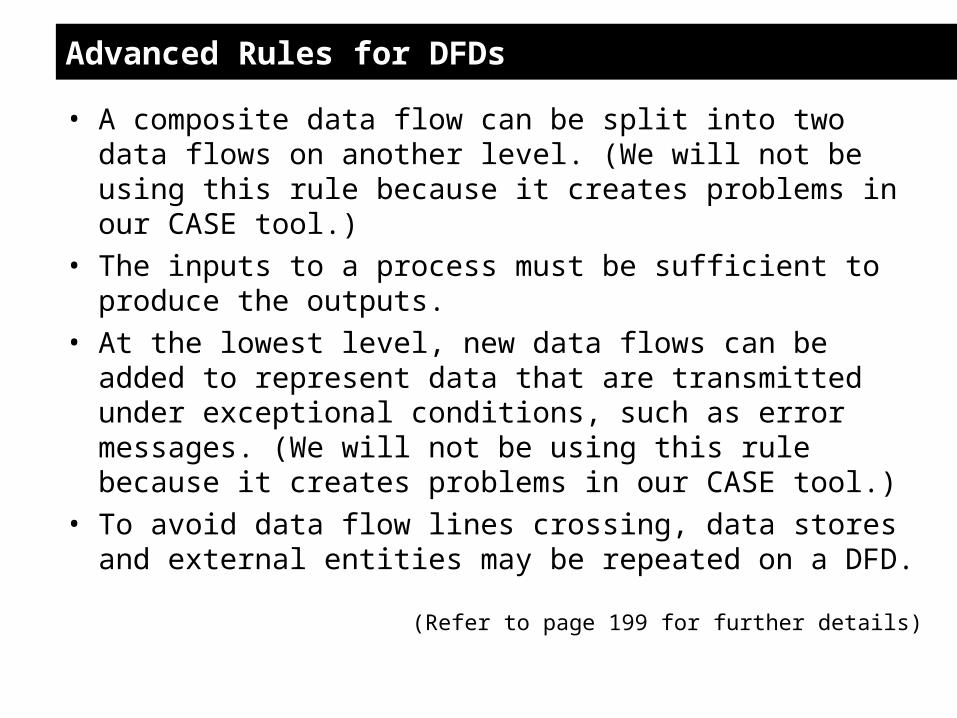
• A composite data flow can be split into two data flows on another level. (We will not be using this rule because it creates problems in our CASE tool.)
• The inputs to a process must be sufficient to produce the outputs.
• At the lowest level, new data flows can be added to represent data that are transmitted under exceptional conditions, such as error messages. (We will not be using this rule because it creates problems in our CASE tool.)
• To avoid data flow lines crossing, data stores and external entities may be repeated on a DFD.
(Refer to page 199 for further details)
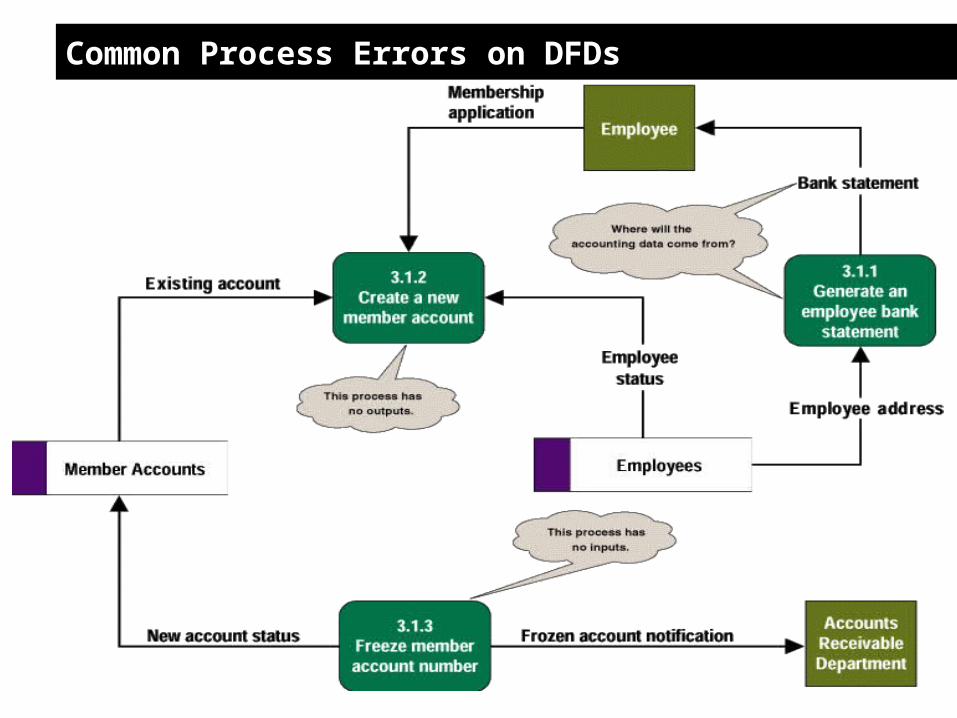
Common Process Errors on DFDs

Decomposition of DFDs
• Context Diagram (Level 0)– A data flow diagram (DFD) of the scope of an
organizational system that shows the system boundaries, external entities that interact with the system and the major information flows between the entities and the system
• Functional decomposition– Act of going from one single system to many component
processes
– Repetitive procedure
– Lowest level is called a primitive DFD
• Level-N Diagrams– A DFD that is the result of n nested decompositions of a
series of subprocesses from the process on a level-0 diagram

Steps in Preparing DFDs
1. Draw a context level diagram• Defines the scope and boundary for the system
• Contains only one process
• Use composite data flows
Steps in Preparing DFDs
2. Draw a decomposition diagram to outline DFDs• The context DFD is exploded into its own DFD that reveals the
underlying subsystem, which are shown as subprocesses. Each of these subprocesses may, in turn, be exploded into its own DFD to show more detailed processes.
• A decomposition diagram, also called a hierarchy chart, shows the top-down functional decomposition or structure of the system. It provides an outline for drawing DFDs.
• Numbering• Context – 0• Level 1 – 1, 2, 3• Level 2 – 1.1, 1.2, 2.1, 2.2, etc.• Level 3 – 1.1.1, 1.1.2, etc.• Primitive – 1.1P
• Factor each DFD into 2 to 7 processes• 2: must explode into at least 2 processes• 7: do not include more than 7 for readability
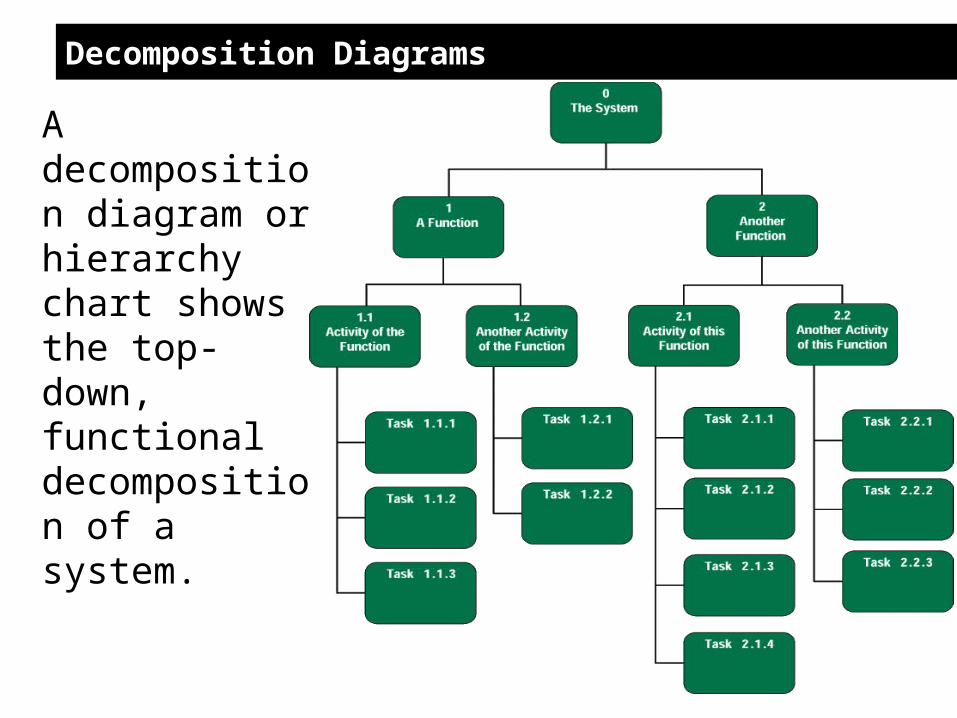
Decomposition Diagrams
A decomposition diagram or hierarchy chart shows the top-down, functional decomposition of a system.

Steps in Preparing DFDs
3. Identify data stores• Can also do decomposition here, but not necessary
4. Draw a Level 1 DFD• Exploding should add detail while retaining the essence of the details
from the more general diagram
• Sometimes external entities are not shown on the exploded diagram, only an arrow coming from or going to a source is shown. THIS IS CONFUSING! Always show the entities.
• Balancing: the task of ensuring that no details are lost when a process on one DFD is exploded to a more detailed DFD. Balancing ensures consistency between different levels.
• Note: more data flows can be added at an exploded level between processes.
5. Draw a Level 2 DFD
6. Draw Primitive Level DFDs• The lowest level of decomposition of a DFD

An unbalanced set of data flow diagrams(a) Context diagram and (b) Level-1 diagram

Guidelines for Drawing DFDs
• Completeness– DFD must include all components necessary for system
• Consistency– The extent to which information contained on one level of a
set of nested DFDs is also included on other levels
• Timing– Time is not represented well on DFDs
– Best to draw DFDs as if the system has never started and will never stop
• Iterative Development– Analyst should expect to redraw diagram several times
before reaching the closest approximation to the system being modeled
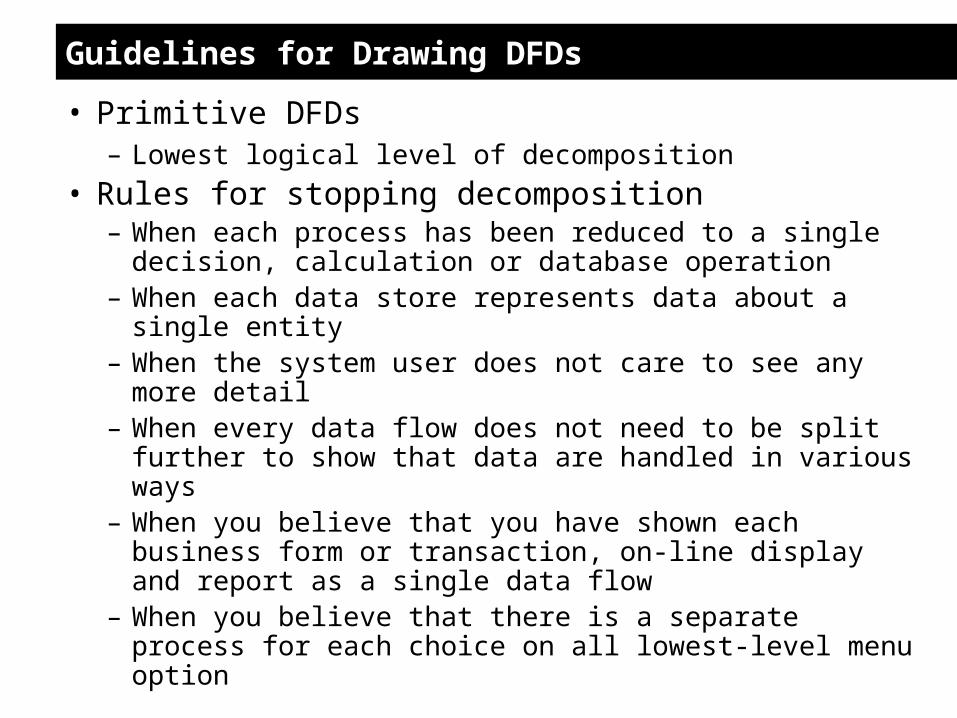
Guidelines for Drawing DFDs
• Primitive DFDs– Lowest logical level of decomposition
• Rules for stopping decomposition– When each process has been reduced to a single decision,
calculation or database operation– When each data store represents data about a single entity– When the system user does not care to see any more detail– When every data flow does not need to be split further to
show that data are handled in various ways– When you believe that you have shown each business form
or transaction, on-line display and report as a single data flow
– When you believe that there is a separate process for each choice on all lowest-level menu option

Context (Level 0) DFD Examples
• The purpose of the TEXTBOOK INVENTORY SYSTEM at a campus bookstore is to supply textbooks to students for classes at a local university. The university’s academic departments submit initial data about courses, instructors, textbooks, and projected enrollments to the bookstore on a TEXTBOOK MASTER LIST. The bookstore generates a PURCHASE ORDER, which is sent to the publishing companies supplying textbooks. Book orders arrive at the bookstore accompanied by a PACKING SLIP, which is checked and verified by the receiving department. Students fill out a BOOK REQUEST that includes course information. When they pay for their books, the students are given a SALES RECEIPT.
• The purpose of the PLANT SCIENCE INFORMATION SYSTEM is to document the study results from a wide variety of experiments performed on selected plants. A study is initiated by a researcher who submits a RESEARCH PROPOSAL. After a panel review by a group of scientists, the researcher is required to submit a RESEARCH PLAN AND SCHEDULE. An FDA RESEARCH PERMIT REQUEST is sent to the Food and Drug Administration, which sends back a RESEARCH PERMIT. As the experiment progresses, the researcher fills out and submits EXPERIMENT NOTES. At the conclusion of the project, the researcher must provide results on an EXPERIMENT HISTOGRAM.
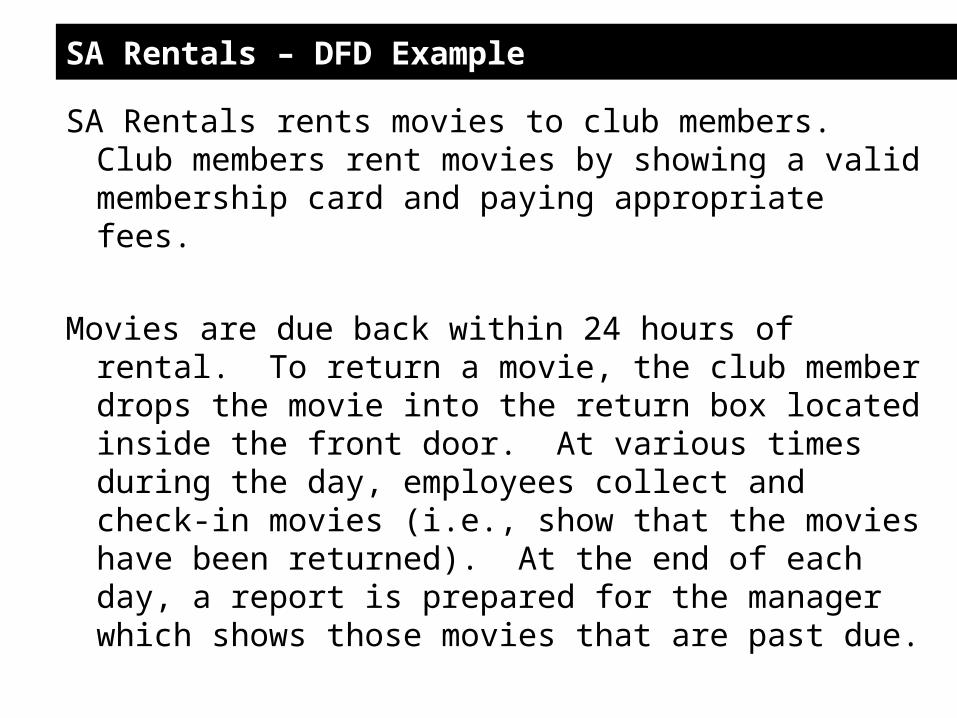
SA Rentals – DFD Example
SA Rentals rents movies to club members. Club members rent movies by showing a valid membership card and paying appropriate fees.
Movies are due back within 24 hours of rental. To return a movie, the club member drops the movie into the return box located inside the front door. At various times during the day, employees collect and check-in movies (i.e., show that the movies have been returned). At the end of each day, a report is prepared for the manager which shows those movies that are past due.
Modern Systems Analysisand Design
Seventh Edition
Jeffrey A. Hoffer Joey F. George
Joseph S. Valacich
Chapters 8 and 9Analysis: Data Modeling

Data Modeling
Data modeling •A technique for organizing and documenting a system’s data •Sometimes called database modeling because a data model is eventually implemented as a database•The actual model is frequently called an entity relationship diagram (ERD) because it depicts data in terms of the entities and relationships described by the data.
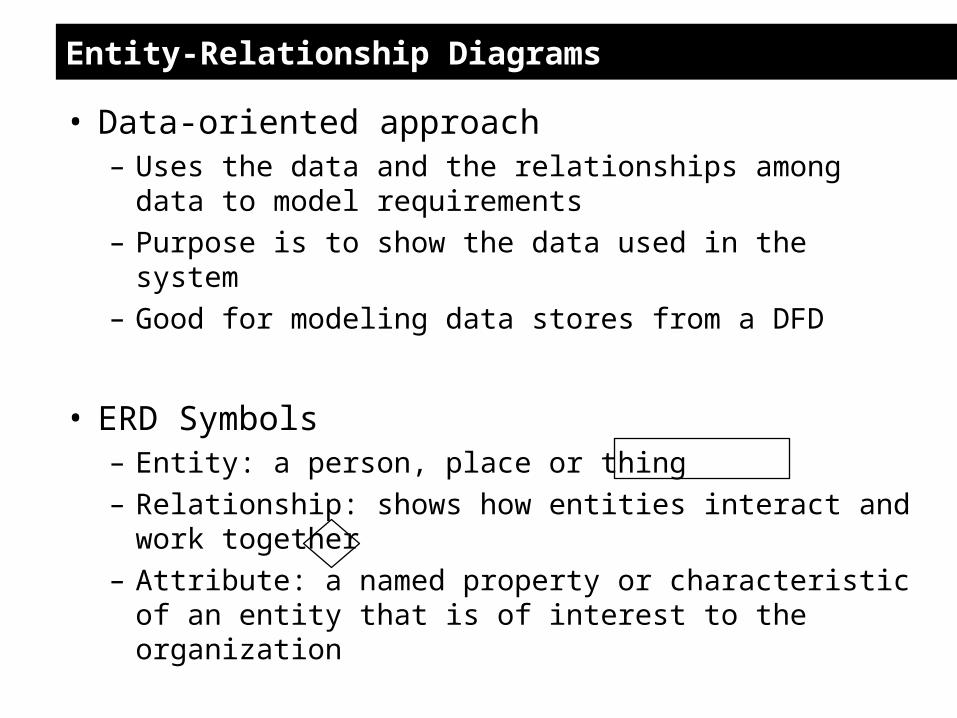
Entity-Relationship Diagrams
• Data-oriented approach– Uses the data and the relationships among data to
model requirements– Purpose is to show the data used in the system– Good for modeling data stores from a DFD
• ERD Symbols– Entity: a person, place or thing– Relationship: shows how entities interact and work
together– Attribute: a named property or characteristic of an
entity that is of interest to the organization
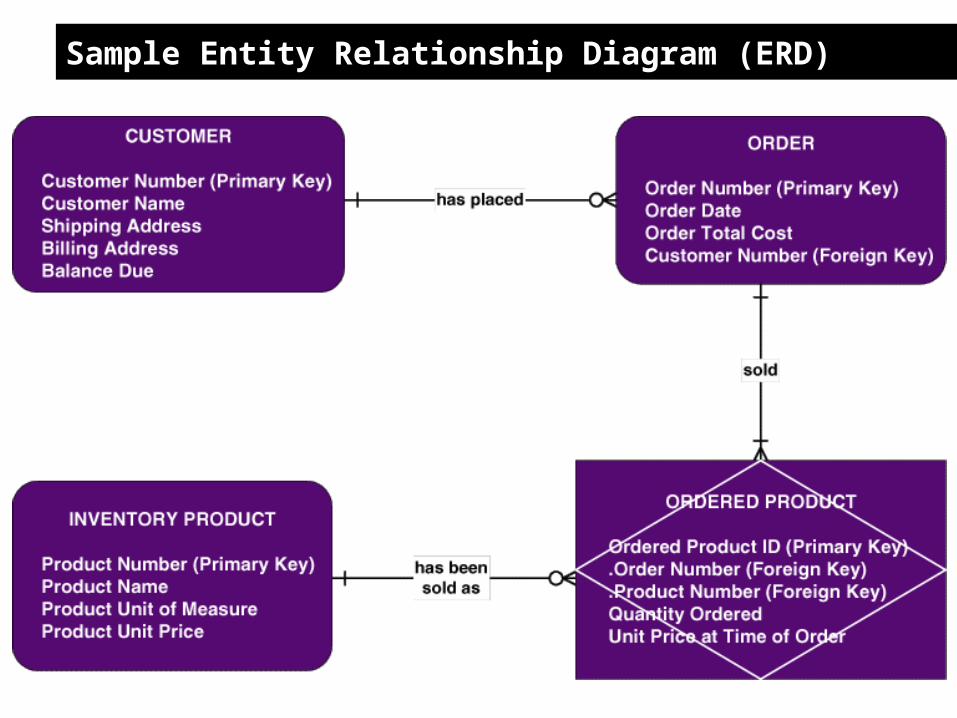
Sample Entity Relationship Diagram (ERD)
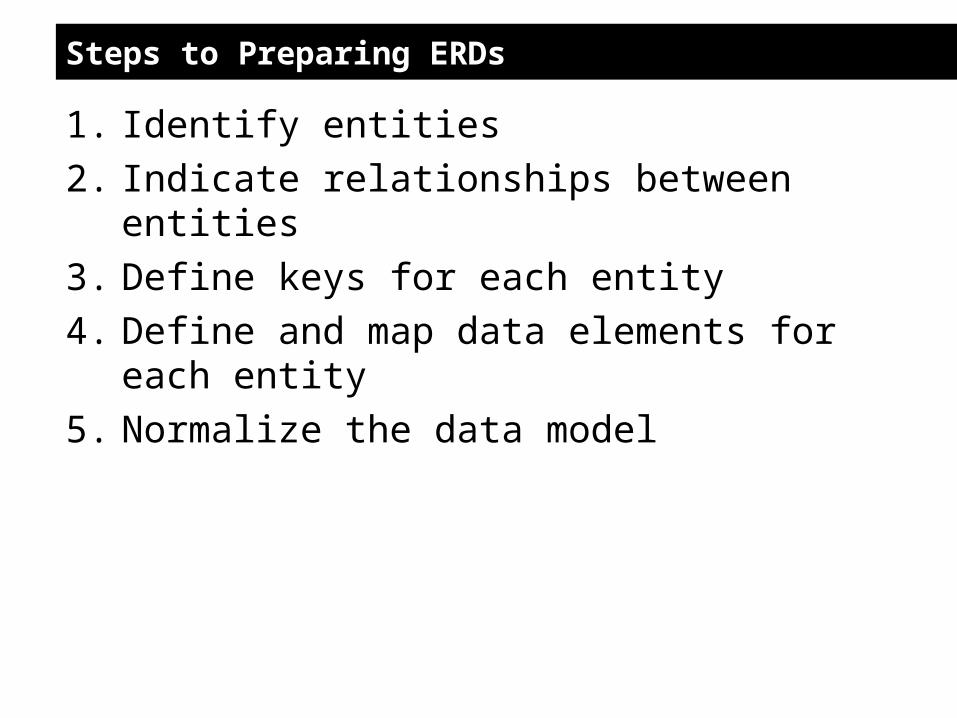
Steps to Preparing ERDs
1. Identify entities
2. Indicate relationships between entities
3. Define keys for each entity
4. Define and map data elements for each entity
5. Normalize the data model
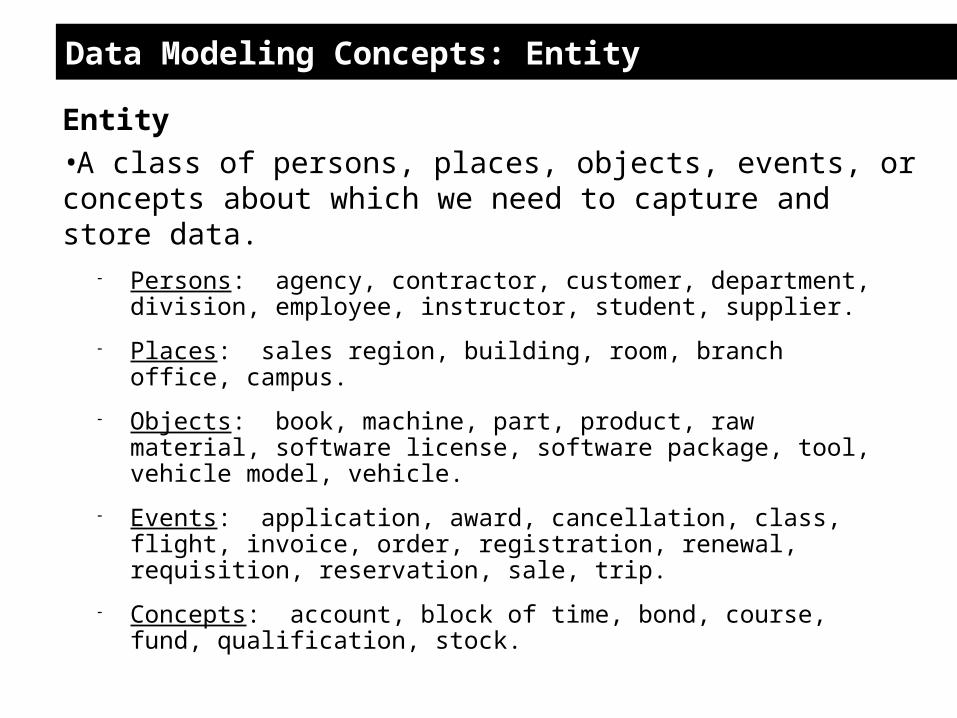
Persons: agency, contractor, customer, department, division, employee, instructor, student, supplier.
Places: sales region, building, room, branch office, campus.
Objects: book, machine, part, product, raw material, software license, software package, tool, vehicle model, vehicle.
Events: application, award, cancellation, class, flight, invoice, order, registration, renewal, requisition, reservation, sale, trip.
Concepts: account, block of time, bond, course, fund, qualification, stock.
Data Modeling Concepts: Entity
Entity •A class of persons, places, objects, events, or concepts about which we need to capture and store data.
Betty Arnold
John Taylor
Lisa Simmons
Bill Macy
Heather Leath
Tim Wrench
Data Modeling Concepts: Entity
Entity Instance • A single occurrence of an entity.
Example: instances of the entity STUDENT may include:

Data Modeling Concepts: Attributes
Attribute
•A descriptive property or characteristic of an entity. Synonyms include element, property, and field.
Compound Attribute
•One that actually consists of other attributes
Data Types and Domains
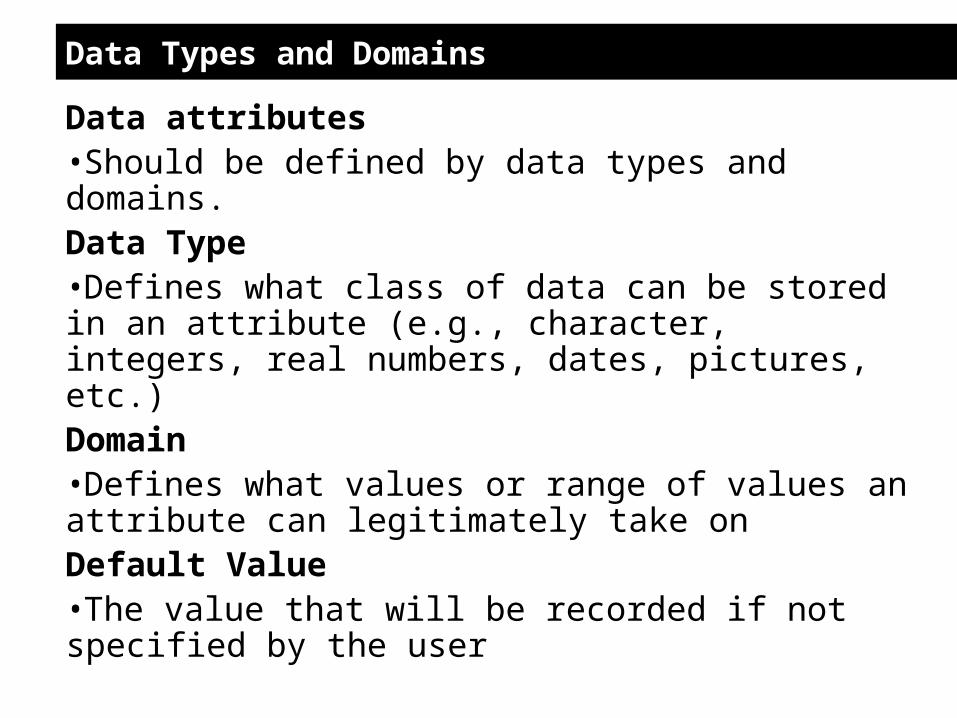
Data attributes •Should be defined by data types and domains.Data Type •Defines what class of data can be stored in an attribute (e.g., character, integers, real numbers, dates, pictures, etc.)Domain •Defines what values or range of values an attribute can legitimately take onDefault Value •The value that will be recorded if not specified by the user
Data Modeling Concepts: Identification
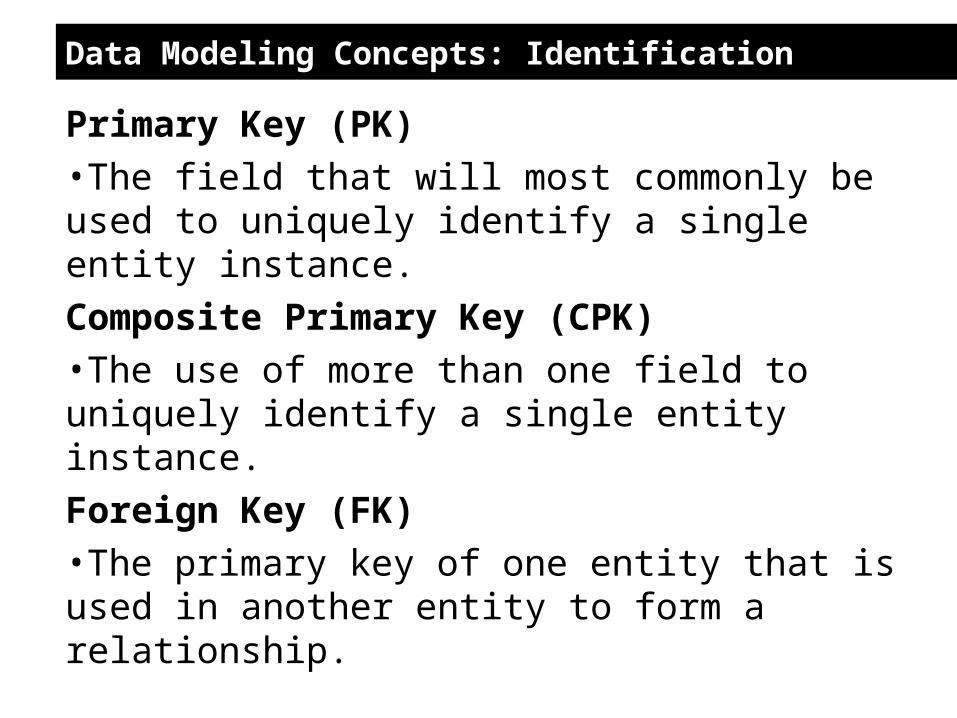
Primary Key (PK) •The field that will most commonly be used to uniquely identify a single entity instance.
Composite Primary Key (CPK)•The use of more than one field to uniquely identify a single entity instance.
Foreign Key (FK)•The primary key of one entity that is used in another entity to form a relationship.
Relationship
– An association between the instances of one or more entity types that is of interest to the organization
– Association indicates that an event has occurred or that there is a natural link between entity types
– Relationships are always labeled with verb phrases
Degree of Relationship
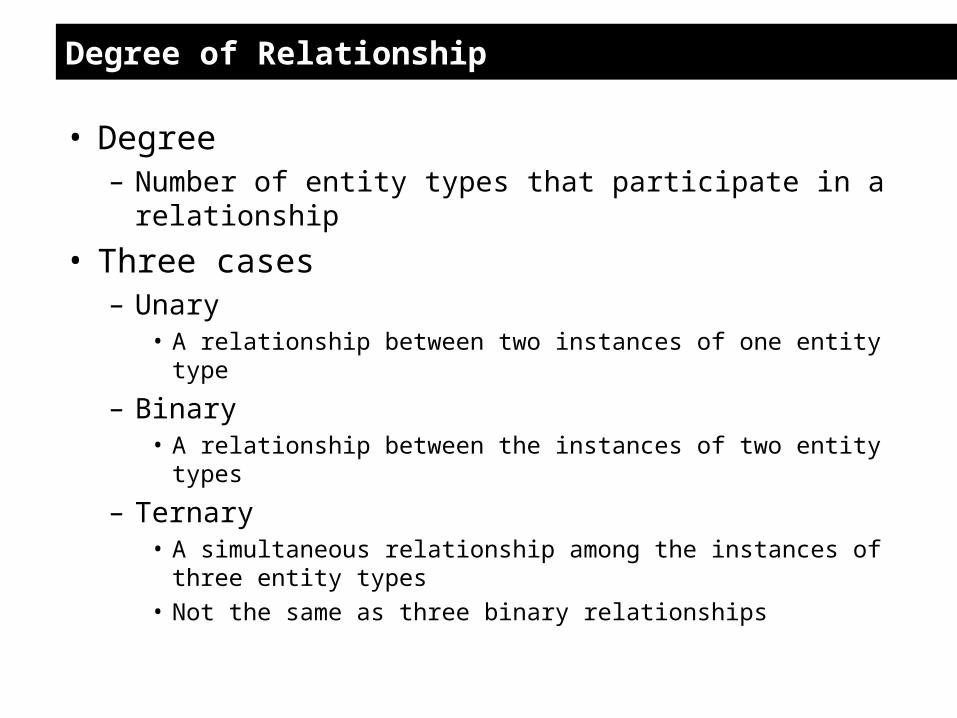
• Degree– Number of entity types that participate in a relationship
• Three cases– Unary
• A relationship between two instances of one entity type
– Binary• A relationship between the instances of two entity types
– Ternary• A simultaneous relationship among the instances of three entity
types
• Not the same as three binary relationships
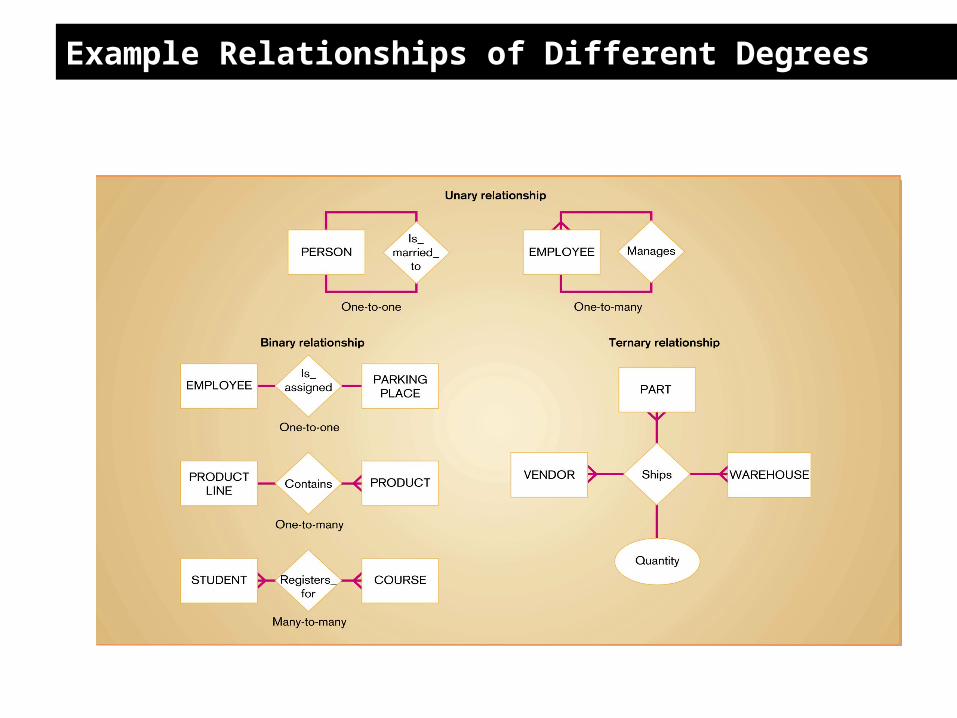
Example Relationships of Different Degrees
Cardinality
• The number of instances of entity B that can be associated with each instance of entity A
• Minimum Cardinality– The minimum number of instances of entity B that may
be associated with each instance of entity A
• Maximum Cardinality– The maximum number of instances of entity B that may
be associated with each instance of entity A

Associative Entity
• An entity type that associates the instances of one or more entity types and contains attributes that are peculiar to the relationship between those entity instances
• Results from the elimination of a many-to-many relationship

Data Analysis & Normalization
Data analysis •Process that prepares a data model for implementation as a simple, nonredundant, flexible, and adaptable database. •The specific technique is called normalization.
Normalization •Data analysis technique that organizes data attributes such that they are grouped to form nonredundant, stable, flexible, and adaptive entities.
Normalization: 1NF, 2NF, 3NF
• First Normal Form (1NF) – No attributes can have more than one value for a single instance of the entity. – Any attributes that can have multiple values actually describe a separate entity,
possibly an entity and relationship.
• Second Normal Form (2NF) – Already in 1NF – Values of all nonprimary key attributes are dependent on the full primary key,
not just part of it. – Any nonkey attributes that are dependent on only part of the primary key should
be moved to any entity where that partial key is actually the full key. This may require creating a new entity and relationship on the model.
• Third Normal Form (3NF) – Already in 2NF – Values of nonprimary key attributes are not dependent on any other non-primary
key attributes. – Any nonkey attributes that are dependent on other nonkey attributes must be
moved or deleted. Again, new entities and relationships may have to be added to the data model.
ERD Example
• Department has many instructors• Instructors have one department• College has many departments• Departments have one college• Students have many instructors but only one
department
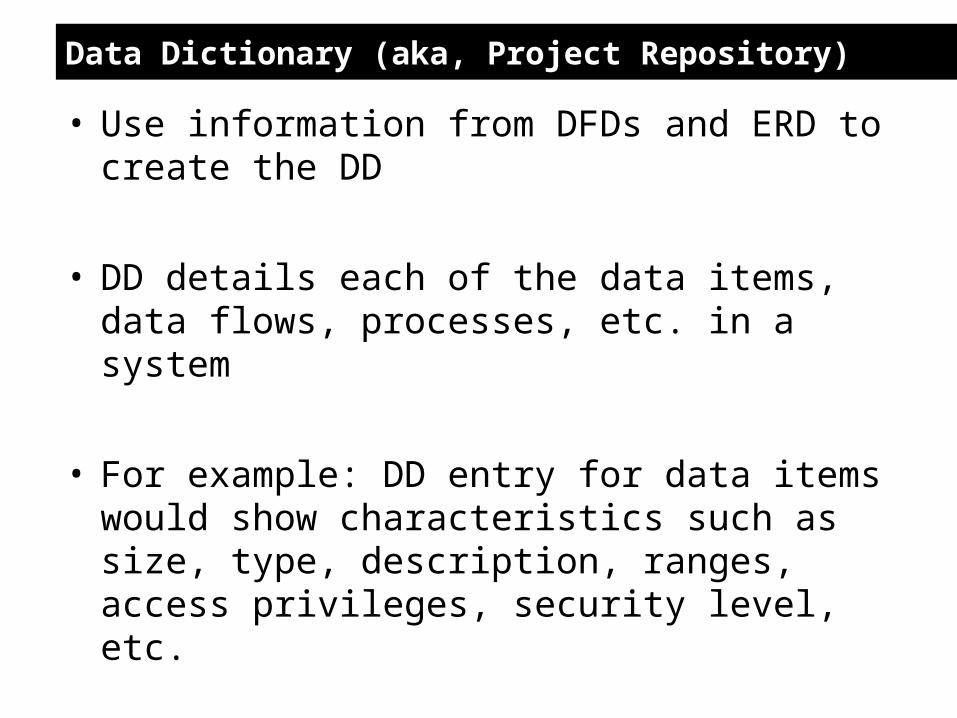
Data Dictionary (aka, Project Repository)
• Use information from DFDs and ERD to create the DD
• DD details each of the data items, data flows, processes, etc. in a system
• For example: DD entry for data items would show characteristics such as size, type, description, ranges, access privileges, security level, etc.
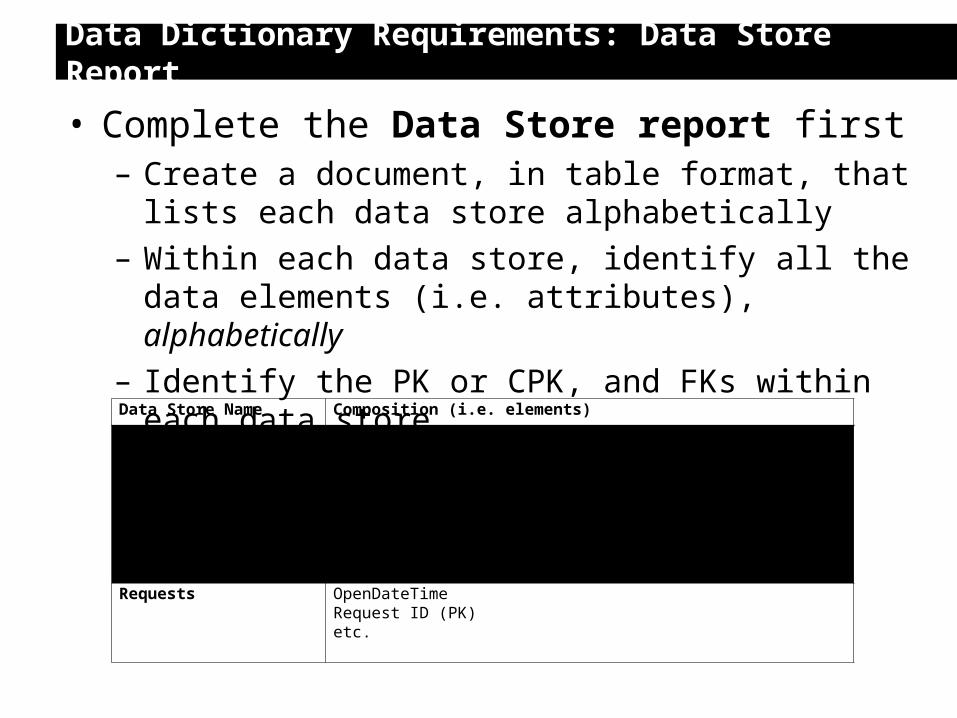
Data Dictionary Requirements: Data Store Report
• Complete the Data Store report first– Create a document, in table format, that lists each data store
alphabetically
– Within each data store, identify all the data elements (i.e. attributes), alphabetically
– Identify the PK or CPK, and FKs within each data store
Data Store Name Composition (i.e. elements)
Customers Customer_FnameCustomer ID (PK)Customer_LnameCustomer_MnameRequest ID (FK)etc.
Requests OpenDateTimeRequest ID (PK)etc.

Data Dictionary Requirements: Data Element REport
• Next, create a Data Element report– Create a document, in table format, that lists each data
element that has been stored in the data stores, alphabetically by data element name
– Also provide a one sentence description of each, along with the data type and size, etc.
Data Element Name Description Type Length
Customer_Fname The first name of an individual customer Text 25
Customer ID The unique identifier for each customer Number 7
etc.
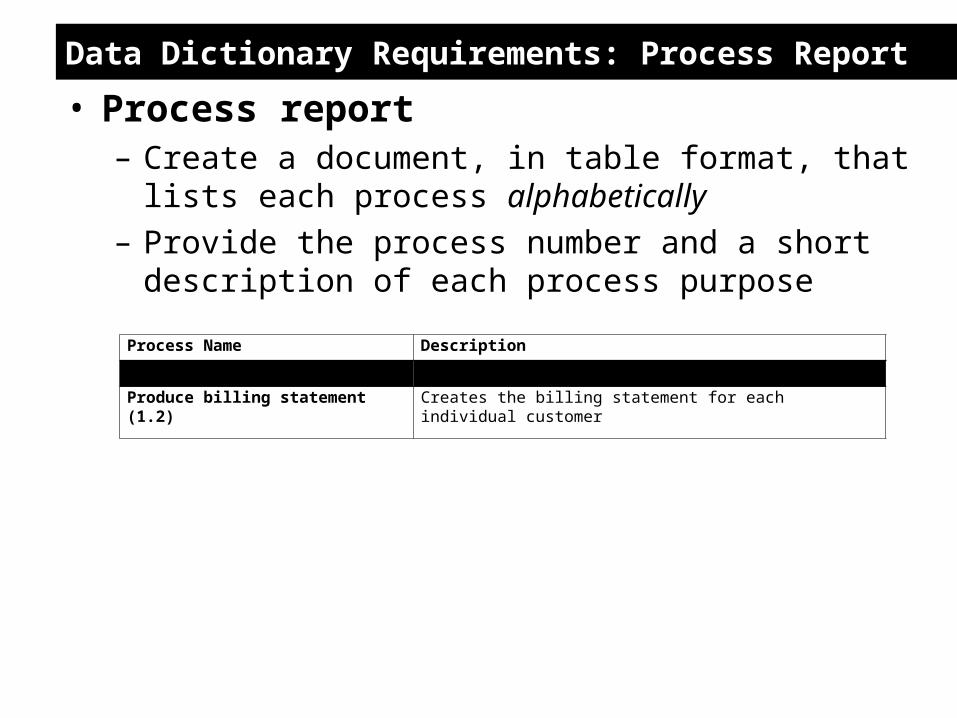
Data Dictionary Requirements: Process Report
• Process report– Create a document, in table format, that lists each process
alphabetically
– Provide the process number and a short description of each process purpose
Process Name Description
Create request (1.1.3) Creates service request
Produce billing statement (1.2) Creates the billing statement for each individual customer
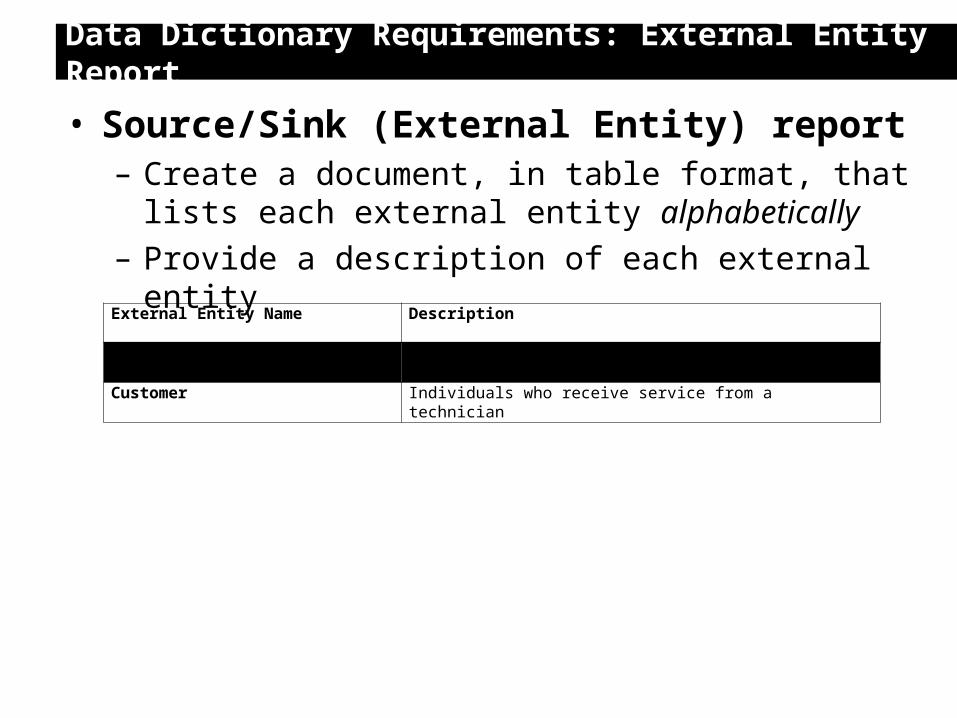
Data Dictionary Requirements: External Entity Report
• Source/Sink (External Entity) report– Create a document, in table format, that lists each
external entity alphabetically– Provide a description of each external entity
External Entity Name Description
Consultant Technicians that work on a service request
Customer Individuals who receive service from a technician

Data Dictionary Requirement: Data Flow Report
• Data Flow report– Create a document, in table format, that lists each data
flow alphabetically– Indicate where the data flow is coming from and where
it is going to for the primitive diagramsData Flow Name Source Destination
Billing statement Process 1.2 (Produce Billing Statement) Sink (Customer)
Requested Service Source (Customer) Process 1.1.3 (Create Request)

Modern Systems Analysisand Design
Seventh Edition
Jeffrey A. Hoffer Joey F. George
Joseph S. Valacich
Chapter 7Analysis: Logic Modeling
and Select Best Alternative

Computer-aided Software Engineering (CASE)
• Automated software tool used by systems analysts to develop information systems
• Used to support or automate activities throughout the systems development life cycle (SDLC)
• Objectives of CASE:– Improve quality of systems developed
– Increase speed of development and design
– Improve testing process through automated checking
– Improve integration of development activities via common methodologies
– Improve quality and completeness of documentation
– Help standardize the development process
– Improve project management
– Simplify program maintenance
– Promote reusability
– Improve software portability

Components of CASE
• Upper CASE– CASE tools designed to support the information planning and the
project identification and selection, project initiation and planning, analysis and design phases of the systems development life cycle
• Lower CASE– CASE tools designed to support the implementation and maintenance
phases of the systems development life cycle• Cross life-cycle CASE
– CASE tools designed to support activities that occur across multiple phases of the systems development life cycle
• Most CASE tools utilize a repository to store all diagrams, forms, models and report definitions
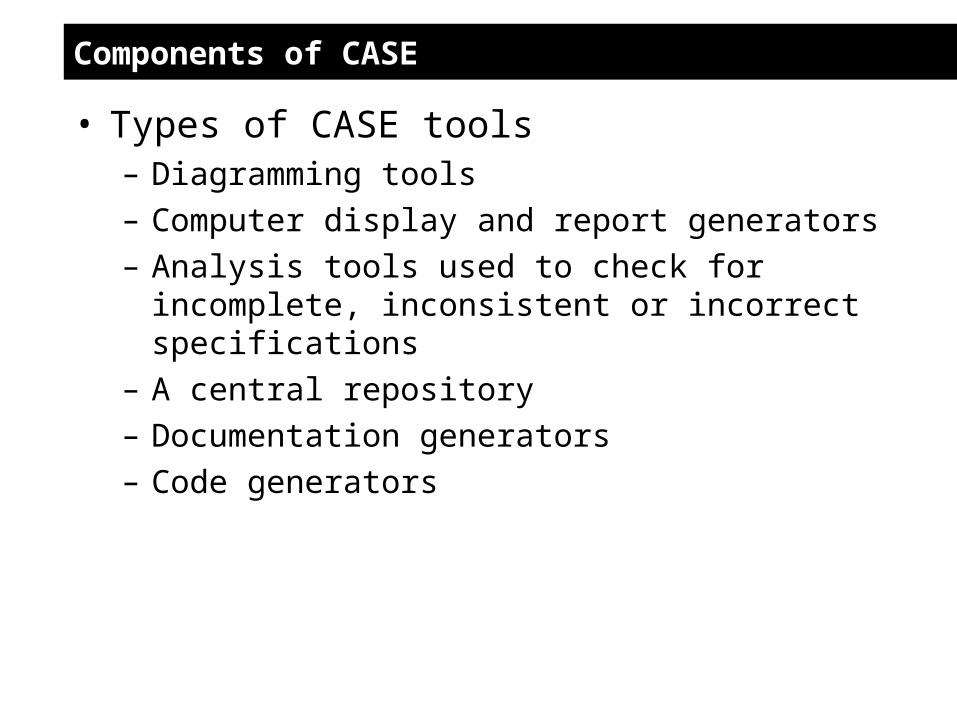
Components of CASE
• Types of CASE tools– Diagramming tools– Computer display and report generators– Analysis tools used to check for incomplete,
inconsistent or incorrect specifications– A central repository– Documentation generators– Code generators

Logic Modeling
• Data flow diagrams do not show the logic inside the processes
• DFDs model the system; logic modeling models the software needed to support the system
• Logic modeling involves representing internal structure and functionality of processes depicted on a DFD
• Logic modeling can also be used to show when processes on a DFD occur
• Logic models are created from primitive DFD processes
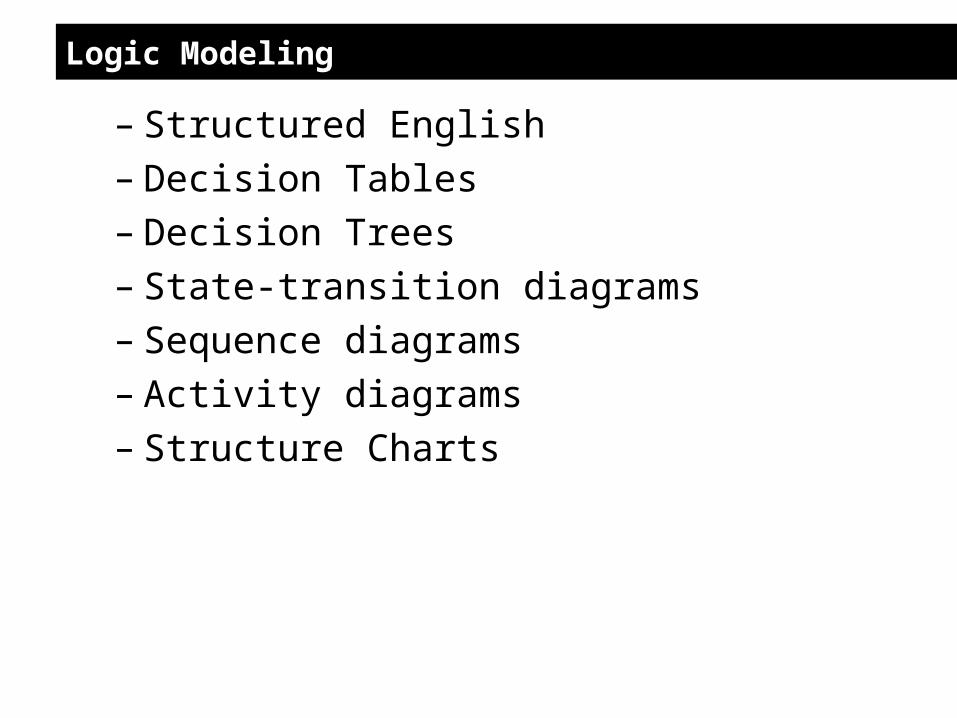
Logic Modeling
– Structured English– Decision Tables– Decision Trees– State-transition diagrams– Sequence diagrams– Activity diagrams– Structure Charts
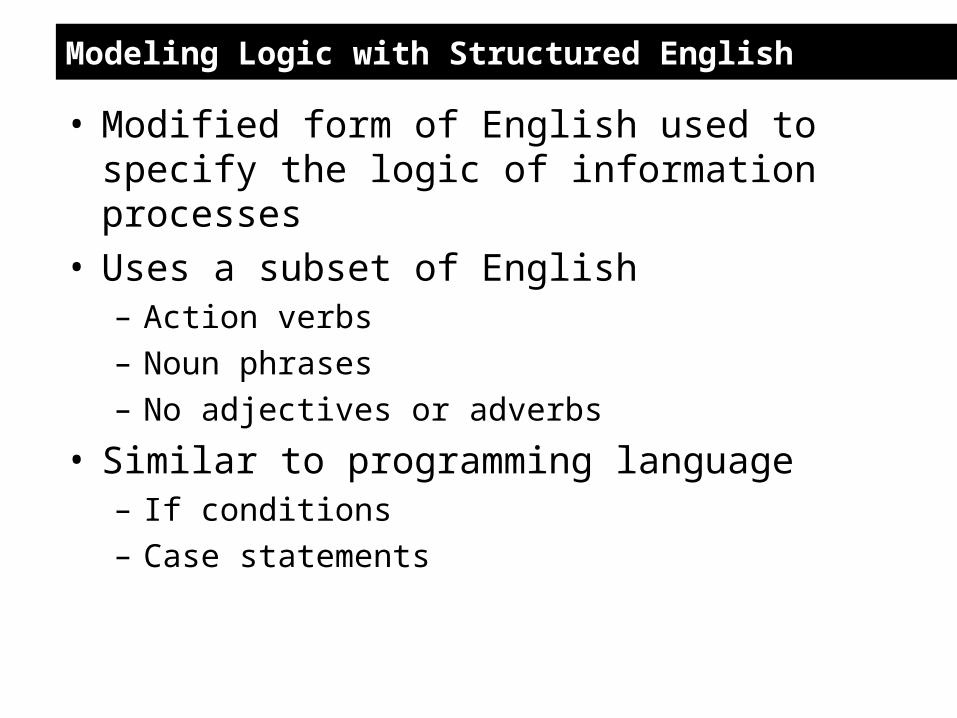
Modeling Logic with Structured English
• Modified form of English used to specify the logic of information processes
• Uses a subset of English– Action verbs
– Noun phrases
– No adjectives or adverbs
• Similar to programming language– If conditions
– Case statements
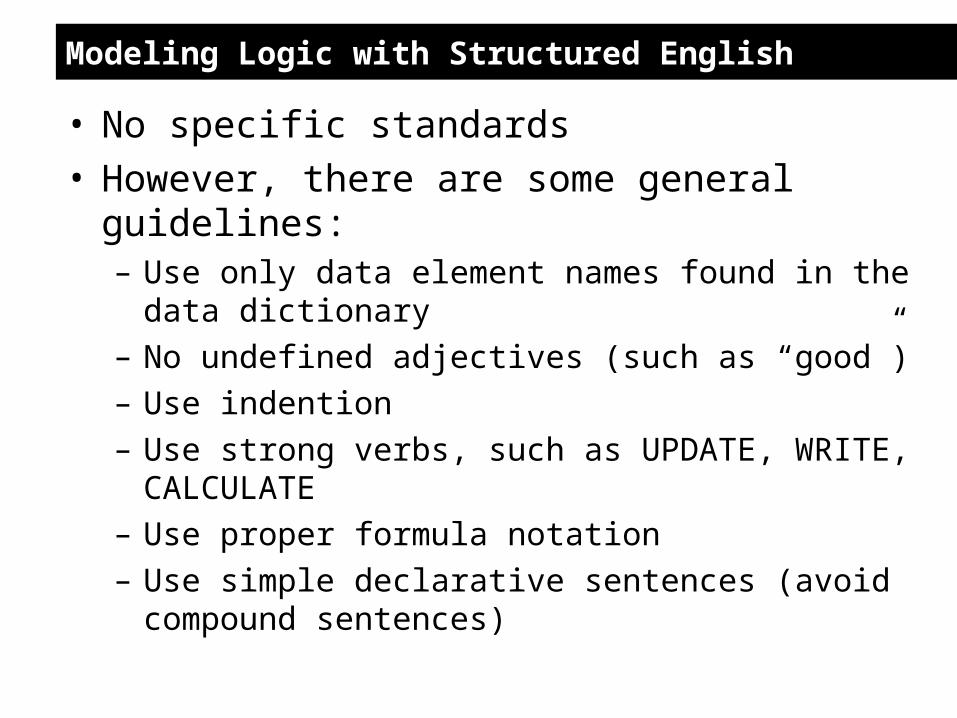
Modeling Logic with Structured English
• No specific standards• However, there are some general guidelines:
– Use only data element names found in the data dictionary
– No undefined adjectives (such as “good”)
– Use indention
– Use strong verbs, such as UPDATE, WRITE, CALCULATE
– Use proper formula notation
– Use simple declarative sentences (avoid compound sentences)
Modeling Logic with Structured English
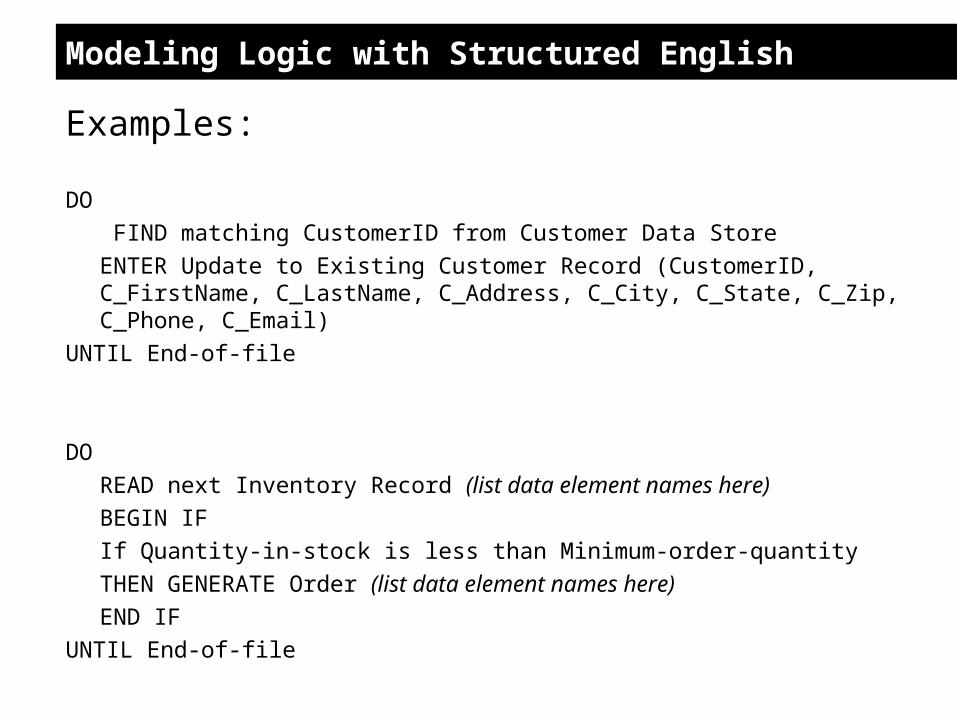
Examples:
DO
FIND matching CustomerID from Customer Data Store
ENTER Update to Existing Customer Record (CustomerID, C_FirstName, C_LastName, C_Address, C_City, C_State, C_Zip, C_Phone, C_Email)
UNTIL End-of-file
DO
READ next Inventory Record (list data element names here)
BEGIN IF
If Quantity-in-stock is less than Minimum-order-quantity
THEN GENERATE Order (list data element names here)
END IF
UNTIL End-of-file

Modeling Logic with Decision Tables
• A matrix representation of the logic of a decision• Specifies the possible conditions and the resulting
actions• Best used for complicated decision logic• Good for multiple conditions (when actions are
required based on them)

Example: Decision Table
Modeling Logic with Decision Trees
• A graphical representation of a decision situation• Decision situation points are connected together by
arcs and terminate in ovals• Two main components
– Decision points represented by nodes
– Actions represented by ovals
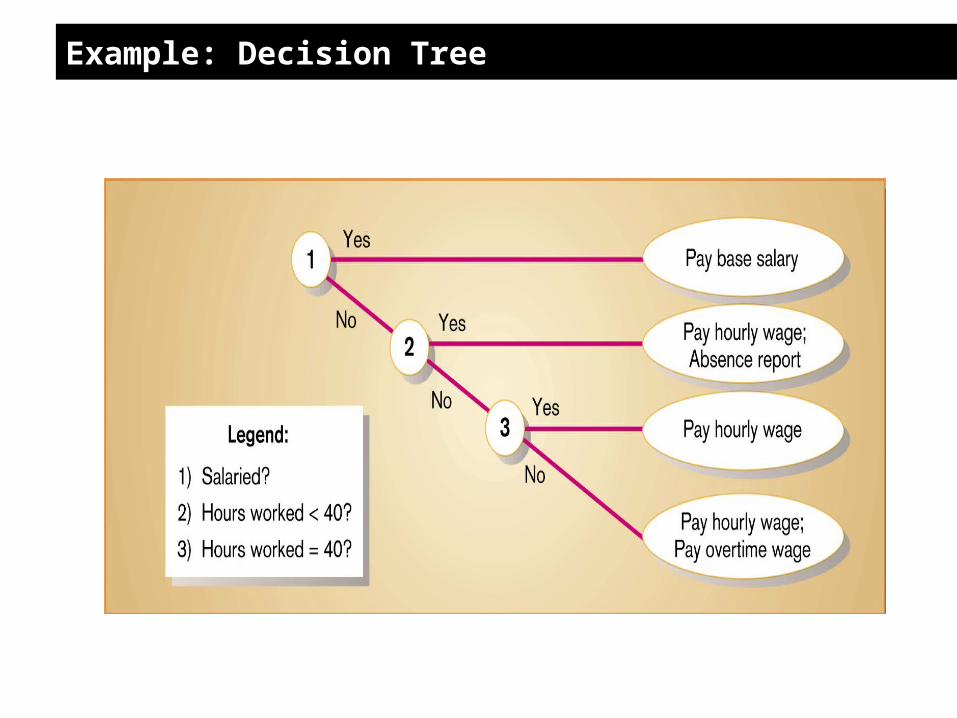
Example: Decision Tree

Deciding Among Structured English, Decision Tables and Decision Trees
Criteria Structured English
Decision Tables
Decision Trees
Determining Conditions and Actions
Second Best Third Best Best
Transforming Conditions and Actions into Sequence
Best Third Best Best
Checking Consistency and Completeness
Third Best Best Best
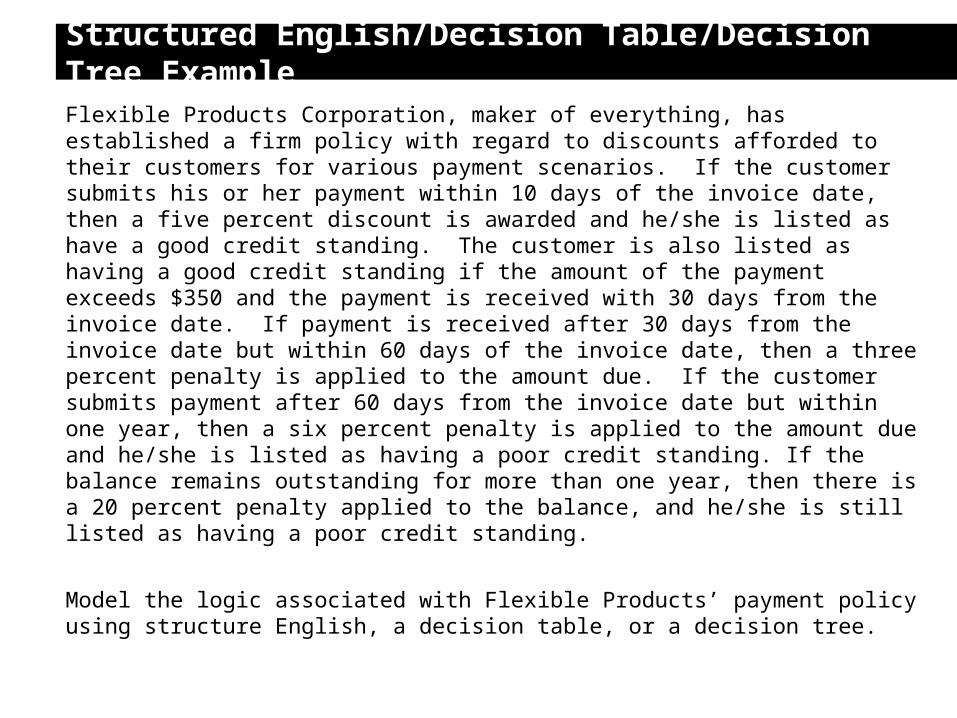
Structured English/Decision Table/Decision Tree Example
Flexible Products Corporation, maker of everything, has established a firm policy with regard to discounts afforded to their customers for various payment scenarios. If the customer submits his or her payment within 10 days of the invoice date, then a five percent discount is awarded and he/she is listed as have a good credit standing. The customer is also listed as having a good credit standing if the amount of the payment exceeds $350 and the payment is received with 30 days from the invoice date. If payment is received after 30 days from the invoice date but within 60 days of the invoice date, then a three percent penalty is applied to the amount due. If the customer submits payment after 60 days from the invoice date but within one year, then a six percent penalty is applied to the amount due and he/she is listed as having a poor credit standing. If the balance remains outstanding for more than one year, then there is a 20 percent penalty applied to the balance, and he/she is still listed as having a poor credit standing.
Model the logic associated with Flexible Products’ payment policy using structure English, a decision table, or a decision tree.

Phase 2C: Select Best Alternative
• What are our alternatives?– Buy it all?– Build it all?– Buy part of it, build part of it?
• Evaluate alternatives based on their ability to meet requirements (within given constraints)
• Two objectives:– Identify and research alternative manual and computer
based solutions to support our target IS– Evaluate the feasibility of alternative solutions and
recommend the best overall alternative solution

Select Best Alternative
Phase A: Select a Best Alternative
• Specify Alternative Solutions
• Analyze Feasibility of Alternative Solutions
• Recommend a System Solution
Phase B: Acquire Necessary Hardware and Software
• Research Technical Criteria and Options
• Solicit Proposals/Quotes from Vendors
• Validate Vendor Claims and Performance
• Evaluate and Rank Vendor Proposals
• Award Contract and Debrief Losing Vendors
• Establish Integration Requirements
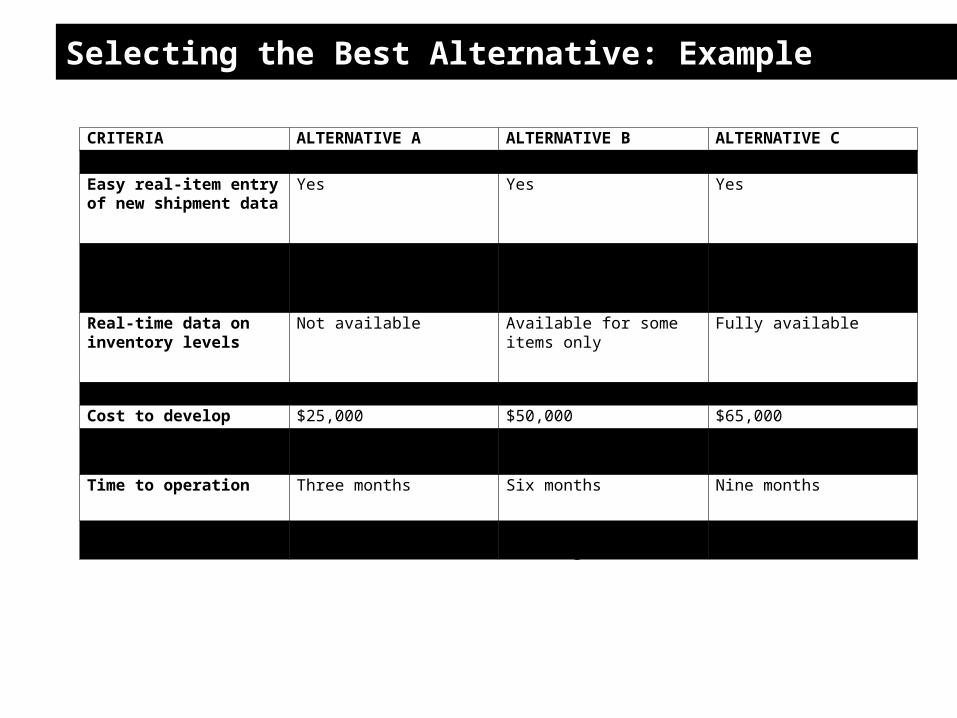
Selecting the Best Alternative: Example
CRITERIA ALTERNATIVE A ALTERNATIVE B ALTERNATIVE C
REQUIREMENTS
Easy real-item entry of new shipment data
Yes Yes Yes
Automatic reorder decisions For some items For all items For all items
Real-time data on inventory levels
Not available Available for some items only Fully available
CONSTRAINTS
Cost to develop $25,000 $50,000 $65,000
Cost of hardware $25,000 $50,000 $50,000
Time to operation Three months Six months Nine months
Ease of training One week of training Two weeks of training One week of training

Output of Phases 2B and 2C (Milestone 3)
• Solutions document• Logical DFDs of proposed system (and hierarchy
chart)• Entity-relationship diagram• Structured English for 2 primitive processes• Data dictionary (for DFDs and ERD)• Alternatives


![[PPT]Modern Systems Analysis and Design Ch3 · Web viewModern Systems Analysis and Design Fourth Edition Jeffrey A. Hoffer Joey F. George Joseph S. Valacich Chapter 3 Managing the](https://img.dokumen.tips/doc/110x75/5b04d9447f8b9a2e228e7521/pptmodern-systems-analysis-and-design-ch3-viewmodern-systems-analysis-and-design.jpg)