Embed Size (px)
Citation preview
HAL Id halshs-00959347httpshalshsarchives-ouvertesfrhalshs-00959347
Submitted on 14 Mar 2014
HAL is a multi-disciplinary open accessarchive for the deposit and dissemination of sci-entific research documents whether they are pub-lished or not The documents may come fromteaching and research institutions in France orabroad or from public or private research centers
Lrsquoarchive ouverte pluridisciplinaire HAL estdestineacutee au deacutepocirct et agrave la diffusion de documentsscientifiques de niveau recherche publieacutes ou noneacutemanant des eacutetablissements drsquoenseignement et derecherche franccedilais ou eacutetrangers des laboratoirespublics ou priveacutes
Modern pollen assemblages from grazed vegetation inthe western Pyrenees France a numerical tool for more
precise reconstruction of past cultural landscapesFlorence Mazier Didier Galop Ceacutecile Brun Alexandre Buttler
To cite this versionFlorence Mazier Didier Galop Ceacutecile Brun Alexandre Buttler Modern pollen assemblages fromgrazed vegetation in the western Pyrenees France a numerical tool for more precise reconstructionof past cultural landscapes The Holocene London Sage 2006 16 (1) pp91-103 halshs-00959347
Modern pollen assemblages from grazed
vegetation in the western Pyrenees
France a numerical tool for more precise
reconstruction of past cultural landscapes
Florence Mazier1 Didier Galop1 Cecile Brun1 andAlexandre Buttler12
(1Laboratoire de Chrono-Ecologie UMR 6565 CNRS Universite de Franche-Comte 16 route de Gray F-25030 Besancon Cedex France 2Laboratoire desSystemes ecologiques ECOS Ecole polytechnique federale de Lausanne (EPFL)et Institut federal de recherches WSL Antenne romande Case postale 96 CH-1015Lausanne Switzerland)
Received 11 May 2005 revised manuscript accepted 27 July 2005
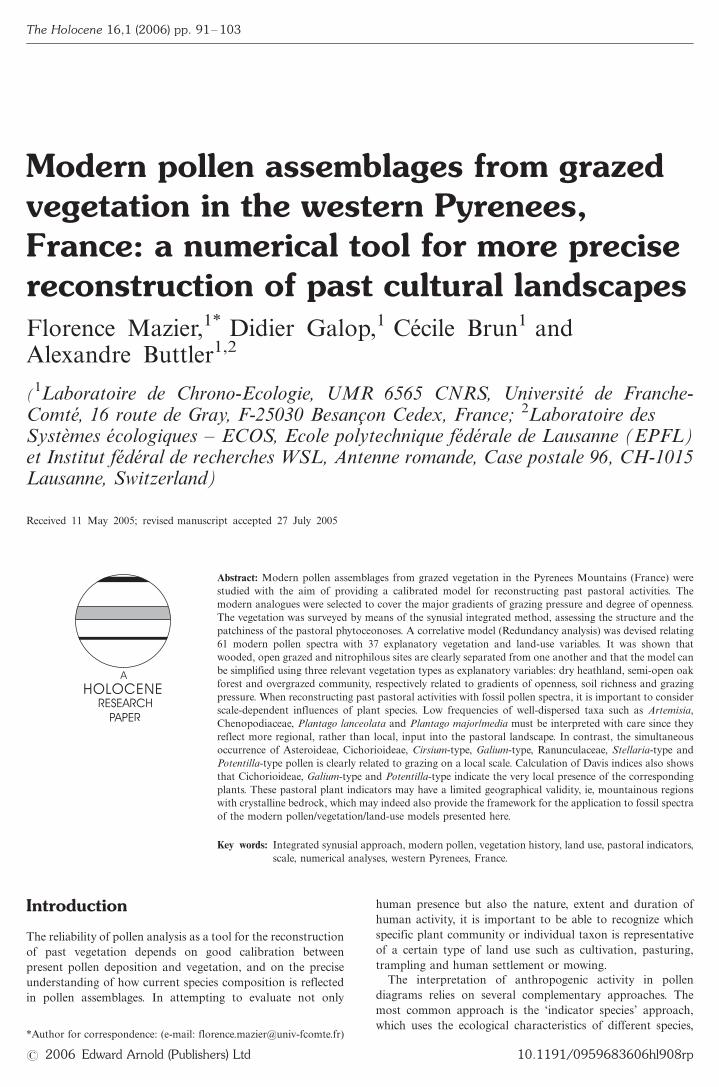
Abstract Modern pollen assemblages from grazed vegetation in the Pyrenees Mountains (France) were
studied with the aim of providing a calibrated model for reconstructing past pastoral activities The
modern analogues were selected to cover the major gradients of grazing pressure and degree of openness
The vegetation was surveyed by means of the synusial integrated method assessing the structure and the
patchiness of the pastoral phytoceonoses A correlative model (Redundancy analysis) was devised relating
61 modern pollen spectra with 37 explanatory vegetation and land-use variables It was shown that
wooded open grazed and nitrophilous sites are clearly separated from one another and that the model can
be simplified using three relevant vegetation types as explanatory variables dry heathland semi-open oak
forest and overgrazed community respectively related to gradients of openness soil richness and grazing
pressure When reconstructing past pastoral activities with fossil pollen spectra it is important to consider
scale-dependent influences of plant species Low frequencies of well-dispersed taxa such as Artemisia
Chenopodiaceae Plantago lanceolata and Plantago majormedia must be interpreted with care since they
reflect more regional rather than local input into the pastoral landscape In contrast the simultaneous
occurrence of Asteroideae Cichorioideae Cirsium-type Galium-type Ranunculaceae Stellaria-type and
Potentilla-type pollen is clearly related to grazing on a local scale Calculation of Davis indices also shows
that Cichorioideae Galium-type and Potentilla-type indicate the very local presence of the corresponding
plants These pastoral plant indicators may have a limited geographical validity ie mountainous regions
with crystalline bedrock which may indeed also provide the framework for the application to fossil spectra
of the modern pollenvegetationland-use models presented here
Key words Integrated synusial approach modern pollen vegetation history land use pastoral indicators
scale numerical analyses western Pyrenees France
Introduction
The reliability of pollen analysis as a tool for the reconstruction
of past vegetation depends on good calibration between
present pollen deposition and vegetation and on the precise
understanding of how current species composition is reflected
in pollen assemblages In attempting to evaluate not only
human presence but also the nature extent and duration of
human activity it is important to be able to recognize which
specific plant community or individual taxon is representative
of a certain type of land use such as cultivation pasturing
trampling and human settlement or mowing
The interpretation of anthropogenic activity in pollen
diagrams relies on several complementary approaches The
most common approach is the lsquoindicator speciesrsquo approach
which uses the ecological characteristics of different speciesAuthor for correspondence (e-mail florencemazieruniv-fcomtefr)
The Holocene 161 (2006) pp 91103
2006 Edward Arnold (Publishers) Ltd 1011910959683606hl908rp
especially those favoured by human activity and today found
mainly in human-induced vegetation types (Behre 1981
Vorren 1986 Hicks 1988) Another interpretation tool is the
lsquocomparative approachrsquo comparisons of modern and fossil
pollen spectra using all taxa therefore a community-based
approach (Wright 1967) A wide range of communitiespollen
assemblages is needed to increase our understanding of past
landscapes and past land-use changes In northern Europe
modern pollen assemblages and related vegetation as well as
land-use data have been used to provide a basis for numerical
comparisons (Berglund and Ralska-Jasiewiczowa 1986
Berglund et al 1986 Gaillard et al 1992 1994 Hicks and
Birks 1996 Hjelle 1999a Rasanen 2001) These studies
identified pollen assemblages and taxa indicators of various
human-induced vegetation types Despite these valuable con-
tributions to the interpretation of pollen diagrams the pollen
vegetationland-use relationships found in northern Europe are
not necessarily applicable in other areas such as the mountai-
nous regions of Mediterranean Europe (Galop 1998 Galop et
al 2003 Court-Picon 2005) Many pollen diagrams from the
western Pyrenees Mountains have been produced recently
(Galop 1998 Galop et al 2003) but no reconstruction of
past vegetation or landscape units by means of comparisons
of modern and fossil pollen spectra has been attempted so far
Therefore the objectives of the present study in the Pyrenees
Mountains were
to investigate pollen representation of trees and herbs in
modern pollen assemblages from characteristic vegetation
types
to assess the major gradients in modern pollen assemblages
and relate these to measured environmental variables
to test whether different vegetation types with their specific
vegetation structure as described by the integrated synusial
approach can be used efficiently to express the vegetation
pollen relationship
to establish whether various degrees of openness and
grazing pressure produce significantly distinct modern
pollen spectra and to identify pollen taxa characteristics
of pastoral activities
The comparative approach requires a search for modern
analogues of past landscapes and vegetation communities
Owing to the elevation and the steep slopes grazing seems to
have always been the main land-use practice in the Iraty
Mountains of the Basque Country Today farmers maintain
traditional land-use practices based on transhumance from the
valley to the summer pastures The main activity is sheep
raising for milk and cheese This production system necessi-
tates for each shepherd and his flock small enclosures for
gathering the herd a milking corridor a hut for cheese
production and specific patches in summer pastures It also
calls for extensive and intensive pastures some with forested
areas and some treeless
The modern analogues used for establishing the pollenland-
use relationship should present as far as possible ecological
conditions similar to those prevailing in the past (Gaillard et
al 1992) Moss polsters are commonly used as surface samples
for local modern pollen deposition (Gaillard et al 1992 Hicks
and Birks 1996 Hjelle 1998) They are assumed to record an
average of several years of pollen deposition (Bradshaw 1981
Heim 1970) which is recommended since previous investiga-
tions have shown annual variation in pollen productivity
(Hicks 2001 Hicks et al 2001 van der Knaap et al 2001
Rasanen et al 2004) Moreover the modern pollen assemblage
should be a good analogue of a fossil pollen assemblage which
usually covers more than one year of pollen deposition
However contradictory views exist as to the timespan of
pollen deposition covered by mosses (Cundill 1991 Rasanen
et al 2004)
Methods
Study area and sampling designThe data presented in this study were collected within the
interdisciplinary research programme lsquoPalaeo-environment
and dynamics of human activities in the Pyrenees Mountainsrsquo
(Galop et al 2004) A field site for the programme was
selected in the Iraty Mountains in the Basque Country
(western part of the Pyrenees chain in southern France) and
lies between 700 and 1500 m asl The silicate bedrock and
acidic soils present there induce abundant peat deposits in
small basins
The landscape is hilly and characterized by a mosaic of
vegetation types variously affected by pastoral activity On
sloping grounds the vegetation is dominated by heather
moorland of Calluna vulgaris Erica sp Molinia coerulea and
patches of Ulex europaeus and Pteridium aquilinum still used
for animal litter Some slopes especially the steepest ones are
dominated by deciduous forest patches of beach and oak
Intensive grazed pastures are prevalent on the smooth
mountain crests
Our investigations focused on a small watershed centred on
the topogenic Sourzayrsquos peat bog with the aim of investigating
modern pollenvegetation and pollenland-use relationships in
a mosaic pasturewoodland landscape and to use these
relationships in the interpretation of fossil pollen records
from the same area The modern analogues were selected
near the fossil sequence to assess the effect of the vegetation
structure on the pollen record For collection of the modern
pollen and related vegetation data a preferential design was
selected with stratification based on degree of landscape
openness and current land use along four axes across
the watershed and centred on the fossil pollen record site
(Figure 1) Thus the major relevant vegetation communities
and gradients of grazing pressure from open to forested areas
were covered The transects were chosen so as to exclude as
much as possible any areas disturbed by thalwegs streams and
human activities other than pastoral ones Some relevant
vegetation types such as grazed oak forests or enclosures
were absent from the study site The modern analogue data set
was therefore completed outside the watershed
Field method
Vegetation dataA set of 71 vegetation releves from various forest types (oak
beech) heath and wet vegetation communities was collected
from both grazed and ungrazed areas during the summer of
2001 Vegetation analysis was undertaken according to the
integrated synusial approach (Gillet et al 1991 2002 Gillet
and Gallandat 1996) which is a method based on the
Braun-Blanquet approach (Braun-Blanquet 1964) but allows
better structural description and characterization of plant
communities in their landscape context (Figure 2) This
method aims at
describing complex vegetation structures taking into
account both horizontal and vertical heterogeneity
emphasizing functional and dynamic links between various
constituent elements among several spatio-temporal orga-
nization levels
92 The Holocene 16 (2006)
Only two levels were considered in this study those of the
synusia and the phytocoenosis The synusia is an elementary
one-layered concrete vegetation unit (patch) directly linked to
uniform environmental conditions Thus every synusia is a
floristically physiognomically and ecologically homogeneous
vegetation unit In the field several vegetation stands were
divided vertically and horizontally into synusiae each therefore
undergoing sampling for a floristic releve The synusial releve
furnishes a semi-quantitative description according to Braun-
Blanquet (1964) of the species occurring in the sample patch
Synusiae are organized in space and in time within phytocoe-
nosis as elements of a mosaic or a zoning of stratal
communities (Gillet and Gallandat 1996) Thus a phytocoe-
nosis is a complex of synusiae (herb shrub and tree synusiae)
functionally strongly linked in both space (mosaics stratifica-
tion) and time A phytocoenotic releve also furnishes a semi-
quantitative description of the synusiae observed in a concrete
phytocoenosis The investigated sites presented homogeneous
vegetation (floristically and structurally) on a minimal surface
of 100 m2 (not necessarily a square) which was the surveyed
surface for each phytocoenosis Vascular plant nomenclature
follows Tutin et al (19641980)
Sampling of moss polstersIn the present study moss polster samples were taken down to
but not including the soil and collected at the end of the
flowering season September 2001 (Rasanen et al 2004) Moss
species vary from site to site but whenever possible species
producing dense life forms were chosen (Boyd 1986) For the
wet sites Sphagnum sp was the only available species and the
upper green part (the first 4 cm) was collected
For each phytocoenosis and on the entire surface of the
vegetation releve ten mosses were sampled and mixed together
into one sample per site (Gaillard et al 1992)
Environmental variablesThe sampling sites were classified into categories according to
the degree of grazing dunging and trampling pressure
assessed as the proportion of the surveyed surface showing
signs of recent cattle activity On an ordinal scale classes
ranged from 0 to 3 as follows (0) no pressure (1) pressure
B5 of the surface (2) pressure between 5 and 50 of the
surface (3) pressure 50 of the surface Livestock type
(absencepresence nominal variable) was also taken into
Figure 2 Schematic representation of the two integration levels
used for vegetation description according to the integrated
synusial method (adapted from Gillet and Gallandat 1996)
0101
0202
0303
0404
05050707
0808
06060909
1010
1111
11b11b
1212
1313
14141515
16161717
1818
19192020
2121
22222323
2424
2525
2626
2727 2828
2929
3030
3232
3434
35353737
3636
3838
3939
4040
4141 4242
4343
4444
4545
4646
47474848
4949
5050
51515252
5353
5454
5555
5656
5757
5858
59596060
6161
6262
6363
6464
6565
3333
6666
67676868
6969
7171
7070
7272
7373
3131
5353
1050
950
1050
1150
1250
850
1050
950
850
950
1050
11501250
Col Curutche
1391
Pic dArthaburu
1156
1150
Sommet
dOccabeacute
1466
Col de
Burdincurutcheta
1338
1250
1350
1350
Iraukotuturru
750 850 950 1050 1150 1250 1350 1450 15500 1000m
N
Cabanes
dArtxilondo
Cabanes
dApatessaro
pollen surface sample
moss polstersSourzays peat bog
Elevation (m)Study
area
Figure 1 The study area in southern France and the Iraty mountains of the Pays Basque Location of the 71 modern analogues (solid circles)
where pollen samples (moss polsters) and related vegetation data were collected In the vicinity of the fossil pollen sequence (Sourzayrsquos peat
bog) the modern analogues are located along four transects with a stratification based on the degree of grazing and openness
Florence Mazier et al Modern pollen assemblages from grazed vegetation western Pyrenees 93
account designated as sheep horse cow or pig since livestock
in this region was not mixed for all 71 sites The altitude slope
(quantitative variables) aspect nature of bedrock (absence
presence nominal variable) were measured or identified for
each phytocoenosis The aspect was transformed into a
quantitative variable based on a trigonometric measure for
both the north and east scales (eg for the N-NE aspect the
measure on the north scale was sin 675092 and on east
scale cos 675038) In order to investigate how variation in
the pollen data might be explained by the main gradients in the
vegetation data phytocoenosis typology was used providing
explanatory qualitative variables Each plant community 13 in
all was expressed as a presenceabsence nominal variable
For each phytocoenosis mean soil depth (ten measures
taken randomly spread over the surveyed surface) was
measured and soil samples were taken from the top 10 cm of
soil which corresponded to the A horizon homogenized and
pooled into one sample per surveyed surface (Gaillard et al
1992 1997) A subsample was then air dried The fraction ()
of coarse material (2 mm) was determined by the sieving
procedure The fresh sample was used for pH (KCl) and pH
(H2O) measurements Organic matter () derived from the ash
content and total N () were analysed These classical
methods followed standard procedures (Anderson and Ingram
1993) The water-holding capacity was obtained by saturating
the soil sample over 96 hours removing the excess water by
filtration and oven drying the sample The potential water
content ( of dry soil) was obtained by the weight difference
between saturated and dry soil
Altogether 37 explanatory variables were recorded and
divided into five general categories edaphic geologic geo-
morphologic land use and vegetation variable types
Laboratory methodsMoss samples were treated according to standard procedures
(Faegri and Iversen 1989) by boiling in 10 NaOH for 45 min
sieving treating with 40 HF (to digest fine silica) ZnCl2 (to
eliminate clay material) and acetolysis (one part H2SO4 and
nine parts acetic anhydride heated in water bath for 8 min)
Samples were mounted in glycerol and pollen were identified
to the most precise taxonomic level possible using pollen keys
(Faegri and Iversen 1989 Moore et al 1991 Reille 1992)
As the focus of this study is the effect of the vegetation
structure on the pollen assemblages pollen from trees dwarf-
shrubs and herbs were thus included in the analysis A
minimum of 400 pollen grains was counted per sample and
a total of 113 pollen and spore taxa were recorded Moreover
as one of the main goals was to investigate the plantpollen
relationships on a local scale some taxa were excluded from
the pollen sum Only pollen taxa of plants potentially present
in the flora of the region were included in the analysis For
example pollen of Olea was excluded and considered exogen-
ous as it comes from cultivated areas in Spain far from the
study area The calculation sum used to obtain percentages of
the pollen taxa in numerical analyses excludes exogenous and
aquatic taxa as well as fern spores In all 28 taxa were
excluded Thus the modern pollen data set consists of 71
samples and 85 pollen taxa
Data analysis
Vegetation typologyThe vegetation was described through examination of 71
phytocoenotic releves and 256 synusial releves among these
phytocoenoses Synusial typology was first carried out based
on the comparison and classification of the synusial releves
using floristic-statistical tools to identify syntaxa (typological
units of this organization level) These tools combine step by
step various applications such as ordinations and clustering
using different options of the package MULVA-5 (Wildi and
Orloci 1996) The analytical procedure was performed sepa-
rately on the data of each layer herb shrub and tree The
optimal number of groups of releves and species was deter-
mined by comparing the results of the various classifications
using criteria such as concentration analysis and contingency
coefficient provided in the package The phytocoenotic releves
were compared using the same numerical tools and classified
into coenotaxa (typological units of this organization level)
Association and representation indicesIn order to understand the pollenplant relationships at the
taxonomic level used for pollen analysis plant taxa were
grouped according to pollen morphological types For the
vegetation the species list was first derived from all the
synusial releves included in each phytocoenotic releve Taxa
occurring only as plants or only in the pollen assemblages were
excluded from the calculation of the Davis indices of associa-
tion (A) under-representation (U) and over-representation (O)
(Davis 1984 Hjelle 1997 Bunting 2003) These indices are
based on presenceabsence data of the taxon list and are
defined as follows
AB0(P
0P
1B
0)1
UP1(P
1B
0)1
OP0(P
0B
0)1
Where B0 is number of samples in which both the pollen type
and its associated plant are present P0 is number of samples in
which the pollen type is present in the surface sample but not
the plant taxa and P1 is number of samples in which the pollen
type is not present in the surface sample but the plant taxa is
present in the vegetation
Ordination by principal component analysis (PCA) was used
to display the relationship between the calculated indices (A
U O as descriptors) and the pollen taxa (objects) PCA used a
covariance matrix with the eigenvectors adjusted by variance
The taxa were then classified into groups using agglomerative
hierarchical clustering with proportional-link linkage and a
connection of 07 Euclidian distance was used PCA and
cluster analysis were implemented respectively by the
CANOCO program for Windows 40 (Leps and Smilauer
2003 Ter Braak and Smilauer 1998) and Progiciel R (Casgrain
and Legendre 2001)
Pollenvegetationenvironment relationshipsDirect gradient analyses were considered appropriate for
exploration and testing patterns of modern pollen variation
in relation to environmental and anthropogenic explanatory
variables The fitting model depends on whether the pollen
taxa respond roughly linearly to gradients (linear response) or
perform best around some environmental optima (unimodal
response) (Ter Braak and Smilauer 1998) Preliminary De-
trended Canonical Correspondence Analysis (DCCA) showed
that this data set has a gradient length of 1309 standard
deviation units of species turnover (SD) This implied that
linear-based methods of data analysis such as Redundancy
Analysis (RDA) were suitable in this case (Ter Braak and
Prentice 1988)
RDA attempts to explain pollen taxa responses by ordina-
tion axes that are constrained to be linear combinations of the
37 explanatory variables available including the 13 coenotaxa
(vegetation communities) Thirteen pollen taxa present only
94 The Holocene 16 (2006)
once in the 71 pollen assemblages were omitted The pollen
percentage data was log-transformed [ln (ayc) with a1 and
c1) and double-centred Forward selection and Monte Carlo
test with 999 unrestricted permutations were run to check
statistical significance and to select the best explanatory
variables for further analysis The permutation tests were later
applied to the canonical axes
First the investigated matrix contained the pollen data set
and 37 independent variables from 71 modern analogues In
preliminary RDA pollen assemblages from enclosures and
wetland communities were clearly separated from the remain-
ing sites but were also clearly different from fossil spectra
(included passively) (Mazier Galop Cugny Buttler Legaz and
Rendu unpublished data 2005) These sites contained some
characteristic taxa in large proportion and their assemblages
were quite different from the other plots causing a long
gradient in the ordinations which resulted in a poor separation
of the other samples Ten sites and consequently two explana-
tory variables were therefore omitted for further RDA
resulting in the use of 61 sites 73 pollen taxa and 35
environmental variables of which 13 were retained for their
significance the others being passively presented in the
ordination diagrams (or given as covariable)
Three main predictor variables three vegetation groups
which had the best correlation with the first three ordination
axes were used for more precise analyses In order to define the
weight of each taxon for these three nominal variables partial
RDAwas performed separately on each one The species scores
on the first canonical axis of each analysis were then
considered descriptors in a new ordination using Principal
Component Analysis (PCA) PCA used a covariance matrix
with the eigenvectors adjusted to the square root of their
variance divided by the standard deviation (symmetric scaling
lhsi)
All ordination analyses were implemented by the CANOCO
program for Windows 40 (Ter Braak and Smilauer 1998) and
diagrams constructed by Progiciel R (Casgrain and Legendre
2001) and refined by Illustrator 10
Results
Phytocoenosis typologyThe numerical analysis of the 256 synusial releves resulted in 21
syntaxa (cluster group) 4 within trees 3 within shrubs and 14
within the herb layer (Table 1 presents the species composition
for the herb syntaxa) The comparison and the classification of
the 71 phytocoenotic releves made it possible to identify 13
coenotaxa (Table 2) divided into two main groups anthro-
pogenic (4) and lsquonaturalrsquo communities (9) These plant com-
munities can be ordered along a gradient of anthropogenic
influence and degree of openness Here we describe only the
three main coenotaxa which are found as significant explana-
tory variables in the redundancy analysis
Coenotaxon No 2 occurs mainly on small areas and reflects
a community type composed of two herb syntaxa The
syntaxon H4 (Rumex acetosellaGalium saxatile) is correlated
with intense livestock activity inducing areas of urination and
defecation as well as bare soil areas The vegetation of the
patch presents a short and sparse canopy dominated by Rumex
acetosella and Galium saxatile The other syntaxon H3
(Trifolium repensPoa annua) reflects grazed dense vegetation
This short grass patch is dominated by grazed-area species
such as Poa annua Trifolium repens Stellaria media ssp media
and Cerastium fontanum ssp fontanum Coenotaxon No 2
depends directly on the daily routine of the livestock mainly
sheep and presents a high pastoral value This overgrazed
community is often found on mountain crests
Coenotaxon No 7 describes large areas of dry mountain-
slope heathland composed of seven syntaxa The principal
syntaxa are H9 (Ulex europaeusCalluna vulgaris) H5 (Poten-
tilla erectaAgrostis curtisii) and H14 (Pteridium aquilinum
Agrostis curtisii) This high-altitude community presents heath-
land species with a dominance of Agrostis curtisii Potentilla
erecta Danthonia decumbens Deschampsia flexuosa Vaccinium
myrtillus Calluna vulgaris Ulex europaeus Erica vagans Erica
cinerea Erica tetralix and Pteridium aquilinum Its species
composition is closely related to coenotaxon No 6 which
includes H8 in addition (Calluna vulgarisVaccinum myrtillus)
and results from colonization by Ulex europaeus and Pteridium
aquilinum induced through a decrease in grazing pressure
Coenotaxon No 12 corresponds to open oak forest with a
low and sparse canopy This community includes three herb
syntaxa (H5 H9 and H6 (Vaccinium myrtillusDeschampsia
flexuosa)) one shrub (B21) and two tree syntaxa (patches of
oak trees alone (A17) and mixed beech and oak (A16)) The
herb vegetation is dominated by Agrostis curtisii Potentilla
erecta Calluna vulgaris Ulex europaeus Deschampsia flexuosa
and Vaccinium myrtillus This coenotaxon corresponds to poor
soils on slopes outside the Sourzay watershed
Association and representation indicesOnly 32 taxa were found both as plants and as pollen in one or
more phytocoenoses The relationships between the different
taxa and the calculated indices are summarized in the PCA
scatter plot (Figure 3) The first axis explains 559 of the
index variation and is strongly related to the presence of both
pollen and corresponding plants (eg Poaceae Cyperaceae) It
separates strongly associated taxa plants and pollen present in
over 65 of the samples (Galium-type and Potentilla-type)
from unassociated taxa occurring infrequently in the vegeta-
tion and pollen rain (eg Rosaceae Rumex obtusifolius) The
second axis captures 401 of the variation and differentiates
over-represented taxa most often found only as pollen (eg
Abies Quercus tot Urtica dioica Brassicaceae and Plantago
lanceolata) from under-represented taxa often found only as
plants (eg Sorbus Polygala Erica tetralix)
Good agreement is found in the results of the two methods
ordination and classification with strongly associated taxa of
group 5 and associated taxa of group 3 on the right-hand side
of the first axis Group 1 clearly indicates over-represented taxa
on the positive side of the second axis Group 2 is centred and
represents weakly associated types with low A values and
relatively high U and O values Group 4 constitutes a mixed
group with unassociated under-represented and weakly asso-
ciated types Table 3 summarizes the calculated indices for
selected taxa in this study and also in previous ones based on
the classification of Bunting (2003)
Pollenvegetationenvironment relationshipsRedundancy analysis (RDA) was used to describe the major
gradients in the modern pollen assemblages and to relate these
patterns to the environmental and anthropogenic variables
This correlative model also tests whether different degrees of
openness and grazing pressure produce statistically distinct
modern pollen spectra
Among the 37 explanatory variables 14 contribute signifi-
cantly to the correlative model using forward selection and
Monte Carlo permutation tests (P5005 999 permutations)
Pudding rock mainly represented in some places of our study
area was found significant This variable was considered to be a
covariable as we did not want to interpret its effect Therefore a
Florence Mazier et al Modern pollen assemblages from grazed vegetation western Pyrenees 95
partial RDA ordination diagram of 61 pollen assemblages and
13 explanatory variables such as vegetation units and other
environmental variables was performed (Figure 4)
Axis 1 shows a clear gradient from open land to forest
vegetation types It contrasts open land such as CoE No 7
usually treeless dry heathland with wooded sites such as more
or less open beech forest CoE No 7 and the North are
respectively correlated negatively (r042) and positively
(r047) to axis 1 Indeed beech forests represented by CoE
No9 10 and 11 included as passive variables are generally
found on northern slopes Axis 2 appears to represent a soil
richness gradient and is positively linked with loss on ignition
and total N (r040 and 036 respectively) whereas the
vegetation type CoE No 12 oak forest on poor soils presents
a negative correlation (r037) Thus axis 2 contrasts the
nitrophilous features of an overtrampled community (CoE No
3) with oak forest Axis 3 better expresses a grazing pressure
gradient with sites intensively grazed and trampled on the
positive side on the axis CoE No 2 an overgrazed community
is strongly linked with axis 3 (r050) and correlated to
Table 1 Synthetic presentation of the herb synusial elementary syntaxa (SyE) of the Iraty Mountains pastoral landscape
Syntaxon no 1 2 3 4 5 6 7 8 9 10 11 12 13 14
Number of synusial releves 4 5 5 18 50 32 6 9 21 8 6 5 6 11
Urtica dioica V2 r
Cirsium eriophorum IV2 r2 r
Cirsium palustre V2 r r1
Cirsium vulgare IV2 r1
Rumex obtusifolius ssp obtusifolius V1 r1
Taraxacum officinale V1 r r r rr
Ranunculus repens V2
Achillea millefolium ssp millefolium IV1
Cynosurus cristatus IV2
Lolium perenne r IV2 r
Holcus lanatus III2
Capsella bursa-pastoris III
Plantago lanceolata III1 r r1
Stellaria media ssp media r1 V2 V1 II2 r r1
Cerastium fontanum ssp fontanum r V1 V2 IV2 r r2
Trifolium repens r V2 III2 III2 r1 r2 II2
Poa annua V2 V3 III2 r I2 II2
Rumex acetosella II V2 r2 I2 r3
Danthonia decumbens r I1 V2 r1 II1 II2 r r
Galium saxatile r1 r1 V2 V2 IV2 IV2 r3 r2 II2 r2
Agrostis curtisii III2 V2 III2 III1 r3 r r1 II3
Potentilla erecta II IV1 V2 II1 r1 V2 V2
Carex flacca II1 V2 IV2 II2 r2 I1 r1 IV1
Deschampsia flexuosa r1 I1 II1 V3 V2 r2 r2 r2 IV1 II1 II2
Fagus sylvatica H r III1 II2 r rr r3
Vaccinium myrtillus I II2 IV2 IV2 V3 III1 r
Oxalis acetosella V3
Calluna vulgaris II I1 V3 V2 IV2 IV1 r5
Ulex europaeus r V3
Erica vagans I1 r2 r V2
Erica cinerea r r1 r IV2
Erica tetralix I1 III2 V2 V2 IV2
Molinia caerulea ssp caerulea III2 r2 V2 IV2 IV2
Viola palustris ssp palustris V2
Parnassia palustris r2 V2
Narthecium ossifragum r II2 IV2
Juncus acutiflorus II1 V3
Eriophorum angustifolium IV2 II2 IV2
Carex echinata IV2 III1 III2
Carum verticillatum I I III V1 II2
Wahlenbergia hederacea r1 II1 III2
Juncus effusus III2 II r r2 r1 II III2 V5 II3
Agrostis capillaris III2 V2 V2 V2 III2 V2 III2 II1 II2 III1 IV2 III1 II2
Pteridium aquilinum II r I1 II2 r1 r3 V4
Names are given according to the main featuring species (grey bars) Each elementary syntaxon is described by a specific list of species
(differential species in grey) Only the differential species are listed Relative frequency (RF) classes are indicated for each species in each
syntaxon r species represented in less than 10 of the releves or in a single releve I 105RF 520 II 20 5 RF 5 40 III 40
BRF 560 IV 60 BRF 580 V RF 80 Mean abundance-dominance values are also indicated according to the Braun-Blanquet
scale The syntaxa are H1 Urtica dioicaCirsium palustre H2 Rumex obtusifoliusPoa annua H3 Trifolium repensPoa annua H4 Rumex
acetosellaGalium saxatile H5 Potentilla erectaAgrostis curtisii H6 Vaccinium myrtillusDeschampsia flexuosa H7 Oxalis acetosella
Deschampsia fexuosa H8 Calluna vulgarisVaccinium myrtillus H9 Ulex europaeusCalluna vulgaris H10Molinia coeruleaErica tetralix
H11 Viola palustrisParnassia palustris H12 Juncus acutiflorusEriophorum angustifolium H13 Juncus effususAgrostis capillaris H14
Pteridium aquilinumAgrostis curtisii
96 The Holocene 16 (2006)
pastoral activities (grazing and trampling) On the negative
side of axis 3 sites from CoE No7 and 12 are related to low
grazing pressure
The investigated vegetation types represent the major
relevant gradients in the modern pollen data The first three
axes respectively correspond to CoE No 7 (dry heathland)
CoE No 12 (semi-open oak forest) and CoE No2 (overgrazed
community) These vegetation units are clearly related to the
degree of openness soil richness and grazing pressure respec-
tively Therefore in an attempt to identify indicator taxa for
each of these three ecological trends these coenotaxa were used
individually as main predictors in partial RDA The resulting
species scores were further considered variables in a principal
component analysis (PCA) In the ordination diagram (Figure
5) Ericaceae Erica tetralix Sanguisorba minor associated to
Poaceae are positively linked with the degree of openness As
expected Fagus and Pinus are related to forested sites Abies
and Plantago sp are also correlated to forested sites and soil
richness (more obvious on the plots of axes 1 and 3) The taxon
Potentilla type occurs mainly in wet conditions with Apiaceae
Other data show that Potentilla-type and Apiaceae are mainly
found in the peatbogs (Mazier et al unpublished data 2005)
Cichorioideae Ranunculaceae Stellaria-type Cirsium-type
Galium-type and Asteroideae are connected with the grazing
pressure whereas Chenopodiaceae Plantago lanceolata and
Plantago majormedia are negatively correlated to grazing
pressure
Urtica dioica Rumex Scrophulariaceae and Rubiaceae are
associated with soil richness Several taxa are found close to the
axes origin such as Rumex obtusifolius Artemisia Betula
Vaccinium-Rhododendron Lotus-type and Fabaceae This sug-
gests that these pollen taxa have little relationship to the
measured variables represented by the three selected coeno-
taxa Indeed they are commonly recorded in low abundance in
most of the sites and thus are not characteristic of the
investigated vegetation types
Discussion
Herb and tree pollen representationThe indices of Davis A O and U provide some basic
information on the general pollenvegetation relationships of
the mosaic vegetation of the Iraty Mountains such as heath-
land pastoral vegetation and oak and beech forest Table 3
presents the results of previous studies in particular of Bunting
(2003) and Hjelle (1997) who give indices for main taxa from
Scottish and Norwegian heath communities respectively
Potentilla-type and Poaceae are strongly associated and
Cirsium-type Pteridium aquilinum are weakly associated for
the three data sets Plantago majormedia has been found
unassociated and Plantago lanceolata over-represented in both
the Pyrenees and Scottish data sets These comparisons
indicate that these indices can be applied widely to different
regions and also to different habitats
Several taxa commonly used as anthropogenic indicator
taxa which were lightly or not at all investigated in the local
vegetation communities are recorded at low values in a very
high proportion (6090) of the surface samples such as
Artemisia Chenopodiaceae and Plantago lanceolata (the latter
observed three times in the 71 vegetation releves) This suggests
that sporadic low percentages of these taxa in palaeorecords
need not necessarily be indicative of local pastoral activity but
may originate from long-distance transport
Some discrepancies were observed between these three data
sets ie Calluna vulgaris which is strongly associated in Bunting
(2003) and associated in the Iraty data set (this study) and
the Vaccinium-type which is strongly associated in Scotland
and weakly associated in this study Apiaceae Rumex
Table 2 Synthetic presentation of the elementary coenotaxa that constitute the Iraty mountains pastoral landscape
Coenotaxon no 1 2 3 4 5 6 7 8 9 10 11 12 13
Number of phytocoenotic releves 3 3 3 4 6 9 15 4 6 7 6 4 1
H2 Rumex obtusifoliusPoa annua V4
H1 Urtica dioicaCirsium palustre V3
H3 Trifolium repensPoa annua V3 r2
H4 Rumex acetosellaGalium saxatile V4 V4 V2 r4
H13 Juncus effususAgrostis capillaris r4 V4 r4
H11 Viola palustrisParnassia palustris V3
H12 Juncus acutiflorusEriophorum angustifolium V4
H10 Molinia coeruleaErica tetralix IV2
H8 Calluna vulgarisVaccinium myrtillus r4 II4 r4 III4 r2 r3
H5 Potentilla erectaAgrostis curtisii V4 V3 r2 IV3
H9 Ulex europaeusCalluna vulgaris V3 V3
H14 Pteridium aquilinumAgrostis curtisii r5 r3 r2 I4 V4
H6 Vaccinium myrtillusDeschampsia flexuosa r3 r4 V2 V2 V2 r1 III2 V2
A15 Fagus sylvatica V4 V3 V3
B19 Fagus sylvatica V2 IV3
H7 Oxalis acetosellaDeschampsia flexuosa V2
A16 Quercus roburFagus sylvatica r2 III2
A17 Quercus robur III2
B21 Quercus roburFagus sylvatica r1 r3
B20 Fagus sylvaticaAbies alba V3
A18 Fagus sylvaticaAbies alba V4
Each coenotaxon (CoE) is described by a list of syntaxa numbered according to Table 1 for the herb layers (H 114) the tree (A 1518)
and shrub (B 1921) syntaxa are not presented in detail (see explanation in Table 1) The dominant SyE are listed (grey bars) The
coenotaxa are CoE 1 cattle enclosure CoE 2 overgrazed lawn CoE 3 overtrampled lawn CoE 4 grazed wet vegetation CoE 5 mire
vegetation CoE 6 heathland CoE 7 encroached heathland CoE 8 fern fallow CoE 9 open beech forest CoE 10 semi-open beech forest
CoE 11 dense beech forest CoE 12 semi-open oak forest CoE 13 isolated site
Florence Mazier et al Modern pollen assemblages from grazed vegetation western Pyrenees 97
Ranunculaceae are over-represented in Buntingrsquos data set and
weakly represented in this study while the Trifolium-type is
associated in Hjelle (1998) and weakly associated in this study
The dissimilarities between the three data sets might be
explained by differences in environmental factors between
regions such as climate edaphic conditions and land use
(Brostrom et al 2004) Grazing influence on flowering and
pollen production of grasses is well documented (Groenman-
van Waateringe 1993 Hjelle 1998) thus it may be that
Poaceae produce less pollen in anthropogenic coenotaxa
Another explanation may be the differences in pollen produc-
tion for species included in large taxonomic groups such as
Poaceae Apiaceae and Ranunculaceae (Brostrom 2004) A
further reason may be the differences in sampling design and in
method used for vegetation inventories (Bunting and Hjelle
unpublished data 2004)
Brostrom et al (2004) calculated relative pollen productivity
estimates (PPEs) for 11 herb taxa related to Poaceae (used as
reference taxon) and compared PPEs for herbs (Brostrom
et alrsquos study) and trees (data set of Sugita et al 1999) She
showed that most herb taxa have higher PPEs than Poaceae
for example Calluna vulgaris Rumex acetosa-type and Plantago
lanceolata It is outlined in many studies that the presence of
Plantago lanceolata in fossil pollen assemblages should be
interpreted with caution especially in pastoral areas on
crystalline substrate such as in our case This taxon is
characterized by long-distance transport and may originate
from a wider landscape for example from valley floors in our
case Cichorioideae and Cyperaceae have lower PPEs whereas
Potentilla-type and Rubiaceae (Galium-type) have relatively
higher PPEs than Poaceae (Brostrom et al 2004) We obtained
similar results showing that these taxa can be considered good
local indicators and are important in inferring past land uses
from local pollen diagrams Brostrom et al (2004) also showed
that most of the common tree taxa such as Pinus Quercus and
Fagus produce six to eight times as much pollen per unit area
as Poaceae This emphasizes the underestimation of past open
land from fossil records when translating the APNAP ratio
into open areas (Sugita et al 1999) The overestimation of
Pinus is well known (Heim 1970 Brostrom et al 1998 2004)
Pine is considered a high pollen producer and a long-distance
disperser which implies a significant regional input This
explains the important proportion of pine recorded in all the
71 surface samples Pinus presents high proportion in beech
forest and in fern fallow with dense canopy of Pteridium
aquilinum (Mazier et al unpublished data 2005) Pteridium
aquilinum forms a closed canopy at four sites grouped into the
CoE No 8 community dominated by Pteridium aquilinum and
Agrostis curtisı It is surprising that Pteridium spores were not
found in the pollen samples from these four sites whereas it
occurred in high proportion in one site of CoE No 9 (more
than 20) just before a small mountain dominated by this
species This may be due to preferential spore dispersal in
relation to prevailing winds The interpretation of Pteridium
occurrence in pollen diagrams should be interpreted with
caution (Tinsley 2001)
We must keep in mind that because of annual variability in
pollen productivity the use of moss polsters could be critical
when studying pollenvegetation relationships and identifying
pollen indicators of plant communities Interannual variation
in pollen productivity is well documented at least for tree taxa
and has been shown to be related to climatic variability (Hicks
2001 B Odgaard personal communication 2004) Moreover
the exact number of deposition years in a moss polster is not
known and differs from 1 to 10 years according to the authors
(Heim 1970 Bradshaw 1981 Cundill 1991 Rasanen et al
2004) Rasanen et al (2004) suggest that pollen assemblages in
the green part of moss polsters represent more than one but
less than two years of pollen deposition
Correlative model of pollenvegetationenvironment relationshipsWe focused on the pollenplantenvironment relationships as
explored by Redundancy Analysis (a detailed presentation of
A
U
O
ORT
ORT
PCA axis 1
PCA axis 2
Abies
Apiaceae
Asteroideae
Brassicaceae
Calluna
Campanulaceae
Caryophylaceae
Cichorioideae Cirsium type
Cyperaceae
Erica tetralix type
Ericaceae
Fagus
Galium type
Liliaceae
Poaceae
Polygala
Potentilla type
Pteridium
Quercus tot
Ranunculaceae
Rosaceae
Rumex acetosaacetosella
Rumex obtusifolius
Scrophulariaceae
Sorbus
Stellaria type
Trifolium
Ulex type
Urtica dioica
Vacciniumrhododendron
Plantago lanceolata
SAT
AT
Figure 3 Principal Component Analysis (PCA) using Davisrsquos indices of association (A) under-representation (U) and over-representation
(O) (Davis 1984) Groups according to the clustering are indicated with different symbols 1 2m 3 4 j 5 The eigenvalues of
the first three principal component axes are 0135 (559) 0099 (409) and 0008 (32) respectively
98 The Holocene 16 (2006)
the pollen-diagram will be published elsewhere Mazier et al
unpublished data 2005)
Advantage of a synusial approach for studying vegetationThe significant explanatory variables of the canonical axes
were edaphic conditions (total N loss on ignition pH)
geomorphology (aspect North linked to forested sites) plant
communities (CoE No 2 3 4 6 7 8 and 12) and land use
(grazing trampling) The results show that the vegetation units
under consideration which better reflect vegetation structure
than a classical releve can be used efficiently to explain the
major environmental gradients in pollen data Dry heathland
semi-open oak forest and overgrazed community best reflect
the gradients of landscape openness soil richness and grazing
pressure respectively RDA axis 1 separates open land from
beech sites (both lightly grazed) that are contrasted mainly on
the basis of Poaceae and Fagus Poaceae is mainly represented
in the CoE No 7 community a dry heathland corresponding
to an early succession stage of the Ulex europaeus invasion
Brostrom et al (1998) demonstrated that Poaceae may
be representative of all types of open land However this
study shows a difference in the proportion of Poaceae within
vegetation types induced by human activity since this
taxon decreases in both the overgrazed CoE No 3 and No 2
Table 3 Indices of association and representation from three different studies (this study Bunting 2003 and Hjelle 1997) based on the
classification of Bunting (2003)
Pollen taxon A U O Bunting (2003) Hjelle (1997)
Unassociated types (UT)
Anagallis 000 100 100
Centaurea jaceanigra 000 100 100
Fabaceae 000 100 100 UT
Ilex 000 100 100
Labiatae 000 100 100
Lotus-type 000 100 100 WAT
Parnassia-type 000 100 100
Plantago majormedia 000 100 100 no plant WAT
Strongly associated types (SAT)
Poaceae 096 001 003 SAT SAT
Cyperaceae 073 010 020 AT
Galium-type 072 022 010 Rubiaceae ORT AT
Potentilla-type 067 016 023 SAT AT
Associated types (AT)
Calluna 058 012 038 SAT ORT
Comp SF Cichorioideae 048 027 041 SAT
Over-represented types (ORT)
Abies 004 000 096
Urtica dioica 005 000 095 no plant no plant
Plantago lanceolata 006 000 094 ORT SAT
Brassicaceae 006 000 094 no plant WAT
Quercus tot 008 000 092
Fagus 038 000 062
Under-represented types (URT)
Sorbus 011 089 000
Weakly associated types (WAT)
Polygala 003 097 050 no pollen URT
Trifolium 006 093 080 SAT (Trifolium repens type)
Erica tetralix-type 016 082 044 SAT
Rumex obtusifolius 005 075 095 ORT (Rumex) no plant
Scrophulariaceae 019 074 057
Ulex-type 014 074 077
Campanulaceae 018 071 067 AT
Liliaceae 014 071 078 no plant
Rosaceae 002 067 098
Pteridium 020 061 071 WAT WAT
Cirsium-type 025 056 064 WAT WAT
VacciniumRhododendron 038 049 041 SAT (Vaccinium type) WAT (Vaccinium type)
Stellaria-type 033 047 053
Apiaceae 023 044 071 ORT SAT
Caryophyllaceae 016 044 081 no plant
Comp SF Asteroideae 023 037 074 AT (Achillea type)
Rumex acetosaacetosella 028 025 069 ORT (Rumex) SAT
Ranunculaceae 020 020 079 ORT (Ranunculus acris type) SAT (Ranuculus acris type)
Ericaceae 035 019 061
Indices of association (A) over-representation (O) and under-representation (U) for taxa present in both plant and pollen data sets Strongly
associated types A65 Associated types 50BAB65 Over-represented types low A values high O values and U0 Weakly
associated types low A values and relatively high values for both U and O Unassociated types A0 and high O and U values
Florence Mazier et al Modern pollen assemblages from grazed vegetation western Pyrenees 99
01 02
03
04
06
07
08
09
10
11
13
14
15
16
17
18
19
20
21
22
23
24
25
29
30
32
33
34 35
36
37
38
40
41
43
44
46
47
49
50
51
52
53
54
55
56
57
58 60
61
62
63
64
65
66
67
68
69
70
71
pH (KCL)
N tot loss on ignition
North
trampling
grazing trees
CoE 2
CoE 3
CoE 4
CoE 6
CoE 7
CoE 8
CoE 12
CoE 9
CoE 10
CoE 11RDA axis 1
RDA axis 2
01
02
03
04
06
07
08
09
10
11
13
14
15
16
17
18
19
20
21
22 23
24
25
29
30
32 33
34
35
36
37
38
40
41
43
44
46
47
49
50
51
52
53
54
55
56
57
58
60
61
62
63
64
65
66
67
68
69
70
71
pH (KCL)
N tot
loss on ignition
North
trampling grazing
trees
CoE2
CoE 3 CoE 4
CoE 6
CoE 7
CoE 8
CoE 12
CoE 9
CoE 10
CoE 11
RDA axis 1
RDA axis 3
(a)
(b)
Figure 4 Redundancy analysis (RDA) of the modern pollen assemblages using 13 explanatory variables (nominal variables are given
with their centroıds (crosses) and quantitative variables with arrows) four passive variables (italic) and 61 pollen samples (points) The
three first axes explain respectively 179 62 and 54 of the total variation in the modern pollen data and are all significant (PB0001 after
999 permutations) The vegetation types ie elementary Coenotaxa (CoE) are k CoE2 ^ CoE3 m CoE4 2 CoE6 CoE7
CoE8 CoE910 j CoE11 CoE12 (a) Sites scores and environmental variables on RDA axes 1 and 2 (b) Site scores and
environmental variables on RDA axes 1 and 3
100 The Holocene 16 (2006)
communities Nevertheless the proportion of Poaceae is not
the same in CoE No 2 an overgrazed pasture and CoE No 4
grazed wet vegetation The integrated synusial approach
provides some explanation for these dissimilarities between
pastoral communities Poaceae was mainly recorded in CoE
No 4 and 7 and indeed this may be explained by the presence
of patches of Juncus effusus (CoE No 4) and Ulex europaeus
(CoE No 7) both of which protect herbs from grazing thus
allowing the flowering of the grasses Alternatively another
factor might be the animalsrsquo preference for some species This
seems to be verified for Poa annua the main species in CoE
No 2 that has a higher pastoral value and a higher appetency
as compared with Agrostis curtisı Another explanation might
be the differences in pollen productivity of the various species
included in this large taxonomic group High grazing pressure
induces a specific community such as CoE No 2 which
presents patches of syntaxon H4 (Rumex acetosellaGalium
saxatile) on nearly bare soils and syntaxon H3 (Trifolium
repensPoa annua) in densely grazed micro-sites This coeno-
taxon seems to be the most reliable analogue for intensive
pastoral activity On the other hand CoE No 7 can be used as
an analogue for extensive pastures and CoE No 9 10 or 11 for
deciduous mainly beech forest CoE No 6 provides a
situation of transition between extensive and intensive pas-
tures CoE No 3 and 4 are more related with the soil richness
which may derive from grazing pressure
Pollen indicators of pastoral activitiesIn the PCA analysis based on the three vegetation predictors
CoE No 7 12 and 2 Cichorioideae Ranunculaceae Stellaria-
type Cirsium-type Galium-type Asteroideae and to a lesser
extent Potentilla-type are strictly related to grazing pressure
Similar results were obtained in northern Europe (Hicks 1988
Gaillard et al 1992 1994 Hjelle 1998 1999ab Rasanen
2001) It was found that Cichorioideae (Hjelle 1999a)
Cirsium-type (Hjelle 1998) Galium-type (Gaillard et al
1992) Potentilla-type (Gaillard et al 1992 Hjelle 1999a)
and Ranunculaceae (Hjelle 1999a) were characteristic of
grazing In this study Plantago lanceolata Chenopodiaceae
and Plantago majormedia the last two taxa being absent from
the vegetation are more common in sites on aspects N and
NW and occur mainly in lightly grazed wooded sites Their
presence is related to the prevailing wind which brings pollen
from a wider landscape Gaillard et al (1992) showed that
Plantago lanceolata is a mowing indicator in southern Sweden
According to Hicks and Birks (1996) Chenopodiaceae and
Rumex acetosaacetosella are related to human settlements
This may apply in our case for Rumex acetosaacetosella since
this taxon was present in tracks andor in the ploughed soils of
CoE No 3 but generally it was recorded sporadically in
modern pollen assemblages and therefore cannot be a good
pastoral indicator In our case the presence of the taxa
Chenopodiaceae Plantago lanceolata and Artemisia implies
regional input
Urtica dioica is related to soil richness (total N and loss on
ignition) and does not constitute a strict pastoral indicator
(Gaillard et al 1992) at least when low values are recorded
(Mazier et al unpublished data 2005) It is found in surface
samples from enclosures but the plant often grows outside
where dung has accumulated near stone walls
Conclusion
(1) The correlative model RDA of 61 modern pollen spectra
and 35 external variables shows that wooded opened grazed
and nitrophilous sites are clearly separated from each other
The relevant variables are vegetation types CoE No 7 (dry
heathland) CoE No 12 (semi-open oak forest) and CoE No 2
(overgrazed community) These vegetation units are clearly
related to degree of openness soil richness and grazing
pressure respectively Therefore the synusial integrated ap-
proach does provide a robust method for assessing vegetation
structure and links between different patches (herbs shrubs
and trees) and also for relating modern pollen assemblages to
environmental conditions
(2) The present study implies that when reconstructing past
pastoral activity it is important to identify the scale
of the landscape in question In our case Artemisia Cheno-
podiaceae Plantago lanceolata and Plantago majormedia
indicate regional human activity and are not characteristic
OPENNESS
GRAZING
PRESSURE
PCA axis 1
PCA axis 2
SOIL RICHNESS
Aln
Cor
Fag
Pin
Poa
Pla- lan
Cal
Ran
Abi
Ros
Fra
Que- tot
Bra
Gal
Pla
Urt- dio
Art
Bux
Che
Api
Bet
Eri
Car
Vac- rho
Ast
Rub
Cic
Pot- typ
Rum- ace
Sal
Rum
Jun
Rha
Ulm
Fab
Ste- typ
Lil
Rum- obt
Scr
Pla- med
Cir- typ
Ile
Lot- typ
Lab
Ace
Eri- tet
Ech
Ule- typ
Amb- typ
Cam
San- min
Cen- jac Hel
Til
Tha Tri
Mel
-158
-16
7
169
28
0
Figure 5 Principal Component Analysis (PCA) using the scores of
a separate RDA with coenotaxa CoE No 7 (dry heahland)
indicative of vegetation openness CoE No 12 (semi-open oak
forest) indicative of low soil richness and CoE No 2 (overgrazed
community) indicative of high grazing pressure Axis 1 and 2
represent 85 of the total variance Abbreviations Abi Abies
Ace Acer Aln Alnus Amb-typ Ambrosia-type Api Apiaceae
Art Artemisia Ast Asteroideae Bet Betula Bra Brassicaceae
Bux Buxus Cal Calluna Cam Campanulaceae Car Caryophyl-
laceae Cen-jac Centaurea jacea Che Chenopodiceae Cic
Cichoriodeae Cir-typ Cirsium-type Cor Corylus Ech Echium
Eri Ericaceae Eri-tet Erica tetralix Fab Fabaceae Fag Fagus
Fra Fraxinus Gal Galium-type Hel Helianthemum Ile Ilex
Jun Juncus Lab Labiateae Lil Liliaceae Lot-typ Lotus type
Mel Melampyrum Poa Poaceae Pla Plantago Pla-lan Plantago
lanceolata Pla-med Plantago majormedia Pin Pinus Que-tot
Quercus total Pot-typ Potentilla type Ran Ranunculaceae Rha
Rhamnus Rub Rubiaceae Rum Rumex Rum-ace Rumex
acetosaacetosella Rum-obt Rumex obtusifolius Ros Rosaceae
Sal Salix San-min Sanguisorba minor Scr Scrophulariaceae
Ste-typ Stellaria type Til Tilia Ulex-typ Ulex type Ulm Ulmus
Urt-dio Urtica dioica Vac-rho VacciniumRhododendron
Florence Mazier et al Modern pollen assemblages from grazed vegetation western Pyrenees 101
of specific land use whereas the simultaneous presence in
pollen assemblages of Asteroideae Cichoriodeae Cirsium-
type Galium-type Ranunculaceae Stellaria-type and Poten-
tilla-type is clearly associated with grazing on a local scale
Calculation of Davis indices also shows that Cichorioideae
Galium-type and Potentilla-type indicate very local presence of
the corresponding plants However such pastoral indicators
might be valid only for crystalline bedrock and for this
mountainous region
(3) The final aim of our project is to achieve a more precise
reconstruction of the cultural landscape in this mountainous
area on a local scale comparing the modern pollen assem-
blages to local fossil pollen assemblages from a small bog
(Galop et al 2003 Mazier et al unpublished data 2005)
Thanks to the interdisciplinary research programme lsquoPalaeo-
environment and dynamics of human activities in the Pyrenees
Mountainsrsquo this site is now also well documented in micro-
fossil historical and archaeological data All these data sets
will be used to validate the results of the comparative
approach
Acknowledgements
This study was possible thanks to the help of a number of
people to whom we are very grateful Didier Galop for pollen
analysis Cecile Brun for her precious assistance and encour-
agement during fieldwork Pascal Vittoz and Francois Gillet
for their advice on the integrated synusial approach and
vegetation analysis Jean-Daniel Tissot for computer program-
ming Anne Vignot for her permanent encouragement and
Isabelle Jouffroy for guidance in the use of the End-note
software Christine Rendu and her archaeological staff One-
sime Prudhom and Bertrand Lagoguet provided cheerful
fieldwork Thanks are due to Kari Hjelle for advice and
corrections on the Davis Indices and to John Olsen for his
improvement of the English text The manuscript was im-
proved thanks to the helpful comments and suggestions from
the two referees Sheila Hicks and Marie-Jose Gaillard This
investigation is a contribution to the project of the collective
research program lsquoPaleoenvironnement et dynamiques de
lrsquoanthropisation en montagne basquersquo (Ministry of Culture
and SRA Aquitaine) and the ATIP-CNRS lsquoPaleoenvironne-
ment et Archeologie pastoralersquo
References
Anderson JM and Ingram JSI 1993 Tropical soil biology and
fertility A handbook of methods 2nd edition CAB International
Behre KE 1981 The interpretation of anthropogenic indicators
in pollen diagrams Pollen et Spores 23 22545
Berglund BE and Ralska-Jasiewiczowa M 1986 Pollen analysis
and pollen diagrams In Berglund BE editor Handbook of
Holocene palaeoecology and palaeohydrology John Wiley amp Sons
Ltd 155484
Berglund BE Persson T Emanuelsson U and Persson S 1986
Pollenvegetation relationships in grazed and mowed plant
communities of South Sweden In Behre K-E editor
Anthropogenic indicators in pollen diagrams Balkema 3751
Boyd WE 1986 The role of mosses in modern pollen analysis the
influence of moss morphology on pollen entrapment Pollen et
spores XXVIII 24356
Bradshaw RHW 1981 Modern pollen representation factors for
woods in South-West England Journal of Ecology 69 4570
Braun-Blanquet J 1964 Pflanzensoziologie Grundzuge der
Vegetationskunde Springer 865
Brostrom A Gaillard M-J Ihse M and Odgaard B 1998
Pollenlandscape relationships in modern analogues of ancient
cultural landscapes in southern Sweden a first step towards
quantification of vegetation openness in the past Vegetation
History amp Archaeobotany 7 189201
Brostrom A Sugita S and Gaillard M-J 2004 Pollen
productivity estimates for the reconstruction of past vegetation
cover in the cultural landscape of southern Sweden The Holocene
14 36881
Bunting MJ 2003 Pollenvegetation relationships in
non-arboreal moorland taxa Review of Palaeobotany and
Palynology 125 28598
Casgrain P and Legendre P 2001 The R package for multivariate
and spatial analysis version 40 (development release 6) userrsquos
manual Universite de Montreal 134
Court-Picon M Buttler A and de Beaulieu J-L 2005 Modern
pollenvegetation relationship in the Champsaur valley (French
Alps) and their potential in the interpretation of fossil pollen
records of past cultural landscapes Review of Palaeobotany and
Palynology 135 13
Cundill PR 1991 Comparisons of moss polster and pollen trap
data a pilot study Grana 30 301308
Davis OK 1984 Pollen frequencies reflect vegetation patterns in
a Great Basin (USA) mountain range Review of Palaeobotany and
Palynology 40 295315
Faegri K and Iversen J 1989 Textbook of pollen analysis John
Wiley 328 pp
Gaillard M-J Birks HJB Emanuelsson U and Berglund BE
1992 Modern pollenland-use relationships as an aid in the
reconstruction of past land-uses and cultural landscapes an
example from south Sweden Vegetation History and
Archaeobotany 1 317
Gaillard M-J Birks HJB Emmanuelson U Karlson S
Lageras P and Olausson D 1994 Application of modern
pollenland-use relationships to the interpretation of pollen
diagrams reconstruction of land-use history in south Sweden
30000 Review of Palaeobotany and Palynology 82 4773
Gaillard M-J Birks HJB Karlsson S and Lageras P 1997
Quantitative reconstruction of past land-use and soil conditions
using the modern analogue approach a case study in southern
Sweden PACT 50 43142
Galop D 1998 La foret lrsquohomme et le troupeau dans les
Pyrenees 6000 ans drsquohistoire de lrsquoenvironnement entre Garonne et
Mediterranee Contribution palynologique GEODE Laboratoire
drsquoecologie terrestre Framespa 285 pp
Galop D Mazier F Lopez-Saez J-A and Vanniere B 2003
Palynologie et histoire des activites humaines en milieu
montagnard Bilan provisoire des recherches et nouvelles
orientations methodologiques sur le versant nord des Pyrenees
Archeologie du midi medieval 21 15970
Galop D Rendu C Barcet H Buttler A Campnajo P Cugny
C Gauthie E Legaz A Lopez-Saez JA Mazier F Metailie
JP Dominique S and Vannıere B 2004 Paleoenvironenment et
archeologie pastorale Propositions methodologiques pour une
approche integree des modalites du lrsquoanthropisation en haute
montagne pyreneenne du Neolithique a lrsquoactuel Besancon UMR
6565 CNRS-Universite de Franche-Cormte 70 pp unpublished
Gillet F and Gallandat J-D 1996 Integrated synusial
phytosociology some notes on a new multiscalar approach to
vegetation analysis Journal of Vegetation Science 7 1318
Gillet F De Foucault B and Julve P 1991 La phytosociologie
synusiale integree objets et concepts Candollea 46 31540
Gillet F Besson O and Gobat J-M 2002 PATUMOD a
compartment model of vegetation dynamics in wooded pastures
Ecological Modelling 147 26790
Groenman-van Waateringe W 1993 The effect of grazing on the
pollen production of grasses Vegetation History and
Archaeobotany 2 15762
Heim J 1970 Les relations entre les spectres polliniques recents et
la vegetation actuelle en europe occidentale Doctoral Thesis
Universite de Louvain 179 pp
Hicks S 1988 The representation of different farming practices in
pollen diagrams from northern Finland In Birks HH Birks
102 The Holocene 16 (2006)
HJB Kaland P and Dagfinn M editors The cultural landscape
past present and future Cambridge University Press 189207
Hicks S 2001 The use of annual arboreal pollen deposition
values for delimiting tree-lines in the landscape and exploring
models of pollen dispersal Review of Palaeobotany and Palynology
117 129
Hicks S and Birks HJB 1996 Numerical analysis of modern
and fossil pollen spectra as a tool for elucidating the nature of
fine-scale human activities in boreal areas Vegetation History and
Archaeobotany 5 25772
Hicks S Tinsley H Huusko A Jensen C Hattestrand M
Gerasimides A and Kvavadze E 2001 Some comments on spatial
variation in arboreal pollen deposition first records from the
Pollen Monitoring Programme (PMP) Review of Palaeobotany and
Palynology 117 18394
Hjelle KL 1997 Relationships between pollen and plants in
human-influenced vegetation types using presence-absence data in
Western Norway Review of Palaeobotany and Palynology 99 116____ 1998 Herb pollen representation in surface moss samples
from mown meadows and pastures in Western Norway Vegetation
History and Archaeobotany 7 7996____ 1999a Modern pollen assemblages from mown and grazed
vegetation types in western Norway Review of Palaeobotany and
Palynology 107 5581____ 1999b Use of modern pollen samples and estimated pollen
representation factors as aids in the interpretation of cultural
activity in local pollen diagrams Norwegian Archaeological Review
32 1939
Leps J and Smilauer P 2003 Multivariate analysis of ecological
data using CANOCO Cambridge University Press 282 pp
Moore PD Webb JA and Collinson ME 1991 Pollen analysis
Blackwell Science 216 pp
Rasanen S 2001 Tracing and interpreting fine-scale human
impact in northern Fennoscandia with the aid of modern pollen
analogues Vegetation History and Archaeobotany 10 21118
Rasanen S Hicks S and Odgaard BV 2004 Pollen deposition
in mosses and in a modified lsquoTauber traprsquo from Hailuoto Finland
what exactly do the mosses record Review of Palaeobotany and
Palynology 129 10316
Reille M 1992 Pollen et spores drsquoEurope et drsquoAfrique du Nord
Laboratoire de Botanique Historique et Palynologie 535 pp
Sugita S Gaillard M-J and Brostrom A 1999 Landscape
openness and pollen records a simulation approach The Holocene
9 40921
Ter Braak CJF and Prentice CI 1988 A theory of gradient
analysis Advances in Ecological Research 18 271317
Ter Braak CJF and Smilauer P 1998 CANOCO Reference
manual Userrsquos Guide to Canoco for Windows Software for
canonical community ordination (version 4) Centre for Biometry
Wageningen 352 pp
Tinsley H 2001 Modern pollen deposition in traps on a transect
across an anthropogenic tree-line on Exmoor southwest England
a note summarising the first three years of data Review of
Palaeobotany and Palynology 117 15358
Tutin TG Heywood VH Burges NA Valentine DH
Walters SM Webb DA and with the assistance of Ball
PWaC A O 19641980 Flora Europea Cambridge
University Press
van der Knaap WO van Leeuwen JFN and Ammann B 2001
Seven years of annual pollen influx at the forest limit in the Swiss
Alps studied by pollen traps relations to vegetation and climate
Review of Palaeobotany and Palynology 117 3152
Vorren K-D 1986 The impact of early agriculture on the
vegetation of Northern Norway A discussion of anthropogenic
indicators in biostratigraphical data In Behre K-E editor
Anthropogenic indicators in pollen diagrams Balkema 118
Wildi O and Orloci L 1996 Numerical exploration of community
patterns Amsterdam SPB Academic Publishing 171 pp
Wright HEJ 1967 The use of surface samples in quaternary
pollen analysis Review of Palaeobotany and Palynology 2 32130
Florence Mazier et al Modern pollen assemblages from grazed vegetation western Pyrenees 103
Modern pollen assemblages from grazed
vegetation in the western Pyrenees
France a numerical tool for more precise
reconstruction of past cultural landscapes
Florence Mazier1 Didier Galop1 Cecile Brun1 andAlexandre Buttler12
(1Laboratoire de Chrono-Ecologie UMR 6565 CNRS Universite de Franche-Comte 16 route de Gray F-25030 Besancon Cedex France 2Laboratoire desSystemes ecologiques ECOS Ecole polytechnique federale de Lausanne (EPFL)et Institut federal de recherches WSL Antenne romande Case postale 96 CH-1015Lausanne Switzerland)
Received 11 May 2005 revised manuscript accepted 27 July 2005
Abstract Modern pollen assemblages from grazed vegetation in the Pyrenees Mountains (France) were
studied with the aim of providing a calibrated model for reconstructing past pastoral activities The
modern analogues were selected to cover the major gradients of grazing pressure and degree of openness
The vegetation was surveyed by means of the synusial integrated method assessing the structure and the
patchiness of the pastoral phytoceonoses A correlative model (Redundancy analysis) was devised relating
61 modern pollen spectra with 37 explanatory vegetation and land-use variables It was shown that
wooded open grazed and nitrophilous sites are clearly separated from one another and that the model can
be simplified using three relevant vegetation types as explanatory variables dry heathland semi-open oak
forest and overgrazed community respectively related to gradients of openness soil richness and grazing
pressure When reconstructing past pastoral activities with fossil pollen spectra it is important to consider
scale-dependent influences of plant species Low frequencies of well-dispersed taxa such as Artemisia
Chenopodiaceae Plantago lanceolata and Plantago majormedia must be interpreted with care since they
reflect more regional rather than local input into the pastoral landscape In contrast the simultaneous
occurrence of Asteroideae Cichorioideae Cirsium-type Galium-type Ranunculaceae Stellaria-type and
Potentilla-type pollen is clearly related to grazing on a local scale Calculation of Davis indices also shows
that Cichorioideae Galium-type and Potentilla-type indicate the very local presence of the corresponding
plants These pastoral plant indicators may have a limited geographical validity ie mountainous regions
with crystalline bedrock which may indeed also provide the framework for the application to fossil spectra
of the modern pollenvegetationland-use models presented here
Key words Integrated synusial approach modern pollen vegetation history land use pastoral indicators
scale numerical analyses western Pyrenees France
Introduction
The reliability of pollen analysis as a tool for the reconstruction
of past vegetation depends on good calibration between
present pollen deposition and vegetation and on the precise
understanding of how current species composition is reflected
in pollen assemblages In attempting to evaluate not only
human presence but also the nature extent and duration of
human activity it is important to be able to recognize which
specific plant community or individual taxon is representative
of a certain type of land use such as cultivation pasturing
trampling and human settlement or mowing
The interpretation of anthropogenic activity in pollen
diagrams relies on several complementary approaches The
most common approach is the lsquoindicator speciesrsquo approach
which uses the ecological characteristics of different speciesAuthor for correspondence (e-mail florencemazieruniv-fcomtefr)
The Holocene 161 (2006) pp 91103
2006 Edward Arnold (Publishers) Ltd 1011910959683606hl908rp
especially those favoured by human activity and today found
mainly in human-induced vegetation types (Behre 1981
Vorren 1986 Hicks 1988) Another interpretation tool is the
lsquocomparative approachrsquo comparisons of modern and fossil
pollen spectra using all taxa therefore a community-based
approach (Wright 1967) A wide range of communitiespollen
assemblages is needed to increase our understanding of past
landscapes and past land-use changes In northern Europe
modern pollen assemblages and related vegetation as well as
land-use data have been used to provide a basis for numerical
comparisons (Berglund and Ralska-Jasiewiczowa 1986
Berglund et al 1986 Gaillard et al 1992 1994 Hicks and
Birks 1996 Hjelle 1999a Rasanen 2001) These studies
identified pollen assemblages and taxa indicators of various
human-induced vegetation types Despite these valuable con-
tributions to the interpretation of pollen diagrams the pollen
vegetationland-use relationships found in northern Europe are
not necessarily applicable in other areas such as the mountai-
nous regions of Mediterranean Europe (Galop 1998 Galop et
al 2003 Court-Picon 2005) Many pollen diagrams from the
western Pyrenees Mountains have been produced recently
(Galop 1998 Galop et al 2003) but no reconstruction of
past vegetation or landscape units by means of comparisons
of modern and fossil pollen spectra has been attempted so far
Therefore the objectives of the present study in the Pyrenees
Mountains were
to investigate pollen representation of trees and herbs in
modern pollen assemblages from characteristic vegetation
types
to assess the major gradients in modern pollen assemblages
and relate these to measured environmental variables
to test whether different vegetation types with their specific
vegetation structure as described by the integrated synusial
approach can be used efficiently to express the vegetation
pollen relationship
to establish whether various degrees of openness and
grazing pressure produce significantly distinct modern
pollen spectra and to identify pollen taxa characteristics
of pastoral activities
The comparative approach requires a search for modern
analogues of past landscapes and vegetation communities
Owing to the elevation and the steep slopes grazing seems to
have always been the main land-use practice in the Iraty
Mountains of the Basque Country Today farmers maintain
traditional land-use practices based on transhumance from the
valley to the summer pastures The main activity is sheep
raising for milk and cheese This production system necessi-
tates for each shepherd and his flock small enclosures for
gathering the herd a milking corridor a hut for cheese
production and specific patches in summer pastures It also
calls for extensive and intensive pastures some with forested
areas and some treeless
The modern analogues used for establishing the pollenland-
use relationship should present as far as possible ecological
conditions similar to those prevailing in the past (Gaillard et
al 1992) Moss polsters are commonly used as surface samples
for local modern pollen deposition (Gaillard et al 1992 Hicks
and Birks 1996 Hjelle 1998) They are assumed to record an
average of several years of pollen deposition (Bradshaw 1981
Heim 1970) which is recommended since previous investiga-
tions have shown annual variation in pollen productivity
(Hicks 2001 Hicks et al 2001 van der Knaap et al 2001
Rasanen et al 2004) Moreover the modern pollen assemblage
should be a good analogue of a fossil pollen assemblage which
usually covers more than one year of pollen deposition
However contradictory views exist as to the timespan of
pollen deposition covered by mosses (Cundill 1991 Rasanen
et al 2004)
Methods
Study area and sampling designThe data presented in this study were collected within the
interdisciplinary research programme lsquoPalaeo-environment
and dynamics of human activities in the Pyrenees Mountainsrsquo
(Galop et al 2004) A field site for the programme was
selected in the Iraty Mountains in the Basque Country
(western part of the Pyrenees chain in southern France) and
lies between 700 and 1500 m asl The silicate bedrock and
acidic soils present there induce abundant peat deposits in
small basins
The landscape is hilly and characterized by a mosaic of
vegetation types variously affected by pastoral activity On
sloping grounds the vegetation is dominated by heather
moorland of Calluna vulgaris Erica sp Molinia coerulea and
patches of Ulex europaeus and Pteridium aquilinum still used
for animal litter Some slopes especially the steepest ones are
dominated by deciduous forest patches of beach and oak
Intensive grazed pastures are prevalent on the smooth
mountain crests
Our investigations focused on a small watershed centred on
the topogenic Sourzayrsquos peat bog with the aim of investigating
modern pollenvegetation and pollenland-use relationships in
a mosaic pasturewoodland landscape and to use these
relationships in the interpretation of fossil pollen records
from the same area The modern analogues were selected
near the fossil sequence to assess the effect of the vegetation
structure on the pollen record For collection of the modern
pollen and related vegetation data a preferential design was
selected with stratification based on degree of landscape
openness and current land use along four axes across
the watershed and centred on the fossil pollen record site
(Figure 1) Thus the major relevant vegetation communities
and gradients of grazing pressure from open to forested areas
were covered The transects were chosen so as to exclude as
much as possible any areas disturbed by thalwegs streams and
human activities other than pastoral ones Some relevant
vegetation types such as grazed oak forests or enclosures
were absent from the study site The modern analogue data set
was therefore completed outside the watershed
Field method
Vegetation dataA set of 71 vegetation releves from various forest types (oak
beech) heath and wet vegetation communities was collected
from both grazed and ungrazed areas during the summer of
2001 Vegetation analysis was undertaken according to the
integrated synusial approach (Gillet et al 1991 2002 Gillet
and Gallandat 1996) which is a method based on the
Braun-Blanquet approach (Braun-Blanquet 1964) but allows
better structural description and characterization of plant
communities in their landscape context (Figure 2) This
method aims at
describing complex vegetation structures taking into
account both horizontal and vertical heterogeneity
emphasizing functional and dynamic links between various
constituent elements among several spatio-temporal orga-
nization levels
92 The Holocene 16 (2006)
Only two levels were considered in this study those of the
synusia and the phytocoenosis The synusia is an elementary
one-layered concrete vegetation unit (patch) directly linked to
uniform environmental conditions Thus every synusia is a
floristically physiognomically and ecologically homogeneous
vegetation unit In the field several vegetation stands were
divided vertically and horizontally into synusiae each therefore
undergoing sampling for a floristic releve The synusial releve
furnishes a semi-quantitative description according to Braun-
Blanquet (1964) of the species occurring in the sample patch
Synusiae are organized in space and in time within phytocoe-
nosis as elements of a mosaic or a zoning of stratal
communities (Gillet and Gallandat 1996) Thus a phytocoe-
nosis is a complex of synusiae (herb shrub and tree synusiae)
functionally strongly linked in both space (mosaics stratifica-
tion) and time A phytocoenotic releve also furnishes a semi-
quantitative description of the synusiae observed in a concrete
phytocoenosis The investigated sites presented homogeneous
vegetation (floristically and structurally) on a minimal surface
of 100 m2 (not necessarily a square) which was the surveyed
surface for each phytocoenosis Vascular plant nomenclature
follows Tutin et al (19641980)
Sampling of moss polstersIn the present study moss polster samples were taken down to
but not including the soil and collected at the end of the
flowering season September 2001 (Rasanen et al 2004) Moss
species vary from site to site but whenever possible species
producing dense life forms were chosen (Boyd 1986) For the
wet sites Sphagnum sp was the only available species and the
upper green part (the first 4 cm) was collected
For each phytocoenosis and on the entire surface of the
vegetation releve ten mosses were sampled and mixed together
into one sample per site (Gaillard et al 1992)
Environmental variablesThe sampling sites were classified into categories according to
the degree of grazing dunging and trampling pressure
assessed as the proportion of the surveyed surface showing
signs of recent cattle activity On an ordinal scale classes
ranged from 0 to 3 as follows (0) no pressure (1) pressure
B5 of the surface (2) pressure between 5 and 50 of the
surface (3) pressure 50 of the surface Livestock type
(absencepresence nominal variable) was also taken into
Figure 2 Schematic representation of the two integration levels
used for vegetation description according to the integrated
synusial method (adapted from Gillet and Gallandat 1996)
0101
0202
0303
0404
05050707
0808
06060909
1010
1111
11b11b
1212
1313
14141515
16161717
1818
19192020
2121
22222323
2424
2525
2626
2727 2828
2929
3030
3232
3434
35353737
3636
3838
3939
4040
4141 4242
4343
4444
4545
4646
47474848
4949
5050
51515252
5353
5454
5555
5656
5757
5858
59596060
6161
6262
6363
6464
6565
3333
6666
67676868
6969
7171
7070
7272
7373
3131
5353
1050
950
1050
1150
1250
850
1050
950
850
950
1050
11501250
Col Curutche
1391
Pic dArthaburu
1156
1150
Sommet
dOccabeacute
1466
Col de
Burdincurutcheta
1338
1250
1350
1350
Iraukotuturru
750 850 950 1050 1150 1250 1350 1450 15500 1000m
N
Cabanes
dArtxilondo
Cabanes
dApatessaro
pollen surface sample
moss polstersSourzays peat bog
Elevation (m)Study
area
Figure 1 The study area in southern France and the Iraty mountains of the Pays Basque Location of the 71 modern analogues (solid circles)
where pollen samples (moss polsters) and related vegetation data were collected In the vicinity of the fossil pollen sequence (Sourzayrsquos peat
bog) the modern analogues are located along four transects with a stratification based on the degree of grazing and openness
Florence Mazier et al Modern pollen assemblages from grazed vegetation western Pyrenees 93
account designated as sheep horse cow or pig since livestock
in this region was not mixed for all 71 sites The altitude slope
(quantitative variables) aspect nature of bedrock (absence
presence nominal variable) were measured or identified for
each phytocoenosis The aspect was transformed into a
quantitative variable based on a trigonometric measure for
both the north and east scales (eg for the N-NE aspect the
measure on the north scale was sin 675092 and on east
scale cos 675038) In order to investigate how variation in
the pollen data might be explained by the main gradients in the
vegetation data phytocoenosis typology was used providing
explanatory qualitative variables Each plant community 13 in
all was expressed as a presenceabsence nominal variable
For each phytocoenosis mean soil depth (ten measures
taken randomly spread over the surveyed surface) was
measured and soil samples were taken from the top 10 cm of
soil which corresponded to the A horizon homogenized and
pooled into one sample per surveyed surface (Gaillard et al
1992 1997) A subsample was then air dried The fraction ()
of coarse material (2 mm) was determined by the sieving
procedure The fresh sample was used for pH (KCl) and pH
(H2O) measurements Organic matter () derived from the ash
content and total N () were analysed These classical
methods followed standard procedures (Anderson and Ingram
1993) The water-holding capacity was obtained by saturating
the soil sample over 96 hours removing the excess water by
filtration and oven drying the sample The potential water
content ( of dry soil) was obtained by the weight difference
between saturated and dry soil
Altogether 37 explanatory variables were recorded and
divided into five general categories edaphic geologic geo-
morphologic land use and vegetation variable types
Laboratory methodsMoss samples were treated according to standard procedures
(Faegri and Iversen 1989) by boiling in 10 NaOH for 45 min
sieving treating with 40 HF (to digest fine silica) ZnCl2 (to
eliminate clay material) and acetolysis (one part H2SO4 and
nine parts acetic anhydride heated in water bath for 8 min)
Samples were mounted in glycerol and pollen were identified
to the most precise taxonomic level possible using pollen keys
(Faegri and Iversen 1989 Moore et al 1991 Reille 1992)
As the focus of this study is the effect of the vegetation
structure on the pollen assemblages pollen from trees dwarf-
shrubs and herbs were thus included in the analysis A
minimum of 400 pollen grains was counted per sample and
a total of 113 pollen and spore taxa were recorded Moreover
as one of the main goals was to investigate the plantpollen
relationships on a local scale some taxa were excluded from
the pollen sum Only pollen taxa of plants potentially present
in the flora of the region were included in the analysis For
example pollen of Olea was excluded and considered exogen-
ous as it comes from cultivated areas in Spain far from the
study area The calculation sum used to obtain percentages of
the pollen taxa in numerical analyses excludes exogenous and
aquatic taxa as well as fern spores In all 28 taxa were
excluded Thus the modern pollen data set consists of 71
samples and 85 pollen taxa
Data analysis
Vegetation typologyThe vegetation was described through examination of 71
phytocoenotic releves and 256 synusial releves among these
phytocoenoses Synusial typology was first carried out based
on the comparison and classification of the synusial releves
using floristic-statistical tools to identify syntaxa (typological
units of this organization level) These tools combine step by
step various applications such as ordinations and clustering
using different options of the package MULVA-5 (Wildi and
Orloci 1996) The analytical procedure was performed sepa-
rately on the data of each layer herb shrub and tree The
optimal number of groups of releves and species was deter-
mined by comparing the results of the various classifications
using criteria such as concentration analysis and contingency
coefficient provided in the package The phytocoenotic releves
were compared using the same numerical tools and classified
into coenotaxa (typological units of this organization level)
Association and representation indicesIn order to understand the pollenplant relationships at the
taxonomic level used for pollen analysis plant taxa were
grouped according to pollen morphological types For the
vegetation the species list was first derived from all the
synusial releves included in each phytocoenotic releve Taxa
occurring only as plants or only in the pollen assemblages were
excluded from the calculation of the Davis indices of associa-
tion (A) under-representation (U) and over-representation (O)
(Davis 1984 Hjelle 1997 Bunting 2003) These indices are
based on presenceabsence data of the taxon list and are
defined as follows
AB0(P
0P
1B
0)1
UP1(P
1B
0)1
OP0(P
0B
0)1
Where B0 is number of samples in which both the pollen type
and its associated plant are present P0 is number of samples in
which the pollen type is present in the surface sample but not
the plant taxa and P1 is number of samples in which the pollen
type is not present in the surface sample but the plant taxa is
present in the vegetation
Ordination by principal component analysis (PCA) was used
to display the relationship between the calculated indices (A
U O as descriptors) and the pollen taxa (objects) PCA used a
covariance matrix with the eigenvectors adjusted by variance
The taxa were then classified into groups using agglomerative
hierarchical clustering with proportional-link linkage and a
connection of 07 Euclidian distance was used PCA and
cluster analysis were implemented respectively by the
CANOCO program for Windows 40 (Leps and Smilauer
2003 Ter Braak and Smilauer 1998) and Progiciel R (Casgrain
and Legendre 2001)
Pollenvegetationenvironment relationshipsDirect gradient analyses were considered appropriate for
exploration and testing patterns of modern pollen variation
in relation to environmental and anthropogenic explanatory
variables The fitting model depends on whether the pollen
taxa respond roughly linearly to gradients (linear response) or
perform best around some environmental optima (unimodal
response) (Ter Braak and Smilauer 1998) Preliminary De-
trended Canonical Correspondence Analysis (DCCA) showed
that this data set has a gradient length of 1309 standard
deviation units of species turnover (SD) This implied that
linear-based methods of data analysis such as Redundancy
Analysis (RDA) were suitable in this case (Ter Braak and
Prentice 1988)
RDA attempts to explain pollen taxa responses by ordina-
tion axes that are constrained to be linear combinations of the
37 explanatory variables available including the 13 coenotaxa
(vegetation communities) Thirteen pollen taxa present only
94 The Holocene 16 (2006)
once in the 71 pollen assemblages were omitted The pollen
percentage data was log-transformed [ln (ayc) with a1 and
c1) and double-centred Forward selection and Monte Carlo
test with 999 unrestricted permutations were run to check
statistical significance and to select the best explanatory
variables for further analysis The permutation tests were later
applied to the canonical axes
First the investigated matrix contained the pollen data set
and 37 independent variables from 71 modern analogues In
preliminary RDA pollen assemblages from enclosures and
wetland communities were clearly separated from the remain-
ing sites but were also clearly different from fossil spectra
(included passively) (Mazier Galop Cugny Buttler Legaz and
Rendu unpublished data 2005) These sites contained some
characteristic taxa in large proportion and their assemblages
were quite different from the other plots causing a long
gradient in the ordinations which resulted in a poor separation
of the other samples Ten sites and consequently two explana-
tory variables were therefore omitted for further RDA
resulting in the use of 61 sites 73 pollen taxa and 35
environmental variables of which 13 were retained for their
significance the others being passively presented in the
ordination diagrams (or given as covariable)
Three main predictor variables three vegetation groups
which had the best correlation with the first three ordination
axes were used for more precise analyses In order to define the
weight of each taxon for these three nominal variables partial
RDAwas performed separately on each one The species scores
on the first canonical axis of each analysis were then
considered descriptors in a new ordination using Principal
Component Analysis (PCA) PCA used a covariance matrix
with the eigenvectors adjusted to the square root of their
variance divided by the standard deviation (symmetric scaling
lhsi)
All ordination analyses were implemented by the CANOCO
program for Windows 40 (Ter Braak and Smilauer 1998) and
diagrams constructed by Progiciel R (Casgrain and Legendre
2001) and refined by Illustrator 10
Results
Phytocoenosis typologyThe numerical analysis of the 256 synusial releves resulted in 21
syntaxa (cluster group) 4 within trees 3 within shrubs and 14
within the herb layer (Table 1 presents the species composition
for the herb syntaxa) The comparison and the classification of
the 71 phytocoenotic releves made it possible to identify 13
coenotaxa (Table 2) divided into two main groups anthro-
pogenic (4) and lsquonaturalrsquo communities (9) These plant com-
munities can be ordered along a gradient of anthropogenic
influence and degree of openness Here we describe only the
three main coenotaxa which are found as significant explana-
tory variables in the redundancy analysis
Coenotaxon No 2 occurs mainly on small areas and reflects
a community type composed of two herb syntaxa The
syntaxon H4 (Rumex acetosellaGalium saxatile) is correlated
with intense livestock activity inducing areas of urination and
defecation as well as bare soil areas The vegetation of the
patch presents a short and sparse canopy dominated by Rumex
acetosella and Galium saxatile The other syntaxon H3
(Trifolium repensPoa annua) reflects grazed dense vegetation
This short grass patch is dominated by grazed-area species
such as Poa annua Trifolium repens Stellaria media ssp media
and Cerastium fontanum ssp fontanum Coenotaxon No 2
depends directly on the daily routine of the livestock mainly
sheep and presents a high pastoral value This overgrazed
community is often found on mountain crests
Coenotaxon No 7 describes large areas of dry mountain-
slope heathland composed of seven syntaxa The principal
syntaxa are H9 (Ulex europaeusCalluna vulgaris) H5 (Poten-
tilla erectaAgrostis curtisii) and H14 (Pteridium aquilinum
Agrostis curtisii) This high-altitude community presents heath-
land species with a dominance of Agrostis curtisii Potentilla
erecta Danthonia decumbens Deschampsia flexuosa Vaccinium
myrtillus Calluna vulgaris Ulex europaeus Erica vagans Erica
cinerea Erica tetralix and Pteridium aquilinum Its species
composition is closely related to coenotaxon No 6 which
includes H8 in addition (Calluna vulgarisVaccinum myrtillus)
and results from colonization by Ulex europaeus and Pteridium
aquilinum induced through a decrease in grazing pressure
Coenotaxon No 12 corresponds to open oak forest with a
low and sparse canopy This community includes three herb
syntaxa (H5 H9 and H6 (Vaccinium myrtillusDeschampsia
flexuosa)) one shrub (B21) and two tree syntaxa (patches of
oak trees alone (A17) and mixed beech and oak (A16)) The
herb vegetation is dominated by Agrostis curtisii Potentilla
erecta Calluna vulgaris Ulex europaeus Deschampsia flexuosa
and Vaccinium myrtillus This coenotaxon corresponds to poor
soils on slopes outside the Sourzay watershed
Association and representation indicesOnly 32 taxa were found both as plants and as pollen in one or
more phytocoenoses The relationships between the different
taxa and the calculated indices are summarized in the PCA
scatter plot (Figure 3) The first axis explains 559 of the
index variation and is strongly related to the presence of both
pollen and corresponding plants (eg Poaceae Cyperaceae) It
separates strongly associated taxa plants and pollen present in
over 65 of the samples (Galium-type and Potentilla-type)
from unassociated taxa occurring infrequently in the vegeta-
tion and pollen rain (eg Rosaceae Rumex obtusifolius) The
second axis captures 401 of the variation and differentiates
over-represented taxa most often found only as pollen (eg
Abies Quercus tot Urtica dioica Brassicaceae and Plantago
lanceolata) from under-represented taxa often found only as
plants (eg Sorbus Polygala Erica tetralix)
Good agreement is found in the results of the two methods
ordination and classification with strongly associated taxa of
group 5 and associated taxa of group 3 on the right-hand side
of the first axis Group 1 clearly indicates over-represented taxa
on the positive side of the second axis Group 2 is centred and
represents weakly associated types with low A values and
relatively high U and O values Group 4 constitutes a mixed
group with unassociated under-represented and weakly asso-
ciated types Table 3 summarizes the calculated indices for
selected taxa in this study and also in previous ones based on
the classification of Bunting (2003)
Pollenvegetationenvironment relationshipsRedundancy analysis (RDA) was used to describe the major
gradients in the modern pollen assemblages and to relate these
patterns to the environmental and anthropogenic variables
This correlative model also tests whether different degrees of
openness and grazing pressure produce statistically distinct
modern pollen spectra
Among the 37 explanatory variables 14 contribute signifi-
cantly to the correlative model using forward selection and
Monte Carlo permutation tests (P5005 999 permutations)
Pudding rock mainly represented in some places of our study
area was found significant This variable was considered to be a
covariable as we did not want to interpret its effect Therefore a
Florence Mazier et al Modern pollen assemblages from grazed vegetation western Pyrenees 95
partial RDA ordination diagram of 61 pollen assemblages and
13 explanatory variables such as vegetation units and other
environmental variables was performed (Figure 4)
Axis 1 shows a clear gradient from open land to forest
vegetation types It contrasts open land such as CoE No 7
usually treeless dry heathland with wooded sites such as more
or less open beech forest CoE No 7 and the North are
respectively correlated negatively (r042) and positively
(r047) to axis 1 Indeed beech forests represented by CoE
No9 10 and 11 included as passive variables are generally
found on northern slopes Axis 2 appears to represent a soil
richness gradient and is positively linked with loss on ignition
and total N (r040 and 036 respectively) whereas the
vegetation type CoE No 12 oak forest on poor soils presents
a negative correlation (r037) Thus axis 2 contrasts the
nitrophilous features of an overtrampled community (CoE No
3) with oak forest Axis 3 better expresses a grazing pressure
gradient with sites intensively grazed and trampled on the
positive side on the axis CoE No 2 an overgrazed community
is strongly linked with axis 3 (r050) and correlated to
Table 1 Synthetic presentation of the herb synusial elementary syntaxa (SyE) of the Iraty Mountains pastoral landscape
Syntaxon no 1 2 3 4 5 6 7 8 9 10 11 12 13 14
Number of synusial releves 4 5 5 18 50 32 6 9 21 8 6 5 6 11
Urtica dioica V2 r
Cirsium eriophorum IV2 r2 r
Cirsium palustre V2 r r1
Cirsium vulgare IV2 r1
Rumex obtusifolius ssp obtusifolius V1 r1
Taraxacum officinale V1 r r r rr
Ranunculus repens V2
Achillea millefolium ssp millefolium IV1
Cynosurus cristatus IV2
Lolium perenne r IV2 r
Holcus lanatus III2
Capsella bursa-pastoris III
Plantago lanceolata III1 r r1
Stellaria media ssp media r1 V2 V1 II2 r r1
Cerastium fontanum ssp fontanum r V1 V2 IV2 r r2
Trifolium repens r V2 III2 III2 r1 r2 II2
Poa annua V2 V3 III2 r I2 II2
Rumex acetosella II V2 r2 I2 r3
Danthonia decumbens r I1 V2 r1 II1 II2 r r
Galium saxatile r1 r1 V2 V2 IV2 IV2 r3 r2 II2 r2
Agrostis curtisii III2 V2 III2 III1 r3 r r1 II3
Potentilla erecta II IV1 V2 II1 r1 V2 V2
Carex flacca II1 V2 IV2 II2 r2 I1 r1 IV1
Deschampsia flexuosa r1 I1 II1 V3 V2 r2 r2 r2 IV1 II1 II2
Fagus sylvatica H r III1 II2 r rr r3
Vaccinium myrtillus I II2 IV2 IV2 V3 III1 r
Oxalis acetosella V3
Calluna vulgaris II I1 V3 V2 IV2 IV1 r5
Ulex europaeus r V3
Erica vagans I1 r2 r V2
Erica cinerea r r1 r IV2
Erica tetralix I1 III2 V2 V2 IV2
Molinia caerulea ssp caerulea III2 r2 V2 IV2 IV2
Viola palustris ssp palustris V2
Parnassia palustris r2 V2
Narthecium ossifragum r II2 IV2
Juncus acutiflorus II1 V3
Eriophorum angustifolium IV2 II2 IV2
Carex echinata IV2 III1 III2
Carum verticillatum I I III V1 II2
Wahlenbergia hederacea r1 II1 III2
Juncus effusus III2 II r r2 r1 II III2 V5 II3
Agrostis capillaris III2 V2 V2 V2 III2 V2 III2 II1 II2 III1 IV2 III1 II2
Pteridium aquilinum II r I1 II2 r1 r3 V4
Names are given according to the main featuring species (grey bars) Each elementary syntaxon is described by a specific list of species
(differential species in grey) Only the differential species are listed Relative frequency (RF) classes are indicated for each species in each
syntaxon r species represented in less than 10 of the releves or in a single releve I 105RF 520 II 20 5 RF 5 40 III 40
BRF 560 IV 60 BRF 580 V RF 80 Mean abundance-dominance values are also indicated according to the Braun-Blanquet
scale The syntaxa are H1 Urtica dioicaCirsium palustre H2 Rumex obtusifoliusPoa annua H3 Trifolium repensPoa annua H4 Rumex
acetosellaGalium saxatile H5 Potentilla erectaAgrostis curtisii H6 Vaccinium myrtillusDeschampsia flexuosa H7 Oxalis acetosella
Deschampsia fexuosa H8 Calluna vulgarisVaccinium myrtillus H9 Ulex europaeusCalluna vulgaris H10Molinia coeruleaErica tetralix
H11 Viola palustrisParnassia palustris H12 Juncus acutiflorusEriophorum angustifolium H13 Juncus effususAgrostis capillaris H14
Pteridium aquilinumAgrostis curtisii
96 The Holocene 16 (2006)
pastoral activities (grazing and trampling) On the negative
side of axis 3 sites from CoE No7 and 12 are related to low
grazing pressure
The investigated vegetation types represent the major
relevant gradients in the modern pollen data The first three
axes respectively correspond to CoE No 7 (dry heathland)
CoE No 12 (semi-open oak forest) and CoE No2 (overgrazed
community) These vegetation units are clearly related to the
degree of openness soil richness and grazing pressure respec-
tively Therefore in an attempt to identify indicator taxa for
each of these three ecological trends these coenotaxa were used
individually as main predictors in partial RDA The resulting
species scores were further considered variables in a principal
component analysis (PCA) In the ordination diagram (Figure
5) Ericaceae Erica tetralix Sanguisorba minor associated to
Poaceae are positively linked with the degree of openness As
expected Fagus and Pinus are related to forested sites Abies
and Plantago sp are also correlated to forested sites and soil
richness (more obvious on the plots of axes 1 and 3) The taxon
Potentilla type occurs mainly in wet conditions with Apiaceae
Other data show that Potentilla-type and Apiaceae are mainly
found in the peatbogs (Mazier et al unpublished data 2005)
Cichorioideae Ranunculaceae Stellaria-type Cirsium-type
Galium-type and Asteroideae are connected with the grazing
pressure whereas Chenopodiaceae Plantago lanceolata and
Plantago majormedia are negatively correlated to grazing
pressure
Urtica dioica Rumex Scrophulariaceae and Rubiaceae are
associated with soil richness Several taxa are found close to the
axes origin such as Rumex obtusifolius Artemisia Betula
Vaccinium-Rhododendron Lotus-type and Fabaceae This sug-
gests that these pollen taxa have little relationship to the
measured variables represented by the three selected coeno-
taxa Indeed they are commonly recorded in low abundance in
most of the sites and thus are not characteristic of the
investigated vegetation types
Discussion
Herb and tree pollen representationThe indices of Davis A O and U provide some basic
information on the general pollenvegetation relationships of
the mosaic vegetation of the Iraty Mountains such as heath-
land pastoral vegetation and oak and beech forest Table 3
presents the results of previous studies in particular of Bunting
(2003) and Hjelle (1997) who give indices for main taxa from
Scottish and Norwegian heath communities respectively
Potentilla-type and Poaceae are strongly associated and
Cirsium-type Pteridium aquilinum are weakly associated for
the three data sets Plantago majormedia has been found
unassociated and Plantago lanceolata over-represented in both
the Pyrenees and Scottish data sets These comparisons
indicate that these indices can be applied widely to different
regions and also to different habitats
Several taxa commonly used as anthropogenic indicator
taxa which were lightly or not at all investigated in the local
vegetation communities are recorded at low values in a very
high proportion (6090) of the surface samples such as
Artemisia Chenopodiaceae and Plantago lanceolata (the latter
observed three times in the 71 vegetation releves) This suggests
that sporadic low percentages of these taxa in palaeorecords
need not necessarily be indicative of local pastoral activity but
may originate from long-distance transport
Some discrepancies were observed between these three data
sets ie Calluna vulgaris which is strongly associated in Bunting
(2003) and associated in the Iraty data set (this study) and
the Vaccinium-type which is strongly associated in Scotland
and weakly associated in this study Apiaceae Rumex
Table 2 Synthetic presentation of the elementary coenotaxa that constitute the Iraty mountains pastoral landscape
Coenotaxon no 1 2 3 4 5 6 7 8 9 10 11 12 13
Number of phytocoenotic releves 3 3 3 4 6 9 15 4 6 7 6 4 1
H2 Rumex obtusifoliusPoa annua V4
H1 Urtica dioicaCirsium palustre V3
H3 Trifolium repensPoa annua V3 r2
H4 Rumex acetosellaGalium saxatile V4 V4 V2 r4
H13 Juncus effususAgrostis capillaris r4 V4 r4
H11 Viola palustrisParnassia palustris V3
H12 Juncus acutiflorusEriophorum angustifolium V4
H10 Molinia coeruleaErica tetralix IV2
H8 Calluna vulgarisVaccinium myrtillus r4 II4 r4 III4 r2 r3
H5 Potentilla erectaAgrostis curtisii V4 V3 r2 IV3
H9 Ulex europaeusCalluna vulgaris V3 V3
H14 Pteridium aquilinumAgrostis curtisii r5 r3 r2 I4 V4
H6 Vaccinium myrtillusDeschampsia flexuosa r3 r4 V2 V2 V2 r1 III2 V2
A15 Fagus sylvatica V4 V3 V3
B19 Fagus sylvatica V2 IV3
H7 Oxalis acetosellaDeschampsia flexuosa V2
A16 Quercus roburFagus sylvatica r2 III2
A17 Quercus robur III2
B21 Quercus roburFagus sylvatica r1 r3
B20 Fagus sylvaticaAbies alba V3
A18 Fagus sylvaticaAbies alba V4
Each coenotaxon (CoE) is described by a list of syntaxa numbered according to Table 1 for the herb layers (H 114) the tree (A 1518)
and shrub (B 1921) syntaxa are not presented in detail (see explanation in Table 1) The dominant SyE are listed (grey bars) The
coenotaxa are CoE 1 cattle enclosure CoE 2 overgrazed lawn CoE 3 overtrampled lawn CoE 4 grazed wet vegetation CoE 5 mire
vegetation CoE 6 heathland CoE 7 encroached heathland CoE 8 fern fallow CoE 9 open beech forest CoE 10 semi-open beech forest
CoE 11 dense beech forest CoE 12 semi-open oak forest CoE 13 isolated site
Florence Mazier et al Modern pollen assemblages from grazed vegetation western Pyrenees 97
Ranunculaceae are over-represented in Buntingrsquos data set and
weakly represented in this study while the Trifolium-type is
associated in Hjelle (1998) and weakly associated in this study
The dissimilarities between the three data sets might be
explained by differences in environmental factors between
regions such as climate edaphic conditions and land use
(Brostrom et al 2004) Grazing influence on flowering and
pollen production of grasses is well documented (Groenman-
van Waateringe 1993 Hjelle 1998) thus it may be that
Poaceae produce less pollen in anthropogenic coenotaxa
Another explanation may be the differences in pollen produc-
tion for species included in large taxonomic groups such as
Poaceae Apiaceae and Ranunculaceae (Brostrom 2004) A
further reason may be the differences in sampling design and in
method used for vegetation inventories (Bunting and Hjelle
unpublished data 2004)
Brostrom et al (2004) calculated relative pollen productivity
estimates (PPEs) for 11 herb taxa related to Poaceae (used as
reference taxon) and compared PPEs for herbs (Brostrom
et alrsquos study) and trees (data set of Sugita et al 1999) She
showed that most herb taxa have higher PPEs than Poaceae
for example Calluna vulgaris Rumex acetosa-type and Plantago
lanceolata It is outlined in many studies that the presence of
Plantago lanceolata in fossil pollen assemblages should be
interpreted with caution especially in pastoral areas on
crystalline substrate such as in our case This taxon is
characterized by long-distance transport and may originate
from a wider landscape for example from valley floors in our
case Cichorioideae and Cyperaceae have lower PPEs whereas
Potentilla-type and Rubiaceae (Galium-type) have relatively
higher PPEs than Poaceae (Brostrom et al 2004) We obtained
similar results showing that these taxa can be considered good
local indicators and are important in inferring past land uses
from local pollen diagrams Brostrom et al (2004) also showed
that most of the common tree taxa such as Pinus Quercus and
Fagus produce six to eight times as much pollen per unit area
as Poaceae This emphasizes the underestimation of past open
land from fossil records when translating the APNAP ratio
into open areas (Sugita et al 1999) The overestimation of
Pinus is well known (Heim 1970 Brostrom et al 1998 2004)
Pine is considered a high pollen producer and a long-distance
disperser which implies a significant regional input This
explains the important proportion of pine recorded in all the
71 surface samples Pinus presents high proportion in beech
forest and in fern fallow with dense canopy of Pteridium
aquilinum (Mazier et al unpublished data 2005) Pteridium
aquilinum forms a closed canopy at four sites grouped into the
CoE No 8 community dominated by Pteridium aquilinum and
Agrostis curtisı It is surprising that Pteridium spores were not
found in the pollen samples from these four sites whereas it
occurred in high proportion in one site of CoE No 9 (more
than 20) just before a small mountain dominated by this
species This may be due to preferential spore dispersal in
relation to prevailing winds The interpretation of Pteridium
occurrence in pollen diagrams should be interpreted with
caution (Tinsley 2001)
We must keep in mind that because of annual variability in
pollen productivity the use of moss polsters could be critical
when studying pollenvegetation relationships and identifying
pollen indicators of plant communities Interannual variation
in pollen productivity is well documented at least for tree taxa
and has been shown to be related to climatic variability (Hicks
2001 B Odgaard personal communication 2004) Moreover
the exact number of deposition years in a moss polster is not
known and differs from 1 to 10 years according to the authors
(Heim 1970 Bradshaw 1981 Cundill 1991 Rasanen et al
2004) Rasanen et al (2004) suggest that pollen assemblages in
the green part of moss polsters represent more than one but
less than two years of pollen deposition
Correlative model of pollenvegetationenvironment relationshipsWe focused on the pollenplantenvironment relationships as
explored by Redundancy Analysis (a detailed presentation of
A
U
O
ORT
ORT
PCA axis 1
PCA axis 2
Abies
Apiaceae
Asteroideae
Brassicaceae
Calluna
Campanulaceae
Caryophylaceae
Cichorioideae Cirsium type
Cyperaceae
Erica tetralix type
Ericaceae
Fagus
Galium type
Liliaceae
Poaceae
Polygala
Potentilla type
Pteridium
Quercus tot
Ranunculaceae
Rosaceae
Rumex acetosaacetosella
Rumex obtusifolius
Scrophulariaceae
Sorbus
Stellaria type
Trifolium
Ulex type
Urtica dioica
Vacciniumrhododendron
Plantago lanceolata
SAT
AT
Figure 3 Principal Component Analysis (PCA) using Davisrsquos indices of association (A) under-representation (U) and over-representation
(O) (Davis 1984) Groups according to the clustering are indicated with different symbols 1 2m 3 4 j 5 The eigenvalues of
the first three principal component axes are 0135 (559) 0099 (409) and 0008 (32) respectively
98 The Holocene 16 (2006)
the pollen-diagram will be published elsewhere Mazier et al
unpublished data 2005)
Advantage of a synusial approach for studying vegetationThe significant explanatory variables of the canonical axes
were edaphic conditions (total N loss on ignition pH)
geomorphology (aspect North linked to forested sites) plant
communities (CoE No 2 3 4 6 7 8 and 12) and land use
(grazing trampling) The results show that the vegetation units
under consideration which better reflect vegetation structure
than a classical releve can be used efficiently to explain the
major environmental gradients in pollen data Dry heathland
semi-open oak forest and overgrazed community best reflect
the gradients of landscape openness soil richness and grazing
pressure respectively RDA axis 1 separates open land from
beech sites (both lightly grazed) that are contrasted mainly on
the basis of Poaceae and Fagus Poaceae is mainly represented
in the CoE No 7 community a dry heathland corresponding
to an early succession stage of the Ulex europaeus invasion
Brostrom et al (1998) demonstrated that Poaceae may
be representative of all types of open land However this
study shows a difference in the proportion of Poaceae within
vegetation types induced by human activity since this
taxon decreases in both the overgrazed CoE No 3 and No 2
Table 3 Indices of association and representation from three different studies (this study Bunting 2003 and Hjelle 1997) based on the
classification of Bunting (2003)
Pollen taxon A U O Bunting (2003) Hjelle (1997)
Unassociated types (UT)
Anagallis 000 100 100
Centaurea jaceanigra 000 100 100
Fabaceae 000 100 100 UT
Ilex 000 100 100
Labiatae 000 100 100
Lotus-type 000 100 100 WAT
Parnassia-type 000 100 100
Plantago majormedia 000 100 100 no plant WAT
Strongly associated types (SAT)
Poaceae 096 001 003 SAT SAT
Cyperaceae 073 010 020 AT
Galium-type 072 022 010 Rubiaceae ORT AT
Potentilla-type 067 016 023 SAT AT
Associated types (AT)
Calluna 058 012 038 SAT ORT
Comp SF Cichorioideae 048 027 041 SAT
Over-represented types (ORT)
Abies 004 000 096
Urtica dioica 005 000 095 no plant no plant
Plantago lanceolata 006 000 094 ORT SAT
Brassicaceae 006 000 094 no plant WAT
Quercus tot 008 000 092
Fagus 038 000 062
Under-represented types (URT)
Sorbus 011 089 000
Weakly associated types (WAT)
Polygala 003 097 050 no pollen URT
Trifolium 006 093 080 SAT (Trifolium repens type)
Erica tetralix-type 016 082 044 SAT
Rumex obtusifolius 005 075 095 ORT (Rumex) no plant
Scrophulariaceae 019 074 057
Ulex-type 014 074 077
Campanulaceae 018 071 067 AT
Liliaceae 014 071 078 no plant
Rosaceae 002 067 098
Pteridium 020 061 071 WAT WAT
Cirsium-type 025 056 064 WAT WAT
VacciniumRhododendron 038 049 041 SAT (Vaccinium type) WAT (Vaccinium type)
Stellaria-type 033 047 053
Apiaceae 023 044 071 ORT SAT
Caryophyllaceae 016 044 081 no plant
Comp SF Asteroideae 023 037 074 AT (Achillea type)
Rumex acetosaacetosella 028 025 069 ORT (Rumex) SAT
Ranunculaceae 020 020 079 ORT (Ranunculus acris type) SAT (Ranuculus acris type)
Ericaceae 035 019 061
Indices of association (A) over-representation (O) and under-representation (U) for taxa present in both plant and pollen data sets Strongly
associated types A65 Associated types 50BAB65 Over-represented types low A values high O values and U0 Weakly
associated types low A values and relatively high values for both U and O Unassociated types A0 and high O and U values
Florence Mazier et al Modern pollen assemblages from grazed vegetation western Pyrenees 99
01 02
03
04
06
07
08
09
10
11
13
14
15
16
17
18
19
20
21
22
23
24
25
29
30
32
33
34 35
36
37
38
40
41
43
44
46
47
49
50
51
52
53
54
55
56
57
58 60
61
62
63
64
65
66
67
68
69
70
71
pH (KCL)
N tot loss on ignition
North
trampling
grazing trees
CoE 2
CoE 3
CoE 4
CoE 6
CoE 7
CoE 8
CoE 12
CoE 9
CoE 10
CoE 11RDA axis 1
RDA axis 2
01
02
03
04
06
07
08
09
10
11
13
14
15
16
17
18
19
20
21
22 23
24
25
29
30
32 33
34
35
36
37
38
40
41
43
44
46
47
49
50
51
52
53
54
55
56
57
58
60
61
62
63
64
65
66
67
68
69
70
71
pH (KCL)
N tot
loss on ignition
North
trampling grazing
trees
CoE2
CoE 3 CoE 4
CoE 6
CoE 7
CoE 8
CoE 12
CoE 9
CoE 10
CoE 11
RDA axis 1
RDA axis 3
(a)
(b)
Figure 4 Redundancy analysis (RDA) of the modern pollen assemblages using 13 explanatory variables (nominal variables are given
with their centroıds (crosses) and quantitative variables with arrows) four passive variables (italic) and 61 pollen samples (points) The
three first axes explain respectively 179 62 and 54 of the total variation in the modern pollen data and are all significant (PB0001 after
999 permutations) The vegetation types ie elementary Coenotaxa (CoE) are k CoE2 ^ CoE3 m CoE4 2 CoE6 CoE7
CoE8 CoE910 j CoE11 CoE12 (a) Sites scores and environmental variables on RDA axes 1 and 2 (b) Site scores and
environmental variables on RDA axes 1 and 3
100 The Holocene 16 (2006)
communities Nevertheless the proportion of Poaceae is not
the same in CoE No 2 an overgrazed pasture and CoE No 4
grazed wet vegetation The integrated synusial approach
provides some explanation for these dissimilarities between
pastoral communities Poaceae was mainly recorded in CoE
No 4 and 7 and indeed this may be explained by the presence
of patches of Juncus effusus (CoE No 4) and Ulex europaeus
(CoE No 7) both of which protect herbs from grazing thus
allowing the flowering of the grasses Alternatively another
factor might be the animalsrsquo preference for some species This
seems to be verified for Poa annua the main species in CoE
No 2 that has a higher pastoral value and a higher appetency
as compared with Agrostis curtisı Another explanation might
be the differences in pollen productivity of the various species
included in this large taxonomic group High grazing pressure
induces a specific community such as CoE No 2 which
presents patches of syntaxon H4 (Rumex acetosellaGalium
saxatile) on nearly bare soils and syntaxon H3 (Trifolium
repensPoa annua) in densely grazed micro-sites This coeno-
taxon seems to be the most reliable analogue for intensive
pastoral activity On the other hand CoE No 7 can be used as
an analogue for extensive pastures and CoE No 9 10 or 11 for
deciduous mainly beech forest CoE No 6 provides a
situation of transition between extensive and intensive pas-
tures CoE No 3 and 4 are more related with the soil richness
which may derive from grazing pressure
Pollen indicators of pastoral activitiesIn the PCA analysis based on the three vegetation predictors
CoE No 7 12 and 2 Cichorioideae Ranunculaceae Stellaria-
type Cirsium-type Galium-type Asteroideae and to a lesser
extent Potentilla-type are strictly related to grazing pressure
Similar results were obtained in northern Europe (Hicks 1988
Gaillard et al 1992 1994 Hjelle 1998 1999ab Rasanen
2001) It was found that Cichorioideae (Hjelle 1999a)
Cirsium-type (Hjelle 1998) Galium-type (Gaillard et al
1992) Potentilla-type (Gaillard et al 1992 Hjelle 1999a)
and Ranunculaceae (Hjelle 1999a) were characteristic of
grazing In this study Plantago lanceolata Chenopodiaceae
and Plantago majormedia the last two taxa being absent from
the vegetation are more common in sites on aspects N and
NW and occur mainly in lightly grazed wooded sites Their
presence is related to the prevailing wind which brings pollen
from a wider landscape Gaillard et al (1992) showed that
Plantago lanceolata is a mowing indicator in southern Sweden
According to Hicks and Birks (1996) Chenopodiaceae and
Rumex acetosaacetosella are related to human settlements
This may apply in our case for Rumex acetosaacetosella since
this taxon was present in tracks andor in the ploughed soils of
CoE No 3 but generally it was recorded sporadically in
modern pollen assemblages and therefore cannot be a good
pastoral indicator In our case the presence of the taxa
Chenopodiaceae Plantago lanceolata and Artemisia implies
regional input
Urtica dioica is related to soil richness (total N and loss on
ignition) and does not constitute a strict pastoral indicator
(Gaillard et al 1992) at least when low values are recorded
(Mazier et al unpublished data 2005) It is found in surface
samples from enclosures but the plant often grows outside
where dung has accumulated near stone walls
Conclusion
(1) The correlative model RDA of 61 modern pollen spectra
and 35 external variables shows that wooded opened grazed
and nitrophilous sites are clearly separated from each other
The relevant variables are vegetation types CoE No 7 (dry
heathland) CoE No 12 (semi-open oak forest) and CoE No 2
(overgrazed community) These vegetation units are clearly
related to degree of openness soil richness and grazing
pressure respectively Therefore the synusial integrated ap-
proach does provide a robust method for assessing vegetation
structure and links between different patches (herbs shrubs
and trees) and also for relating modern pollen assemblages to
environmental conditions
(2) The present study implies that when reconstructing past
pastoral activity it is important to identify the scale
of the landscape in question In our case Artemisia Cheno-
podiaceae Plantago lanceolata and Plantago majormedia
indicate regional human activity and are not characteristic
OPENNESS
GRAZING
PRESSURE
PCA axis 1
PCA axis 2
SOIL RICHNESS
Aln
Cor
Fag
Pin
Poa
Pla- lan
Cal
Ran
Abi
Ros
Fra
Que- tot
Bra
Gal
Pla
Urt- dio
Art
Bux
Che
Api
Bet
Eri
Car
Vac- rho
Ast
Rub
Cic
Pot- typ
Rum- ace
Sal
Rum
Jun
Rha
Ulm
Fab
Ste- typ
Lil
Rum- obt
Scr
Pla- med
Cir- typ
Ile
Lot- typ
Lab
Ace
Eri- tet
Ech
Ule- typ
Amb- typ
Cam
San- min
Cen- jac Hel
Til
Tha Tri
Mel
-158
-16
7
169
28
0
Figure 5 Principal Component Analysis (PCA) using the scores of
a separate RDA with coenotaxa CoE No 7 (dry heahland)
indicative of vegetation openness CoE No 12 (semi-open oak
forest) indicative of low soil richness and CoE No 2 (overgrazed
community) indicative of high grazing pressure Axis 1 and 2
represent 85 of the total variance Abbreviations Abi Abies
Ace Acer Aln Alnus Amb-typ Ambrosia-type Api Apiaceae
Art Artemisia Ast Asteroideae Bet Betula Bra Brassicaceae
Bux Buxus Cal Calluna Cam Campanulaceae Car Caryophyl-
laceae Cen-jac Centaurea jacea Che Chenopodiceae Cic
Cichoriodeae Cir-typ Cirsium-type Cor Corylus Ech Echium
Eri Ericaceae Eri-tet Erica tetralix Fab Fabaceae Fag Fagus
Fra Fraxinus Gal Galium-type Hel Helianthemum Ile Ilex
Jun Juncus Lab Labiateae Lil Liliaceae Lot-typ Lotus type
Mel Melampyrum Poa Poaceae Pla Plantago Pla-lan Plantago
lanceolata Pla-med Plantago majormedia Pin Pinus Que-tot
Quercus total Pot-typ Potentilla type Ran Ranunculaceae Rha
Rhamnus Rub Rubiaceae Rum Rumex Rum-ace Rumex
acetosaacetosella Rum-obt Rumex obtusifolius Ros Rosaceae
Sal Salix San-min Sanguisorba minor Scr Scrophulariaceae
Ste-typ Stellaria type Til Tilia Ulex-typ Ulex type Ulm Ulmus
Urt-dio Urtica dioica Vac-rho VacciniumRhododendron
Florence Mazier et al Modern pollen assemblages from grazed vegetation western Pyrenees 101
of specific land use whereas the simultaneous presence in
pollen assemblages of Asteroideae Cichoriodeae Cirsium-
type Galium-type Ranunculaceae Stellaria-type and Poten-
tilla-type is clearly associated with grazing on a local scale
Calculation of Davis indices also shows that Cichorioideae
Galium-type and Potentilla-type indicate very local presence of
the corresponding plants However such pastoral indicators
might be valid only for crystalline bedrock and for this
mountainous region
(3) The final aim of our project is to achieve a more precise
reconstruction of the cultural landscape in this mountainous
area on a local scale comparing the modern pollen assem-
blages to local fossil pollen assemblages from a small bog
(Galop et al 2003 Mazier et al unpublished data 2005)
Thanks to the interdisciplinary research programme lsquoPalaeo-
environment and dynamics of human activities in the Pyrenees
Mountainsrsquo this site is now also well documented in micro-
fossil historical and archaeological data All these data sets
will be used to validate the results of the comparative
approach
Acknowledgements
This study was possible thanks to the help of a number of
people to whom we are very grateful Didier Galop for pollen
analysis Cecile Brun for her precious assistance and encour-
agement during fieldwork Pascal Vittoz and Francois Gillet
for their advice on the integrated synusial approach and
vegetation analysis Jean-Daniel Tissot for computer program-
ming Anne Vignot for her permanent encouragement and
Isabelle Jouffroy for guidance in the use of the End-note
software Christine Rendu and her archaeological staff One-
sime Prudhom and Bertrand Lagoguet provided cheerful
fieldwork Thanks are due to Kari Hjelle for advice and
corrections on the Davis Indices and to John Olsen for his
improvement of the English text The manuscript was im-
proved thanks to the helpful comments and suggestions from
the two referees Sheila Hicks and Marie-Jose Gaillard This
investigation is a contribution to the project of the collective
research program lsquoPaleoenvironnement et dynamiques de
lrsquoanthropisation en montagne basquersquo (Ministry of Culture
and SRA Aquitaine) and the ATIP-CNRS lsquoPaleoenvironne-
ment et Archeologie pastoralersquo
References
Anderson JM and Ingram JSI 1993 Tropical soil biology and
fertility A handbook of methods 2nd edition CAB International
Behre KE 1981 The interpretation of anthropogenic indicators
in pollen diagrams Pollen et Spores 23 22545
Berglund BE and Ralska-Jasiewiczowa M 1986 Pollen analysis
and pollen diagrams In Berglund BE editor Handbook of
Holocene palaeoecology and palaeohydrology John Wiley amp Sons
Ltd 155484
Berglund BE Persson T Emanuelsson U and Persson S 1986
Pollenvegetation relationships in grazed and mowed plant
communities of South Sweden In Behre K-E editor
Anthropogenic indicators in pollen diagrams Balkema 3751
Boyd WE 1986 The role of mosses in modern pollen analysis the
influence of moss morphology on pollen entrapment Pollen et
spores XXVIII 24356
Bradshaw RHW 1981 Modern pollen representation factors for
woods in South-West England Journal of Ecology 69 4570
Braun-Blanquet J 1964 Pflanzensoziologie Grundzuge der
Vegetationskunde Springer 865
Brostrom A Gaillard M-J Ihse M and Odgaard B 1998
Pollenlandscape relationships in modern analogues of ancient
cultural landscapes in southern Sweden a first step towards
quantification of vegetation openness in the past Vegetation
History amp Archaeobotany 7 189201
Brostrom A Sugita S and Gaillard M-J 2004 Pollen
productivity estimates for the reconstruction of past vegetation
cover in the cultural landscape of southern Sweden The Holocene
14 36881
Bunting MJ 2003 Pollenvegetation relationships in
non-arboreal moorland taxa Review of Palaeobotany and
Palynology 125 28598
Casgrain P and Legendre P 2001 The R package for multivariate
and spatial analysis version 40 (development release 6) userrsquos
manual Universite de Montreal 134
Court-Picon M Buttler A and de Beaulieu J-L 2005 Modern
pollenvegetation relationship in the Champsaur valley (French
Alps) and their potential in the interpretation of fossil pollen
records of past cultural landscapes Review of Palaeobotany and
Palynology 135 13
Cundill PR 1991 Comparisons of moss polster and pollen trap
data a pilot study Grana 30 301308
Davis OK 1984 Pollen frequencies reflect vegetation patterns in
a Great Basin (USA) mountain range Review of Palaeobotany and
Palynology 40 295315
Faegri K and Iversen J 1989 Textbook of pollen analysis John
Wiley 328 pp
Gaillard M-J Birks HJB Emanuelsson U and Berglund BE
1992 Modern pollenland-use relationships as an aid in the
reconstruction of past land-uses and cultural landscapes an
example from south Sweden Vegetation History and
Archaeobotany 1 317
Gaillard M-J Birks HJB Emmanuelson U Karlson S
Lageras P and Olausson D 1994 Application of modern
pollenland-use relationships to the interpretation of pollen
diagrams reconstruction of land-use history in south Sweden
30000 Review of Palaeobotany and Palynology 82 4773
Gaillard M-J Birks HJB Karlsson S and Lageras P 1997
Quantitative reconstruction of past land-use and soil conditions
using the modern analogue approach a case study in southern
Sweden PACT 50 43142
Galop D 1998 La foret lrsquohomme et le troupeau dans les
Pyrenees 6000 ans drsquohistoire de lrsquoenvironnement entre Garonne et
Mediterranee Contribution palynologique GEODE Laboratoire
drsquoecologie terrestre Framespa 285 pp
Galop D Mazier F Lopez-Saez J-A and Vanniere B 2003
Palynologie et histoire des activites humaines en milieu
montagnard Bilan provisoire des recherches et nouvelles
orientations methodologiques sur le versant nord des Pyrenees
Archeologie du midi medieval 21 15970
Galop D Rendu C Barcet H Buttler A Campnajo P Cugny
C Gauthie E Legaz A Lopez-Saez JA Mazier F Metailie
JP Dominique S and Vannıere B 2004 Paleoenvironenment et
archeologie pastorale Propositions methodologiques pour une
approche integree des modalites du lrsquoanthropisation en haute
montagne pyreneenne du Neolithique a lrsquoactuel Besancon UMR
6565 CNRS-Universite de Franche-Cormte 70 pp unpublished
Gillet F and Gallandat J-D 1996 Integrated synusial
phytosociology some notes on a new multiscalar approach to
vegetation analysis Journal of Vegetation Science 7 1318
Gillet F De Foucault B and Julve P 1991 La phytosociologie
synusiale integree objets et concepts Candollea 46 31540
Gillet F Besson O and Gobat J-M 2002 PATUMOD a
compartment model of vegetation dynamics in wooded pastures
Ecological Modelling 147 26790
Groenman-van Waateringe W 1993 The effect of grazing on the
pollen production of grasses Vegetation History and
Archaeobotany 2 15762
Heim J 1970 Les relations entre les spectres polliniques recents et
la vegetation actuelle en europe occidentale Doctoral Thesis
Universite de Louvain 179 pp
Hicks S 1988 The representation of different farming practices in
pollen diagrams from northern Finland In Birks HH Birks
102 The Holocene 16 (2006)
HJB Kaland P and Dagfinn M editors The cultural landscape
past present and future Cambridge University Press 189207
Hicks S 2001 The use of annual arboreal pollen deposition
values for delimiting tree-lines in the landscape and exploring
models of pollen dispersal Review of Palaeobotany and Palynology
117 129
Hicks S and Birks HJB 1996 Numerical analysis of modern
and fossil pollen spectra as a tool for elucidating the nature of
fine-scale human activities in boreal areas Vegetation History and
Archaeobotany 5 25772
Hicks S Tinsley H Huusko A Jensen C Hattestrand M
Gerasimides A and Kvavadze E 2001 Some comments on spatial
variation in arboreal pollen deposition first records from the
Pollen Monitoring Programme (PMP) Review of Palaeobotany and
Palynology 117 18394
Hjelle KL 1997 Relationships between pollen and plants in
human-influenced vegetation types using presence-absence data in
Western Norway Review of Palaeobotany and Palynology 99 116____ 1998 Herb pollen representation in surface moss samples
from mown meadows and pastures in Western Norway Vegetation
History and Archaeobotany 7 7996____ 1999a Modern pollen assemblages from mown and grazed
vegetation types in western Norway Review of Palaeobotany and
Palynology 107 5581____ 1999b Use of modern pollen samples and estimated pollen
representation factors as aids in the interpretation of cultural
activity in local pollen diagrams Norwegian Archaeological Review
32 1939
Leps J and Smilauer P 2003 Multivariate analysis of ecological
data using CANOCO Cambridge University Press 282 pp
Moore PD Webb JA and Collinson ME 1991 Pollen analysis
Blackwell Science 216 pp
Rasanen S 2001 Tracing and interpreting fine-scale human
impact in northern Fennoscandia with the aid of modern pollen
analogues Vegetation History and Archaeobotany 10 21118
Rasanen S Hicks S and Odgaard BV 2004 Pollen deposition
in mosses and in a modified lsquoTauber traprsquo from Hailuoto Finland
what exactly do the mosses record Review of Palaeobotany and
Palynology 129 10316
Reille M 1992 Pollen et spores drsquoEurope et drsquoAfrique du Nord
Laboratoire de Botanique Historique et Palynologie 535 pp
Sugita S Gaillard M-J and Brostrom A 1999 Landscape
openness and pollen records a simulation approach The Holocene
9 40921
Ter Braak CJF and Prentice CI 1988 A theory of gradient
analysis Advances in Ecological Research 18 271317
Ter Braak CJF and Smilauer P 1998 CANOCO Reference
manual Userrsquos Guide to Canoco for Windows Software for
canonical community ordination (version 4) Centre for Biometry
Wageningen 352 pp
Tinsley H 2001 Modern pollen deposition in traps on a transect
across an anthropogenic tree-line on Exmoor southwest England
a note summarising the first three years of data Review of
Palaeobotany and Palynology 117 15358
Tutin TG Heywood VH Burges NA Valentine DH
Walters SM Webb DA and with the assistance of Ball
PWaC A O 19641980 Flora Europea Cambridge
University Press
van der Knaap WO van Leeuwen JFN and Ammann B 2001
Seven years of annual pollen influx at the forest limit in the Swiss
Alps studied by pollen traps relations to vegetation and climate
Review of Palaeobotany and Palynology 117 3152
Vorren K-D 1986 The impact of early agriculture on the
vegetation of Northern Norway A discussion of anthropogenic
indicators in biostratigraphical data In Behre K-E editor
Anthropogenic indicators in pollen diagrams Balkema 118
Wildi O and Orloci L 1996 Numerical exploration of community
patterns Amsterdam SPB Academic Publishing 171 pp
Wright HEJ 1967 The use of surface samples in quaternary
pollen analysis Review of Palaeobotany and Palynology 2 32130
Florence Mazier et al Modern pollen assemblages from grazed vegetation western Pyrenees 103
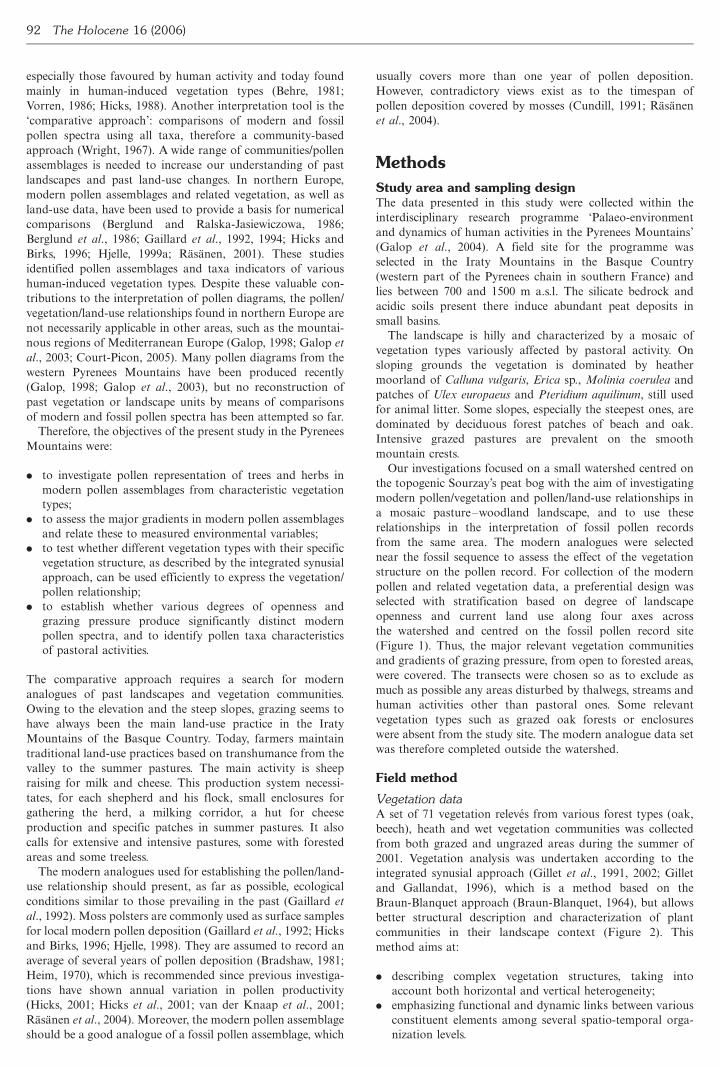
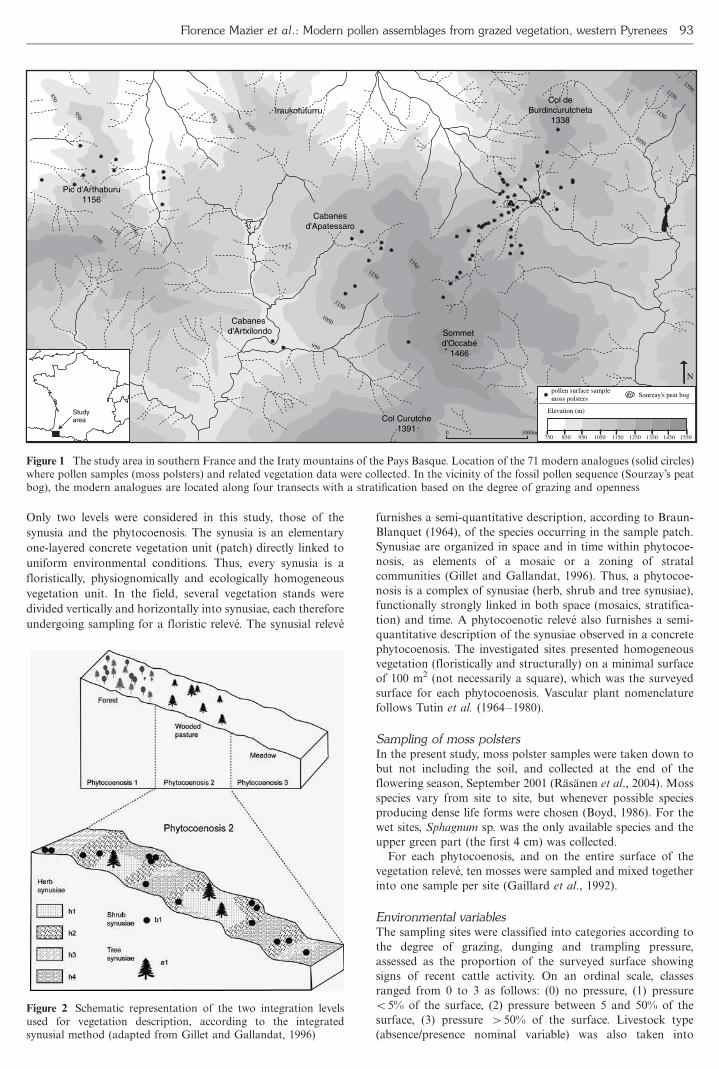
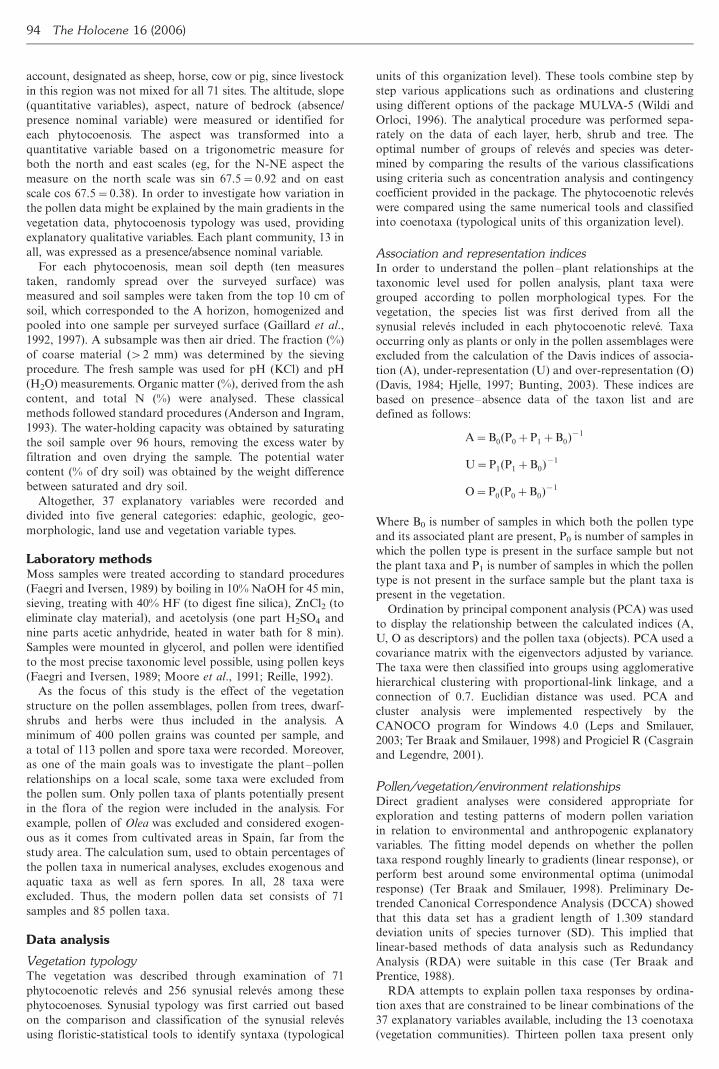
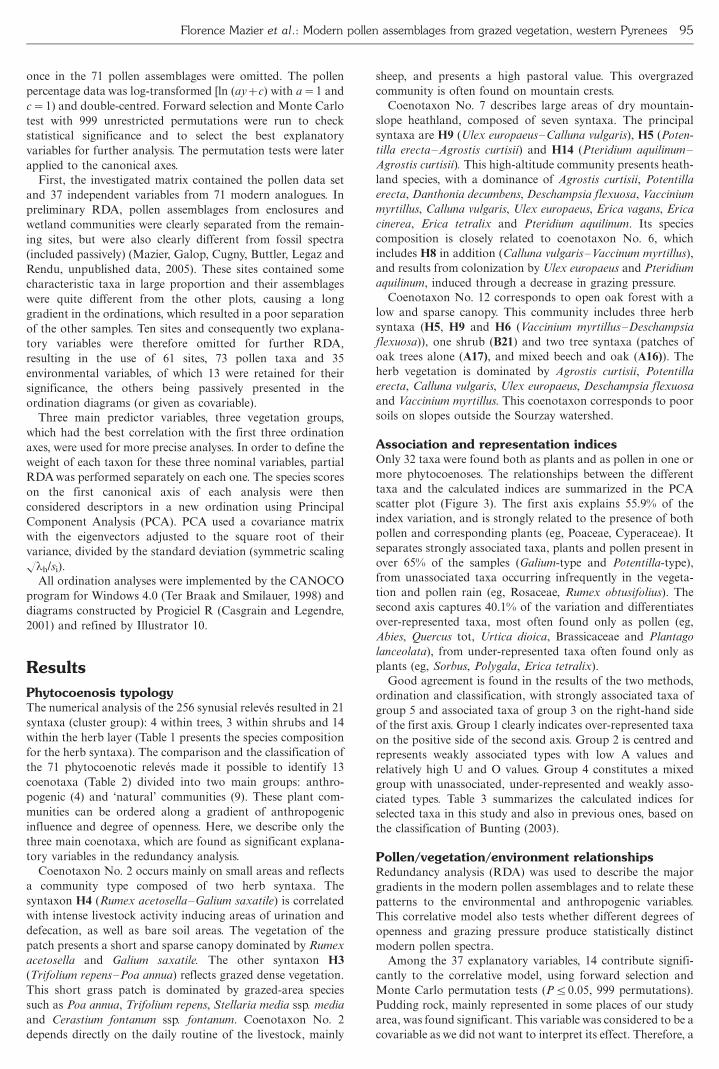
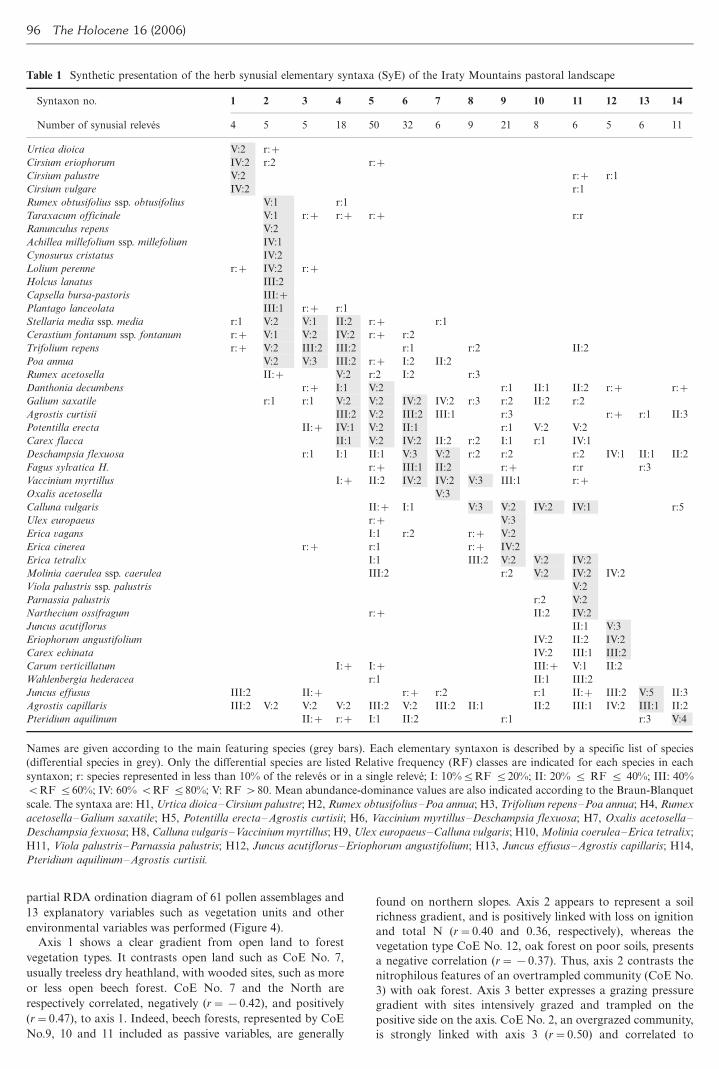
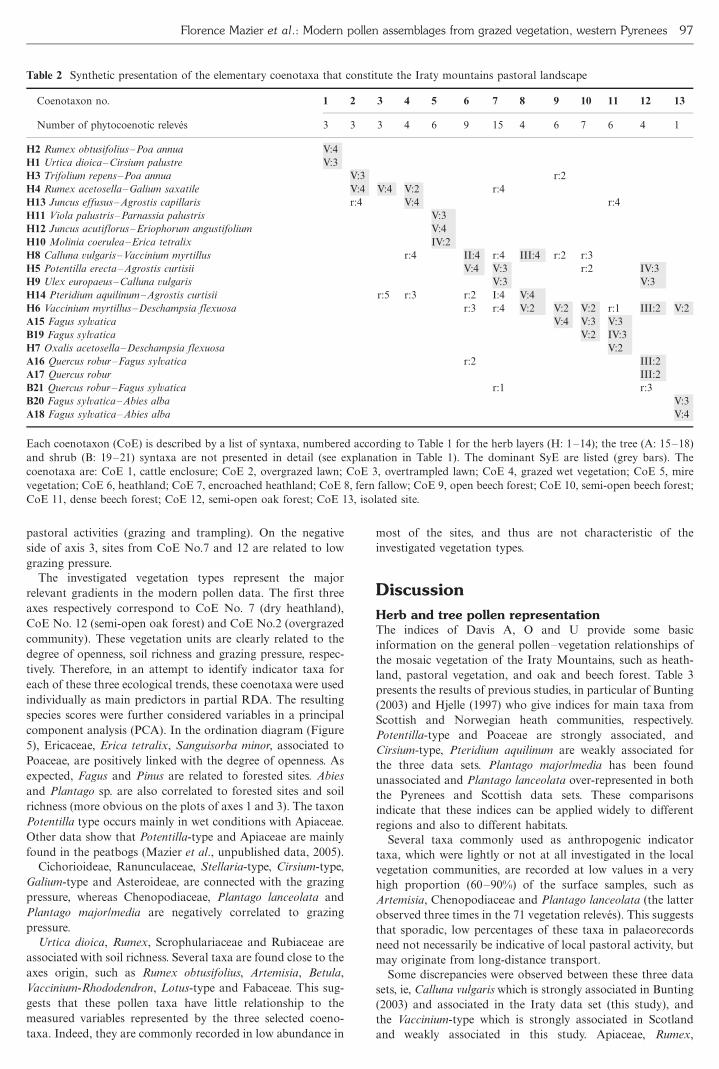
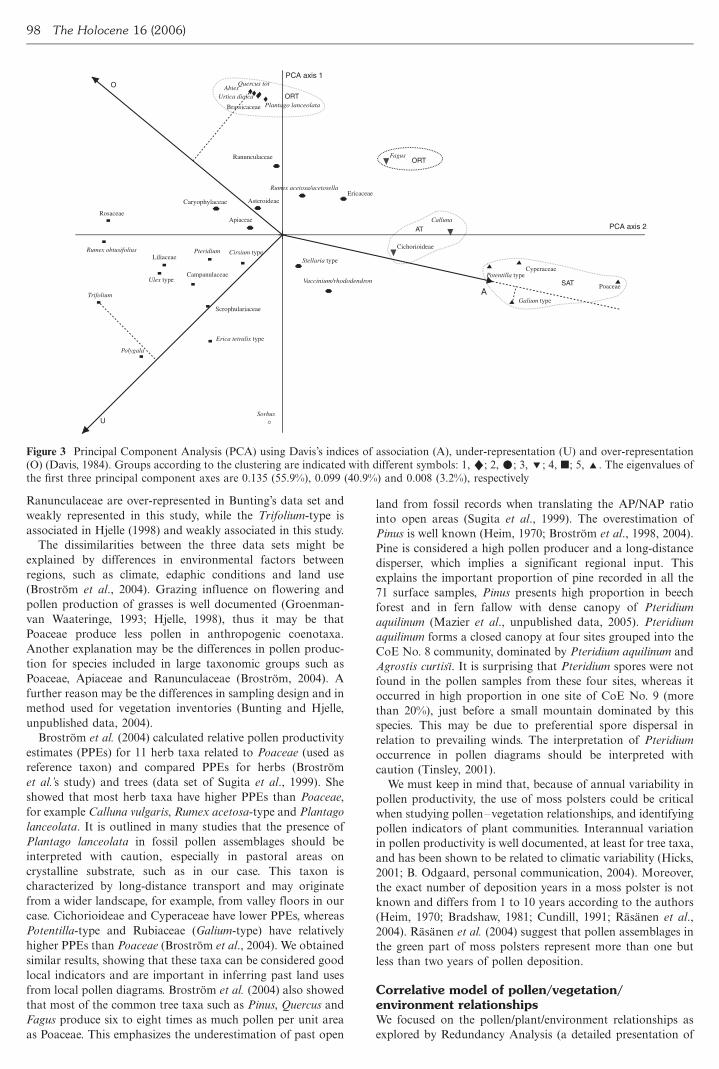
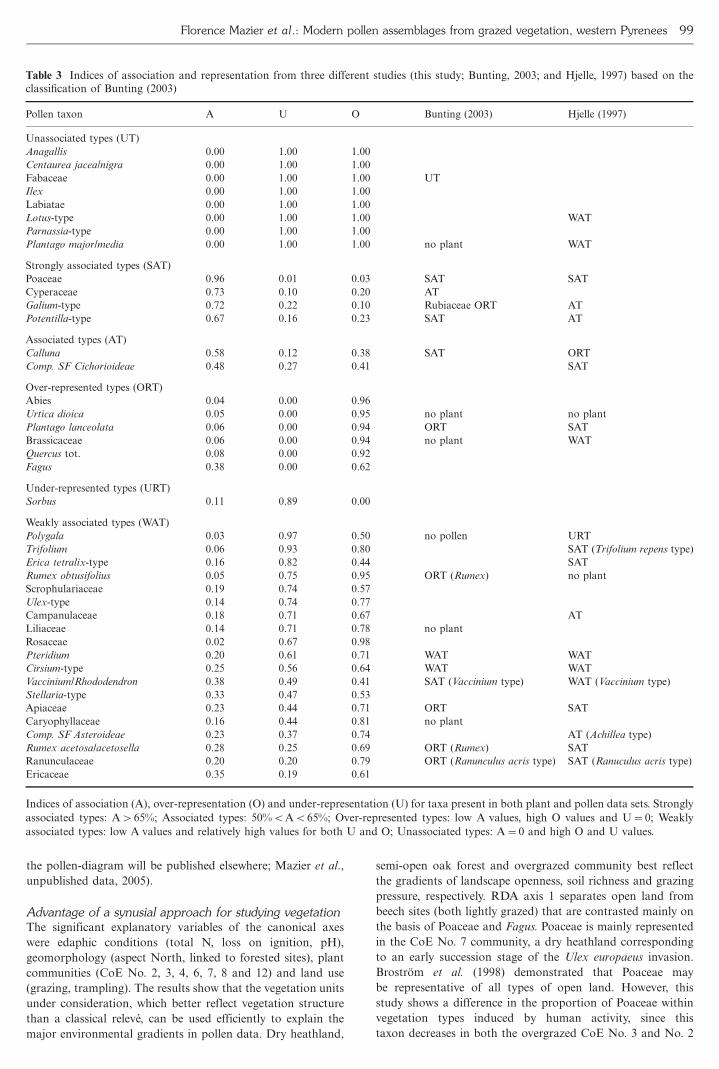
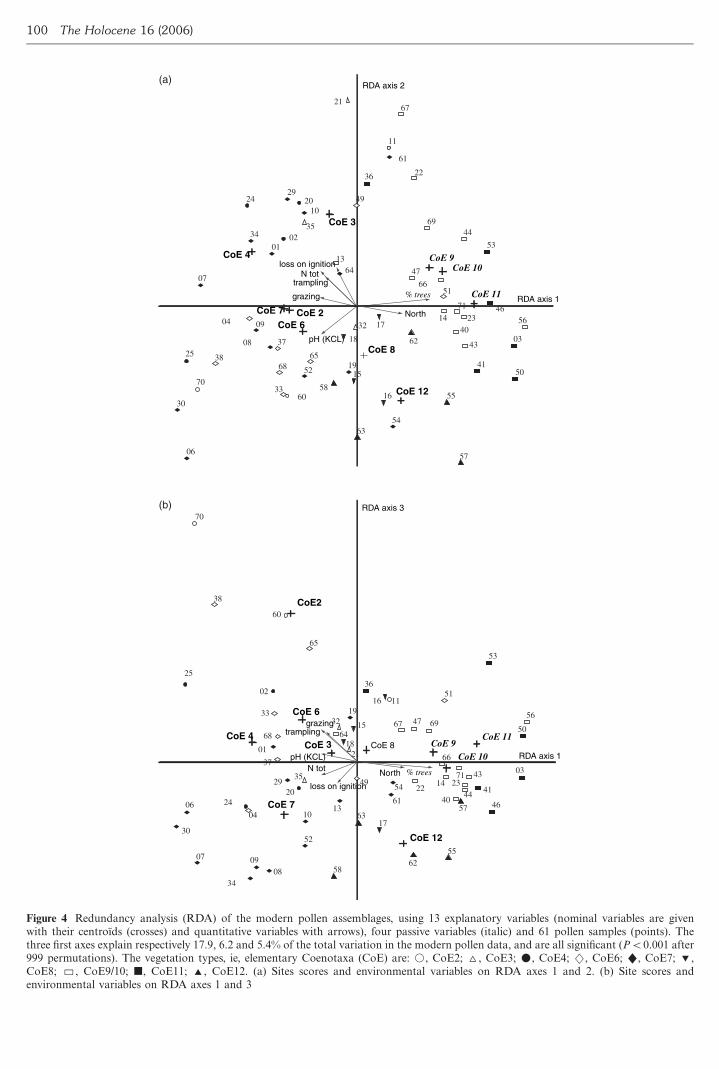
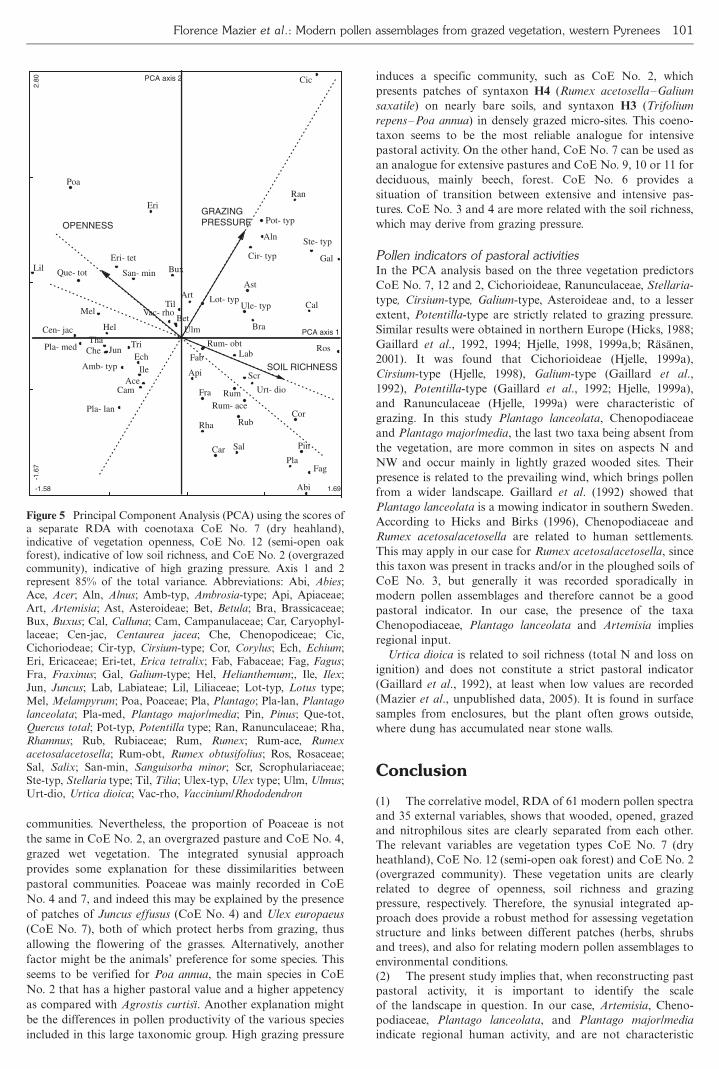