Embed Size (px)
Citation preview

INTERNATIONAL RESEARCH JOURNAL
MODERN ECONOMY SUCCESS
№1, 2016

2
Editor-in-chief of the Journal
Candidate of Engineering Sciences (Ph.D.), Associate Professor, Klyuev S.V.
Deputy Chief Editor of the Journal
Candidate of Engineering Sciences (Ph.D.), Klyuev A.V.
Editorial Board Members:
Agabekyan Raisa Levonovna (the Russian Federation, Krasnodar) – Doctor of Economic Sciences
(Advanced Doctor), Professor
Bykovsky Victor Vasilyevich (the Russian Federation, Tambov) – Doctor of Economic Sciences
(Advanced Doctor), Professor
Gvaramiya Nazi Georgievna (Georgia, Tbilisi) – Doctor of Economic Sciences (Advanced Doctor),
Professor
Gyyazov Aydarbek Toktorovich (Kyrgyzstan, Kyzyl-Kia) – Candidate of Economic Sciences (Ph.D.),
Associate Professor
Hodos Dmitry Vasilyevich (the Russian Federation, Krasnoyarsk) – Doctor of Economic Sciences
(Advanced Doctor), Professor
Ilhan Turhan Ege (Türkiye, t. Mersin) – Ph.D. Finance, Associate Professor, Mersin üniversitesi
Ksenova Elena Valerievna (the Ukraine, Kharkiv) – Candidate of Economic Sciences (Ph.D.),
Associate Professor
Kulagovskaya Tatyana Anatolyevna (the Russian Federation, Stavropol) –Doctor of Economic Sciences
(Advanced Doctor), Professor
Laszlo Vasa (Hungary, t. Budapest) – Ph.D., Dr. habil, Professor
Lipina Svetlana Arturovna (the Russian Federation, Moscow) –Doctor of Economic Sciences
(Advanced Doctor), Professor
Makarov Ivan Nikolaevich (the Russian Federation, Lipetsk) – Candidate of Economic Sciences
(Ph.D.), Associate Professor
Mandritsa Igor Vladimirovich (the Russian Federation, Stavropol) – Doctor of Economic Sciences
(Advanced Doctor), Professor
Maslova Irina Alekseevna (the Russian Federation, Oryel) – Doctor of Economic Sciences (Advanced
Doctor), Professor
Mohammad Reza Аli Noruzi (Iran, t. Tehran, ) – Ph.D., Tarbiat Modarres University
Saliyenko Natalia Vladimirovna (the Russian Federation, Moscow) – Doctor of Economic Sciences
(Advanced Doctor), Professor
Samedova Elnara Robertovna (Azerbaijan, Baku) – Doctor of Economic Sciences (Advanced Doctor),
Associate Professor
Shatalov Maxim Aleksandrovich (the Russian Federation, Voronezh) – Candidate of Economic
Sciences (Ph.D.), Associate Professor
Simanavichene Zhaneta (Lithuania, Vilnius) – Doctor of Economic Sciences (Advanced Doctor),
Professor
Titova Evgeniya Viktorovna (the Russian Federation, Achinsk) – Candidate of Economic Sciences
(Ph.D.), Associate Professor

3
Zaloznaya Galina Mikhaylovna (the Russian Federation, Orenburg) – Doctor of Economic Sciences
(Advanced Doctor), Professor
Zaynutdinov Shavkat Nuritdinovich (Uzbekiskan, Tashkent) – Doctor of Economic Sciences
(Advanced Doctor), Professor
Head Office: 308014, Belgorod, 28 Sadovaya St., Ap. 4. (RUSSIA)
Phone No.: +7-951-139-63-27
Website: http://www.modernsciencejournal.org/
E-mail: [email protected]
Frequency: the journal appears 4 times a year
Way of distribution: to authors of publications; on a subscription.
Free price
International Research Journal "Modern Economy Success"

Modern Economy Success 2016, №1
4
Table of contents
Seidl A.F., Pshikhachev S.M., Balashenko V.A., Pshikhacheva Zh.S., Bakanov A.V.
THE SCIENTIFIC AND EDUCATIONAL EXTENSION IS IN THE FUNCTIONING
SYSTEM OF INTEGRATED ECONOMY OF THE WORLD AGRICULTURE FOR
COMPARISON RUSSIAN EXPERIENCE 5
Mandritsa I.V., Stefano Selleri, Mandritsa O.V., Petrenko V.I.
MECHANISM OF ECONOMIC SECURITY RELATIVELLY TO MARKET AGENTS
ON POSSIBLE LEAKS OF BUSINESS INFORMATION 19
Anan M.T., Alabdulla S.D., Khantomani A.
INTEGRATING THE LINEAR DISCRIMINATE FUNCTIONS USING PROBABILITY
MATRIX TO GET A BETTER CLASSIFICATION 32
Maksimova T.P., Bondarenko N.E., Milyaev K.V.
THE INVESTMENT ATTRACTIVENESS AND FEATUARES OF FORMATION OF AGRO-
INDUSTRIAL CLASTERS IN THE RUSSIAN ECONOMY 45
Prasolov V.I., Kesego Mosime
THE CONCEPT AND ORGANISATION OF THE FUNCTIONING OF AN
ECONOMIC SECURITY SYSTEM OF AN ORGANISATION 58
Shatalov M.A., Ahmedov A.E., Smolyaninova I.V., Mychka S.Yu.
THE FORMATION OF ADAPTIVE STRATEGIES OF DEVELOPMENT OF THE
ENTERPRISES OF AGRO-INDUSTRIAL COMPLEX IN THE CONDITIONS
OF REALIZATION OF IMPORT SUBSTITUTION 70
Osipova K.V.
ECONOMICS OF ENERGY LOSSES AT THE HEAT SUPPLY CYCLE 79
Карачевская Е.В., Рогачев А.Ф.
МОДЕЛИРОВАНИЕ И ОЦЕНКА ЭКОНОМИЧЕСКОЙ ЭФФЕКТИВНОСТИ
ФУНКЦИОНИРОВАНИЯ АГРОФАРМАЦЕВТИЧЕСКОГО КЛАСТЕРА
РЕСПУБЛИКИ БЕЛАРУСЬ 87

Modern Economy Success 2016, №1
5
International Research Journal “Modern Economy Success” / ISSN 2500-3747 Volume 14, Number 1 (2016), pp. 5-18
© Modern Science Success / http://www.modernsciencejournal.org/
Seidl A.F.
Professor of Economics, Ph.D., Extension Economist, Public Policy, Department of Agricultural Eco-
nomics and Resource, Colorado State University, Fort Collins, Colorado, USA.
Pshikhachev S.M.
Candidate of Economic Sciences (Ph.D.), Associate Professor, Director of Economic Institute, Kabar-
dino-Balkarian State Agrarian University named after V.M. Kokov, Nalchick, Russia.
Balashenko V.A.
Candidate of Economic Sciences (Ph.D.), Department of Economic Theory and Agricultural Econom-
ics, Samara State Agrarian Academy, Logistics Economist, Kinel Bakery Plant, LLC, Kinel, Samara
oblast, Russia.
Pshikhacheva Zh.S.
Postgraduate of Economic Theory Department, Russian State Service Academy at the Russian Presi-
dent, Chair specialist, Corporation of BDO Unikon, Moscow, Russia.
Bakanov A.V.
Emirates Professor, Director of Kinel Bakery Plant, LLC, Kinel, Samara oblast, Russia.
THE SCIENTIFIC AND EDUCATIONAL EXTENSION IS IN THE FUNCTIONING SYSTEM
OF INTEGRATED ECONOMY OF THE WORLD AGRICULTURE FOR COMPARISON
RUSSIAN EXPERIENCE
Abstract: the main aim of research could be methods of direct and indirect development in the Agri-
Industrial Complex with factor of uncertainty. Most of main aim that is regulated to all Governments is
the optimization of production volume. All nationals would like to develop the expansion of complex
agrarian policy through international trade. The state agrarian policy is based on the internal and external
standards including international. Domestic standards could be economic including a quality of physical
and human capitals, role of state in the technology development and international exchange reserve, tax
resource and social and politics. The State government has been stimulating the commercial farmers in
the support of risk management for agricultural crops to find state budget reserve to compensation from
natural changes of climate. One of principle for achievement of competitiveness supposed be subsidies.
There is a problem of building of the system risk support program through market prices at the base of
climate and bioclimatic potentials. The main tasks will be resource insurance of strategically for agropro-
ducts. This support will be founded in the legislation acts in the Russian Federation. The affair of this ac-

Modern Economy Success 2016, №1
6
tivity is provided through 50% early receiving cost and 10% of subsidy is compensated from financial
resources of all budgets in Russia. The aim of risk management should be independly to realize about ap-
plying supplemental methods of state policy agro-food system using American experience where are
represented quality indicators of economic efficiency and the growth of the investments in the agriculture
in the USA and Canada through cooperation and integration. Specially for Russia is more actually it’s be-
ing research of the US Extension development, investing and hector payments realizing which are indirect
methods in the agriculture. They are so many. These mechanisms are modern state policy in the Agro-
Food system and that is the guaranty of Food Safety.
Keywords: extension, world agriculture, business ecosystem, educational programs, farm policy
1. Introduction
One of main characteristics for Extension is
the client oriented activity. The work with data
statistics, regulated function, and educational
programs is the attribute of modern world farm
policy and Extension in the global scape. The
personal was having union strategic goals and
they are about 16 thousands people are located in
3154 counties. About 64% from staff is local
specialists, state management specialist is 15,5%,
university specialists 16,4% and federal level is
about 4,3%. The federal workers are managed
the founding and organized base programs which
are related with USDA and Congress at all state
office powerful.
The Extension system is characterized the
strong relation between who works and who gets
information. This is dynamical, improvement
and organizing system thought taking into possi-
bilities by the consumption of the farm business
in the agrarian research, educational programs
and knowledge and skills obtaining.
At the beginning this organization has been
Agricultural Extension Service, but many states
were changed name as Cooperative Extension
Service that is correctly characterized the nature
and functions of Cooperative Extension. There is
a cooperative form which is included the part-
ners on the state level and carrying out the func-
tion of research, educational and development
science opening and that has a function as a divi-
sion of the USDA – (USDA – The Cooperative
State Research Education and Extension Service
– CSREES).
The agriculture has been done many aspects
of changes moving to the vertical integration and
contracting and there is going to transformation
at the supply chain management of marketing
channels. The agricultural managers were re-
quired in their activities a new information to
effectively operate at dynamic business ecosys-
tem. The agricultural producers got needed in the
understanding of supply chain management to
have to be positing and overcoming negative
tendencies in the supply vertical system and
maximization their opportunities. The regional
agriculture was moved to the industrialization.

Modern Economy Success 2016, №1
7
Authors believe that industrialization must be
defined as applying of modern industrial tech-
nologies in the production, supplying and distri-
bution through coordination at all studies of
supply vertical system in the satisfaction of con-
sumption and supplying of consumers in the high
quality and competitiveness foods and manufac-
turing products. The key elements in the trans-
formation should be markets less got managed
produced commodity group and got characte-
rized high intensification of capital applying.
These changes would be a result of increasing
vertical integration and vertical structures form-
ing [1, 8].
Food Security is the economy of the Russian
Federation that is a base of food independence
and support of stability.
The state farm policy was changed in Russia
because that is at World Trade Organization
(WTO).
2. Context
The USA is characterized as a country with
minimum of custom protection on the foods at
WTO and the custom protection could be at
12%. The economic estimates of authors were
shown farm bill 2002 had been descripted the
farmers and ranchers have been paid at same pe-
riod (2002-2008) the profit tax was at 59 bln.
USD for 6 years and net income has been con-
sisting at 272,1 bln. USD (figures 1, 2).
Figure 1. The multipole effect of the US farm bill for period at 2002-2008 (USD bln)
By the way that domestic consumption had
level at 555,4 bln. USD and that will be profita-
ble agriculture with plus at 100 bln. USD. And
there has in the country government order which
has return rate. Also that is shown about multiple
effect from social and political stability in the
USA [1, 4, 5].
Modern Economy Success 2016, №1
8
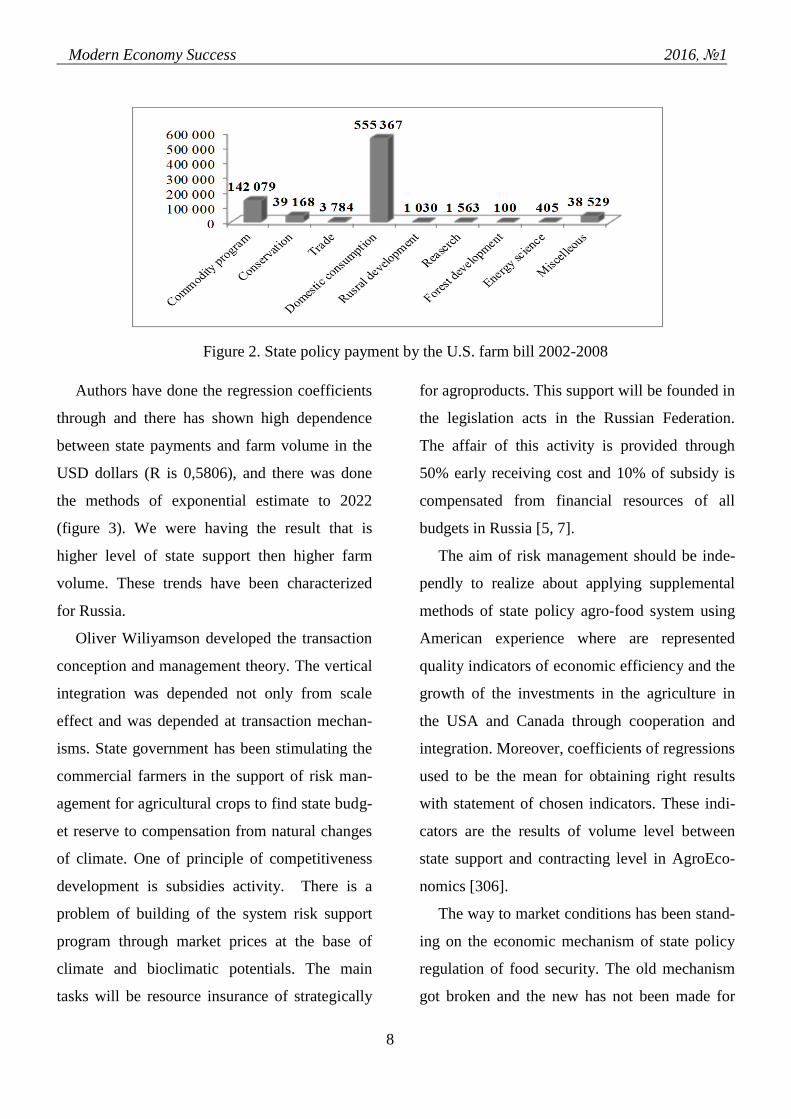
Figure 2. State policy payment by the U.S. farm bill 2002-2008
Authors have done the regression coefficients
through and there has shown high dependence
between state payments and farm volume in the
USD dollars (R is 0,5806), and there was done
the methods of exponential estimate to 2022
(figure 3). We were having the result that is
higher level of state support then higher farm
volume. These trends have been characterized
for Russia.
Oliver Wiliyamson developed the transaction
conception and management theory. The vertical
integration was depended not only from scale
effect and was depended at transaction mechan-
isms. State government has been stimulating the
commercial farmers in the support of risk man-
agement for agricultural crops to find state budg-
et reserve to compensation from natural changes
of climate. One of principle of competitiveness
development is subsidies activity. There is a
problem of building of the system risk support
program through market prices at the base of
climate and bioclimatic potentials. The main
tasks will be resource insurance of strategically
for agroproducts. This support will be founded in
the legislation acts in the Russian Federation.
The affair of this activity is provided through
50% early receiving cost and 10% of subsidy is
compensated from financial resources of all
budgets in Russia [5, 7].
The aim of risk management should be inde-
pendly to realize about applying supplemental
methods of state policy agro-food system using
American experience where are represented
quality indicators of economic efficiency and the
growth of the investments in the agriculture in
the USA and Canada through cooperation and
integration. Moreover, coefficients of regressions
used to be the mean for obtaining right results
with statement of chosen indicators. These indi-
cators are the results of volume level between
state support and contracting level in AgroEco-
nomics [306].
The way to market conditions has been stand-
ing on the economic mechanism of state policy
regulation of food security. The old mechanism
got broken and the new has not been made for

Modern Economy Success 2016, №1
9
Agro-Industrial Complex. By the way the state
support has been coming everytime. Annually
the Government was done the documents about
economic conditions for agricultural companies
in the rural area, was accepted subsidies and do-
tation for agriculture, was made tax free zones,
was created leasing found to the supplying of
techniques and genetic cattle also was developed
special found for agricultural crediting also was
done the sanitation for unprofitable crediting and
tax process development for agricultural produc-
ers and others market participant, was developed
custom service. The critical successes of state
policy had been the measures of making special
conditions for agricultural producers that is un-
ion agricultural tax in 2003 on the base of Gov-
ernment declaration and the results have been
made so quickly because about 54% agricultural
producers had been crossed in this tax. Most of
market development is done the grain and sugar
interventions. Russia is being continued to de-
velop quotas and custom service payments in-
cluding export subsidy and Mr. Allan Mustard,
who is Ambassador in Turkmenistan (he has
worked as Minister Counselor for Agricultural
Affairs in Moscow, Mexico and New Delhi), has
been noting competiveness market is not the
structure with zero level and closed market is
going to be the way of poorly in rural area and
country. You can be sure in that activity. One of
the most important for rural development will
have to become agricultural credit cooperation
because the accesses to low rates by the credits
will be so actually in the modern situation in the
Russian Federation [2, 3].
Very necessities for Russia that will be devel-
oped vertically and horizontally agricultural sec-
tor what was done and biggest quantity of agro-
holding companies has been created and success-
fully developed. Vice Minister of Agriculture in
Russia, Academician Petrikov A.V. said on the
Nikonov Readings conference: Agro-holding
companies was done the good result report for us
and now we should be obtained contractual agri-
culture and contracting will be controlled by
Ministry Department.. Probably, we must be got
the real property farmers who will be closed ter-
ritory problem and will be so positive politics
vote of the electing in the Russian Federation.
But sure we will be getting livestock supplying
of feeds issues without public large vertically
integrated companies.
In market conditions that will be increasing
the role of state policy of food security [4, 10,
12]. The U.S. cooperatives have a key role in the
helps for agrocompanies which have a share at
the American dollars. By the way many coopera-
tives have been become a new generation coop-
eratives that are closed vertically integrated
structures which providing of the producers in
the large share of the finished goods because
they were being participated in the processing
and warehouse and retailing and it was depended
from cheap inbounds resources.
They are interbranch development and inte-
gration of the market operators of the base union
ownership in the following of the effects of scale
Modern Economy Success 2016, №1
10
and synergy in the product vertical organization
and they are provided cheap and competitiveness
finished goods for Consumers with a big gram-
mar. We believe that the state policy regulation
in the Russian Federation new generation coop-
eratives development. Farmers and ranchers
were made to obtain the big share of marketing
transactions horizontally and vertically develop-
ment themselves controlling more productions
units and participating in the vertical linkages
making ownership market channels. At first de-
velopment a new generation cooperatives have
been coming in the middle of 1970 [1, 5, 8].
For Russia it could be important to know
more about creation of new generation coopera-
tives and making independence on the base U.S.
experience is developed business model for
Agriculture and native places. We and my men-
tor Andy Seidl would like to receive data analy-
sis from the first point of view of farmers and
ranchers. The U.S. processing cooperatives are
changed rapidly in the side of vertical integra-
tion. The combination of right investments have
been made the new generation cooperatives are
more complexity and completely done. The U.S.
science and research were made a big job the
giving characteristics of the new generation co-
operatives development in Agribusiness. They
were following describing and characteristics:
closed Membership; the participating depen-
dences from right accesses and ownership in the
capital; transparently ownership; the investments
and assets could be combined or not yet with ad-
ditional cost and capital.
Moreover, the stock capital for cooperatives
has been got to be a low risks in the income ob-
taining through decreasing changes of harvest
productivity and capital access.
nvestmentsPortfolioIFonAmortizatiFitInvestCredFiceF PrXF
MAXfinanceX (1)
where F (Price) – Income with highest prices;
F (Invest Credit) – Investment crediting;
F (Amortization) – Amortization;
F (portfolio Investments) – Portfolio investment.
Authors have developed the scenario of the
planning in the state policy regulation of the ver-
tical cooperative structures in the Agro-Industrial
Complex. The base was long-term forecasting
and investment decision. The projects have been
by the ideas of the Agricultural Ministry in Sa-
mara oblast. The matter of the projects has been
the rural development through tax from vertical
integrative cooperative structures. Authors be-
lieve that from made scenarios by the strategic
development in Agro-Industrial complex will be
low effectively because it has devaluation and
inflation and high credit rate.
Coefficient rate of rein financing:

Modern Economy Success 2016, №1
11
1.../K 1r rrnr KKK. (2)
Coefficient of Index profitability:
1.../K 1p ppnp KKK. (3)
Coefficient of norm profitability:
1.../K 1irr irrirrnirr KKK. (4)
Coefficient of timing:
1.../K 1t ttnt KKK. (5)
Matrix:
1... sumirrprsum KKKKK. (6)
1.../1 ttntt KKKK.
Authors develop the formulas by the efficien-
cy of the project financing and matrix of devel-
opment decisions at the accepted scenarios by
the programmer development which is practical
and universe meaning. They develop scenario
through development of vertical integration on
the base of forecasting through Project Expert [2,
5, 7].
The agriculture has been done many aspects
of changes moving to the vertical integration and
contracting and there is going to transformation
at the supply chain management of marketing
channels. The agricultural managers were re-
quired in their activities a new information to
effectively operate at dynamic business ecosys-
tem. The agricultural producers got needed in the
understanding of supply chain management to
have to be positing and overcoming negative
tendencies in the supply vertical system and
maximization their opportunities. The regional
agriculture was moved to the industrialization.
Authors believe that industrialization must be
defined as applying of modern industrial tech-
nologies in the production, supplying and distri-
bution through coordination at all studies of
supply vertical system in the satisfaction of con-
sumption and supplying of consumers in the high
quality and competitiveness foods and manufac-
turing products.
The key elements in the transformation
should be markets less got managed produced
commodity group and got characterized high in-
tensification of capital applying. These changes
would be a result of increasing vertical integra-
tion and vertical structures forming [1, 8].
Authors have done the regression coefficients
through and there has shown high dependence
between state payments and farm volume in the
dollars USA in the USA (R is 0,5806), and there
was done the methods of exponential estimate to
2022. The vertical integration was depended not
only from scale effect and was depended at
transaction mechanisms.

Modern Economy Success 2016, №1
12
State government has been stimulating the
commercial farmers in the support of risk man-
agement for agricultural crops to find state budg-
et reserve to compensation from natural changes
of climate. One of principle for achievement of
competitiveness supposed be subsidies. There is
a problem of building of the system risk support
program through market prices at the base of
climate and bioclimatic potentials. The main
tasks will be resource insurance of strategically
for agroproducts. This support will be founded in
the legislation acts in the Russian Federation.
The affair of this activity is provided through
50% early receiving cost and 10% of subsidy is
compensated from financial resources of all
budgets in Russia [5, 7].
The aim of risk management should be inde-
pendly to realize about applying supplemental
methods of state policy agro-food system using
American experience where are represented
quality indicators of economic efficiency and the
growth of the investments in the agriculture in
the USA and Canada through cooperation and
integration. Moreover, coefficients of regressions
used to be the mean for obtaining right results
with statement of chosen indicators. These indi-
cators are the results of volume level between
state support and contracting level in AgroEco-
nomics [14]. Food Security is the economy of
the Russian Federation that is a base of food in-
dependence and support of stability. Russian Act
of Farm Development is consisted that is con-
ception model of the Russian Agricultural Activ-
ity should be included in the state social-
economic policy, which must be integrated at the
sustainable for farm development and rural pro-
gressive development. Different internal state
farm policy characteristics are positioned as the
supply chain steps of food movement that is cor-
porated into one union between agri-producers
and final consumers.
The U.S. experience got shown that in the
access to WTO for Russia there has been made
very strong «Green Box». And that helps to be in
the world competition including raw farm mate-
rials and food markets.
Creation of the balanced package, which is
providing for Government of the countries
(WTO participants) for working on the Russian
market at the benefit conditions will allow for
Russian to receive the guaranty and approved
access of the trade partners market and to get the
main role in the controlling all world market as
well as regional level. Today globally to be done
a work with State Farm Program at 2013-2020,
where was included by the Russian Grain Union
by the financing of the farmers through per hec-
tor benefit (payment) [15, 17, 22, 25].
From beginning crisis in 1998 the Russian
Economy had been developing rapidly and
namely for period 1999-2005 was growth on the
6,7% annually. By the way, the growth of the
agriculture had been providing through growth
of the oil and gas economy, which are correlated
between others. The Russian agribusiness pro-
vides 11% of the employment and 5% of GDP
and wealth of the many citizens in the country.
Russia was a biggest importer with volume at
40.4 bln. USD dollars in 2013. The Federal pro-
grams of farm development were consisted the
Modern Economy Success 2016, №1
13
steps by the increasing of vertical linkage devel-
opment and as result at increasing of the farm
efficiency and providing a new technology in the
production, processing, storage and distribution
processes.
The Farm State Policy is build the livestock
breeding support with strategic increasing at 7%
annually meat production and milk production at
4,5% to get the result of decline import depen-
dence and saturated to the trade companies (su-
permarkets) of national products and using of
subsidy form for support of farm small and me-
dium entrepreneurship as well as large agri-
operators and young farmer support movement
as that is in Western countries.
A long time ago the farm was not the main
role in the Russian economy but there is become
the important role as locomotive (driver) of the
growth. The Russian agriculture has been
represented as large business and small forms of
the development. Moreover, the large business
will be given the job for small farmers and that is
true in informal sector of economy in the Rus-
sian Federation. Russia has a strong position in
the production of biofuel; by the way, very short
share in the global production as 2% but the seed
sunflowers was produced about 20% of the total
world production and consumption. Soybean
production is low level and the aerosphere in
country has volume at 1,22 mln. ton in 2010. At
present time Russia is the fifth exporter of the
grain at global market after the USA, Australia,
Canada and EU with 14% share but the Russian
Federation is the main exporter of barley with
16% share in 2011. Many experts develop a
model of farm development in Russia until 2020
on the following bases [2, 4, 8]:
The current skills are macroeconomic
projects for Russian Agribusiness;
Continuing specific development of Rus-
sian agro-industry through state policy regulation
of the farm production and trade for current
graphic-plan of sales;
Go back support in the potatoes, sun-
flower, barley, wheat and chicken meat produc-
tion;
National prices are correlated with world
prices as well as markets development;
A usual whether and trend for the har-
vesting of main export crops is prevailed.
Farm companies in the chicken production of
the agri-sector in Russia supplied 88% of the to-
tal meat broiler production and small farmers –
11%. The highest temps of increasing broiler
production are being continued in the small far-
mers. Up production of broiler meat in country
has provided through state meat and eggs of
chicken and turkey productions and other. The
program has name as meat chicken production in
Russia and its moderator was Russian Agricul-
tural Department on the national country. The
basic notes of the program were gotten cross new
providing, new methods of feeding and mainten-
ance and chicken farming. There are increasing
labor and others resource production. Also the
branch of farm production has been moderniza-
tion. We know, what 73.200 factories were done
through modernization and the total volume of

Modern Economy Success 2016, №1
14
the production was provided 703,5 thousands
ton.
Hopefully, in the vertical integrated structures
were developed the innovations by the all studies
of production and consumption to the final Cus-
tomers and that is moved to high quality and as-
sortment of chicken meat to the trade companies
(supermarkets). Notes, the share of the total in-
novation production got up from 7,3% in 2008 г.
to 14,5% in 2012, and all things allow to get high
quality chicken meat and eggs on the internal
(national) and external (world) markets through
competitiveness growth [3, 10, 18, 25].
In 1994 that is introduced the custom service
elements of regulation, modified custom tariff.
The base of the tariff had been the tariff of EU.
For period 1998 there was collapsed devaluation
of the Russian ruble to become import substitu-
tion of farm products and improvement of credit
support had been, and development of the agri-
cultural insurance and that is solving the problem
of price disparity through grain and milk inter-
ventions. Also it provides quotes in the global
trade with Russia.
EU is the main global partner with the USA
and competitor on the food market. The USA
and EU are doing the huge support in agribusi-
ness. The U.S. agrarian policy is focused in the
following crops and products: wheat, feed grain,
cotton, sunflowers, sugar beet, and dairy prod-
ucts. The Europe Union is providing the state
support for following food products: grain, cot-
ton, rice, sunflowers, nuts, dairy products and
sugar beet and fresh and processed vegetables,
fruits and animal products. From 1980 the USA
and EU are making the balanced policy by the
conservation soil. The scientists from the USA
and EU could note that 60% support is included
on these countries and unions. Furthermore,
about subsidy at 50% is being come from EU at
this support. The U.S. farm policy is characte-
rized with minimum of state regulation and there
is the main trend in America.
The basic tendency is provided no goods pro-
gram as farm conservation soil, rural develop-
ment and others. As for as we can note the U.S.
farm state policy is more adopted for Russia in
comparison the EU policy because Russia has
limited budget boarding.
The state farm support in the USA is included
food stump, farm trade, marketing and policy of
rural development and they are doing by the
Farm Bill and continuing state laws. We have the
state farm policy on the regional level, which can
be modified with state features and ethnos who
lived at that territory.
The Extension system is characterized the in-
tensive correlations between who are working in
this Service and who are using information. They
are dynamics, improved and organized system,
which are taken off the responsibilities by mak-
ing good of the consumer demand in the research
of the farm education and programs, skill and
experience getting. First, this organization had
been the name Agricultural Extension Service,
but many states had been changed the name as
Cooperative Extension Service, what more they
are shown exact reflecting of the nature (base)
and functions on the federal level, where doing
the agrariam and research, educational and start

Modern Economy Success 2016, №1
15
up making functions and working as division of
USDA (USDA – The Cooperative State Re-
search Education and Extension Service –
CSREES).
Federal Service of Extension (CSREES) is
master combining and coordinating all three
mentioned functions doing with together of state
level for Extension. Cooperative system on the
state level has a wide correlation on the horizon-
tal: university and college, pilot farm, research
center, which are located on the territory of the
state and vertical: USDA and service on the
county level. Extension Service is the unique
educational system on the national scope provid-
ing supporting the competency for farmers sup-
plying farmers and ranchers and all citizen true
information.
The originally and unique of the Extension
Service at USDA is providing three level of the
cooperation, which all participant for cooperat-
ing with strong and clear, where each participant
has independly. Extension Service has following
attributes:
Agency, which created by the U.S. Con-
gress and Government and all activity is made
through legislation Acts;
Agency, which doing the service all far-
mers and citizen without discrimination;
Cooperative System, where is represented
the rights and responsibilities of the farmers and
concretely prerogatives – USDA, state and coun-
ty levels;
Educational institute hat is consisted fol-
lowing moments:
1. The Extension does not have the clear
schedule of the courses and classes educating;
2. The Extension does not get down the dip-
loma and science degree;
3. The Extension uses informal and untradi-
tional methods of the studying for farmers and
ranchers, farm families, communities, farm busi-
ness and campus of the colleges and;
4. The Extension uses very qualified in-
structors, experts with high importance skills and
specialized education;
5. The Extension has a wide auditory from
different social society. This is so important
when the quantity of the farmers has been de-
cline
6. The Extension makes the propaganda of
the precision farming [19].
Trust to the state farm policy and ready for
agribusiness activity are very important for
USDA and the Extension is a key factor in the
providing of the state farm policy and sustaina-
ble development of the branch on the base of
high efficiency and correct management deci-
sions all aspect farm business. The characterized
description is dynamics and this is always to the
Extension. They are following principles: equali-
ty, motivated people, science approach, educa-
tion [19, 24, 25]. They are the programs by the
farm development and realizing of the rounds of
the problems with correlated safe providing of
the food products and textile for Consumers in
the USA and others country and support export
programs for farmers.
3. Conclusion
Modern Economy Success 2016, №1
16
We believe, what it will be become the state
policy regulation in the Russian Federation new
generation cooperatives development. Farmers
and ranchers were made to obtain the big share
of marketing transactions horizontally and verti-
cally development themselves controlling more
productions units and participating in the vertical
linkages making ownership market channels. At
first development a new generation cooperatives
have been coming in the middle of 1970.
For Russia it could be important to know
more about creation of new generation coopera-
tives and making independence on the base U.S.
experience is developed business model for
Agriculture and native places. We and Andy
Seidl would like to receive data analysis from the
first point of view of farmers and ranchers. The
U.S. processing cooperatives are changed rapidly
in the side of vertical integration. The combina-
tion of right investments have been made the
new generation cooperatives are more complexi-
ty and completely done.
We believe that the U.S. experience are more
actual for Russia because the farmers could be
had the distribution the grain in the mill and
bread for finished goods to Consumers than only
grain and will be having more chances in the ad-
ditional share per dollars through a new genera-
tion cooperation.
Russian scientists and Andy Seidl through
joint papers to be sure that integrative behavior
of the farmers will have to have more invest-
ments and coordination. We should know more
traditional cooperatives will not get that for next
stage of the integration development including
the level of the specification assets.
The U.S. science and research were made a
big job the giving characteristics of the new gen-
eration cooperatives development in Agribusi-
ness. They were following describing and cha-
racteristics:
1. Closed Membership;
2. The Participating dependences from right
accesses and ownership in the capital;
3. Transparently ownership;
4. The investments and assets could be com-
bined or not yet with additional cost and capital.
We are finally done the report that the vertical
cooperation is characterized following definition:
a ownership, a control and compensate of the
investors. We are sure what all three principles
are correlated. Integration of agricultural cooper-
atives is being included closed interbranch lin-
kages to internally in the Cooperative in the
supply chain.
The main aim of the Project and research
could be receiving improvement and develop-
ment scenarios of state policy regulation. There
is production alliance for new generation coop-
eratives. The quantity of the new processing co-
operatives had been increased as the agricultural
contracting. The new generation cooperatives
had been increased rapidly and so matter in
comparison elevators and supplying farmer co-
operatives. There has been demonstrated for new
generation cooperatives of the processing and
marketing developments finished agricultural
goods. Cooperation members should be provid-
ing raw materials and oil through market con-

Modern Economy Success 2016, №1
17
tracts. The quantity of these members is strictly
controlled at the share of the cooperation mem-
bers and passive responsibilities. The combina-
tion of the right investments in the cooperatives
and correlated with delivered responsibilities had
been made the new generation more complexity
and they were completely done. The project
should be developed in the agribusiness in Sama-
ra oblast with investments of 9 bln. rubles and
investing could be doing for ten years and ten
percentage of total value products growth and
rate of return will be three years for 2017 [16,
17, 20, 24].
Furthermore, these estimates reports are the
building of branding economy in the Agribusi-
ness in Samara oblast. Through good will from
state government to the investing used to be
speed Amortization of capital and that is in-
creased the competiveness and food safety. I and
Dr. Andy Seidl are sure that the new generation
cooperatives will be making liquidation of inef-
ficiency owners and giving out the work for fam-
ily farmers by the production contracts should be
invested in the financial resources. And farmers
provide this service for land and labor. There is
the U.S. model for cluster Agribusiness on the
example of Samara oblast.
References
1. Farm Bill 2014-2018, Washington D.C., USDA. 2014. 7000 p.
2. Johnson R., Hanrahan C., Schepf R. Comparing U.S. and EU Program Support for Farm Commodi-
ties and Conservation. CRS Report for Congress. Washington D.C. 2010.
3. Report USDA. Cynthia Nickerson and others. Trends in U.S. Farmland Values and Ownership. Feb-
ruary 2012. 47 p.
4. Agricultural statistics. Washington DC: USDA, 2000-2016. 990 p.
5. Agricultural cooperatives in 21 st Century. Report USDA Washington DC: 2002. 42 p.
6. Joskow P.L. Asset Specificity and Structure of Vertical Relationships: Empirical Evidence. Journal
of Law, Economics and Organization. 2008, 4:95-117.
7. Joskow P.L. Contract Duration and Relationship-Specific Investments: Empirical Evidence from
Coal Markets. American Economic Review. 2007, 77:168-85.
8. Martin S. Causes and Effects of Vertical Integration // Applied Economics, 1986. Vol. 18. P. 737 –
755.
9. Martinez S.W., K. Smith and K. Zering. Vertical Coordination and Consumer Welfare: The Case of
the Pork Industry. Washington D.C.: USDA, Economic Research Service. Agricultural Economic Report
753. August. 1999.
10. McFetridge D.G. The Economics of vertical integration in Agricultural Economics. Department of
Economics. Carleton University Ottawa Canada, 2004. N4. P. 525 – 531.

Modern Economy Success 2016, №1
18
11. USDA, Risk Management Agency. Introduction to Risk Management. Understanding Agricultural
Risks: Production, Marketing, Financial, Legal, Human Resources. 2001.
12. Vertical coordination in the U.S. food system. Edited by Jeffrey S. Royer and Richard T. Rogers.
Brookfield USA – Singapore – Sydney, 2000. 783p.
13. Warren-Boulton F.R. Vertical Control of Markets: Business and Labor Practices. 1998, Cam-
bridge, Mass.: Ballinger Publishing Co.
14. Williamson O.E. The Vertical Integration of Production: Market Failure Considerations// Ameri-
can Economic Review, 1971. N61. P. 112 – 123.
15. Williamson O.E. Markets and Hierarchies: Analysis and Antitrust Implications. New York: Free
Press, 1975.
16. Balashenko V.A. U.S. State Farm Policy: Integration Experience. Russian Institute of Organiza-
tion, Labor and Management in Agriculture. Monograph. Moscow NIPKTs-Voskhod, 2013. 308 p.
17. Balashenko V.A. Forms and Methods Development of State Policy Regulation in the Agro-
Industrial Complex. Monograph. Moscow NIPKTs-Voskhod, 2015. 412 p.
18. Pshikhachev S.M. The U.S. Agriculture: main tendency development and ecologically and eco-
nomic sustainable development of the branch. Moscow RIAPI named after A.A. Nikonov, Enciklopediya
rossiyskikh dereven, 2011 442 p.
19. Russian Agriculture: Crossed or Barricades? Allan Mustard’s Speech. U.S. Experience of Devel-
opment Education and Agriculture. Textbook. FEP FAS USDA Washington D.C. 2010. P. 4 – 16.
20. Organization and Economic mechanism of agricultural state support. Bespakhotnykh G.V. Rosin-
formagrotekh, 2004. 352 p.
21. Report of Agricultural Department in Russia 2002.
22. Risk Management and Contracting in Agriculture: theory and practice. Monograph / S.M. Pshikha-
chev, V.A. Balashenko. K.A, Zhichkin, A.A. Penkin, Zh.S. Pshikhacheva, L.N. Zhichkina. Moscow
NIPKTs-Voskhod, 2016. 208 p.
23. Petrikov A.V. The modern situation in the agrarian sphere and product safety problem. Economist
2001. №3.
24. State program of Agricultural development on the 2013-2020. Report of the Russian Government
717 from 07. 14.2012.
Modern Economy Success 2016, №1
19
International Research Journal “Modern Economy Success” / ISSN 2500-3747 Volume 12, Number 1 (2016), pp.19-31
© Modern Science Success / http://www.modernsciencejournal.org/
Mandritsa I.V.
Doctor of Economic Sciences (Advanced Doctor), Professor, Department of OTZI IITTI NCFU, Sta-
vropol, Russia.
Prof. Stefano Selleri
Università degli Studi di Parma, Campus Universitario I-43124, Italy.
Mandritsa O.V.
Candidate of Economic Sciences (Ph.D.), Associate Professor, Department of EAA IEM NCFU, Sta-
vropol, Russia.
Petrenko V.I.
Candidate of Engineering Sciences (Ph.D.), Associate Professor, Department of OTZI IITTI NCFU,
Stavropol, Russia.
MECHANISM OF ECONOMIC SECURITY RELATIVELLY TO MARKET AGENTS ON
POSSIBLE LEAKS OF BUSINESS INFORMATION
Abstract: scientific novelty consists in theoretical intentions about the composition, process and
agents of mechanism of economic security related to information protection from leakage and threats. The
zones of localization of the impact of information threats for the subject of commercial-economic activi-
ties and their likely amounts to ensure security. The levels of threats, and the threats of leaks that affect
the security mechanism with the correlation at the required counteraction market entities of the country.
Thus, increasing the validity and reliability of the feasibility study of projects and activities in the field of
information security (information systems) subjects of economic-commercial activities, budget and pri-
vate households. Address all levels that require new approaches in determining the effectiveness of in-
formation security for all agents of the market information. The article introduced the new category –
Budget-security update. It also provides the results of the experiment – Budget-security update calcula-
tion, for example budget organization-Chair of IBAS. Structurally-logical schema provided in this proce-
dure. Calculations of the main indicators for eventual confirmation of the effectiveness of the proposed
measures to enhance protection of the object. Figures and tables are presented, in which these figures by
comparing confirmed previous findings and assumptions, that the criterion of effectiveness of the pro-
posed activities to improve budgetary security are to cost specific magnitude decreased risks of damage to
information security.

Modern Economy Success 2016, №1
20
Keywords: mechanism of economic security related to information protection, Budget-security up-
date, Labor safety, Capital safety
1. Introduction
Information plays a special role in the civili-
zation evolution. Possession of information re-
sources and their rational use creates conditions
for optimal management of the country’s econ-
omy and society.
One of the main factors ensuring effective-
ness in management of various economy spheres
and social life is in the correct use of information
from different kinds. Any information which car-
ries the cost – is the business information that
fills the country's economy with added value,
later becomes the "richness" of its people [1].
The theft of business information is accor-
dingly a form of enrichment, or "pure" profits of
a stealer (hacker), both are belongs to the level of
a separate individual person or at a higher level
of economic engagement. The malefactor does
not waste resources to profit from the economic
and industrial activity of the country market
economy agent, while the overall budget of
agents loses unnecessarily incurred costs, and the
state budget even on uncollected taxes. In this
regard, the government and agents are suffering
from unnecessary costs on the creation of jobs
and for the maintenance of market conditions.
Private farms receive less jobs and workforce
losing their skills, competence and high-
performance ability, and finally firms and corpo-
rations are losing the proportion of income in the
form of sales on the market, and bear unneces-
sary costs of their activities.
The effect of business information leakage is
multiplicative as harm on three agents of a mar-
ket economy country. The malefactor extract net
income immediately in the form of ready-made
business solutions, ready-made patents and inno-
vations, ready to previously created assets place
on the liberated market shares of goods and
products, new jobs for the firm, as well as saving
your company or receipt of benefits for govern-
ment spending, of which he is. And the situation
is changing in the overall geopolitical scale.
As part of the modern world, including mali-
cious acts more common are: listening to busi-
ness talk first corporate entities, state-owned
companies, or firms leaked business plans of
firms, avenues of business intentions to develop
and expand market share, the database leaked
customer, leak contractual prices cooperation
between market agents, and other business in-
formation which carries the future added value
or future policy benefits. The pace of malefactor
progress in different forms like hacker intrusions
and infiltrations, to a large extent depend on the
state of affairs in the field of information and
computer maintenance and protection of the
most important fields of activity of market
agents of science, technology, production and
management.

Modern Economy Success 2016, №1
21
Particularly urgent is the problem of using
economic information in the sphere of material
production control, where the information
growth flow is the square progression of the
country's industrial potential. In turn, the rapid
development of process automation, the use of
computers in all spheres of modern life, in addi-
tion to the obvious advantages, resulted in the
emergence of a number of specific problems.
And the quintessential total becomes the coun-
try's budget, namely its factors: the cost of the
creation of a favorable market factors all agents
to create added value and received from the State
revenues through taxes, fees. One of them is the
need to ensure effective protection of informa-
tion at all levels of Government "arrangement".
From this perspective, the task of creating le-
gal norms setting forth the rights and duties of
individuals, collectives and State on turnover of
information, as well as its protection becomes a
vital aspect of information policy of the State. To
understand the depth and breadth of this task re-
levant theoretical aspect-the development of a
mechanism to justify the cost for information
security subjects of State-financed organizations.
Protecting business information, especially in the
economic sphere – is sufficiently specific and
important activity of all market agents. Consider
the behavior of firms in the event of damage
caused by the theft of its business information.
Potential subjects of economic and commer-
cial activity, creating a business (company) ac-
quires the resources to implement their business
ideas for profit. With the skills and competencies
he develops (embedded costs) his own business,
but every hour, day, year of the activity he wants
to make sure, first of all, that its activity is safe
for its ultimate goal – income and by creating
added the value of the product, service or prod-
uct, followed by extraction of profit and the
payment of all taxes and duties to the budget.
Also behave and private farms in the face of the
country's labor market agents. By getting jobs
they put their expertise in their work, and if ne-
cessary then seek to improve their competence,
according to the new realities of technology and
progress. In the event of the bankruptcy of com-
mercial and state structures – they suffer damage
in the form of job losses and stop the develop-
ment of their competencies.
And the essence of all becoming the country's
budget, namely its factors: the cost of creating
favorable market factors of the market agents. A
further step should be, the creation of added val-
ue and income derived from this in the form of
taxes and duties. The budget shall bear the costs
due to the fact that embedded in the creation and
further logistics jobs, civilized market organiza-
tion ensuring all population of functions: educa-
tion, medicine, physical protection and other
areas. As a result, only a simple action of the ma-
lefactor, regardless of its damage level and fur-
ther theft of business information would cause
loss of company sales shares, market conditions
affected firms, the number of jobs at this compa-
ny, the future taxes that were due to the budget
by end- financial results of the company. On face

Modern Economy Success 2016, №1
22
is the multiplicity effect from business informa-
tion theft.
2. Materials and Methods
However, it is the security of its information
systems that serve to its business process today
lends itself to many types of threats from the
outside. It is necessary to take into account that
security is the main feature of which is objective-
ly and realistically should have economic and
commercial activities. To identify the impacts to
the mechanism the economic security of eco-
nomic and commercial activities represent it in
the form of a diagram in the figure 1.
Figure 1. Malefactors impact mechanism across all channels of leakage in the economy market agents
In turn, the security agents for country-agent
market, according to Figure 1 have the following
hierarchy:
Federal security
The Russian government;
The Ministry of Natural Resources – En-
vironmental;
The Ministry of Emergency Situations –
Techno;
The Ministry of Internal Affairs - Physi-
cal;
Ministry of Social Protection – Social;
Department of Energy - Energy;
The Ministry of Trade and Industry –
Food;
Department of Health – physical;
The Ministry of Finance and the Central
Bank – Financial;
The Ministry of Communications – In-
formation;
Other ministries – Emerging other dan-
gers.
Regional security
The Government of the edges;

Modern Economy Success 2016, №1
23
The regional administration;
Regional monitoring agencies.
Local security
City Hall;
Municipal control institution;
Commercial organizations;
Budget organization (High school);
The population of the area.
Modern development and distribution of
computer systems and information networks
serving banks and stock exchanges, accompanied
by an increase of offenses related to theft and
unauthorized access to data stored in the com-
puter memory and transmitted over communica-
tion lines. Computer crimes are taking place to-
day in all countries of the world, and are com-
mon in many areas of human activity. They are
characterized by high secrecy, the complexity of
collecting evidence on the established facts of
the commission and the complexity of evidence
in court. The offenses in the sphere of computer
information can be performed in the form of:
fraud by manipulating computer data
processing system for the purpose of financial
gain;
computer spying and theft of software;
computer sabotage;
theft of services (time), misuse of data
processing systems;
unauthorized access to data processing
systems and "hacking" them;
traditional crimes in the sphere of busi-
ness (economics), made with the help of data
processing systems.
Criminals committing computer crimes, as a
rule, highly systemic and bank programmers,
experts in the field of telecommunication sys-
tems.
To date, the development of one of the market
agents, companies can identify the main chan-
nels (K) possible leak of business information [2,
12, 16], to be protected at all levels of the me-
chanism (Figure 1 – indicated by Kn):
I. Channel Leakage company revenues:
1) Revenues clients (revenue) or information
about the customer base;
2) Revenue from the received target budgeta-
ry funds, or private equity thanks to the business
plans of the organization;
3) Revenue from the presence of market re-
search firm niche market,
4) Revenues from advertising research con-
ducted by consumer preferences,
5) Revenues from the introduction of new
models and research and development, patents
and licenses, copyrights, inventions, and other
capital investments.
II. Channels "leakage" or excessive costs of
the company:
1) The cost of staff salaries to create an in-
formation system of the company, individual
farms and budget;
2) The costs of training for new jobs at new
products, company products and services, indi-
vidual farms and budget;
3) The cost of new equipment for new prod-
ucts, business products and services, individual
farms and budget;
Modern Economy Success 2016, №1
24
4) The cost of marketing, advertising and
promotions for new products, business products
and services, individual farms and budget;
5) The cost of management and control of
business activities for the period – until the lea-
kage of business information and so forth.
III. Channels "leak" came the firm – which
protect the company's profit from:
1) Loss of customer complaint – non-
pecuniary damage;
2) Loss of violations of accounting or such
absence;
3) Losses on non-compliance of contracts or
transactions;
4) Losses from the lack of automated moni-
toring of financial relationships with banks and
creditors,
5). Losses from direct non-core business op-
erations,
6). Losses from a lack of control and audit of
economic activity.
7) Other losses.
3. Discussion
In the further part of this study, the authors
consider the proposed income security, labor se-
curity and capital protection on the economic-
theoretical level.
Consider the behavior of the budget of the
Organization in the event of loss, theft, damage
or destruction of its information (information
unit), as in the form of: a database of citizens, of
the personal data of employees, databases pro-
duced and planned services the budget organiza-
tion on its core State activities, information about
the distribution or finding assets, as well as other
various information in the course of their work.
The potential subject of economic and public
activity, creating or providing public service ac-
quires resources for realization of its citizens or
clients (in the case of extra budgetary paid basis)
with a view to the fulfilment of public functions
or of the State order. Budget organization using
develops skills and competencies (bears the
costs, other expenses) your activity, but every
hour, day, and year it wants to be sure, above all,
that its activity is safety.
The question arises-what should be the cost
(cost) to create this kind of information protec-
tion to economically this was commensurate
with or as economists say is justified. It cannot
be allowed that the cost of protecting informa-
tion exceeded the cost of the public service itself,
or in other words-the cost does not exceed the
protection would be the amount of damage from
loss of information in the delivery of public ser-
vices.
Budget expenses is attached to job creation,
the Organization of civilized market with all
functions of the development of the population:
education, medicine, physical protection and
other destinations, and thus budget cares about
the effectiveness of the incurred costs.
Subject of our research budget organization
unit was selected to the North Caucasus Federal
University-Dept. of information security of au-
tomated systems (IBAS), which has been in exis-
tence since September 1, 2002 year. Area of pro-
fessional focus is technical, legal, and organiza-
Modern Economy Success 2016, №1
25
tional support for the process of protecting in-
formation in automated systems of the Depart-
ment of IBAS in the provision of public educa-
tion services to students in the learning process.
Consider the information resources to be pro-
tected on our research facility. Total information
object includes information arrays, datasets,
technical tools involved in processing and sto-
rage of information, personnel, and information
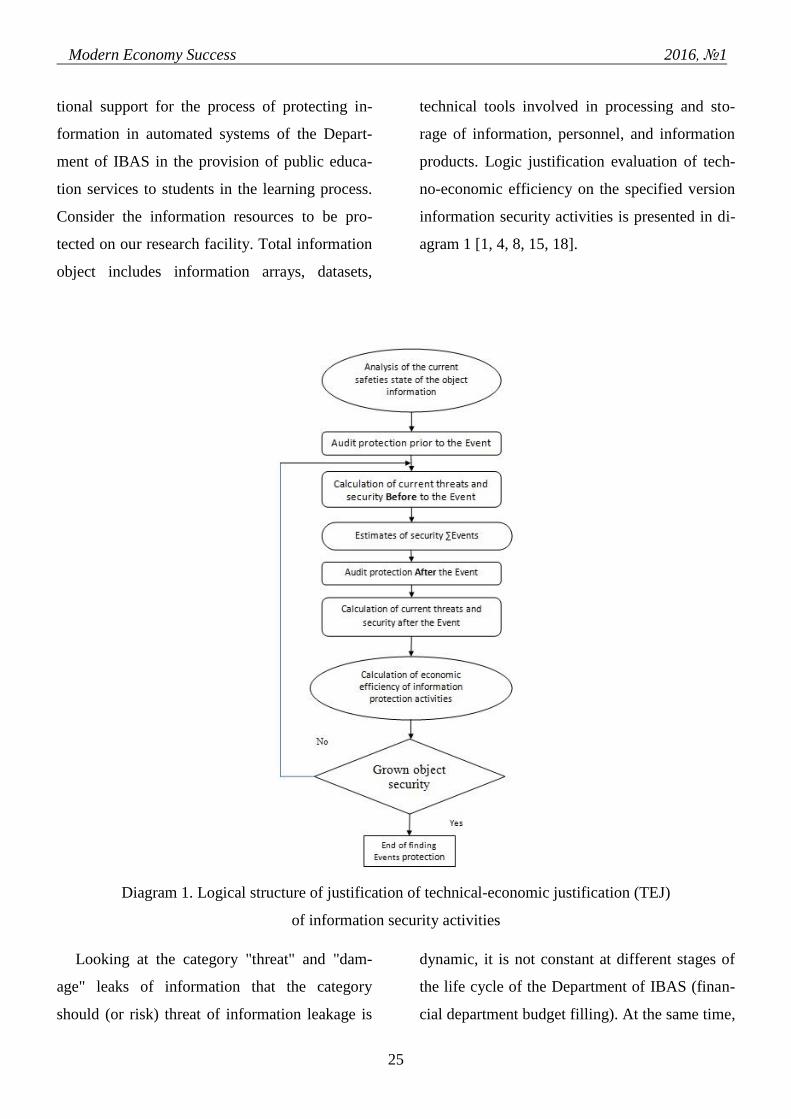
products. Logic justification evaluation of tech-
no-economic efficiency on the specified version
information security activities is presented in di-
agram 1 [1, 4, 8, 15, 18].
Diagram 1. Logical structure of justification of technical-economic justification (TEJ)
of information security activities
Looking at the category "threat" and "dam-
age" leaks of information that the category
should (or risk) threat of information leakage is
dynamic, it is not constant at different stages of
the life cycle of the Department of IBAS (finan-
cial department budget filling). At the same time,
Modern Economy Success 2016, №1
26
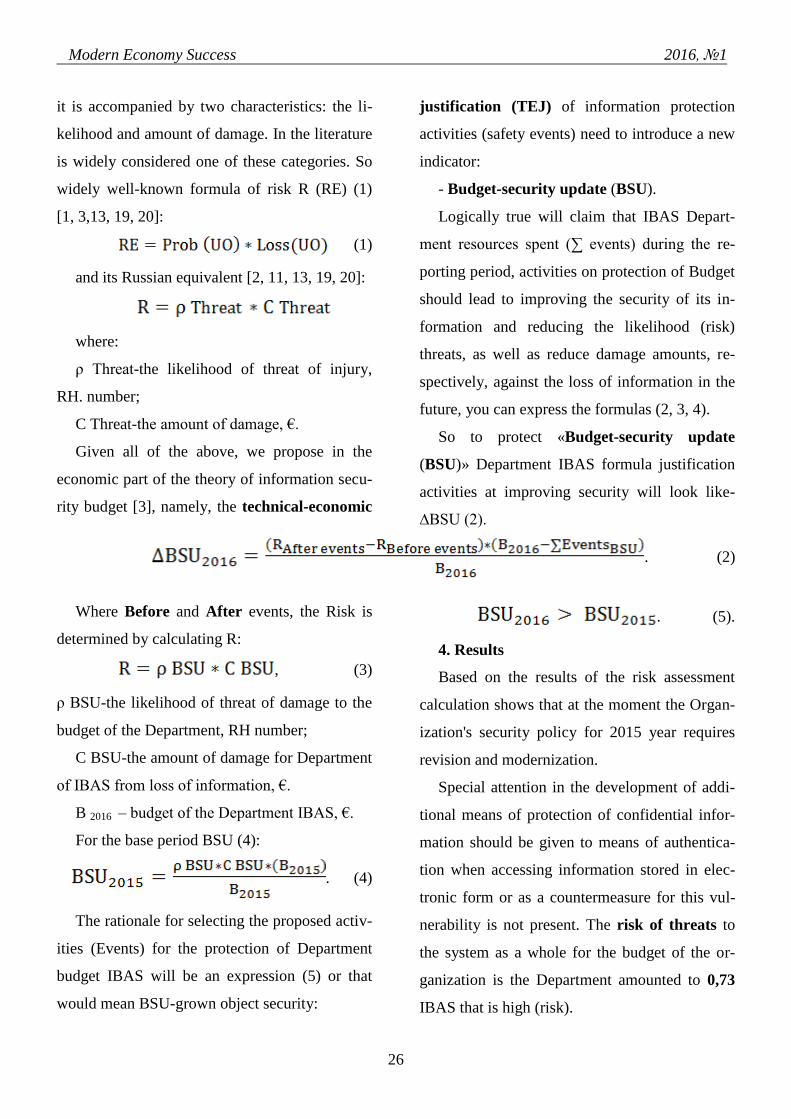
it is accompanied by two characteristics: the li-
kelihood and amount of damage. In the literature
is widely considered one of these categories. So
widely well-known formula of risk R (RE) (1)
[1, 3,13, 19, 20]:
(1)
and its Russian equivalent [2, 11, 13, 19, 20]:
where:
ρ Threat-the likelihood of threat of injury,
RH. number;
C Threat-the amount of damage, €.
Given all of the above, we propose in the
economic part of the theory of information secu-
rity budget [3], namely, the technical-economic
justification (TEJ) of information protection
activities (safety events) need to introduce a new
indicator:
- Budget-security update (BSU).
Logically true will claim that IBAS Depart-
ment resources spent (∑ events) during the re-
porting period, activities on protection of Budget
should lead to improving the security of its in-
formation and reducing the likelihood (risk)
threats, as well as reduce damage amounts, re-
spectively, against the loss of information in the
future, you can express the formulas (2, 3, 4).
So to protect «Budget-security update
(BSU)» Department IBAS formula justification
activities at improving security will look like-
∆BSU (2).
. (2)
Where Before and After events, the Risk is
determined by calculating R:
, (3)
ρ BSU-the likelihood of threat of damage to the
budget of the Department, RH number;
C BSU-the amount of damage for Department
of IBAS from loss of information, €.
B 2016 – budget of the Department IBAS, €.
For the base period BSU (4):
. (4)
The rationale for selecting the proposed activ-
ities (Events) for the protection of Department
budget IBAS will be an expression (5) or that
would mean BSU-grown object security:
. (5).
4. Results
Based on the results of the risk assessment
calculation shows that at the moment the Organ-
ization's security policy for 2015 year requires
revision and modernization.
Special attention in the development of addi-
tional means of protection of confidential infor-
mation should be given to means of authentica-
tion when accessing information stored in elec-
tronic form or as a countermeasure for this vul-
nerability is not present. The risk of threats to
the system as a whole for the budget of the or-
ganization is the Department amounted to 0,73
IBAS that is high (risk).

Modern Economy Success 2016, №1
27
The result of the audit the audit table was
drawn up, with quizzes to assess the level of
threat to the current system of information secu-
rity [4, 5,6,7].
List of issues included minimum requirements
for the smooth operation of the Department of
IBAS in protection mode "above average". Ac-
cording to the obtained results, the current level
of security audit of the Department of IBAS to-
taled 44 points-average, this means that the De-
partment can functioning.
On the basis of the conducted analysis and
audit of threats and calculating the probability of
their occurrence, we were offered standard on
today's measures to strengthen the protection of
the information of the Department of IBAS.
The measures proposed are the feasibility of
their implementation if the economic effect of
the action is higher than the costs of their im-
plementation. Imagine in table 1 the calculation
of the overall budgetary cost (value) object in-
formation.
Table 1
The annual budget of the Department of IBAS (€), 2015 year
ITEMS Workers
SALARY
per month The sum of the
Payroll Department em-
ployees 15 17500 3 150 000
Costs (maintenance, light,
energy) of the Chair on the
activities of the
15000 180 000
Depreciation of equipment on
the balance of the Department
20% of the cost of the
equipment from its re-
sidual value (50%)
6 064 630 606 463
Depreciation of existing re-
medies for the balance of the
Department
20% of the cost of the
equipment from its re-
sidual value (50%)
34 457 3 446
TOTAL annual budget on
faculty the amount of damage
3 939 909
Further, the cost estimate was made of the
measures to increase information security de-
partment at IBAS 2016 year of following condi-
tions:
- experiment on software development for
Department of IBAS will be spent 24 days or
work-168 hours;
- the cost of materials purchased semi-
finished products and articles;
- basic salary; additional salary;

Modern Economy Success 2016, №1
28
- standard deductions; the taxable base;
- retention;
- deductions of the uniform social tax;
- overhead costs; cost of machine time;
- energy costs;
- purchase costs of programmers to protect
information (KARMA, Crypto-Shield, Emsisoft
Online Armor Premium), which amounted to-31
075 €.
Thus, the total cost of the proposed activities
(Events) to improve information security de-
partments IBAS amounted to 43606.27 €.
In the next phase, we will perform a repeated
audit using previously prepared table with
quizzes to assess the level of threat to the current
system of information security, analyze the data
obtained. Putting into operation of the proposed
increases on the total protection of the object af-
ter events on the 6 conventional units (50-44).
Calculate on the proposed authors methodol-
ogy assessing the effectiveness of budget ex-
penditures on protection (table 2) in terms of
"Budget-security update (BSU) formula 2." [1].
In doing so, we remind that Budget-security
update (BSU)′ is a coefficient that reflects the
attitude of the amount spent by funds on technic-
al security tools to develop software and other
security features to total budget of IB object (rel-
ative number) protection rate range from an eco-
nomic point of view is from 0 to 1.
Table 2
Budget-security update (BSU) before/after Event
Budget-security update ′ in advance Before the event 0,000874563
1 Audit Budget-security update of threats be-
fore the event Points 44
2 Event cost estimate Estimates 43 606
3 New price Protection Department budget Budget + Estimates 47 052
4 a new annual budget for Department 2016 budget 3 983 515
5 Budget-security update after the event р. 2/p. 4 0,011811671
6 Audit of threats after the event points 50
Figure 2 would reflect the resulting calculation of indicator `Budget-security update′.

Modern Economy Success 2016, №1
29
Figure 2. Budget-security update of threats before/after the event
According to the formula we get the follow-
ing 5 change:
.
Or Budget-security update of threats be-
fore/after the event
.
Perform according to the methodology of cal-
culation of efficiency the amount spent funds on
technical security tools to develop software and
other security tools to the total budget of the ob-
ject information security (relative number) and
give details of the calculations in table 3.
Table 3
Efficiency before/after the event, €
1 The cost of one unit of the threat before the event 89 543
2 The cost of one unit of the threat after the event 79 670
3 The effect of activities (decrease value) 9 873
4 Effectiveness of activities 20,98%
The resulting indicators will reflect the cost of one unit of the threat before/after event in Figure 3.

Modern Economy Success 2016, №1
30
Figure 3. The cost of one unit of the threat before/after event
5. Conclusion
After the event the cost of conditional units
(with likelihood 0.73) declined with the price of
one unit with 89 thousand. € up to 79 thousand.
€, the absolute effect of the activities thus totaled
= 9873 €.
In turn, the effectiveness of budget expendi-
tures of the Department of IBAS for the pro-
posed us event on protecting information in
terms of the object «Budget-security update of
threats before/after the event» amounted to $
20.98%.
"Budget-security update" amounted to € per 1
0.00087 activities € budget of the Department of
IBAS, and after the event was 0.0118 € per 1 €
budget Chair IBAS that 11 times higher than
prior to the event.
This is a technical-economic justification
(TEJ) for the adoption of the proposed activities
(events), to improve the information security of
the researched object and its subsequent imple-
mentation.
When repeated calculation of information se-
curity risks of the Department of IBAS, taking
into account the modifications result was im-
proved 80%, namely the risk of loss of informa-
tion resource of the Department of IBAS is just
8.3758%.
In the following articles, the authors propose
to your attention new indicators in the form of:
cash-safety, security and capital-profit protec-
tion.
References
1. Boehm B. W. Tutorial Software risk management. IEEE Computer Society, 1988. 515.
2 Mandritsa I. V. To a question of the cost of information [Digital resource] // Bulletin of SevKavGTI.
2015. №2 (21). С. 71 – 75. (ttp://ncgti.ru/uploads/pdf/268/Vestnik21.pdf)

Modern Economy Success 2016, №1
31
3. Mandritsa I.V., Mandritsa O.V., Solovieva I.V. The economic rationale design decisions related to
information capital protection agro-industrial enterprises // Success of Modern Science and Education.
2015. №2. P. 61 – 65.
5. Tovb A.S., Tsipes G. L. Projects and project management in the modern company. Manual. M.:
CJSC «Olympe-Business», 2009. 480 p.
6. Andrianov V.V., etc. Support of information security of business / under the editorship of Kurilo
A.P. M.: Alpina Pablisher, 2011. 373 p.
7. Greenberg A.S. Protection of information resources of public administration. М.: Yuniti, 2003.
8. Domarev V.V. Information security and safety of computer systems. 1999.
9. Koneev I. Information security of the enterprise. SPb.: BHV, 2003.
10. Larina I. E., information security Economy. Manual. M.: MSIU, 2007. 92 p.
11. Odintsov A.A. Economic and information security of business. M.: «Academiya», 2006.
12. Crests N.V. Control of risk. Manual. М.: YUNITI-DANA, 1999.
13. Tsukanova O.A., Smirnov S.B. Economy of information security: manual, the 2nd issuing,
changed and added. SPb.: НИУ ИТМО, 2014. 79 p.
14. F.P. Brooks et al., Defense Science Board Task Force Report on Military Software, Office of the
Under Secretary of Defense for Acquisition, Washington, DC 20301, Sept. 1987.
15. R. Balzer, T.E. Cheatham, and C. Green, “Software Technology in the I990s: Using a New Para-
digm,” Computer, Nov. 1983. P. 39 – 45.
16. B.W. Boehm et al., “A Software Development Environment for Improving Productivity,” Comput-
er, June 1984. P. 30 – 44.
17. B.W. Boehm, Software Engineering Economics, Prentice-Hall, 1981. Chap. 33.
18. Agresti W.W. New Paradigms for Software Development, IEEE Catalog No. EH0245-1, 1986.
19. Wileden J.C., and M. Dowson, eds., Proc. Int’l Workshop Software Process and Software Envi-
ronments, ACM Software Engineering Notes, Aug. 1986.
20. Evans, M.W., P. Piazza, and J.P. Dolkas, Principles of Productive Software Management, John
Wiley & Sons, 1983.
Modern Economy Success 2016, №1
32
International Research Journal “Modern Economy Success” / ISSN 2500-3747 Volume 13, Number 1 (2016), pp.32-44
© Modern Science Success / http://www.modernsciencejournal.org/
Anan M.T.
Applied Statistics, Professor, Aleppo University, Science Faculty, Department of Statistics, Aleppo, Sy-
ria.
Alabdulla S.D.
System Analysis, Associate Professor, Aleppo University, Science Faculty, Department of Statistics,
Aleppo, Syria.
Khantomani A.
Applied Statistics, Ph.D. Student, Aleppo University, Science Faculty, Department of Statistics, Aleppo,
Syria.
INTEGRATING THE LINEAR DISCRIMINATE FUNCTIONS USING PROBABILITY
MATRIX TO GET A BETTER CLASSIFICATION
Abstract: the multi-linear Discriminate analysis is one of important statistical methods that classify
one or more of groups based on the specific features of variables,The basic objective of the discriminate
analysis is to build a base derived from adjectives in the vocabulary classified to two or more of the sam-
ple imposed, and building Discriminate function of Fisher and used in the process of discrimination,
where we can use this function to know the new single belong to one of these groups, and in addition to
predict which one provides us the rules of classification, this research aims to improve the classification
using all the linear Discriminate functions by forming a matrix of Probability for moving among the clas-
sification function to get a better result of classification, then making a classification of each group ac-
cording to the function that has the largest probability in a Probability matrix. The case study shows that
we get a classification ratio by using all the discriminate functions better than the classification ratio by
using only one function.
Keywords: multi classification, discriminate, fisher classification
1. Introduction
The Discriminate Analysis is the important
tool in the multivariate statistical analysis, which
interested in how to distinguish between two or
more groups, the basic idea of the discriminate is
to distinguish between overlapping groups or
similar have the same characteristics or qualities,
in other words, is a statistical method that use of
a set of variables to distinguish between two or
more groups by a fixed discriminate function and
how this function will be find coefficients ac-

Modern Economy Success 2016, №1
33
cording to the measurements or standards that
are obtained from the vocabulary.
Discriminate analysis is a classification prob-
lem, when two or more groups, clusters, or popu-
lations are known a priory and one or more ob-
servation are classified into one of the known
populations based on the measured characteristic
[1].
The linear discriminate analysis is considered
as one of the most important multivariate analy-
sis methods, which interested in studying the ef-
fect of a set of factors of different groups on be-
longing an observation to this group or to anoth-
er.
It is also used to distinguish between two or
more groups are similar in a lot of characteristics
depends on a number of variables [2].
Discriminate analysis is used to classify the
elements of any variable into two or more groups
depending on the variables which have the spe-
cific features, and also it is considered as an in-
strument for identifying all variables that contri-
bute in the classification process, In addition
helps us in the prediction that gives us the effi-
ciency of the classification rules [2].
The linear discriminate function formed of li-
near structures of variables will be optimal func-
tion when the probability of error classification
is small are possible, there are some assumptions
must be applied on the used data like:
1) The variables must be independent
2) The variables must have a normal distri-
bution.
3) The variance of variables must be equal
[3].
2. Research Objectives
Our research aims to use all classification
functions in the classification process that can
improve the classification ratio by using a new
method based on probability matrix. Moreover, it
aims to:
1. Highlight the most important statistical
methods in the multi-classification, which ex-
plain the relationships between the studied phe-
nomena.
2. Use the probability matrix for moving be-
tween studied group and classification functions.
3. Apply the proposed new method and
compare it with the classical method of classifi-
cation.
3. Research Methodology
Our suggested approach uses a mathematical
analysis to get scientific and logical results. In
addition, we used appropriate software, such as
EXCEL, SPSS22.0 in practice in order to fulfill
the objectives of the research.
4. Linear Discriminate Analysis
Linear discriminate analysis is one of multiple
data analysis methods which contain the stage of
the discrimination and stage of the classification.
The main objective of discriminate analysis me-
thod is to build a base and rules and then used
them to determine how any single observation
can belong to this group or another [3, 4].
Moreover, a function of discrimination is a li-
near structure of independent variables, which
used in the process of discrimination. The classi-

Modern Economy Success 2016, №1
34
fication process comes after configuring discrim-
ination function which used to classify a new
individual to one of the groups under the study-
ing by less error possible ratio [4, 5].
We use linear discriminate function when the
studied populations:
1) Have multivariate normal distribution.
2) Have different averages.
3) Have matrices variation is equal [6].
5. The Binary linear discriminant
analysis
The discriminate function is the model that
can be formulated based on the sample that was
chosen vocabulary randomly and placed in two
different groups, and we can by this function
teste and determine which the individual be-
longs to any group [8].
The basic idea of the linear discriminate anal-
ysis is to find the best straight separates data into
two different groups.
And usually they are separated or classifica-
tion of vocabulary based on measurements taken
from p random variable represented in the ma-
trix ,If we assume that,
the area of the sample will be divided into two
parts:
first group contains p variable size
and the second group also contains p variable
size It is not necessary to be = Assum-
ing that the vocabulary of the two groups are dis-
tributed multivariate normal distribution, two
means vectors are different and equal
variance
If we have the va-
riables , the linear func-
tion which join this variables as follow:
(1 )
Where f is called discriminate function and
represent the linear combination variables and
we can write it in the following formula:
(2 )
Fisher suggested to estimate coefficients w
classification so as to give a better distinction
between the two groups by maximize a Fisher
function [9]. And expresses its as follows
. (3)
Where:
:Between classes variance matrix and ex-
press as follows:
. (4)
Where vector average of the first group
vector average of the second group
Within classes variance matrix is given as
the following:
. (5)
Where: Matrix variation of the group i.
Taking the maximum value for the inverse
function of Fisher we get a vector "coefficients
function classification " of the (𝑝 × 1),
. (6)
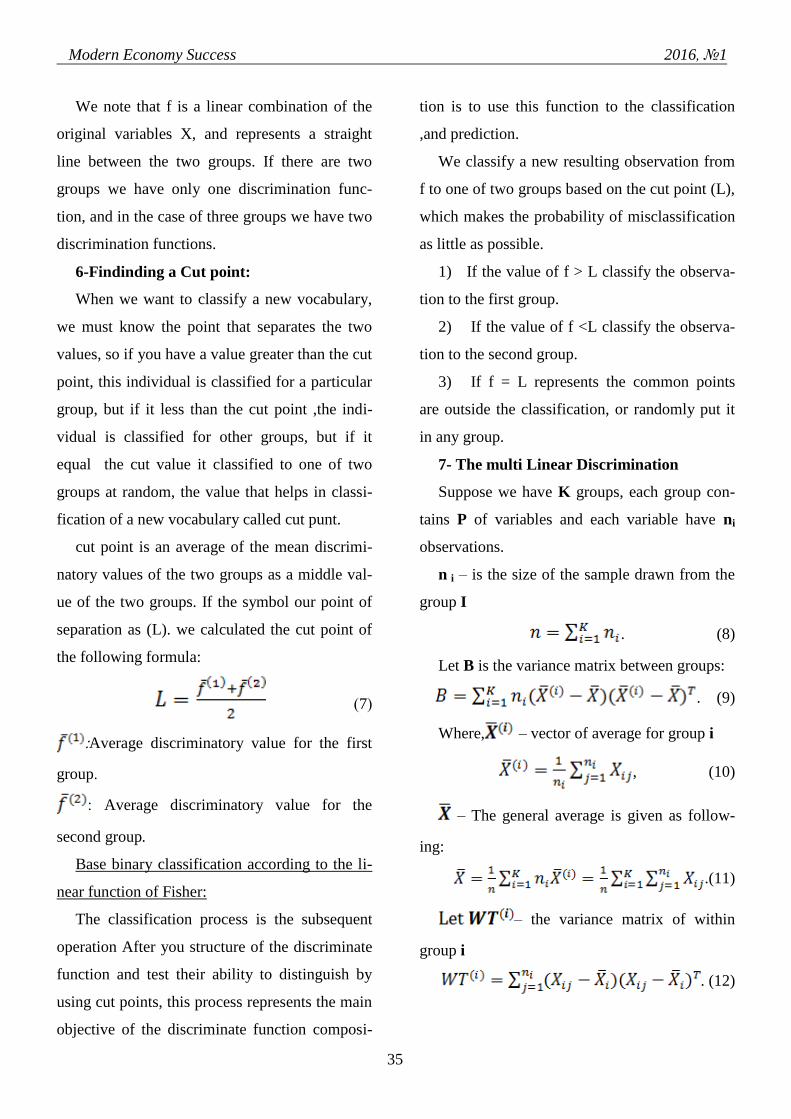
Modern Economy Success 2016, №1
35
We note that f is a linear combination of the
original variables X, and represents a straight
line between the two groups. If there are two
groups we have only one discrimination func-
tion, and in the case of three groups we have two
discrimination functions.
6-Findinding a Cut point:
When we want to classify a new vocabulary,
we must know the point that separates the two
values, so if you have a value greater than the cut
point, this individual is classified for a particular
group, but if it less than the cut point ,the indi-
vidual is classified for other groups, but if it
equal the cut value it classified to one of two
groups at random, the value that helps in classi-
fication of a new vocabulary called cut punt.
cut point is an average of the mean discrimi-
natory values of the two groups as a middle val-
ue of the two groups. If the symbol our point of
separation as (L). we calculated the cut point of
the following formula:
(7 )
:Average discriminatory value for the first
group.
: Average discriminatory value for the
second group.
Base binary classification according to the li-
near function of Fisher:
The classification process is the subsequent
operation After you structure of the discriminate
function and test their ability to distinguish by
using cut points, this process represents the main
objective of the discriminate function composi-
tion is to use this function to the classification
,and prediction.
We classify a new resulting observation from
f to one of two groups based on the cut point (L),
which makes the probability of misclassification
as little as possible.
1) If the value of f > L classify the observa-
tion to the first group.
2) If the value of f <L classify the observa-
tion to the second group.
3) If f = L represents the common points
are outside the classification, or randomly put it
in any group.
7- The multi Linear Discrimination
Suppose we have K groups, each group con-
tains P of variables and each variable have ni
observations.
n i – is the size of the sample drawn from the
group I
. (8)
Let B is the variance matrix between groups:
. (9)
Where, – vector of average for group i
, (10)
– The general average is given as follow-
ing:
.(11)
– the variance matrix of within
group i
. (12)

Modern Economy Success 2016, №1
36
And WT – the variance matrix of within the
groups
. (13)
Our goal is to create a set of linear structures
which are linear functions of discrimina-
tion , where r is the
number of discrimination functions. In general
the Number of discrimination of K groups and P
of variables is:
r= No. of Discrimination Functions=min (P,
K-1)
For this purpose, Fisher suggested to find the
maximum value of λ function according to b;
where b is the classification functions coeffi-
cients
. (14)
To maximize λ, we take the partial derivatives
according to b and make it equal to zero, where
we get:
(15)
To get the linear discrimination function coef-
ficients b, we Find:
(16)
Then we Find the values of λ where the big-
gest value is the biggest root of the ma-
trix , so we get the first discrimination
function coefficients ;
.
We denote by to the first discrimination
function and write it mathematically as:
.
The second biggest value of the root of the
matrix gives us the second discrimina-
tion function of coefficients
.
We denote by to the second discrimina-
tion function and write it mathematically as:
.
Where uncorrelated with .
So we continue to which is uncorrelated
with .
All these functions are
called the linear functions of discrimination,
which can be expressed by the following matrix:
.
The number of the distinct functions for K of
groups and P variables depends on the
rank( ،the rank equal to (p)
(rank = rank WT), and rank (B) be
smaller for (P, K-1) r = min (P, K-1).
8-Base multi-classification according to the
linear discriminate function to Fisher:
1) Find the coefficients of the linear discri-
minate functions b and then drop the data on all
functions .
2) Find the averages of the groups through
the following formula: .
3) Order the Ascending averages groups.

Modern Economy Success 2016, №1
37
4) calculate the cut points between the aver-
ages of the groups and that which their number
is equal to the number of groups minus one
which is given the following formula:
,
m=1,2,…,k-1.
5) Make the classification of the data ac-
cording to the first function.
9-Testing the significant of the linear dis-
criminate functions: This step is the most im-
portant steps of the discriminate analysis, it
means to test the ability of the function to distin-
guish between the groups ,else this function will
not be used in discrimination and prediction the
new unknown of vocabulary. If the function is
significant, this means that they have the ability
to distinguish between groups, and if the func-
tion is not significant, it means that the function
does not have the ability to distinguish between
groups.When we want to distinguish between the
groups, we must test the hypothesis of equal
groups.
(This means that the func-
tion has no ability to distinguish)
)This means that the func-
tion has ability to distinguish),It is clear from the
text of the primary hypothesis that the average of
the discriminatory values of the first group are
not statistically different from the average of the
discriminatory values for the second group.If
you were to accept the primary hypothesis, this
means the discriminatory values of the two
groups have the similar pattern and this indi-
cates, that the function has no ability to distin-
guish).In the case of reject the primary hypothe-
sis, it means that the discriminatory pattern of
values in the first group differs from the pattern
of the values in the second group, which refers to
the function has the ability to distinguish.
some of the Measurements which are used
in the case of the discrimination between the
two groups: 1. Measurement Hotelling: Hotel-
ling symbolized by as follows:
.
Where:
( .
Using the F test, which will be phrased as fol-
lows:
,
we reject if:
,And ac-
cept and this shows that the averages of the
two groups are equal, there is no significant dif-
ference between the two groups, this means that
the distinctive linear function is scalable to dis-
tinguish a high degree.
In the case of the distinction between more
than two groups:
The primary hypothe-
sis: .
The alternative hypothe-
sis: .
2.Measurement Wilkes Lambda:
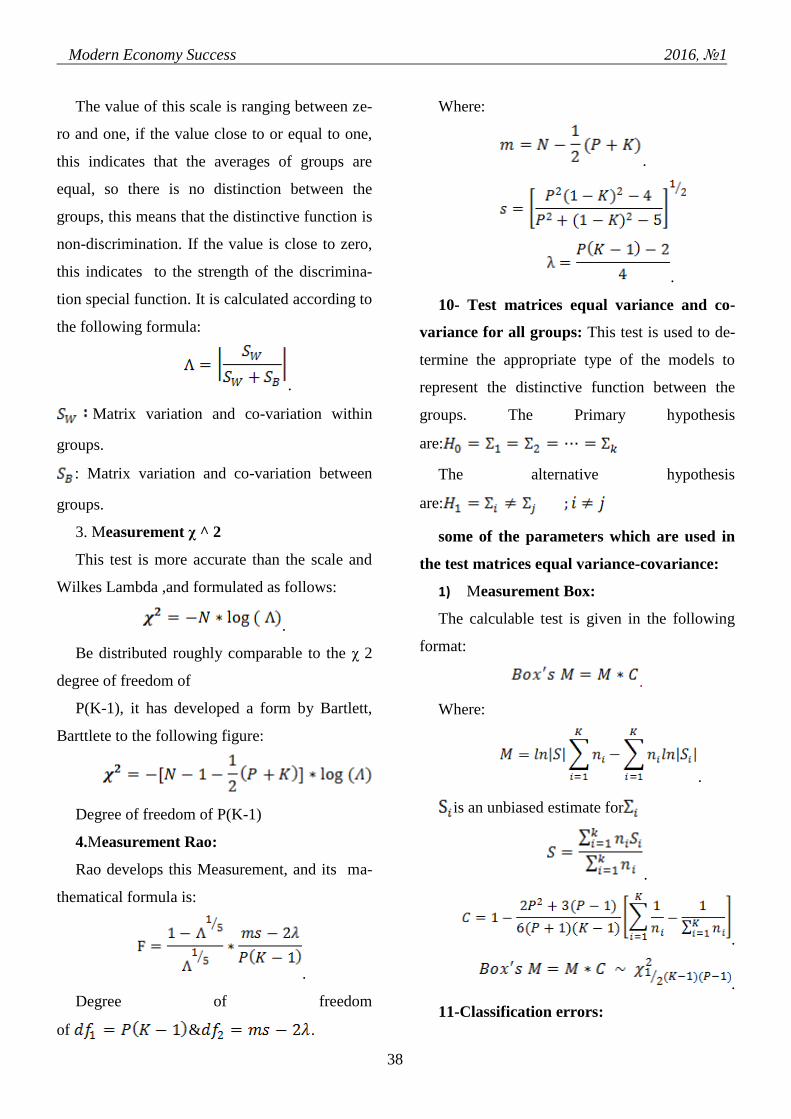
Modern Economy Success 2016, №1
38
The value of this scale is ranging between ze-
ro and one, if the value close to or equal to one,
this indicates that the averages of groups are
equal, so there is no distinction between the
groups, this means that the distinctive function is
non-discrimination. If the value is close to zero,
this indicates to the strength of the discrimina-
tion special function. It is calculated according to
the following formula:
.
Matrix variation and co-variation within
groups.
: Matrix variation and co-variation between
groups.
3. Measurement χ ^ 2
This test is more accurate than the scale and
Wilkes Lambda ,and formulated as follows:
.
Be distributed roughly comparable to the χ 2
degree of freedom of
P(K-1), it has developed a form by Bartlett,
Barttlete to the following figure:
Degree of freedom of P(K-1)
4.Measurement Rao:
Rao develops this Measurement, and its ma-
thematical formula is:
.
Degree of freedom
of & .
Where:
.
.
10- Test matrices equal variance and co-
variance for all groups: This test is used to de-
termine the appropriate type of the models to
represent the distinctive function between the
groups. The Primary hypothesis
are:
The alternative hypothesis
are:
some of the parameters which are used in
the test matrices equal variance-covariance:
1) Measurement Box:
The calculable test is given in the following
format:
.
Where:
.
is an unbiased estimate for
.
.
.
11-Classification errors:
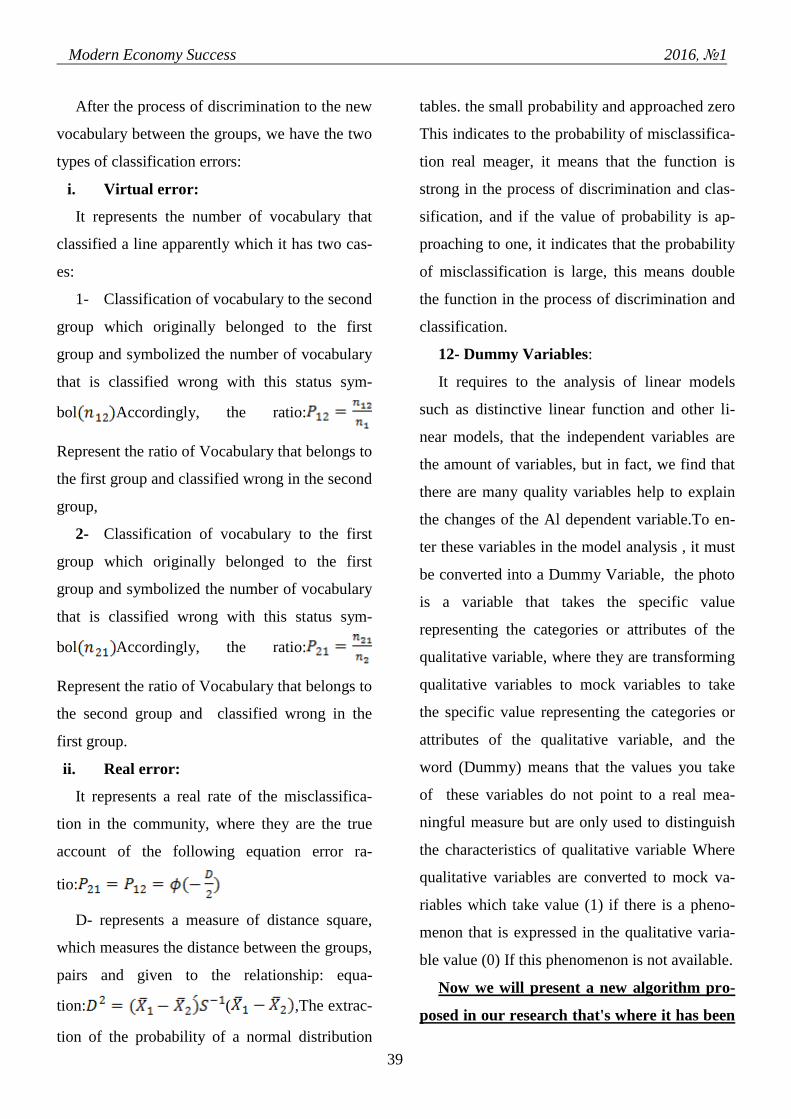
Modern Economy Success 2016, №1
39
After the process of discrimination to the new
vocabulary between the groups, we have the two
types of classification errors:
i. Virtual error:
It represents the number of vocabulary that
classified a line apparently which it has two cas-
es:
1- Classification of vocabulary to the second
group which originally belonged to the first
group and symbolized the number of vocabulary
that is classified wrong with this status sym-
bol Accordingly, the ratio:
Represent the ratio of Vocabulary that belongs to
the first group and classified wrong in the second
group,
2- Classification of vocabulary to the first
group which originally belonged to the first
group and symbolized the number of vocabulary
that is classified wrong with this status sym-
bol Accordingly, the ratio:
Represent the ratio of Vocabulary that belongs to
the second group and classified wrong in the
first group.
ii. Real error:
It represents a real rate of the misclassifica-
tion in the community, where they are the true
account of the following equation error ra-
tio:
D- represents a measure of distance square,
which measures the distance between the groups,
pairs and given to the relationship: equa-
tion: ( ,The extrac-
tion of the probability of a normal distribution
tables. the small probability and approached zero
This indicates to the probability of misclassifica-
tion real meager, it means that the function is
strong in the process of discrimination and clas-
sification, and if the value of probability is ap-
proaching to one, it indicates that the probability
of misclassification is large, this means double
the function in the process of discrimination and
classification.
12- Dummy Variables:
It requires to the analysis of linear models
such as distinctive linear function and other li-
near models, that the independent variables are
the amount of variables, but in fact, we find that
there are many quality variables help to explain
the changes of the Al dependent variable.To en-
ter these variables in the model analysis , it must
be converted into a Dummy Variable, the photo
is a variable that takes the specific value
representing the categories or attributes of the
qualitative variable, where they are transforming
qualitative variables to mock variables to take
the specific value representing the categories or
attributes of the qualitative variable, and the
word (Dummy) means that the values you take
of these variables do not point to a real mea-
ningful measure but are only used to distinguish
the characteristics of qualitative variable Where
qualitative variables are converted to mock va-
riables which take value (1) if there is a pheno-
menon that is expressed in the qualitative varia-
ble value (0) If this phenomenon is not available.
Now we will present a new algorithm pro-
posed in our research that's where it has been
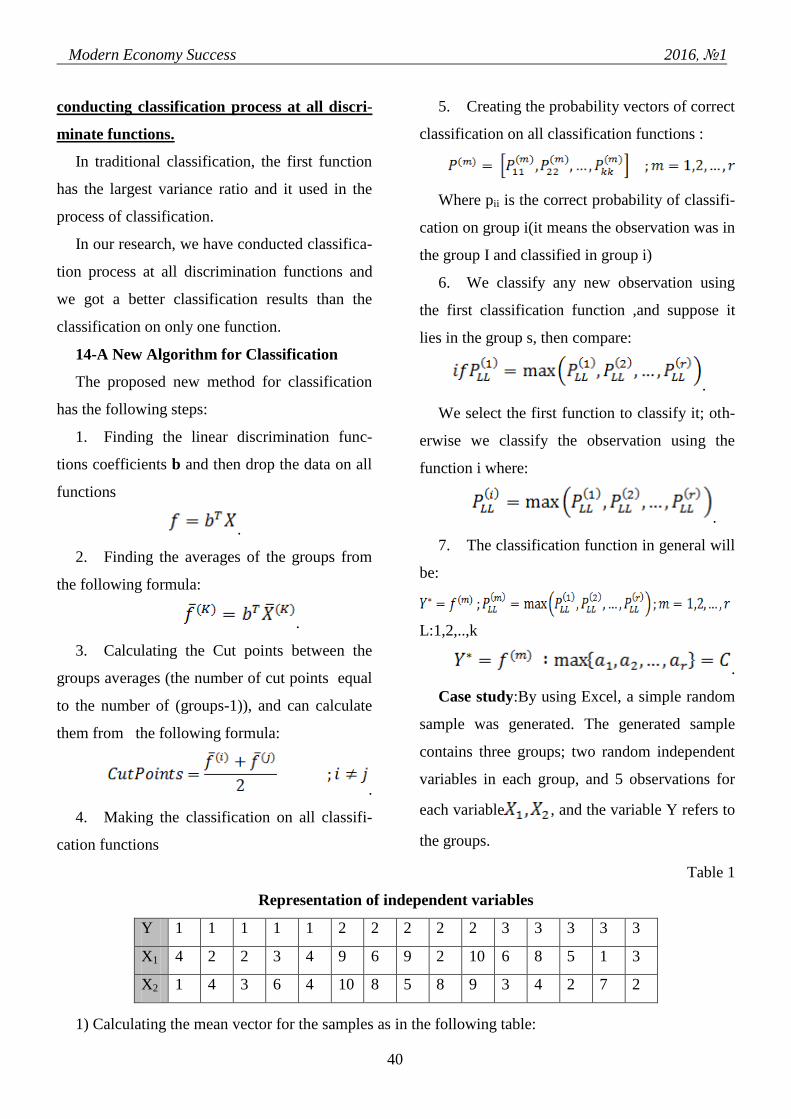
Modern Economy Success 2016, №1
40
conducting classification process at all discri-
minate functions.
In traditional classification, the first function
has the largest variance ratio and it used in the
process of classification.
In our research, we have conducted classifica-
tion process at all discrimination functions and
we got a better classification results than the
classification on only one function.
14-A New Algorithm for Classification
The proposed new method for classification
has the following steps:
1. Finding the linear discrimination func-
tions coefficients b and then drop the data on all
functions
.
2. Finding the averages of the groups from
the following formula:
.
3. Calculating the Cut points between the
groups averages (the number of cut points equal
to the number of (groups-1)), and can calculate
them from the following formula:
.
4. Making the classification on all classifi-
cation functions
5. Creating the probability vectors of correct
classification on all classification functions :
Where pii is the correct probability of classifi-
cation on group i(it means the observation was in
the group I and classified in group i)
6. We classify any new observation using
the first classification function ,and suppose it
lies in the group s, then compare:
.
We select the first function to classify it; oth-
erwise we classify the observation using the
function i where:
.
7. The classification function in general will
be:
L:1,2,..,k
.
Case study:By using Excel, a simple random
sample was generated. The generated sample
contains three groups; two random independent
variables in each group, and 5 observations for
each variable , and the variable Y refers to
the groups.
Table 1
Representation of independent variables
Y 1 1 1 1 1 2 2 2 2 2 3 3 3 3 3
X1 4 2 2 3 4 9 6 9 2 10 6 8 5 1 3
X2 1 4 3 6 4 10 8 5 8 9 3 4 2 7 2
1) Calculating the mean vector for the samples as in the following table:

Modern Economy Success 2016, №1
41
Table 2
Average of the variables of the three groups
2) Calculating the coefficients of linear functions , and values in the following table:
Table 3
Classification coefficients
3) Calculating by using the first function:
F1{
}
4) Calculating by using the second function :
F2{
}
5) Computing the means for all groups on the
first function:
.
6) Making Ascending Order to means for
groups and creating a cut points for the classifi-
cation process on the first function
.
7) Computing the means for all groups on the
second function:
.
8) Making Ascending Order the means of
groups and created cut points for the classifi-
cation process on the second function:
.

Modern Economy Success 2016, №1
42
9) Classifying results by the two functions in the following table:
Table 4
Classification on two functions
10) Creating the correct probability vector on
first function and it is:
.
The vector shows that 3 observations were
classified correct on first group, all observations
were classified correct in the second group, and
3 observations were classified correct in third
group.
11) Creating the correct probability vector on
the second function which is:
.
We take the first observation and classify it
using the first function; we found that it lies in
the first group, then we correct probability classi-
fication on both functions:
.
So we classify according to first function (the
probabilities are equal). In the same way we
classify the second observation according to first
function. We take the last observation and classi-
fy it by the first function which lies in the first
group, then correcting probability classification
on both functions:
.
As shown, we classify it according to the
second function
Table 5
Comparison between traditional and the new method of classification
From Table 5, we find:

Modern Economy Success 2016, №1
43
The probability of correct classification
according to the first function for all groups is
73%.
The probability of correct classification
according to the second function for all groups is
60%.
The probability of correct classification
according to the new function for all groups is
80%.
6. Conclusions
As shown in table 5, we got better ratio of
classification by using the new method than the
ratio of using traditional methods and:
1. The percentage of correct classification
using Fisher linear function by the first function,
which has the largest variance ratio, was 73%,
which is considered as a good ratio.
2. The percentage of correct classification
by the new method (i.e classification using prob-
ability matrix by two functions) is 80%, which is
an excellent ratio.
Depending on the above results, we recom-
mend using our algorithm in practical studies
because, as we proved, it works better than the
classical methods.
References
1. Annan, Mohammed Taher, note Zakaria, KhantomaniAya 2015. Using Principal Component Analy-
sis /PCA/ With the Fisher's Function in Classification, Aleppo University Research Magazine, Issue 106.
2. Annan, Mohammed Taher, note Zakaria, KhantomaniAya 2016-Changing Some of Eigen Vectors
Items in Method /PCA/ To Improve The Classification in Fisher Function, Aleppo University Research
Magazine, Issue 110.
3. Al-Kassab, Muwaffaq Mohammed. 2001 using the style of discrimination in the classification of
pregnant women according to the degree of risk, the magazine Rivers Development, Number 63, folder
23.
4. Dawod, Arab Abdul Rahman. 2000, using of discriminanat function to show the effect of diet in ob-
ese patients, Journal of Two Rivers development, the number of 61.22 folder.
5. Anwarabd-al Karim. 2002, using discriminatory statistical methods to diagnose certain heart dis-
ease, Kirkuk University, Faculty of Science magazine, the University of Kirkuk scientific studies, Issue 1.
6. Dabdoub al-Rawi Omar. 2007, the use of quality control and function discriminatory, Mosul Uni-
versity, Journal of Education and Science, Issue 1, folder 19
7. AliMalik S, Ehsan Nazik. 2011. Use of Discriminant function method for forecasting students re-
sult, Institute of Management/ Rasafa, Iraqi Journal of Market Research and Consumer Protection, Issue-
5, folder 3
Modern Economy Success 2016, №1
44
8. Anderson T.W. 1984."An Introduction to Multivariate StatisticalAnalysis",2nd Edition , John Wiley
and Sons, New York, USA.
9. IlyaNarsky&Frank C. Porter. 2014. Statistical Analysis Techniques in Particle Physics, Wiley-VCH,
United State of America, 461.
10. Alvin C.R. 1996. Methods of Multivariate Analysis, John Wiley & sons. P. 20 – 70.
11. James M. 1985. Classification Algorithm, London. P. 58 – 80.
12. Lachenbrach P.A., Mickey M.R. 1986. Estimation of Error Rate in Discriminate Analysis, Tech-
nimetrics. Vol. 10. P. 20 – 30.
13. Rondle, H. Borffitt,JD. Rawbery, J.S. &Hogg, R .V, 1978. Discriminate Analysis based on Ranks
JASA, Vol .73. P.110 – 11.
14. Guo Y., Hastie T. and Tibshirani R. 2007, Regularized linear discriminant analysis.
15. Andersen. 2003. Testing hypotheses of equality of covariance matrices and equality of mean vec-
tors and covariance matrices, in An Introduction to Multivariate StatisticalAnalysis, John Wiley & Sons,
WileySeries in Probability and Statistics, 3rd edn.
16. Zhang L.H., Liao L.Z., and NG. M. 2010,Fast algorithms for the generalized Foley – Sammon dis-
criminant analysis. SIAMJ. Matrix Anal. Appl., 31, 1584 – 1605.
17. Ye, J. and Xiong,T. -2006,Computational and theoretical analysis of null space and orthogonal li-
near discriminant analysis. J.Mach. Learn. Res., 7, 1183 – 1204.
18. Barker M. and Rayens, W. 2003. Partial least squares for discrimination. J. Chemometr., 17, 166 –
173.
19. Timm Neil H. 2002. Applied multivariate analysis. Springer.
20. JiepingYe .Least Squares Linear Discriminant Analysis, Arizona State University, Tempe, AZ
85287 USA.

Modern Economy Success 2016, №1
45
International Research Journal “Modern Economy Success” / ISSN 2500-3747 Volume 13, Number 1 (2016), pp.45-57
© Modern Science Success / http://www.modernsciencejournal.org/
Maksimova T.P.
Candidate of Economic Sciences (Ph.D.), Associate Professor, Plekhanov Russian University of Eco-
nomics, Moscow, Russia.
Bondarenko N.E.
Candidate of Economic Sciences (Ph.D.), Associate Professor, Plekhanov Russian University of Eco-
nomics, Moscow, Russia.
Milyaev K.V.
Researcher, "Research and Development Institute "INTEGRA", Plekhanov Russian University of
Economics, Moscow, Russia.
THE INVESTMENT ATTRACTIVENESS AND FEATUARES OF FORMATION OF AGRO-
INDUSTRIAL CLASTERS IN THE RUSSIAN ECONOMY
Abstract: the present article reflects the authors' views on the subject of different approaches to ex-
plore features of changes in the agrarian sphere of economy. Authors think that one of the best ways to
change the form and ways of economic management, according to the authors, is to create agro-industrial
clusters in Russia. The authors consider some theoretical aspects of creating agro-industrial clusters in the
system of national economy, pay their attention to historical aspects of dialectic development of the clus-
ter theory, analyze a possibility of exploiting advantages of clusters in relation to the agrarian sphere of
national economy, carry out a development of the author’s hypothesis of an official functionally struc-
tured modeling of organization of agro-industrial clusters and offer to consider agro-industrial clusters as
a possible way of the reformation of business patterns in economy of the Russian Federation. Special em-
phasis is placed on the exploration of the different issues of investment attraction and investment climate
of agroindustrial clusters based on soil and climatic diversity of a region along with historically estab-
lished distinctive features of economic management. Additionally, the article demonstrates a development
of the authors' hypothesis of an official functionally structured modelling of investment attraction of re-
gional agro-industrial clusters.
Keywords: agro-industrial clusters,, investment attraction, investment potential
1. Introduction
Difficulties of the whole process to create an
agrarian sphere within the RF economy persuade
researchers to search for the ways and methods
of solving the existing problems, including
scientific and theoretical grounds to accept op-
Modern Economy Success 2016, №1
46
timal solutions while reforming. Recently more
attention has been given to agro-industrial clus-
ters acting as a determinant of a stable develop-
ment of the agrarian sphere of national economy.
While the scientific society continues controver-
sy about the grounds of creating agro-industrial
clusters, the choice of optimal organizational and
structural models as well as alternative invest-
ment sources, this economic phenomenon gradu-
ally occupies a niche in Russian practical eco-
nomic management. In 2015, for instance, in
Novgorod Region, which in Russia historically
belongs to poor soil zone, a large- scale company
called “Bristol, Ltd.” has proceeded to imple-
ment the project on agro-industrial clusters [25].
The creation of this particular agro-holding, like
any other large-scale investment project, is
graded. The startup period, which will last until
2016, focuses mainly on plant-growing produc-
ing, cultivating, stocking and processing potato
in particular. It should be noted that the potato in
Russia, according to some unspoken rule, is con-
sidered “second bread” and despite the technolo-
gical changes people continue to plant it in their
personal subsidiary plots (PSP) and their subur-
ban plots (so called dachas). In this case two
specifications are of special interest. Firstly,
Western economies lack such form of economic
management as Personal Subsidiary Plots (PSP)
and suburban plots (dachas), which are based on
the right of private land ownership [11]. Second-
ly, potato planting on one’s own land for indi-
vidual consumption and surplus sale on the mar-
ket can be regarded as one of the deep-rooted
traditions in Russia concerning land economic
management, which is no longer used in the
Western practice.
The issue to create clusters in agrarian sphere
of national economy is not completely new. For
example, zoning matters and specialization of
economic activity, as well as integration ties
formation depending on the dominant features in
the production process in the agrarian sphere of
land resources and environmental factors were
given consideration even before market-style
reforms both in theory and in action [11, p. 192-
195]. Local systems of regional agrarian clusters
in periodical shock conditions of the RF agrarian
economy affected by both endogenous and ex-
ogenous factors can be seen as stable develop-
ment point for the whole system of national
economy. Exogenous factors in modern condi-
tions can influence seriously the heightened in-
vestment interest to agrarian sphere of Russian
economy due to absolutely new “phenomenon”:
the policy of “sanction opposition” between Rus-
sian and Western economies. This phenomenon,
which sprung up as a “product” of ill-explicable
(from a common sense point of view) decisions
of political institutions of the European coun-
tries, the USA and Russia, and on one hand, be-
came a hindrance to further development of ob-
jective globalization process of agro-industrial
markets. On the other hand, that phenomenon
made relevant the necessity to solve problems of
providing inner expanded production in the agra-
rian sphere of the RF economy [12]. According-
ly, the writers assume that the investigation of

Modern Economy Success 2016, №1
47
potential investment possibilities in the sphere of
RF agrarian economy and the analysis of region-
al investment potential to create agro-industrial
clusters presents a keen interest.
2. Materials and Methods
While writing this article as an outcome for
intermediate research of forming agro-industrial
clusters aspects depending on investment attrac-
tion analysis in various regions of Russia, the
authors chose to use the following research me-
thods: abstract-logical, monographic, analysis
and synthesis method, along with the statistic
and investment analysis methods. Theoretical
and methodological approaches in the research
of agro-industrial clusters in the economy system
of Russia requires, in the first place, to define
more precisely the basic definition - “agro-
industrial cluster” [11, p. 16-23]. The input in the
economic turn, the common term “cluster” is
usually referred to M. Porter.
M. Porter associated this concept with geo-
graphical concentration of transactors, bound by
one, and the same type of economic activity as
one of the mechanisms of competitive advantag-
es for such activity. However, initial sources de-
termines essential characteristics of this particu-
lar definition were observed in the works of J.
Thunen and A. Marshall. Long before using the
term “clusters”, J. Thunen researched the main
principles of this economic concept. J. Thunen
per se is the founder of the location theory (or
the theory of production localization – authors’
editing) by the example of agriculture [3, p. 299-
302]. Undoubtedly, many J. Thunen’s theses on
discovering the objective laws of localizing an
agriculture production, which are formulated in
his “Isolated State” in modern perception may
seem quite abstract. Especially this concerns the
issues on localization zones of agriculture activi-
ties around urban establishments because of the
isolation from outer relations with an official
economic model. It is important, however, that at
present there is a relevance of the issue of pro-
duction forces localization in agriculture as one
of their determinant of stable development of
rural regions.
A. Marshall focused his attention on the is-
sues of production organization, which also indi-
rectly concerns the essential cluster characteris-
tics. [13] Along with this, A.Marshall’s algo-
rithm to examine the advantages of organization
may be presented in the form of a logical chain:
natural organization of people in a society – the
process of division of labor – specialization of an
educational process – usage of the advances of
the technological progress – territorial speciali-
zation of production (authors’ editing). In Chap-
ter 10 of his “Principles of Economics”, where
A.Marshall explores the issues of concentration
of specialized industries in separate regions, he
practically describes the essential characteristics
of the category “cluster”, although he is not us-
ing the very term “cluster” but “location” instead
[13, p. 257]. Interestingly enough, A. Marshall,
while studying production location issues, refers
to agrarian sphere of Russian economy. In par-
ticular, he wrote: “In Russia the accretion of
family groups up to the size of a rustic estab-

Modern Economy Success 2016, №1
48
lishment generates the emergence of localized
productions, along with this there are innumer-
ous villages, each of which produces only one
kind of produce, or even a part of a produce”.
Additionally, it is important that the main rea-
sons for localized productions, both in the times
of A. Marshall and in modern conditions, are
first of all “natural conditions - character of the
climate and the soil, richness in minerals and
wall stone in the given region or within striking
distance on land or in water” [13, p. 258]. At the
beginning of the 20th
century based on the statis-
tic method, B.S.Yastremskiy explored clusters in
Russia. In particular, he determined the criteria
to group different regions depending on the kind
of activity: “in agricultural regions such criterion
was land plottage, in cattle breeding – the
amount of cattle” [23]. P.Krugman explores at
the present time features of the formation of
clusters, as well as the benefits of territorial loca-
tion [8, 9].
Adapting the accumulated knowledge on the
theory of clusters and the practical experience of
economic management, the writes mark out the
following chief features of forming modern agro-
industrial clusters:
Firstly, production specialization in local eco-
nomic regions depending on soil and climate
conditions as well as geographical fatures of a
region. Secondly, features of production organi-
zation based on large-scale specialized form of
management. Thirdly, the differences in the cri-
teria of specialization for agriculture and cattle
breeding
Based on the above mentioned feature, the
writers distinguish clusters resulting from a geo-
graphical and climatic formation of enterprises,
suppliers and sales companies, inside of which
there is a complete food production cycle, per-
sonnel training, making supplementary products
[10, р. 16-23].
The issues of agro-industrial clustering will
be integrated and adapted to modern realities of
the transformation of business forms in the agra-
rian sphere of national economy, functionally
structured modeling of agro-industrial clusters,
where well developed agro-business holding
companies are considered as an organizational
kernel of agro-industrial clusters, will be possi-
ble (Figure 1).
Figure 1. Formal and organizational structure of the second model of an
agro-industrial cluster (Author’s drawing)

Modern Economy Success 2016, №1
49
According to this model, agro-business hold-
ing companies which are interconnected with
small business forms functioning on the geo-
graphical cluster territory thanks to the system of
contract relations are the center of a cluster. This
system assumes use of the methodology of mod-
ern institutional theories and is widely used in
practice in the developing economies. It allows
two main business forms-large and small ones-
being developed in parallel and without serious
consequences. A bright example of solution of
the problems of stable development in an agra-
rian sector of economy is the experience of Bra-
zil where agro-business holding companies are
engaged in processing, and peasant farm enter-
prises (PFE)-in production providing raw mate-
rials for agro-business holding companies.
Agro-business holding companies are a quite
new phenomenon to the Russian economy, but
are on the upswing [10, p. 18-20]. By the eco-
nomic nature and functional filling in existing
forms, in fact, they are integrated mini-cluster
formations, considering that:
• Specialize on the release of certain products
taking into
account the territorial, geographical and cli-
matic features;
• Interact with small independent business
forms in the form of PFE;
• Indirectly or directly perform social func-
tions on those rural territories where they are en-
gaged.
Small business forms, proceeding from the
management practice, are presented on the
scheme not only by PFE, but also family farms
(FF), personal subsidiary farms (PF), individual
entrepreneurs (IE), and others. Thus, small busi-
ness forms in order to avoid their economic
“pressure” and absorption on the part of agribu-
siness holding companies can form cooperative
ties as one of the organizational ways of the sta-
bility in the competitive fight against large busi-
ness forms. That is, the cooperation is
represented by the author as an additional struc-
tural element in the general system of the con-
tractual relationship of an agribusiness holding
as a local economic system. Besides, the pre-
sented way will be coordinated with the general
principles of mechanism of creating clusters ac-
cording to which “one or several firms reaching
competitiveness in the world market expand in-
fluence on the immediate environment: Suppli-
ers, consumers and competitors. In turn, the en-
vironment success has positive impact on the
further growth of competitiveness of this compa-
ny.
3. Investment Attraction of Agro-industrial
Clusters
According to Russian Stats data for 2014 in-
vestment dynamic in the agro-industrial complex
is still extremely low. For example, in the agri-
culture basic capital there is still 3,5% of the in-
vestment overall scope in other branches of RF
national economy [25]. While analyzing the is-
sues of investment attraction of agro-industrial
clusters, it is necessary to note that there is a sin-
gle unified definition of this concept and there
are unified criteria of investment attraction [21].

Modern Economy Success 2016, №1
50
Under investment attractions, the authors distin-
guish a set of characteristics of the development
of regional agro-industrial complex as invest-
ment medium. This set of characteristics results
from solvent demand for investment. Alongside
with this, it is absolutely obvious that this con-
cept has an unconditional context of subjectivism
from the position of single investors [11, p. 192-
195]. That means having one and having the
same figures of economic and financial indices
of a potential investment object, investment at-
traction of this object for various investors can
be different.
According to the authors’ approach, if we
take regions as territories where potentially agro-
industrial clusters can be established, this will
give us an opportunity to zone regions in correla-
tion with the amount of profit by investors from
all the possible investments in the agro-industrial
complex of economy in single regions. The writ-
ers provide us with a model of calculating in-
vestment attraction based on the use of informa-
tion from an analytical research “Investment at-
traction rating in the regions of Russia”, prepared
by a rating agency “Expert PA” and being a part
of an international group RAEX [5]. This model
is based on the analysis of two metrics: firstly,
they are the metrics evaluating regional attrac-
tion for investors in a form of a rating assess-
ment. Secondly, they are the metrics that charac-
terize potential possibilities of forming agro-
industrial clusters in a region as well as the de-
velopment of regional cluster initiatives.
From a mathematical point of view, invest-
ment attraction of agro-industrial clusters comes
to a definition of an integral performance index,
which is determined by a set of economic and
financial indices, as well as indices of state, so-
ciety, legislative, political and social develop-
ment of a region. In an overall formalized ap-
proach this can look as follows:
IAR= F (IPR, IR, IEP), where IAR is invest-
ment attraction of a region, IPR is investment
potential of a region, IR – investment risks, IEP -
indices to economic progress of agro-industrial
branch.
Investment potential of a regional agro-
industrial cluster allows considering a whole set
of objective conditions and prerequisites for in-
vestment (customer demand, main economic in-
dices, offering resources, institutional conditions
and so forth) and evaluating real possibilities to
attract investment to the region. There are vari-
ous approaches to define the concept of invest-
ment potential of a region. The authors of this
publication see investment potential as the ability
of the region to satisfy the demand in investment
resources without attracting borrowed funds,
based on available production factors. Common
investment potential of a region as well as in-
vestment attraction index are integral and are
calculated based on 9 private potentials (before
2005 – 8 potentials). Each of these potentials in
its turn also includes certain subsystem. Thus,
there are following groups:
Natural resource indices group (overstated
supply of main natural resource reserves);

Modern Economy Success 2016, №1
51
1. Labor indices group (labor resources and
their educational level);
2. Production indices group (cumulative ef-
fect of economic management of population in
the region);
3. Innovation indices group (science devel-
opment and application of scientific and technol-
ogical advances in a region);
4. Institutional indices group (development
degree of the leading institutes of the market
economy);
5. Infrastructure indices group (economic
and geographical position of a region and its in-
frastructural well-being);
6. Financial indices group (tax base, profit-
ability of the regional companies and income of
the population);
7. Consumption indices group (combined
purchasing capacity of the population of a re-
gion);
8. Tourism indices group (touristy places,
amenities, accommodation).
The second main index is investment risks.
As a rule, it is a qualitative characteristic de-
pending on a range of social, political, economic,
financial, ecological and other factors. At present
scientists mark out the following risk types [2]:
1. Economical (a tendency in the economic
development of a region);
2. Financial (equilibrium level of the budget
of a region and a company's finances);
3. Social (the level of social tension);
4. Ecological (level of environmental pollu-
tion, including radiation);
5. Criminal (crime rate considering gravity
of crimes, economic delinquency and crimes,
concerning illegal drug traffic);
6. Management (quality of budget manage-
ment, availability of programme and action
oriented papers, level of infant mortality as an
integral index of social service outcome).
Furthermore, the authors present three stages
of calculation of investment attraction index of a
region. At stage 1 of evaluation of investment
attraction segments of each Russian region are
estimated according to the nine kinds of invest-
ment potential as well as the indices of the six
types of investment risks. At stage 2 all the re-
gions are rated according to the value of com-
bined investment potential or integral investment
risk. Lastly, at stage 3 of comparative assessment
of investment attraction each region receives an
efficiency rating of investment attraction - an
index determining a ratio of the integral invest-
ment risk level and the value of combined in-
vestment potential of a region. Based on such
ratio each Russian region can be attributed to one
of the 12 rating categories.
Apart from the main two indices several
groups of indices that show the development of
the agro-industrial complex in a region are also
analyzed. Those groups of indices consider such
factors of cluster development as competitive-
ness, the level of innovative activity, amount of
highly qualified staff.
These indices are structured into the follow-
ing groups:
1. Index to economic progress of agriculture

Modern Economy Success 2016, №1
52
of regions (agriculture produce, mil. rubles, plant
growing produce, mil. rubles, cattle breeding
produce, mil. rubles, agricultural produce per
head, mil. rubles)
2. Financial indices (investment into the
main capital in agriculture, agricultural compa-
nies’ turnover, mil. rubles)
3. Social and economic indices (amount of
agricultural labor force, thousand people, specif-
ic weight of rural population)
4. Science and innovation development in-
dices (availability of higher educational agricul-
tural institutions)
5. Infrastructure development indices (retail
trade turnover, mil. rubles, amount of agricultur-
al companies, amount of transport and logistic
companies in the region, availability of fertilizer
production companies)
6. Region's investment rating
The authors believe that such model will en-
hance a more precise determination of forming
cluster groups on the territory of the Russian
Federation regions. It should be noted that the
very methods of statistic clustering are one of the
best to distinguish clusters and observe their de-
velopment, as in this case we deal with a com-
prehensive approach that allows us to consider
the maximum factors that influence the forma-
tion itself of agro-industrial clusters.
Alongside with this, the discussed above
structure functional model considers more essen-
tial factors and conditions of the production
process in the whole technological chain starting
from agricultural raw material production up to
the end product, i.e. this model has its grounds in
the main aspects management methodology of
business processes in a cluster. In such a model
all the technologically bound activities are im-
plemented in a form of integrated production
economic system. Cluster formation assessment
at regional level meets more precisely the fea-
tures that can characterize a territory agglomera-
tion. Here such parameters as geographic prox-
imity, technological community, infrastructure a
retaken into consideration.
Modern Economy Success 2016, №1
53
4 .Research Results
Hierarchic clustering analysis of several va-
riables used in our particular case visually dem-
onstrated the possibilities of regions to form
agro-industrial clusters. Hierarchic clustering is
built on the assumption that large-scale clusters
are divided into small-scale ones, which by-turn
are subdivided into even smaller ones and so
forth. Such an approach allows to more precisely
compare indices of agro-industrial development
with those of investment attraction of regions
and discover obvious possibilities to create re-
gional agro-industrial clusters with a high degree
of investment attraction.
The analysis of each Federal District is sum-
marized in a table of two column. In the first
column has the name of a region. In hierarchical
methods every single observation creates first of
all its own separate cluster. At the first step two
neighboring clusters combine. Then intergroup
relations are built. When the primary report on
already established relations is made, it is neces-
sary to discern the very relations between indices
that are the strongest. For this reason coupling
constant is examined. By coupling constant we
mean the distance between any two clusters
which is determined based on the chosen dis-
tance measure but considering the provided val-
ue transformation. In our case it is square Eucli-
dean distance, distinguished by means of stan-
dardized values. At the stage when the distance
measure between the clusters increases in spurts,
the process of aggregating into new clusters must
be interrupted. Because otherwise the clusters to
join together will be relatively far from each oth-
er and consequently will have a low index corre-
lation. Such analysis algorithm allows to discov-
er the amount of clusters that corresponds to a
high correlation criterion. The annexed tables
present the number of regions where agro-
industrial clusters are created.
The values in the other column of the table
show the number of correlation discovered in
regions - the degree of clustering: the less is the
value, the higher is the chance to form an agro-
industrial cluster with a high investment attrac-
tion on the territory of that particular region.
Equal values in the column are evidence of iden-
tical degree of index correlation in different re-
gions. For instance, in Central District the most
attractive region where integral relation is al-
ready established is Belgorod Region. Having
massive indices for agro-industrial production,
this region differs in developed infrastructure
along with a high investment attraction. In such
regions as Voronezhskaia, Ivanovskaia, Kos-
tomskaia one can observe high potential to create
clusters [24]. Moscow being a city of federal im-
portance also possesses, according to the analy-
sis, a potential to form clusters. But this is an
outcome of a large quantity of scientific organi-
zations in the first place as well as the developed
transport and retail infrastructure. A medium in-
dex of investment potential in this district is in
its average values.
In the second Federal District – North-
Western, the region with obvious cluster poten-
tial are the Republic of Karelia, Komi, Yamalo-

Modern Economy Success 2016, №1
54
Nenetskiy Autonomous District, Novgorod and
Vologda regions. Saint Petersburg as well as
Moscow has concentrated a huge number of
scientific and educational institutions alongside
with a developed infrastructure [24]. Despite the
low level of investment potential, the regions
located below the polar circle retain the basis of
their agriculture in deer breeding and other cli-
mate specific activities. These activities influ-
ence immensely the lifestyle of people living
there, which is why the improvement of invest-
ment climate is considered to be a task of utmost
priority to support the quality of life.
In the South Federal District the regions that
stand out with their cluster potential are Krasno-
dar Region, Volgograd Region, and Rostov Re-
gion. Here the reasons of high indices are found
in the positive effects the deep-rooted traditions
of land economic management, developed infra-
structure and fertile soil and climate. Great im-
portance present the many specialized educa-
tional and scientific institutions, which train per-
sonnel for the regions of the agricultural com-
plex. What is more, Krasnodar and Rostov Re-
gions are those of ten most attractive regions
from potential investment point of view. The re-
gions such as Adygea, Kalmykia, and Astrakhan
Region also demonstrated an essential potential
of clustering, although the investment potential
in those regions is below average.
According to the analysis of Privolzhsk Fed-
eral District, the Republic of Tatar Stan, Bash-
kortostan, Saratov, Nizhniy Novgorod, Orenburg
and Penza Regions besides the developed agro-
industrial complex and high production indices,
their investment potential is above average [24].
Considering the fertile climate of the Federal
District, wide range of higher educational institu-
tions that train personnel to work in agro-
industrial sector, it is worthwhile to provide
over-all support for cluster initiatives and inte-
gration ties from state institutions and transac-
tors.
In the Northern Caucasian Federal District, as
the analysis show, the development of cluster
initiatives is not enough. However, among the
regions two transactors stand out – the Republic
of Dagestan and Stavropol Region, which have
the necessary infrastructure and possibilities to
develop integration in the sphere of agricultural
production [25].
The analyzed data from the Ural Federal Dis-
trict show that all the regions except Kursk re-
gion have their investment potential below aver-
age. Such regions as Sverdlovsk, Tyumensk,
Chelyabinsk, apart from a relatively high level of
investment potential, also possess developed
agricultural infrastructure and high potential to
form agro-industrial clusters of various speciali-
zation.
Territories of Novosibirsk, Irkutsk, Keme-
rovsk, Krasnoyarsk regions of the Siberian Fed-
eral District have grounds to create agro-
industrial clusters due to high values of the main
indices during the analysis as well as a high level
of investment potential. These regions attract
investors.

Modern Economy Success 2016, №1
55
While analyzing the Far East Federal District
it became obvious that the cluster initiatives in
agriculture are at a low level of development.
Average values of investment potential indicate
main tasks to deal with in that region. Yakutia,
Primorsk and Amursk regions possess the best
opportunities in cluster formation. Specialized
Universities, developed transport system distin-
guish these regions.
5. Conclusion
Thus, it can be said that the issues of agro-
industrial clustering in theoretical aspect are in-
directly considered in parallel with the origin and
development of the cluster theory in general. If
the basic principles of J. Thunen (about the loca-
tion of productive forces), A. Marshall on pro-
duction localization (use of advantages of the
climate and soil), Weber on the standards (or ag-
glomerations, namely, the expediency of the
production location in its concentration places),
M. Porter (on geographical concentration and
specialization). The results of the present re-
search demonstrate that both in theory and in ac-
tion the issues on agro-industrial clusters forma-
tion are up-to-date and require further considera-
tion and development.
Based on the analysis investment attraction
and potential possibilities of Russian regions, it
can be claimed that, firstly, in a range of Russian
regions there are cluster initiatives in the agro-
industrial complex necessary to form agroindu-
strial clusters. The forecasting investment attrac-
tion of the in the agricultural of the Russia is
based on a classical and modern models of the
clusters providing the large, small and medium
business in the regions, of course, when ensuring
necessary state support. The development of re-
gional clusters with the inclusion of the PSE,
small farms, enterprises, plants, organizations for
transportation, storage and pack of products, the
inclusion of a regional retail and the system of
food markets was already approved in the coun-
tries with the developed economy. However, in
each certain case, and in case with Russia, the
issue on an individual approach to the implemen-
tation of a concrete model of the development in
a certain country and even in a certain region of
the country is of interest to further researches.
An emphasis on so-called “real economy” espe-
cially in the Russian conditions is extremely im-
portant in the system of the stable economy de-
velopment.
High indices of infrastructure, production, in-
vestment attraction as well as climatic conditions
compose a basis for a stable development. Se-
condly, such regions should be given prioritized
consideration, especially when government insti-
tutions allocate financial resources for agricul-
tural development of the Russian Federation
economy. The suggested mechanism of alloca-
tion will help in creating agro-industrial clusters,
whose stable development will become a grow-
ing point for a common economic development
of separate regions. The analysis of the model-
ling results has demonstrated that on the territory
of the Russian Federation at present there is a
process of formation of agro-industrial clusters
of various specializations in 27 regions. The cre-
Modern Economy Success 2016, №1
56
ation of regional agro-industrial clusters will al-
low on the whole to increase investment attrac-
tion both of branches and of regions.
References
1. Bergman E., Feser E. (1999) Industrial and Regional Clusters: Concepts and Comparative Applica-
tions. Virginia: WVU Regional ResearchInstitute. 258 p.
2. Bertinelli L., Decrop J. (2002). Geographical agglomeration: the case of Belgian manufacturing in-
dustry // Federal planning bureau. Economic analyses and forecasts. November. 45 p.
3. Blaug M. (1994) The theory of Location of Industries A.Weber // Economic thought in retrospective
review = Economic Theory in Retrospect. M.: Delo, 1994. P. 578 – 580. XVII. 627 p.
4. Fujita М., Krugman P., Venables A.J. (2001). The Spatial Economy: Cities, Regions, and Interna-
tional Trade. Cambridge. The MIT Press. 367 p.
5. Investment rating of the regions of Russia (2015) Retrieved from
//http://www.raexpert.ru/ratings/regions
6. Khamzin I.I., Khamzina O.I. (2015). Stimulation of private investors involvement for effective land
// Modern Science Success. №4. P. 33 – 37.
7. Krugman P.R. (1996). The Self-Organizing Economy. Cambridge, Blackwell. 122 p.
8. Krugman P. The Role of Geography in Development (1999) International Regional Science Review
22, 2. P. 142 – 161.
9. Krugman P.R., Obstfeld M. (2008). International Economics: Theory and Policy. Prentice Hall. 712
p.
10. Maksimova T.P. (2015). Theoretical aspects of the formation of agro-industrial clusters in the Rus-
sian economy // Bulletin of Moscow State Regional University. №3. P. 16 – 23.
11. Maksimova T.P. (2013). Questions of methodology, theory and practice of institutional transfor-
mation of property relations and forms of management in the agricultural sector of the national economy
// News of Orenburg State Agrarian University. №2 (40). P. 192 – 195.
12. Maksimova T.P. (2016). Muhanizm of the influence of informal institutions on traektorriyu trans-
formation of the agrarian sector of the Russian economy: methodological aspects // Success of Modern
Science and Education. 2016. №2. P. 24 – 30.
13. Marshall A. (2010). Principles of Political Economy” Transl. from English. M.: Progress. T. 3. P.
416.
14. Porter M. (2005). Competitiveness. Transl. from English. M.: Viliams». P. 608.
15. Porter M.(1998). On Competition. Boston: Harvard Business School, 1998; Porter M. Clusters and
the new economics of competition. Harvard Business Review November-December. P. 77 – 90.
16. Pyjikova N.I., Titova E.V. (2016).Develoment of the system of key indicators of efficiency for the

Modern Economy Success 2016, №1
57
agro-industrial complex // Modern Science Success. №1. P. 33 – 38.
17. Rakhinskiy D.V, Malimonov I.V., Korol L.G. (2016) .The influence of organizational values on
the organizations staff of APK // Modern Science Success. №2. P. 33 – 36.
18. Stejskal J. (2010). Comparison of often applied methods for industrial cluster identification. URL:
http://www.wseas.us/e- library/conferences//pdf
19. Titova E.V. Optimization of business processes in agriculture (2015). // Success of Modern
Science and Education. №5. P. 48 – 52.
20. Tolenado J.A. Propjs des Filires Industrielles // Revue d’Economie Industrielle. V. 6. Spain, 1978.
P. 149 – 158.
21. Vershinina A., Zhdanova O., Maksimova T., Perepelitsa D. (2015). The Formation of Indicator
Framework for Effective Assessment of Investment Attractiveness of the Region/ International Journal of
Economics and Financial Issues.| Vol 5. Special Issue. P. 1 – 6.
22. Yang X. (2003). Economic Development and the Division of Labor. Oxford, Blackwell. 636 p.
23. Yastremskiy B.S. (1920). Relation between the elements of pheasant economic management in
1917 and 1919 // «Vestnik statistiki». P. 19 – 21.
24. http://www.gks.ru/wps/ [Federal Service of State Statistics of RF]
25. http://www.mcx.ru [Official site of the Ministry of agriculture]
Modern Economy Success 2016, №1
58
International Research Journal “Modern Economy Success” / ISSN 2500-3747 Volume 13, Number 1 (2016), pp.58-69
© Modern Science Success / http://www.modernsciencejournal.org/
Prasolov V.I.
Candidate of Political Sciences (Ph.D.), Financial University under the Government of the Russian
Federation, Russia.
Kesego Mosime
Economist, Gaborone, Republic of Botswana.
THE CONCEPT AND ORGANISATION OF THE FUNCTIONING OF AN ECONOMIC
SECURITY SYSTEM OF AN ORGANISATION
Abstract: this paper addresses the theoretical foundation for an economic security of enterprise
(ESE)”. The article reveals the basic content and organisational support for the economic security of a
business entity. The article reveals the main content and organisational support for the economic security
of the business entity. Summarizing the view of many both domestic and foreign authors, as well as
summarizing issues related to the economic security of an enterprise, demanding immediate solution, we
identified key issues. It can be useful to the management of the departmental security function to view
security as a sub-system within the overall administrative and management system. Within the security
system there are policies, procedures and practices to support the co-ordination of physical security, per-
sonnel security and information technology security. The systems concept of security offers flexibility
within a standard approach. Threat and risk assessments should identify security factors unique to specific
departments and locations. Another feature of the systems concept is that, should any part of a system be-
come inoperative or suspect, another part can be substituted, a temporary alternative installed, or another
part of the system upgraded, to maintain integrity. The economic security of subject of economic activi-
ties, various forms of ownership is a priority of the administration and commercial activities.
Keywords: economic security, economic security of the enterprise (ESE), risk management, concepts,
organisation, resource protection, threats
Economic security is one ofthe essential man-
agement functions. Itnever existed in itself, it is
derived from the objectives of economic stabil-
ity, growth and flexibility at every stage of soci-
ety evolution. The specific content of this factor
varies with the internal and external conditionsin
every given period of time. Current socio-
economic situation in Russia,crisis and sanc-
tions, defined by the West, are responsible for
specific problems of the economic security.
Active integration and globalisation of the
world economy determines the priority of eco-

Modern Economy Success 2016, №1
59
nomic security issues. The crisis phenomena in
the economy and political confrontation has des-
ignated the heavy dependence on the economies
of many countries. This dependence determines
the need to strengthen the economic security of
both the government and private subjects of the
economy.
Ensuring economic security of economic enti-
ties with various forms of ownership is a priority
task of management and business.
The modern period in the Russian political
and economic system is characterized by need to
develop methods and technologies to ensure
economic security of economic entities. The
complexity of this problem is determined by
thecurrent period of national economy: unjusti-
fied sanctions and internal problems,the lack of
scientific concept of development, political in-
stability and the inertia of thinking.
Summing up the opinions of many domestic
and foreign authors, as well as the issues, related
to the economic security of enterprise and requir-
ing urgent solutions, we identified following
problems:
• Difficulty in determining components of the
economic security;
• Lack of clarity in the choice of the compo-
nents of economic security of the enterprise;
• Lack of generally accepted valuation meth-
ods of the given components of economic secu-
rity.
Thus, the main task is formulated as a com-
prehensive approach to economic security on the
basis of risk-based method, the implementation
of which is difficult due to insufficient scientific
base.
All mentioned above determined the rele-
vance of this work.
The economic sphere has been considered as
one of the most important areas in the study of
threats to national security [1, p. 36]. The study
of the economic security of all business entities
and other activities has gradually grown in im-
portance over the years to a point where it’s now
considered a necessity for the favourable devel-
opment of the state.
Economic security as a category of study
rather recently appeared in the conceptual appa-
ratus of economics as a social science but then
again, it is not a new topic. Authors agree with
the colleagues, who offered a table of periodiza-
tion in economic security (Table 1).

Modern Economy Success 2016, №1
60
Table 1
Main stages of development of the concept of "security"
Period Main features of development
12th
century
One of the first documented definitions of security as "calm state of mind, a sense of
security." Found in the dictionary of English philosopher Robert Grosseteste. Later
the term began to be used at the state level
18th
century
Security has established itself as one of the goals of the state and became interpreted
as "a state of absence of real threats, as well as the means and conditions to achieve
this state"
1881. In the Russian Empire issued "Regulations on measures to guard public order and
public peace",where security of people is a focus for fight against crime
1917. The politicization of the "Security" by Bolsheviks and the use of the term in the
struggle against counter-revolution
1934. Upholding national security in the USSR
1990 Adoption March 5, 1992 the Russian Federation law "On safety" №2446-1 (not the
current version)
Origin [19]
We have dealt with economic security in
various forms even during the periods of Adam
Smith. We sought to find the causes of a poor or
rich family and country. Of course a rich country
and fairly prosperous family is as a result of high
economic security. A rich country is made rich
by rich companies with high economic security.
With respect to its enterprise, economic security
is considered as an integral assessment of the
resource potential of the enterprise and the level
of vulnerability of negative actions on the envi-
ronment. It reflects the elements of the diagnosis
of the current state and as well as the future out-
look of risks and threats.
The assessment of economic security is the
starting point for strategic planning, an indicator
of investment attractiveness and reliability on the
enterprise, characteristic of its viability. Before
the economic security assessment, a number of
assessment provisions overlap with certain ac-
tivities of the enterprise. These economic secu-
rity assessments concern the situation affecting
the area of strategic enterprise management, and
if the company has developed and adopted to
implement the relevant functional strategy (in-
novation, resource, investment, marketing), their
goals must correspond with the formulation of
the strategic interests of the enterprise in the
given functional area activities and indicators
describing the objectives of the strategy and
should comply with the quantification of the
strategic interests of the company.
Assessment of economic security may serve
as a company rating for enterprises, calculated

Modern Economy Success 2016, №1
61
on the aggregate of individual criteria. It is de-
fined as either a static figure, the state of affairs
at the company, or as a dynamic – taking into
account the predicted changes in individual crite-
ria in the future. Company ratings characterize
its competitiveness in relation to other enter-
prises of the branch, and the strength of its com-
petitive position is just the best measure of safety
in the marketplace.
The economic literature has attempted to
quantify the economic security of the enterprise
with the help of the so-called indicators. The
problem is that currently there is no methodo-
logical basis for determining indicators.
A system of economic security in general
terms comprises of a combination of elements,
objects, subjects and subsystems of economic
security [22, p. 114.] All these components join
together to form technical processes through
which the system works to provide solutions to
an enterprise. Taking a look at these components
separately, we can identify the following:
Elements of the system of economic se-
curity include 1) protection of trade secrets and
confidential information, 2) computer security,
3) internal security, 4) physical security, 5) tech-
nical security, 6) communication, 7) security of
buildings and structures, 8) security of cargo and
individuals, 9) security of promotional, cultural
events, business meetings and negotiations, 10)
fire prevention security, 11) ecological security,
12) radiation and chemical security;
Objects of the system of economic secu-
rity include 1) the different types of activities
(production, commercial, supply, management,
etc.), 2) The property and enterprise resources
(financial, logistical, information, intellectual,
etc.), 3) the company's personnel, its officers,
shareholders, various structural divisions, ser-
vices, partners, employees, possessing informa-
tion that constitutes a trade secret, etc.;
Subjects of the system of economic secu-
rity include those individuals, units, services,
agencies, departments, institutions that are di-
rectly involved in the business security. Since the
security activities of the company has many as-
pects, this problem can not be solved by one or
two bodies. As a general rule, the subjects of the
economic security of the enterprise include many
organs, which can be classified according to
various criteria;
Subsystem of economic security of an en-
terprise include
Economic security – the state of the most
efficient use of all resources in order to prevent
(neutralization, elimination) of threats and ensure
stable functioning of the enterprise in a market
economy.
Technogenic security – a set of actions to
ensure that the design, construction and opera-
tion of complex technical devices in compliance
with the essential requirements of accident-free
work them.
Environmental security – protection of
the vital interests of the state, enterprise, person-
nel and their assets against potential or real
threats posed by the effects of human impact on

Modern Economy Success 2016, №1
62
the environment, as well as natural disasters and
catastrophes.
Information security – is the ability of
plant personnel to ensure the protection of in-
formation resources and streams threat of unau-
thorized access to them.
Psychological security – the state of pro-
tection from the negative psychological impact
of the personnel and other persons involved in its
activities.
Physical security - the state of protection
of life and health of individuals (groups of indi-
viduals) of the enterprise of violent crimes.
Scientific and technical security – the
ability of plant personnel to protect their own
valuable scientific and technical products from
unfair competition.
Fire prevention security – state of the ob-
jects of the enterprise, in which the fire preven-
tion measures and fire protection compliance.
Causes of threats to economic security
Causes of threats to the economic security of
a company is solely not based on its past devel-
opment but also on the errors made during the
current development. Company changes can lead
to loss of economic control caused by econo-
mies/diseconomies of scale. The following at-
tributes are possible causes of threats to the
economy security of a company;
1. Lack of concepts, strategies and programs
of social and economic development with
achievable goals;
2. A permanent gap in the development, un-
systematic and inadequate regulatory framework
of economic regulation;
3. Fetishisation of financial technology in
the transformation of the economy, which has
involved their separation from its real sector, the
replacement of real money or barter with their
surrogates;
4. The destruction of the productive capac-
ity of the reproduction system (in the first place,
its active part) due to the low investment activ-
ity;
5. Inflation and the lack of a normal invest-
ment climate in the real economy, preference
lying on current expenditure at the expense of
capital; inefficient ways of making a company
public;
6. The creation of conditions conducive to
the assignment and the export of financial re-
sources abroad;
7. The loss of market control to monopolies,
the weakening of the regulatory role of the state
in their pricing policy;
8. Dishonest actions of many economic sub-
jects on the market, their low legal discipline,
lack or total absence of economic ethics at all
levels of management;
9. Weak embeddedness in the economy;
10. Discrimination (in the case of economic
war between countries) on the part of some
countries of the international community in trade
with the country the company is based at, and in
its efforts to the world markets.

Modern Economy Success 2016, №1
63
Features and indicators of economic secu-
rity
From the accurate identification of threats, the
correct choice of measuring their development
depends on the adequacy of the company's eco-
nomic security assessment existing in the pro-
duction and a set of necessary measures to pre-
vent and parry the danger, appropriate to the
scale and nature of the threats.
As one of the aims of monitoring the eco-
nomic security of an enterprise is the purpose of
monitoring is to diagnose the condition of its
system of indicators, taking into account specific
industrial features, most characteristic of the en-
terprise.
If a similar technique to construct a system of
quantitative and qualitative indicators of eco-
nomic security at a company level is used, the
addition of the following indicators is necessary;
a) production indicators:
dynamics of production (growth, decline,
the rate of change, stable state);
the actual level of capacity utilization;
Research and development share in the
total amount of work;
The share of research work in the total
volume of research and development work;
The rate of renewing fixed assets;
Stability of the production process
(rhythmicity, congestion levels within a specified
time);
The share of production in GDP (for very
large monopoly enterprises);
Assessment of the competitiveness of
products;
Age structure, technical resources for
parking lots and equipment;
b) financial indicators:
The volume of "portfolio" orders (total
estimated sales);
Actual and necessary volume of invest-
ments (to maintain and develop the existing po-
tential);
Level of innovative activity (investment
in innovation);
Level of profitability;
Return on assets (capital intensity) of
production;
Arrears (receivables and payables);
c) Social indicators:
1. wage levels relative to the average for the
industry or the economy as a whole;
2. The level of debt on wages;
3. Loss of working time;
4. Personnel capacity structure (age, qualifi-
cation).
As a result, I can say that the most important
condition for maintaining the economic security
of an economic entity is the timely detection of
threats related to sustainable development and
conservation of the major positions on the mar-
ket.
This requires monitoring.Monitoring in the
most general concept is a continuous supervision
over objects, control and the analysis of their ac-
tivity carried out by someone. Along with it, a

Modern Economy Success 2016, №1
64
number of authors defines monitoring as set of
the information subsystems united by the general
criterion function and forming optimum informa-
tion security of administrative activity. Anyway,
the total purpose of monitoring is ensuring the
highest management of the organization with the
adequate information necessary for adoption of
rational organizational and administrative deci-
sions.
Thus, strengthening of influence of the factors
menacing to economic security of the organiza-
tion in modern conditions, raises a question of
creation of system of monitoring of a state and
dynamics of development of the organization for
the purpose of the preliminary prevention of
imminent danger and acceptance of necessary
measures of protection and counteraction.
The system of monitoring of economic securi-
ty of the organization allows not only to receive
information and to make estimates of tendencies
of development of its economic state, to carry
out the analysis of a financial position. Using
results of the monitoring, the highest manage-
ment of the organization can monitor the most
important trends of reproduction process, quickly
estimate and control influence of the major me-
nacing factors defining possible negative change
of these processes. Thereby the system of moni-
toring of economic security of the organization
forms a necessary basis for early detection by the
management arising in activity of the organiza-
tion of disproportions that allows to increase ef-
ficiency of reproduction activity.
The principles of the functioning of eco-
nomic security and their main improvement.
The economic security of a company is a state
of the most efficient use of corporate resources
to prevent threats and ensure stable operation of
the business now and in the future. The essence
of the development and functioning of a security
system is based on a set of principles. Ensuring
economic security should be based on the fol-
lowing principles:
Complexity: the protection of material, per-
sonnel and financial resources from potential
threats by all available methods, means and ac-
tivities; providing security for information re-
sources throughout their life cycle, at all techno-
logical stages and in all modes of operation.
Timeliness: setting tasks of integrated safety
in the early stages of the development of the se-
curity system based on the analysis and predic-
tion of threat situations on the legitimate inter-
ests of enterprises and organizations, including
the production and commercial structures.
Continuity: protection is necessary because
the "enemy" (competitors) constantly seek to cir-
cumvent protective measures, resorting to legal
and illegal methods.
Activity: Protecting the interests of a com-
pany is often dealt with a bit of perseverance. In
other words, this implies the maneuver forces
and means to ensure the safety and protection of
non-standard measures.
Legality: involves the development of secu-
rity systems on the basis of federal legislation in
the field of business, data protection and infor-
matisation, private security services, as well as

Modern Economy Success 2016, №1
65
other normative acts on safety approved by the
government in the limits of their competence,
with all permitted methods of detection and sup-
pression of offenses.
Feasibility and comparability of the possible
damage and costs of providing security.
Scientific knowledge and justification are im-
portant for measures and means of protection
consistent with the current level of development
of science and technology, to be justified in
terms of the existing requirements and standards.
Specialization – this involves the develop-
ment and implementation of measures and means
of protecting specialized organizations best pre-
pared to a specific activity, specialists with prac-
tical experience and a state license for the right
to provide services in a particular area.
Interaction and coordination – the basis of
precise work of all concerned departments and
services, third-party specialized organizations to
coordinate their efforts with the activities of
government bodies and law enforcement agen-
cies.
Improvement measures and remedies is the
emergence of new technical means, taking into
account changes in the methods and means of
intelligence and industrial espionage, new regu-
latory and technical requirements, the use made
of domestic and foreign experience.
Centralizing management: it assumes the in-
dependent functioning of security systems for
single functional, organizational and methodo-
logical principles and centralized management
system activities.
Protection against potential threats and unlaw-
ful attacks can primarily be based on the follow-
ing groups of objects;
The staff of public institutions, industrial and
commercial structures, including those charged
with administrative and managerial functions
with immediate access to equipment, material
assets, currency, finance, warehousing, informa-
tion constituting a trade secret;
The funds, securities, jewellery, currency,
strict reporting forms, and so on;
Tangible assets (buildings, storage, structures,
electronic and technical equipment, means of
transport, etc.);
Information resources with restricted access,
state or commercial (bank) secrets and other con-
fidential information;
Tools and informatisation systems (a line of
telephone, fax, radio and space communication,
automated systems and computer networks of
various levels and purposes, technical means of
transmitting information, means of reproduction
and display of information, assistive technology
and systems).
Technical means (systems) of protecting ma-
terial and information resources directly with
security systems;
All items related to implementing threats
against safety, consisting of different potential
vulnerabilities to possible material or moral
damage.
In the process of identifying, analysing and
forecasting potential threats, objective and exist-
ing external and internal conditions must be con-

Modern Economy Success 2016, №1
66
sidered that affect the risk of threats: failure to
comply with legislation, the absence of a number
of laws on vital issues, as well as reducing the
moral, psychological and manufacturing respon-
sibility of citizens; the unstable political, socio-
economic and criminogenic situation.
In addition, potential risks can be identified in
the study of practical issues of financial, adver-
tising, marketing, and other activities.
Regarding the physical security threats to the
staff of public institutions and industrial and
commercial structures include: threats related to
the commission of terrorist acts against them,
kidnapping and threats of kidnapping employees,
their family members and relatives; murder, ac-
companied by violence, abuse and torture, rob-
bery in order to obtain cash, valuables, docu-
ments and others.
Criminal attacks against industrial and com-
mercial structures are manifested in the form of
committing sabotage and terrorist attacks on pro-
tected objects, destruction of protection systems,
damage to buildings, machinery, transport, viola-
tion of fire-prevention regulations, the destruc-
tion of material assets, natural (natural) phenom-
ena and man-made disasters, etc.
The purpose of such actions – outspoken ter-
ror, causing serious moral and material damage,
disruption of normal activities for a long time,
soliciting substantial sums of money or any
benefits (deferred payments, loans, etc.).
Threats of financial and material resources
can be manifested in the form of theft and de-
struction of the most valuable assets, technology,
prototypes of products, non-repayment of credit
loans; fictitious payment documents (balances,
payment orders, bills of exchange, securities,
etc.); account and deposit fraud; robbing banks,
and so on.
Threats to information security can be imple-
mented in violating the relevant physical protec-
tion of resources through technical means of
processing information.
In the case of violating the physical protection
of information resources, examples are; theft of
documents and media, encrypted and access
keys, a tacit familiarisation with protected in-
formation, a leak of classified information by the
staff of the production and commercial structure.
With the help of technical means of information
processing, it is possible to remove protected in-
formation from technical communication chan-
nels, intercept stray electromagnetic radiation
and introduce special programs in computer
technology and so on.
As general conclusion of this article, it should
be noted that the essence of economic security
can be defined as a condition of sustainable de-
velopment, with guaranteed protection of na-
tional interests, the social orientation of the pol-
icy, an adequate defence capability under unfa-
vourable conditions of internal and external
processes. In other words, economic security – is
not only the protection of national interests, but
also the willingness and ability of economic in-
stitutions to create mechanisms for the imple-
mentation and protection of national interests
and national economic development, maintaining

Modern Economy Success 2016, №1
67
social and political stability of society. The es-
sence of economic security is implemented in the
system of criteria and indicators. The criterion of
economic security is assessment of the state of
economy in terms of most important processes
that reflect the essence of economic security:
-resource potential and its development op-
portunities;
-level of resource efficiency, capital and la-
bor, and its compliance with the level in devel-
oped countries, as well as the level of internal
and external threats, which is reduced to a mini-
mum;
-competitiveness of the economy;
-territorial integrity and economic space;
-sovereignty, independence and ability to con-
front external threats;
-social stability and the conditions for pre-
venting and resolving social conflicts.
The system of economic security indicators
includes:
-the level and quality of life;
-inflation;
-the rate of unemployment;
-the economic growth;
-budget deficit;
-state debt;
-embeddedness in the global economy;
-the state of gold and foreign currency re-
serves;
-the activities of the underground economy.
It is important to emphasize that the highest
degree of safety is achieved under the condition
that the full range of indicators is within the
permissible limits and qualityof one factor is
achieved without detriment to the other. Com-
parison of internal and external threats has
shown that the greatest danger to Russia are its
internal threats. Among internal threats the
greatest risk grows in social and scientific-
technical spheres. In the best position is the re-
source potential. Russia inherited from the for-
mer Soviet Union a powerful resource potential,
21% of world reserves of resources. Competent
exploitation of natural resources ensures devel-
opment of a whole range of material production,
which have sufficient stability and allow to con-
sider Russia a great power.
References
1. Avdiysky V.I., V.A. Dadalko Shadow economy and economic security of the state. Moscow:Alfa-
M: INFRA-M, 2012. 36 p.
2. Avdiysky V.I. The role of the economic safety standards system to ensure the economic security of
business entities // In: Economic Security in Russia: problems and prospects of the materials of the II In-
ternational Scientific and Practical Conference. 2014. P. 294.
3. Alexandrov A.V., Sokolova Y.V., Veligura A.V. Evaluation of information security state of enter-
prise // Modern Science Successes. 2016. T. 1. N6. P. 31 – 35.
Modern Economy Success 2016, №1
68
4. Bendikov M.A. Economic security of industrial enterprise in the conditions of crisis – management
in Ukraine and abroad. N 2. 2000. S. 19 – 20.
5. Dadalko V.A., Peskov V.V. Ensuring economic security and social and economic systems: mono-
graph. Minsk: ITC Ministry of Finance, 2010. P. 124.
6. Communique of the 5th Plenary Session of 16 Central Committee of the CCP, Xinhuanet.com, Oct.
11, 2005. http://news.xinhuanet.com/politics/2005-10/11/content_3606215.h 8
7. Cyber Security Information Act. Washington, April 2001. 11 ð.
8. Economic Security Act of 1996. Washington, February 1996. 5 p.
9. Job Creation & Economic Security Act of 2002. Washington, 2002. 21 p.
10. Losman Donald Economic Security A National Security Folly? // Policy Analysis. 2001. No. 409
(August). P. 3 – 15.
11. Makrinova E.I., Grigoreva V.V. Inforvanion system of monitoring of economic security of the or-
ganization.International Journal Of Applied And Fundamental Research. 2014. №1. URL: www.science-
sd.com/456-24507 (01.09.2016)
12. National Security Strategy for a New Century. The White House, December 1999. 49 p.
13. New World Coming: American Security in the 218t Century. Seeking a National Strategy: A Con-
cert for Preserving Security and Promotion Freedom. The Phase II / The United States Commission on
National Security, 2000. 16 p.
14. New World Coming: American Security in the 21Bt Century. Road Map for National Security:
Imperative for Change. The phase III. The United States Commission on National Security, 2001. 139 p.
15. New World Coming: American Security in the 21st Century. Major Themes and Implication. The
phase I. The United States Commission on National Security, 1999. 8 p.
16. Pale OI Tools regulation of monetary policy in the context of financial security // Successes of
modern science. Belgorod: 2016. T. 3. №7. P. 36 – 37.
17. Prasolov VI, Solodovnikova KI Ensuring economic security of small business organizations //
Modern Science Successes. 2016. T. 1. №5. P. 118 – 121.
18. Romania's strategy of national security: Democratic stability, dural economic development and Eu-
ro-Atlantic integration. Bucharest, 1999. 9 p.
19. Romanova I.B., Ermishina O.F., Sosunova L.S. Stepnov M.S., a student, the question about the
main stages of economic security: a historical and contemporary aspect // Modern Science Success. 2016.
T. 1. №5. P. 96 – 98.
20. Romanova I.B., Ermishina O.F., Zelenovskiy E.A., Shchegolev D.V. The economic security of ac-
counting and control information of the university // Modern Science Success. 2016. №5. V.1. P. 64 – 67.

Modern Economy Success 2016, №1
69
21. Saenko N.R., Saenko A.V. Spiritual security as a component of national security of Russia // Mod-
ern Science Success. 2016. №1. P. 94 – 98.
22. Uniform national standards for ensuring economic security of business entities of the Russian Fed-
eration.Col. ed. Under the General editorship of V.I. Avdiysky, V.M. Bezdenezhnykh, V.K. Senchagov, //
Monograph. SPb.: Educational center "EA", 2014. 160 P.

Modern Economy Success 2016, №1
70
International Research Journal “Modern Economy Success” / ISSN 2500-3747 Volume 9, Number 1 (2016), pp.70-78
© Modern Science Success / http://www.modernsciencejournal.org/
Shatalov M.A.
Candidate of Economic Sciences (Ph.D.), Associate Professor, Voronezh Institute of Economics and
Law, Voronezh, Russia.
Ahmedov A.E.
Candidate of Economic Sciences (Ph.D.), Associate Professor, Voronezh Institute of Economics and
Law, Voronezh, Russia.
Smolyaninova I.V.
Candidate of Economic Sciences (Ph.D.), Associate Professor, Voronezh Institute of Economics and
Law, Voronezh, Russia.
Mychka S.Yu.
Researcher, Donetsk Institute of Market and Social Policy, Donetsk, the Ukraine.
THE FORMATION OF ADAPTIVE STRATEGIES OF DEVELOPMENT OF THE
ENTERPRISES OF AGRO-INDUSTRIAL COMPLEX IN THE CONDITIONS OF
REALIZATION OF IMPORT SUBSTITUTION
Abstract: analysis of trends in development of agribusiness led to the conclusion that as a result of in-
fringement of the interests of agricultural producers, price increases in the disparity of agricultural and
industrial products, the collapse of a single technological process has been a sharp decline in the produc-
tion of agro-industrial complex of the final product. The immediate result of the above developments was
started in recent years, reduction in the percentage of capacity utilization food industries. In the conditions
of Russia's accession to the WTO and the growth of competition in this regard on the market of raw mate-
rials and finished products of high relevance, the search for the problem of effective strategies for the de-
velopment of the food industry.
In this regard, based on the analysis of the theory and practice of strategic management offered us a
systematic approach to the development of customized models of development, which involves an analy-
sis of existing and forecast future needs of representatives of the environment and target markets parame-
ters. At the same time the strategy itself determines the vector (direction) of the socio-economic system,
but the strategy can only be described as a non-linear path, because the system targets mobile and chan-
geable. Hence the assertion that the implementation of the strategy involves making revisions when mov-
ing in the selected direction of the system.

Modern Economy Success 2016, №1
71
We carried out an assessment of alternative models of development of the food industry enterprises
has shown that the most appropriate is the social-market model, which provides, in particular, the ratio of
effective state regulation and self-regulatory function of the market.
Thus, it should be noted that despite the variety of alternative strategies for the development of the
food industry, the most optimal in terms of import substitution policy is integration strategy, which in-
volves pooling disparate market participants on the principles of economic integration, which results in a
synergistic interaction effects by eliminating wasteful intermediation.
Keywords: agro-industrial complex, import substitution, food security, adaptive strategies of the de-
velopment, integration strategy, synergistic effect
1. Introduction
Food purchase restrictions imposed by the
Russian Government in a number of Western
countries once again exacerbate the problem of
national food security.
At the same time these phenomena give Russia
a historic chance to integrate into a new long
wave of technological cycle, incipient in the vast
global economy. In this regard, the Concept of
Long-Term Socio-Economic Development of the
Russian Federation tasked to meet the needs of
the population in agricultural products and foods-
tuffs from national production, improving the
competitiveness and efficient import substitution
in the agricultural market.
Import substitution in agriculture and food in-
dustry in Russia is becoming the most popular
topic on the background of the food embargo im-
posed by the Russian Federation Presidential De-
cree of August 6, 2014 № 560 "On the applica-
tion of certain special economic measures in or-
der to ensure the security of the Russian Federa-
tion."
Therefore, the instability of the global food
market there is an objective need for the moder-
nization of strategic management practices of in-
terbranch interactions in the agro-food complex,
which is based on the growth of scientific know-
ledge to bring management into line with the new
requirements. At the same time a key factor in the
success of agricultural production in the current
economic conditions, in our opinion, is the devel-
opment of organizational and economic frame-
work and appropriate tools of management of de-
velopment of agricultural enterprises.
In this regard, a special role in the progressive
development of the agri-food sector of the econ-
omy the state should play. On the basis of the
priorities of state regulation of agricultural pro-
duction are: to provide a favorable legal, organi-
zational and economic conditions for the forma-
tion and functioning of the food market; support
of investment and innovation component produc-
tion; ensuring a balance between economic and
social aspects of agricultural enterprises; ensuring
the effective output of domestic enterprises to in-
ternational markets.
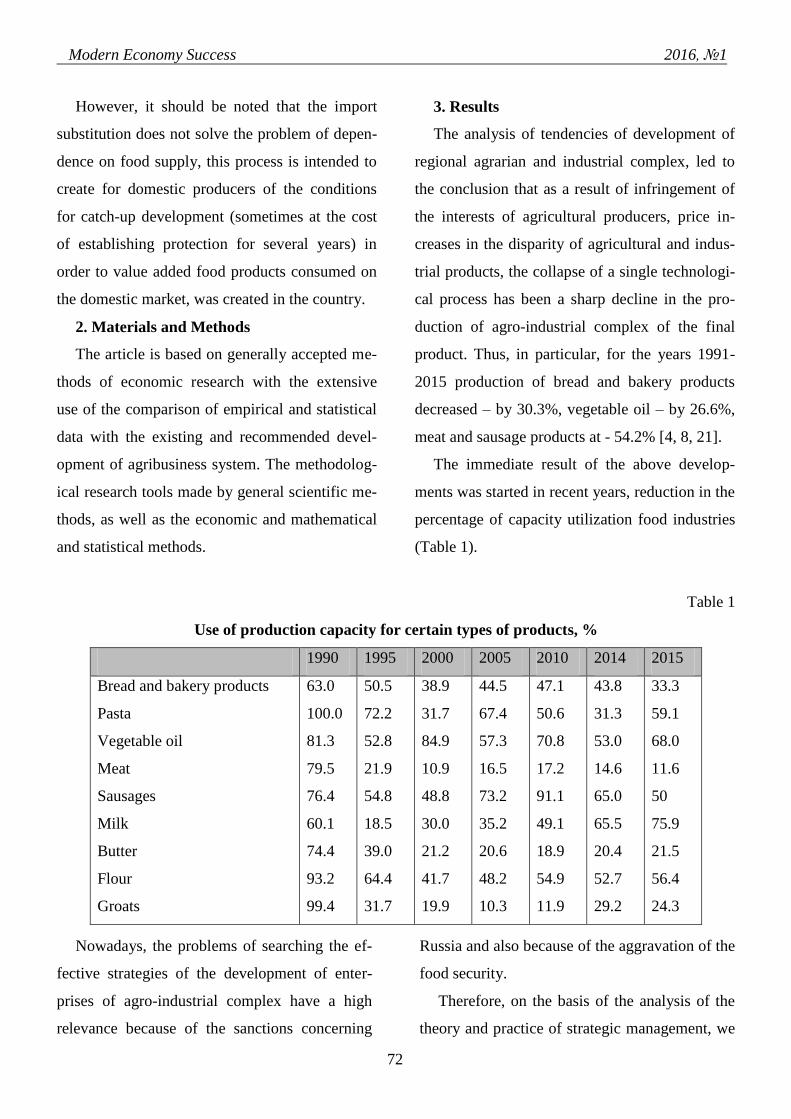
Modern Economy Success 2016, №1
72
However, it should be noted that the import
substitution does not solve the problem of depen-
dence on food supply, this process is intended to
create for domestic producers of the conditions
for catch-up development (sometimes at the cost
of establishing protection for several years) in
order to value added food products consumed on
the domestic market, was created in the country.
2. Materials and Methods
The article is based on generally accepted me-
thods of economic research with the extensive
use of the comparison of empirical and statistical
data with the existing and recommended devel-
opment of agribusiness system. The methodolog-
ical research tools made by general scientific me-
thods, as well as the economic and mathematical
and statistical methods.
3. Results
The analysis of tendencies of development of
regional agrarian and industrial complex, led to
the conclusion that as a result of infringement of
the interests of agricultural producers, price in-
creases in the disparity of agricultural and indus-
trial products, the collapse of a single technologi-
cal process has been a sharp decline in the pro-
duction of agro-industrial complex of the final
product. Thus, in particular, for the years 1991-
2015 production of bread and bakery products
decreased – by 30.3%, vegetable oil – by 26.6%,
meat and sausage products at - 54.2% [4, 8, 21].
The immediate result of the above develop-
ments was started in recent years, reduction in the
percentage of capacity utilization food industries
(Table 1).
Table 1
Use of production capacity for certain types of products, %
1990 1995 2000 2005 2010 2014 2015
Bread and bakery products
Pasta
Vegetable oil
Meat
Sausages
Milk
Butter
Flour
Groats
63.0
100.0
81.3
79.5
76.4
60.1
74.4
93.2
99.4
50.5
72.2
52.8
21.9
54.8
18.5
39.0
64.4
31.7
38.9
31.7
84.9
10.9
48.8
30.0
21.2
41.7
19.9
44.5
67.4
57.3
16.5
73.2
35.2
20.6
48.2
10.3
47.1
50.6
70.8
17.2
91.1
49.1
18.9
54.9
11.9
43.8
31.3
53.0
14.6
65.0
65.5
20.4
52.7
29.2
33.3
59.1
68.0
11.6
50
75.9
21.5
56.4
24.3
Nowadays, the problems of searching the ef-
fective strategies of the development of enter-
prises of agro-industrial complex have a high
relevance because of the sanctions concerning
Russia and also because of the aggravation of the
food security.
Therefore, on the basis of the analysis of the
theory and practice of strategic management, we

Modern Economy Success 2016, №1
73
offer the system approach to the formation
adapted models of the development, which as-
sumes [1, 5, 10, 15, 23]:
- The analysis and forecasting of needs
of representatives of external environment and
determination of target parameters of the mar-
kets.
- The formation of vision of the optimum
development, which satisfies the requirements of
the main interested groups.
- The elaboration of the development’s
mission and target indicators.
- The elaboration of the strategies of de-
velopment of the branch enterprises, proceeding
from aims and specialized integration strategies
which are intended to promote the optimum pa-
rameters.
- The formation of the scenarios of reali-
zation of the alternative strategies and the basic
portfolio of the procedures for their realization.
- The determination of the efficiency cri-
teria of the strategies of the development.
- The monitoring and the correction of
chosen strategies.
Besides, this strategy can be presented from
the point of view of the general approaches (sys-
tem of rules) to realization of long-term goals.
According to authors the most reasonable con-
cept of strategy is the representation of a strategy
as a model, which is directed on the realization
of long-term goals of the organization.
As a result, the strategy defines a vector (di-
rection) of the development of a socio-economic
system. However, the strategy can be described
just by a nonlinear trajectory, as the purposes of
the system are mobile and changeable. Hence, it
follows that the realization of the strategy sup-
poses the refinement at the movement of the sys-
tem in the chosen direction.
On the basis of this approach we define the
following alternative strategies of the develop-
ment of the enterprises of the agro-industrial
complex [2, 7, 12, 20]:
- Liberal. This strategy provides the free
market, minimization of the state price control
and budgetary support of agro-industrial com-
plex;
- Administrative. This strategy provides
a wide range of the state influence, starting from
a stimulation to the rigid restrictive influences;
- Mixed. This strategy supposes the pro-
tective measures of local producers. However,
it’s possible a bankruptcy of the agricultural en-
terprises and cutback in production of raw mate-
rials;
- Market. This strategy supposes a stimu-
lation of investments into the renewal of plant
and a broad development of integration
processes.
So, the assessment of the alternative models
of development of the enterprises of the food in-
dustry has showed that the most optimum strate-
gy is the social market model, which provides an
effective ratio of state regulation and the self-
regulating function of the market.
However, it should be noted that within this
approach the strategies of development have dual
nature of connections:

Modern Economy Success 2016, №1
74
- first, as the instrument of realization of
strategy of complex development of economic
formations of the food industry (strategy at the
macrolevel) [3, 6, 11];
- second, as an implementer of the "pri-
vate interests" directed on achievement of sepa-
rate corporate business interests (strategy at the
microlevel) [9, 14, 16, 22].
Further we offer alternative options of realiza-
tion of business behavior on each introduced de-
velopment’s strategy [13, 17, 20]:
- strategy of organic growth, which as-
sumes reinvestment of the gotten profit and bor-
rowed funds in the existing and new business
projects, therefore there is an increase of produc-
tion capacity and an exit to new outlets of pro-
duction;
- focus strategy, which assumes focusing
of attention on separate narrow segments of the
market and increase in a market share on these
segments due to improvement of quality of
products;
- diversification strategy which assumes
an increase of a share of the market due to ex-
pansion of the range of products and penetration
on the new segments of the market;
- integration strategy, which assumes un-
ification of separate participants of the market on
the basis of economic integration. As a result, the
synergetic effects of interaction due to elimina-
tion of irrational mediation are reached.
In that way, on the basis of alternative models
of development it is possible to offer the follow-
ing flow block of strategies in their interconnec-
tion (figure 1).
Further, the methodical tools and a portfolio
of procedures are determined by each alternative
strategy for its realization. Besides, the further
specification of strategies is possible. It is appro-
priate to divide integration strategy of develop-
ment of the agro-industrial complex’s enterprises
into cluster strategy and vertical. It will allow to
define a role of integration strategy in the devel-
opment of regional agro-industrial production
and to emphasize the optimum directions of im-
pact. Furthermore, it will create a possibility of
formation of the adaptive mechanism of integra-
tion development of concrete economic forma-
tions at the microlevel and will provide an as-
sessment of social and economic efficiency of its
implementation.
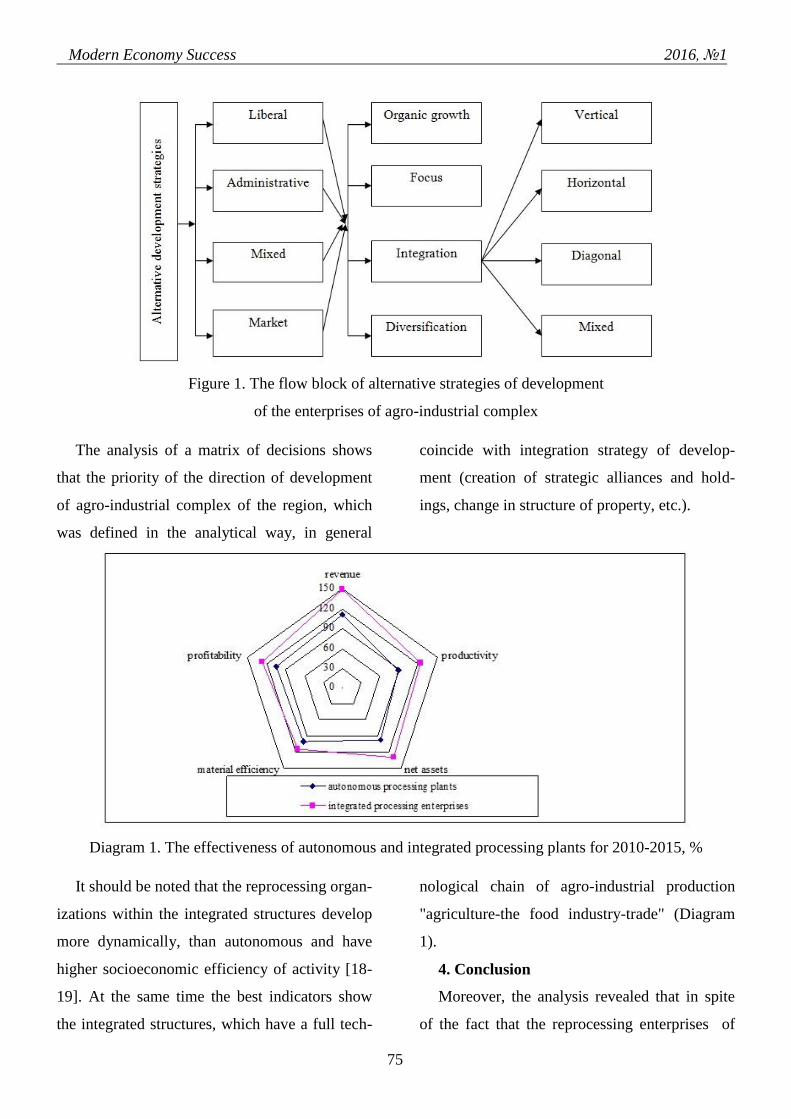
Modern Economy Success 2016, №1
75
Figure 1. The flow block of alternative strategies of development
of the enterprises of agro-industrial complex
The analysis of a matrix of decisions shows
that the priority of the direction of development
of agro-industrial complex of the region, which
was defined in the analytical way, in general
coincide with integration strategy of develop-
ment (creation of strategic alliances and hold-
ings, change in structure of property, etc.).
Diagram 1. The effectiveness of autonomous and integrated processing plants for 2010-2015, %
It should be noted that the reprocessing organ-
izations within the integrated structures develop
more dynamically, than autonomous and have
higher socioeconomic efficiency of activity [18-
19]. At the same time the best indicators show
the integrated structures, which have a full tech-
nological chain of agro-industrial production
"agriculture-the food industry-trade" (Diagram
1).
4. Conclusion
Moreover, the analysis revealed that in spite
of the fact that the reprocessing enterprises of

Modern Economy Success 2016, №1
76
agro-industrial complex as a part of the inte-
grated structures develop more balanced and dy-
namic, all synergetic potential that put in integra-
tion development remains not fully realized. In
our opinion, it is a direct consequence of lack of
the adaptive economic-organizing mechanism of
creation and functioning of such structures, and
also systems of monitoring and forecasting of
efficiency of socio-economic activity and elabo-
ration of the timely correcting procedures.
The complex assessment of efficiency index
of the integrated structures of area which dis-
played that better results are reached in the en-
terprises where production and administrative
structures are balanced.
However, it should be noted that the adduced
data reflect a situation on branch in general. At
the same time within the branch the extremely
dissimilar enterprises coexist. Each enterprise
has the specifics. It depends on the segment of
industry, to which belongs the concrete enter-
prise. Herein, the system of integration develop-
ment of the enterprises of agro-industrial com-
plex of the region has to be adaptive to the fea-
tures of each concrete industrial enterprise.
Thus, it should be noted that at all variety of
alternative strategies of development of agro-
industrial complex’s enterprises, the most opti-
mum in the conditions of the Voronezh region
represent integration strategies which assume
unification of separate participants of the market.
As a result, on the principles of economic inte-
gration synergetic effects of interaction due to
elimination of irrational mediation are reached.
Consequently, the analysis of a current state
of branches of agro-industrial complex of the
region revealed that in the conditions of need of
realization of policy of import substitution for-
mation of the integrated structures adapted for
the market with the closed production cycle will
lead to increase of socio-economic efficiency
both the separate enterprises, and associations in
general that will allow to overcome finally nega-
tive tendencies of disparity of the prices of an
agricultural and industrial output.
References
1. Aghabekian R.L. State support of small and medium-sized businesses as a condition of sustainable
development of economy // Successes of Modern Science and Education. 2015. №3. P. 28 – 32.
2. Afinogenova I.N., Ovsyannikov S.V. The role of the investment strategies in increasing the
sustainability of economic development firms // The area of science. 2014. №4. P. 5 – 11.
3. Ahmеdov A.E., Smolyaninova I.V., Shatalov M.A. Adaptive direction of sustainable development
of the enterprises of a building complex // Synergy. 2015. №1. P. 55 – 59.
4. Bautin V.M., Shatalov M.A. Investment potential of the agro-industrial complex of the Voronezh
Region // The area of science. 2014. №4. P. 18 – 23.

Modern Economy Success 2016, №1
77
5. Carney M., Gedajlovic E.R., Heugens P.P.M.A.R., Van Oosterhout J., Van Essen M. Business
group affiliation, performance, context, and strategy: a meta-analysis // Academy of Management Journal.
2011. Т. 54. №3. P. 437 – 460.
6. Cooper R.G., Edgett S.J. Developing a product innovation and technology strategy for your business
// Research Technology Management. 2010. Т. 53. №3. P. 33 – 40.
7. Cui Q., Hastak M., Halpin D. Systems analysis of project cash flow management strategies // Con-
struction Management & Economics. 2010. Т. 28. №4.P. 361 – 376.
8. Davydova E.Yu. Problems of management of innovation and investment activities of transnational
corporations // Synergy. 2016. №2. P. 56 – 62.
9. Das A., Maiti J., Banerjee R.N. Process monitoring and fault detection strategies: a review // Inter-
national Journal of Quality & Reliability Management. 2012. Т. 29. №7. P. 720 – 752.
10. Esturilho C.G., Estorilio C. The deployment of manufacturing flexibility as a function of company
strategy // Journal of Manufacturing Technology Management. 2010. Т. 21. №8. P. 971 – 989.
11. Gashi B., Date P. Two methods for optimal investment with trading strategies of finite variation //
IMA Journal Management Mathematics. 2012. Т. 23. №2. P. 171 – 193.
12. Godina O.V. Formation of a portfolio of strategic alternatives of development of innovation-
oriented enterprises // Modern Science Successes. 2015. №5. P. 41 – 48.
13. Hilletofth P., Claesson F., Hilmola O.-P. In-transit distribution strategy: solution for European fac-
tory competitiveness? // Industrial Management & Data Systems. 2011. Т. 111. №1. P. 20 – 40.
14. Kuzmenko N.I. On the selection of effective personnel policy of the enterprise in terms of socio-
economic transformation of the society // Synergy. 2016. №3. P. 37 – 42.
15. Martirosyan M.M. The importance of the use of compromise strategies at all levels and stages of
development of an economic entity // Successes of Modern Science and Education. 2016. Т 2. №4. P. 22
– 27.
16. McCreadie R., Macdonald C., Ounis I. Mapreduce indexing strategies: studying scalability and ef-
ficiency // Information Processing & Management. 2011.
17. Meyer K.E., Estrin S., Bhaumik S.K., Peng M.W. Institutions, resources, and entry strategies in
emerging economies // Strategic Management Journal. 2009. Т. 30. №1. P. 61 – 80.
18. Mychka S.Yu., Shatalov M.A. Outstaffing system optimization of business processes of the organ-
ization // The area of science. 2015. №2. P. 121 – 124.
19. Papelo V.N., Kovtun B.A., Agapov Y.V. Russia in the WTO: Positive and negative factors for the
development of a linen subcomplex // Successes of Modern Science and Education. 2016. Т. 2. №3. P. 13
– 17.

Modern Economy Success 2016, №1
78
20. Railmond P., Halliburton Ch. Business school strategies for the single European market // Man-
agement Learning. 1995. Т. 26. №2. P. 231 – 247.
21. Shardanova G.B. Innovative agricultural development region and its regulation // Modern Science
Success. 2016. Т. 2. №3. P. 47 – 49.
22. Su M., Rao V.R. New product preannouncement as a signaling strategy: an audience-specific re-
view and analysis // Journal of Product Innovation Management. 2010. Т. 27. №5. P. 658 – 672.
23. Young M.N., Tsai T., Liu S., Wang X., Ahlstrom D. Strategy in emerging economies and the
theory of the firm // Asia Pacific Journal of Management. 2014. Т. 31. №2. P. 331 – 354.

Modern Economy Success 2016, №1
79
International Research Journal “Modern Economy Success” / ISSN 2500-3747 Volume 9, Number 1 (2016), pp.79-86
© Modern Science Success / http://www.modernsciencejournal.org/
Osipova K.V.
Postgraduate, International Great School of Management, Peter the Great St. Peterburg Polytechnic
University, St. Peterburg, Russia.
ECONOMICS OF ENERGY LOSSES AT THE HEAT SUPPLY CYCLE
Abstract: the article raises a question based on the concern about the common scientific method of
economic evaluation of energy losses at the heat supply (and energy supply in general). The author
shows, that measurement of energy losses in the equivalent fuel units does not show the full economic
costs of energy supply, because it does not take into account the consumption of other material and labor
resources, which cover the energy losses. Furthermore, the losses from different energy supply stages
usually counted in the total economy as equivalent. The article proves that they are not equal.
The author suggests a methodology of economic evaluation of the heat supply efficiency. The model is
based on the idea of unequal influence of the heat supply stages to its overall efficiency.
The author defines the heat supply cycle and its stages: fuel delivery, power generation, energy trans-
mission, energy consumption. A regularity of the progressing influence of stage energy losses to the cost-
based value of the cycle is revealed. The suggested model of energy losses is suitable to compare the dif-
ferent modes of the heat supply, including electric and cogeneration heat supply.
Keywords: the heat supply, the electric heat supply, energy losses, the energy efficiency
The present research is based on the concern
about the common scientific method of econom-
ic evaluation of energy losses at the heat supply.
This method has two features. Firstly, the energy
losses from different stages of energy cycle
(from energy production to its consumption)
quantitatively equal attributed to the losses of the
cycle as a whole. In reality, to lose (or save) 10%
energy at the production stage is economically
not the same as 10% energy at the consumption
stage. Secondly, the loss (or saving) of the cycle
stage (and cycle as a whole) are measured in
equivalent fuel weight, as if the energy losses are
replenished only by extra fuel. In fact they are
replenished by the other resources, and in the
covering of energy losses their value share is
comparable (and sometimes higher) than the fuel
share. We suggest an economy model of the heat
supply cycle, which shows in monetary terms the
heat supply cycle value and takes into account
the energy losses at different cycle stages.
The main difficulty of creating the universal
economic model of heat supply is that different
systems of measurement are used to account dif-
ferent energy sources. For example, heat (ther-
mal energy) is measured in kilocalories (kcal),
and electricity is measured in kilowatt*hours
(kw×h) [14]. The general model should combine
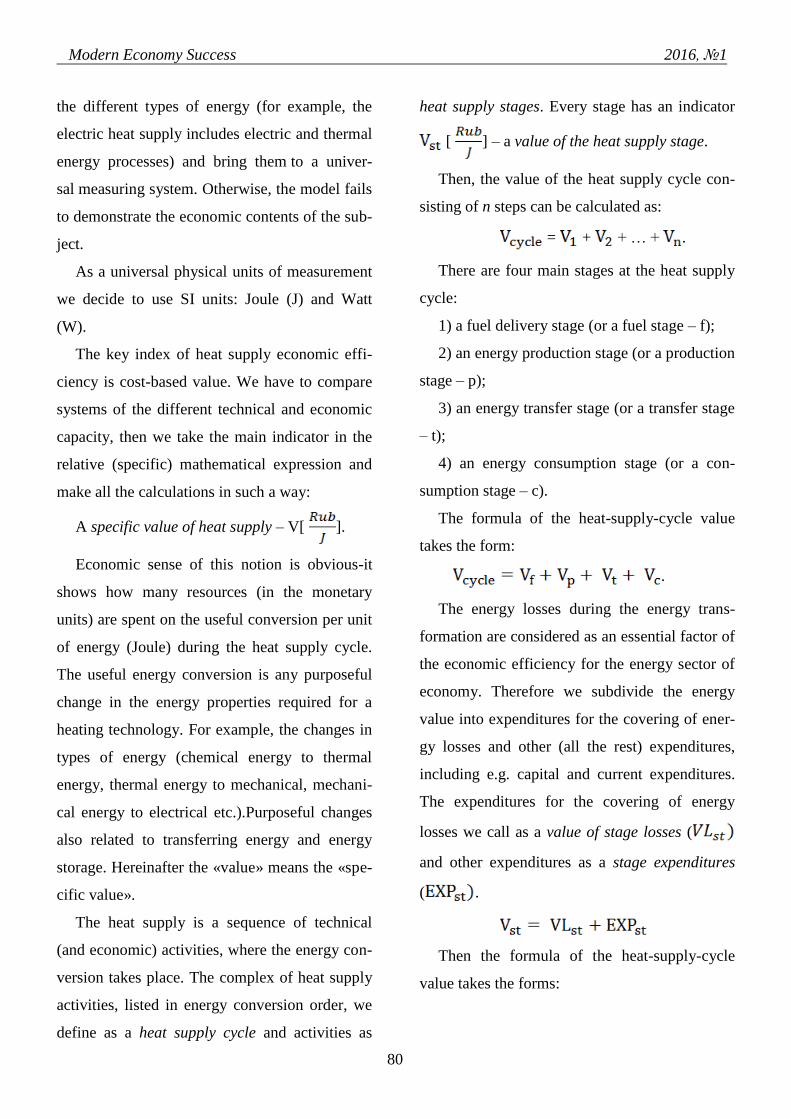
Modern Economy Success 2016, №1
80
the different types of energy (for example, the
electric heat supply includes electric and thermal
energy processes) and bring them to a univer-
sal measuring system. Otherwise, the model fails
to demonstrate the economic contents of the sub-
ject.
As a universal physical units of measurement
we decide to use SI units: Joule (J) and Watt
(W).
The key index of heat supply economic effi-
ciency is cost-based value. We have to compare
systems of the different technical and economic
capacity, then we take the main indicator in the
relative (specific) mathematical expression and
make all the calculations in such a way:
A specific value of heat supply – V[ ].
Economic sense of this notion is obvious-it
shows how many resources (in the monetary
units) are spent on the useful conversion per unit
of energy (Joule) during the heat supply cycle.
The useful energy conversion is any purposeful
change in the energy properties required for a
heating technology. For example, the changes in
types of energy (chemical energy to thermal
energy, thermal energy to mechanical, mechani-
cal energy to electrical etc.).Purposeful changes
also related to transferring energy and energy
storage. Hereinafter the «value» means the «spe-
cific value».
The heat supply is a sequence of technical
(and economic) activities, where the energy con-
version takes place. The complex of heat supply
activities, listed in energy conversion order, we
define as a heat supply cycle and activities as
heat supply stages. Every stage has an indicator
[ ] – a value of the heat supply stage.
Then, the value of the heat supply cycle con-
sisting of n steps can be calculated as:
= + + … + .
There are four main stages at the heat supply
cycle:
1) a fuel delivery stage (or a fuel stage – f);
2) an energy production stage (or a production
stage – p);
3) an energy transfer stage (or a transfer stage
– t);
4) an energy consumption stage (or a con-
sumption stage – c).
The formula of the heat-supply-cycle value
takes the form:
.
The energy losses during the energy trans-
formation are considered as an essential factor of
the economic efficiency for the energy sector of
economy. Therefore we subdivide the energy
value into expenditures for the covering of ener-
gy losses and other (all the rest) expenditures,
including e.g. capital and current expenditures.
The expenditures for the covering of energy
losses we call as a value of stage losses (
and other expenditures as a stage expenditures
( .
Then the formula of the heat-supply-cycle
value takes the forms:

Modern Economy Success 2016, №1
81
= + [ + ] + [ +
] + [ + ] or
= [ + + + ] + [
+ + ] , where
+ + + = –
cycle expenditures,
+ + = – a value of
cycle losses.
Every stage of the heat supply cycle has a
technical indicator – an energy transfer coeffi-
cient ( ). The energy transfer coefficient is the
ratio of the energy output ) to the ener-
gy input ( ). expresses the amount of
the losses during the energy conversion.
= , 0 < < 1.
By the way, we make all the calculations for
the specific expenditure (expenditure for the
conversion of 1 Joule energy). Then means
that every 1 Joule of input energy gives ×1
Joule of energy at the end of the stage, what is
less than one Joule. From the other side there is a
question: how much the extra input energy is ne-
cessary to have at the end of the stage 1 Joule
( = 1 Joule)?
The amount of the extra input energy must be
times more than input energy (1 Joule),
where > 0. is are supply-
ing stage coefficient.
is different way of presenting . The
purpose of such a presentation is to show the
economic significance of the energy losses.
What does it economically mean, that because of
internal losses for every output 1 Joule of energy
it is necessary to add ×1 Joule to input
energy? It means, that someone should pay for
this extra Joules, i.e. should pay for the extra fuel
and the extra energy conversion at all previous
stages.
For example, the transfer stage has =
0,8. To compensate losses of this stage it’s ne-
cessary to add for every 1 Joule of input energy a
quarter of a Joule ( = ). It
means, that it is necessary to buy 0,25 Joule of
fuel (fuel stage) and to pay for its conversion at
production stage. Expenses for covering the
stage losses are put on the same stage. Thus, the
value of stage losses in our example is:
= 0,25 ( .
In general outline: ·( .
By analogy with that there is a calculation of
the value of losses for the other stages, starting
from the production stage. (Fuel stage hasn’t any
input energy, that’s why there is no indicator
for this stage).
In the total there are following indicators for
four-stage heat supply cycle:
· ;
· ( ;
·( .

Modern Economy Success 2016, №1
82
In general for multistage heat supply cycle:
·( .
A certain regularity is disclosed. We define it
as the regularity of step-by-step increasing of the
loss value. At the multiple energy cycle the loss
value increases with each subsequent stage. The
regularity is valid for the economy of any energy
cycle, but we are interested in the heat supply
cycle.
How does the regularity work? The loss value
increases because with the increasing of the
stage order the number of preceding stages in-
creases, and each of them has to be extra paid in
order to compensate losses.
The cycle value of the four-stage-heat-supply
cycle with different energy efficiency of stag-
es can be calculated:
· + ·( ) + +
( ·( ].
The calculation required a whole number of
formula changes, that exceeds the capabilities of
this publication. However, we can show the de-
gree of influence of the stage energy losses to the
cycle if we take for example an averaged value
of coefficients ( and ), equal for all
stages.
Let us suppose that, there is a four-stage-heat-
supply cycle, where every stage losses 50% of
energy, then and =
1. It means that every stage
requests from the previous stage two times more
energy than it is necessary in the "ideal" condi-
tions. In order to provide the consumption stage
it is necessary to have a transmission grid which
should work twice more. It means, the cycle val-
ue rises by the value of one more transmission
grid. The transfer stage also requests from the
production stage two times more energy. But the
transfer stage works at a twice power and that’s
why it requests from the production stage four
times more energy. The production stage works
four times more and also losses the half of ener-
gy, that’s why it demands eight times more fuel
than in the «ideal» conditions. The results of
these arguments are represented in the Table 1.
Table 1
Covering of energy losses of the cycle by the stage resources
(with an equal stage energy efficiency)
STAGES , % The amount of extra resources, covering
of energy losses of the cycle
Fuel - - 700 %
Production 50 1,00 300 %
Transfer 50 1,00 100 %
Consumption 50 1,00 -
To implement a cycle, working on such a
scheme, it is necessary to buy 8 times more fuel,
to build and to maintain 4 energy-producer
plants (instead of one), to build and to maintain 2
transmission grids (instead of one). The result is
spectacular. But how does it relate to the real sit-

Modern Economy Success 2016, №1
83
uation at the energy sector? In reality, 50% of
energy transfer for thermal power plants is a
quite good indicator. For heat supply grid, based
on wasteful technologies, working for many
years and operating over long distances the 50%
of energy losses is a quite often indicator [2, 4].
As concerning the energy consumption, at cur-
rent technical conditions (a low thermal protec-
tion of buildings) and a lack of feedback from
consumption to production (the control system),
50% is also a quite often indicator [1, 6].
The table shows that the energy loss of subse-
quent stages are progressing geometrically to the
early stages, pushing up the value of the whole
cycle. It is clear, that the energy efficiency of last
stages has a greater effect on the value of the
cycle than the energy efficiency of the first stag-
es. It means, the increasing of an energy transfer
coefficient of the consumption stage ( ) de-
creases the value of the cycle much more than
the same increasing of the energy transfer coeffi-
cient of the production stage( ).
Let’s increase the energy transfer coefficient
of consumption stage ( ) to 0,66. It would give
= 0,5. The energy transfer coefficients of
other stages would be the same as before. The
amount of extra resources for different stages is
shown in the Table 2.
Table 2
Covering of energy losses of the cycle by the stage resources
(after increasing of the energy efficiency of consumption stage)
STAGES , %
The amount of extra resources, covering
of energy losses of the cycle
Fuel - - 500 %
Production 50 1,00 200 %
Transfer 50 1,00 50 %
Consumption 66 0,5 -
For comparison, let’s increase to the same
size the energy efficiency of the production stage
( = 0,66; = 0,5). The other stages would
have the same size of the energy efficiency as
before ( = 0,5; = 1). The result is
shown in the Table 3.

Modern Economy Success 2016, №1
84
Table 3
Covering energy losses of the cycle by the stage resources
(after increasing of the energy efficiency of production stage)
STAGES , %
The amount of extra resources, covering of
energy losses of the cycle
Fuel - - 500 %
Production 66 0,5 300 %
Transfer 50 1,00 100 %
Consumption 50 1,00 -
After comparison of the Table 1 and the Table
2, we can see that both variants give the same
fuel saving. But the first variant (the increasing
of the energy efficiency of consumption stage)
gives the reduction of extra resources for produc-
tion and transfer stages (from 300% to 200% and
from 100% to 50%, accordingly). It makes the
cycle, built on the effective consumption, more
economical than the cycle, built on the efficient
production.
Hence it follows that: other things being
equal, the energy-saving upgrading of the last
stages of the cycle gives a greater economic ef-
fect than the upgrading of the first stages.
On the basis of the revealed regularity, it is
possible to compare the efficiency of heat supply
cycles, built according to different technological
schemes.
We carried out such a comparison to deter-
mine the prospects of the electric heat supply,
whose main competitor is the cogeneration tech-
nology, traditional for Russia. The feature of this
technology is a quite high energy efficiency of
the production stage through the use of the resi-
dual heat of the electricity generation steam tur-
bines. The electricity production in the condens-
ing mode (the electrical heat supply is based on
it), occurs with more substantial energy losses.
However, an electric current at transfer and con-
sumption stages affords much more opportuni-
ties for savings than the heat-transfer liquid at
the same stages of the heating cycle.
We calculated technological conditions of the
economic equivalence for electric and cogenera-
tion heat supply cycles. The result is shown in
the Table 4.

Modern Economy Success 2016, №1
85
Table 4
Technological conditions of the economic equivalence of two heat supply cycles
STAGES
Cogeneration heat supply cycle Electric heat supply cycle
The technology , % The technology , %
Fuel Organic fuel - Organic fuel -
Production
The heat producing at
power plants in the co-
generation mode
65
The electricity producing
at power plants in the con-
densational mode
37
Transfer Pipeline network 75 Electric grid 90
Consumption Heating radiator 75 Infrared panel 95
The table shows the stage technologies and
the energy transfer coefficients at which the val-
ue per unit of energy in the electric heat supply
cycle is equal to the value per unit of energy in
the cogeneration heat supply cycle. We took the
average energy efficiency of the production,
transfer and consumption stages for the cogene-
ration heat supply cycle across the Russia. As the
table shows, despite the quite low efficiency of
electricity production in the condensational
mode( =37%),there is an electric heat supply
cycle, which is economically equal to the coge-
neretation cycle, due to increased energy effi-
ciency of the transfer and consumption stages.
Using more energy efficient electricity produc-
tion technologies ( is more than 37%) it will
make the electric heat supply cycle economically
more profitable than the cogeneration heat
supply cycle.
References
1. Antonov N.V. Electricity consumption in the domestic sector of Russia // Energy saving. 2011. №7.
P. 50 – 57.
2. BashmakovI.A. Analysis of the main trends of development of heat supply systems in Russia and
abroad // [An electronic resource] –Center for energy efficiency. mode:
http://www.cenef.ru/art_11212_119_node2.html
3. Bashmakov I.A. Increasing of energy efficiency at domestic sector // Energy saving. 2008. №8.
4. Assessing the optimal use of electric heating systems for integrating renewable energy sources / T.
Bossmann, R. Elsland, A. Klingler, G. Catenazzi end ets. // Energy Procedia. 2015. V. 83. P. 130 – 139.
Modern Economy Success 2016, №1
86
5. Study of electric heating effects on carbon nanotube polymer composites / K. Chu, D. Yun, D. Kim,
H. Park end ets. // Organic Electronics. 2014. V. 15. P. 2734 – 2741.
6. Energetics and industry of Russia // [An electronic resource].mode: http://www.eprussia.ru
7. Gohl N., Dan Bauer D., Druck H. 1to10 – a Cost-effective Heat Supply Concept with Low Primary
Energy Consumption for Multi-family Houses and Small Residential Areas // Energy Procedia. 2016. V.
91. P. 460 – 466.
8. Heat-power engineering and centralized heat supply of Russia in 2012-2013 // The report of the
Ministry of energy on thermal power generation and district heating Russia. 2015.
9. Jeong J., Seob Kim C., Lee J. Household electricity and gas consumption for heating homes // Ener-
gy Policy. 2011. V. 39. P. 2679 – 2687.
10. Le Truong N., Gustavsson L. Solar heating systems in renewable-based district heating // Energy
Procedia. 2014. V. 61. P. 1460 – 1463.
11. Le Truong N., Dodoo A., Gustavsson L. Renewable-based heat supply of multi-apartment build-
ings with varied heat demands // Energy. 2015. P. 1053 – 1062.
12. Le Truong N., Gustavsson L., Dodoo A. Heat supply of multi-apartment buildings with varied heat
demands // Energy Procedia. 2014 V. 61. P. 1464 – 1467.
13. Nekrasov A.S., Voronina S.A. The state and prospects of development of heat supply in Russia //
Energy: Economics, technique, ecology. 2004. №10. P. 2 – 11.
14. OkorokovV.R., OkorokovR.V. The Concept of Electricity and Heat Supply in Cities across the
Country as a Mechanism of Improving their Energy and Environmental Security // Vestnik IGEU. 2015.
№6. P. 3– 10.
15. Integrated modeling of active demand response with electric heating systems coupled to thermal
energy storage systems / D. Patteeuw, K. Bruninx, A. Arteconi, E. Delarue end ets. // Applied Energy.
2015. V. 151. P. 306 – 319.
16. Pineaua D., Riviereb P., Stabatb P., Hoanga P., Archambaulta V. Performance analysis of heating
systems for low energy houses // Energy and Buildings. 2013. V. 65. P. 45 – 54.
17. Rashevskaya M.A. The development of heating and hotwater supply systems // Industrial electric
heat supply. 2011. №4. P. 52 – 60.
18. Ruokamo E.. Household preferences of hybrid home heating systems – A choice experiment appli-
cation // Energy Policy. 2016. V. 95. P. 224 – 237.
19. Sakipovaa S., Jakovis A., Gendelis S. Studies energy efficiency of the renewable sources use con-
sidering climate in Latvia // Energy Procedia. 2015 V. 78. P. 1980 – 1984.
20. Yoon T., Maa Y., Rhodes C. Individual Heating systems vs. District Heating systems: What will
consumers pay for convenience? // Energy Policy. 2015. V. 86. P. 73 – 81.
Modern Economy Success 2016, №1
87
International Research Journal “Modern Economy Success” / ISSN 2500-3747 Volume 23, Number 1 (2016), pp.87-110
© Modern Science Success / http://www.modernsciencejournal.org/
Карачевская Е.В.
кандидат экономических наук, УО Белорусская государственная сельскохозяйственная ака-
демия, г. Горки, Беларусь.
Рогачев А.Ф.
доктор технических наук, ФГБОУ ВО Волгоградский государственный аграрный универси-
тет, г. Волгоград, Россия.
МОДЕЛИРОВАНИЕ И ОЦЕНКА ЭКОНОМИЧЕСКОЙ ЭФФЕКТИВНОСТИ
ФУНКЦИОНИРОВАНИЯ АГРОФАРМАЦЕВТИЧЕСКОГО КЛАСТЕРА
РЕСПУБЛИКИ БЕЛАРУСЬ
Аннотация: в статье систематизированы теоретические положения построения
производственно-перерабатывающих кластеров и основы оценки и моделирования их
эффективности. Разработана оценка экономической эффективности функционирования на
примере агрофармацевтического кластера Республики Беларусь, включающего
сельскохозяйственные предприятия, производящие лекарственное сырьѐ, и перерабатывающие
предприятия. Рынок лекарственного растительного сырья (ЛРС), представляющего собой
лекарственные растения, иногда используемые в высушенном виде в качестве лекарственного
средства или для получения лекарственных средств, является достаточно специфическим.
Проведен расчет показателей чистой прибыли и распределение синергетического эффекта на
основе предложенной оптимизационной экономико-математической модели, учитывающей
различные группы параметров производителей лекарственного сырья и фармацевтической
продукции. Предложена структурно-логическая модель функционирования новой формы
взаимоотношений между контрагентами рынка ЛРС, которая дает возможность в общих
финансовых результатах учесть вклад каждого субъекта кластера в результаты совместной
деятельности, а также рассчитать дополнительный доход каждого участника. В ходе расчетов
получены оптимальные объемы производства ЛРС, а также его распределения по направлению
переработки и реализации. Созданием фармацевтического кластера решаются задачи не только
повышения стабильности отдельных предприятий в целом, но также снижения зависимости
Республики Беларусь от импорта и завоевания прочных позиций на международном рынке.
Разработанная методика обеспечивает возможность расчета параметров экономико-
математической модели агрофармацевтического кластера на рынке ЛРС. Предложенная методика,
Modern Economy Success 2016, №1
88
основывающаяся на использовании имитационного моделирования, воспроизводящая
функционирование объекта наблюдения, позволяет получить прогнозные значения оценки
синергетического эффекта в интеграционных сделках.
Ключевые слова: эффективность функционирования, агрофармацевтический кластер, эконо-
мико-математическое моделирование, оптимизация, синергетический эффект
Введение. Проблема эффективности
функционирования рынка, в т.ч. фармацевти-
ческой продукции, может рассматриваться с
различных позиций: общества, производите-
ля, потребителя; экономическая, социальная,
социально-экономическая эффективность и
т.д. Актуальность исследований агрофарма-
цевтического рынка обусловлена его соци-
альной значимостью для обеспечения здоро-
вью населения [3, 9, 13, 16, 17].
В экономике понятие «эффективность»
употребляется в двух значениях. В одних
случаях эффективность характеризует поло-
жительные изменения в процессе производ-
ства. Эффективность в этом смысле является
синонимом слов «результативность», «про-
дуктивность», «производительность», «дей-
ственность» и определяется как отношение
результата (эффекта) за определенный период
к затратам ресурсов. Рынок лекарственного
растительного сырья (ЛРС), представляюще-
го собой лекарственные растения или их час-
ти, иногда используемые в высушенном виде
в качестве лекарственного средства или для
получения лекарственных средств, является
достаточно специфическим.
Исследование эффективности развития
рынка ЛРС, проведенные И.Н. Дорошкеви-
чем [5], включает следующие сегментарные
критерии оценок изучаемого рынка:
определение уровня развития системы за-
готовки и культивирования ЛРС, которое со-
держит широту ассортимента и динамику
объема заготовки, структуру заготовителей
по субъектам и регионам, эффективность
производственной деятельности;
изучение потребительских предпочтений
покупателей препаратов на основе ЛРС, а
именно определение структуры спроса по ви-
дам, частоте и форме использования метода-
ми опроса и наблюдения;
выявление условий и факторов, влияющих
на развитие рыночных отношений, в том чис-
ле определение факторов воздействия на сте-
пень самостоятельной заготовки лекарствен-
ных растений, определение факторов, пре-
пятствующих развитию рынка ЛРС;
анализ качественной и количественной
информации об объемах внешнеторговой
деятельности на рынке ЛРС, включающий
анализ и соотношение цен, характеристика
объемов и структуры внешней торговли [5].
В этой связи особую значимость приобре-
тают вопросы разработки стратегических ре-
шений в области развития интеграционных
процессов в масштабах крупных и мелких
Modern Economy Success 2016, №1
89
производителей, от которых во многом зави-
сит инновационная активность рынка. Нема-
ловажная роль принадлежит поиску путей
взаимодействия участников интеграционного
процесса [1, 21, 22], разработке методики
создания агрофармацевтических кластеров. В
ряду недостаточно изученных теоретических
аспектов управления, анализа и становления
рынка лекарственного растительного сырья
следует отметить такие, как формирование на
нем эффективных моделей организации и оп-
тимизации межотраслевых связей, поиск
но10, 12,вых методов построения долгосроч-
ных прогнозов сбалансированного развития
взаимосвязанных научно-производственных
систем, структуризация методов государст-
венного регулирования, координация кла-
стерных структур в социально значимых от-
раслях экономики, в т.ч. на основе экономи-
ко-математического моделирования [9, 10, 12,
26-29].
Целью исследования является оценка эф-
фективности функционирования рынка лекар-
ственного растительного сырья в условиях аг-
рофармацевтическго интегрированного фор-
мирования. Основные задачи исследования:
разработка методики определения транс-
фертных цен; разработка механизма иннова-
ционного развития агрофармацевтического
кластера; обоснование методика распределе-
ния дополнительного дохода между участни-
ками кластера.
Методы и материалы: системный, срав-
нительный и структурный анализ, экономико-
математического моделирование, оптимиза-
ция параметров социально-экономических
систем.
Результаты и обсуждения. Кластер на
рынке ЛРС должен представлять собой пол-
ноценный комплекс открытого типа, объеди-
няющий с целью взаимовыгодного сотрудни-
чества предприятия по выращиванию ЛРС,
перерабатывающие предприятия, предпри-
ятия розничной торговли, кредитно-финан-
совые организации, научно-
исследовательские институты, органы госу-
дарственной власти, обслуживающие пред-
приятия. Отметим, что на начальном этапе
создания агрофармацевтического кластера, в
т.ч. в условиях Республики Беларусь, необхо-
дима активная политика органов государст-
венной власти, которая позволит развить
взаимовыгодное сотрудничество между вла-
стью, производством, учебными заведениями,
научными организациями и общественно-
стью. Государство становится генератором
формирования недостающих звеньев как в
области финансирования науки и инноваци-
онной деятельности, так и в области законо-
дательства.
Одним из важнейших направлений регио-
нальных органов государственной власти в
стимулировании развития кластера должно
стать привлечение крупных финансовых ин-
ститутов, обеспечение гарантии снижения их
рисков, что будет способствовать стимулиро-
ванию развития инвестиционной деятельно-
сти [2]. Более широкому привлечению ино-

Modern Economy Success 2016, №1
90
странных и отечественных инвестиций ме-
шают политическая и экономическая неста-
бильность, несовершенство и нечеткость на-
логового законодательства, недостаточные,
по мнению инвесторов, гарантии возврата
вложенных средств и льгот различного уров-
ня. Для инвестора особенно важное значение
имеет политическая ситуация как фактор, оп-
ределяющий стабильность. Необходимо под-
робное описание ситуации, даже если она
оценивается как неблагоприятная, т.к. инве-
сторов отпугивает отсутствие достоверной
информации. Большинство проблем, связан-
ных с осуществлением инвестиционной дея-
тельности, должны решаться на региональ-
ном уровне с использованием предпосылок,
созданных республиканскими органами вла-
сти [15].
Под эффективностью развития агрофарма-
цевтического кластера понимается результа-
тивность совместной деятельности его участ-
ников, определяемая как отношение суммы
индивидуальных эффектов всех участников с
учетом возникающих синергетических эф-
фектов к затратам, обусловившим их получе-
ние [6, 7]. Каждый из участников должен
быть убежден в собственной выгоде и спра-
ведливости распределения общего синерге-
тического эффекта, в противном случае он не
войдет в кластер. При этом эффективность
кластеров зависит от результативности их
деятельности на разных уровнях функциони-
рования [6, 7, 15].
Для определения эффективности создания
кластера был рассчитан экономический эф-
фект по модели, предложенной авторами ис-
следования. Важнейшим показателем эффек-
тивности с.-х. производства и его планирова-
ния является урожайность [14]. Проводился
расчет урожайности ЛРС в зависимости от
анализа фактической и нормативной урожай-
ностей (табл. 1).
Таблица 1
Ассортиментный перечень и перспективная урожайность
Наименование ЛРС Фактическая
урожайность, ц/га
Нормативная
урожайность, ц/га
Перспективная
урожайность, ц/га
Календула 12,3 15 15
Душица 2,8 2,35 2,8
Ромашка 4,3 4 4,3
Пустырник пятилопастный 24 30 30
Зверобой продырявленный 13 15 15
Мята перечная 14,1 17,5 17,5
Шалфей лекарственный 25,5 10 25,5
Иссоп лекарственный 35,9 20 35,9
Девясил 6 5 6

Modern Economy Success 2016, №1
91
Продолжение таблицы 1
Мелисса 16 48,5 32
Барбарис 26 30 30
Боярышник 53,3 30 53,3
Бузина 54,5 45 54,5
Котовник 4,3 32,5 18,4
Лимонник 15 3 15
Многоколосник 40 100 70
Чабрец 44,42 30 44,42
Шалфей лекарственный 25,5 10 25,5
Шиповник 21 20 21
Актинидия 22,5 15 22,5
Валериана лекарственная 8,4 35 21,7
Арония 42,3 35 42,3
Чистотел 14 12 14
Череда трехраздельная 12 15 15
Тысячелистник 6 8 8
Таблица 2
Нормы расхода ЛРС для производства 1 т настоек на ЗАО «Беласептика», т
Наименование
продукции
Пло
ды
бо
яр
ыш
ни
ка
Ко
рен
ь
вал
ери
ан
ы
Ро
ди
ола
ро
зовая
Звер
об
ой
Ко
рен
ь
жен
ьш
ен
я
Цвет
ки
кал
ен
ду
лы
Кр
апи
ва
ли
сть
я
Пу
сты
рн
ик
Цвет
ро
маш
ки
Тр
ава
тыся
че-
ли
стн
ика
Эвкал
ип
т
Эх
ин
ацея
Боярышника
настойка
0,1 – – – – – – – – – – –
Валерианы
настойка
– 0,2 – – – – – – – – – –
Женьшеня
настойка
– – – – 0,1 – – – – – – –
Зверобоя на-
стойка
– – – 0,1 – – – – – – – –
Календулы
настойка
– – – – – 0,2 – – – – – –
Крапивы
экстракт
– – – – – – 0,07 – – – – –

Modern Economy Success 2016, №1
92
Продолжение таблицы 2
Пустырника
настойка
– – – – – – – 0,3 – – – –
Родиолы
розовой
экстракт
– – 0,7 – – – – – – – – –
«Ротокан-
Асепт» экс-
тракт
– – – – – 0,2 – – 0,4 0
,2
– –
Эвкалипта
настойка
– – – – – – – – – – 0
,5
–
Эхинацеи
настойка
– – – – – – – – – – – 0
,05
Примечание – Разработки авторов на основе [16, 17].
Таблица 3
Показатели чистой прибыли на шесть лет вперед (без образования кластера)
Показатели выручки, млрд руб. 1-й год 2-й год 3-й год 4-й год 5-й год 6-й год
ЗАО «Беласептика» 4,7 9,4 14,0 18,7 23,3 28,0
КСУП «Минская овощная фабрика» -26,2 -10,4 5,4 6,3 13,7 15,9
ОАО «Борисовский завод медицин-
ских препаратов» 129,0 130,0 152,0 164,0 201,0 212,0
Примечание – Разработка авторов.
Анализ производственных процессов на
взятых предприятиях показал, что в КСУП
«Минская овощная фабрика» урожайность
незначительно, но ниже, чем в ЗАО «Бела-
септика», что можно объяснить специализа-
цией фабрики (кроме лекарственных трав на
предприятии выращиваются некоторые дру-
гие овощные культуры). В ЗАО «Беласепти-
ка» уделяется пристальное внимание повы-
шению урожайности, проводятся работы по
внесению пестицидов и удобрений и, соот-
ветственно, наблюдается ее рост. Следова-
тельно, отстающему предприятию необходи-
мо уделить большее внимание и довести уро-
вень урожайности до передового, кроме того,
если не достигнут нормативный уровень, то
спроектировать процедуру достижения дан-
ного уровня.
Нормы расхода сырья для производства ряда
фитопрепаратов на ЗАО «Беласептика»
представлены в табл. 2. Результаты расчета
показателей чистой прибыли для варианта без
образования кластера приведен В табл. 3.
При формировании кластера важное зна-
чение имеет распределение инвестиций и ре-
сурсов. В существующей экономической

Modern Economy Success 2016, №1
93
практике распределение ресурсов между
предприятиями-участниками производится на
основе внутренних цен, называемых транс-
фертными. В настоящее время трансфертное
ценообразование в основном применяется в
корпоративных структурах для минимизации
налоговых выплат. Однако трансфертное це-
нообразование может быть использовано как
механизм управления распределением ресур-
сов в кластерных формированиях для повы-
шения эффективности их деятельности.
Необходимо отметить, что предприятия,
производящие сырье и перерабатывающие, в
рамках трансфертного ценообразования бу-
дут преследовать разные цели: производящие
или поставляющие сырье предприятия будут
заинтересованы в повышении трансфертных
цен, а перерабатывающие (принимающие) − в
их снижении [10]. Для регулирования данно-
го конфликта интересов в кластере совет
управляющих следит за установлением
трансфертных цен. В мировой практике при-
меняются несколько групп методов транс-
фертного ценообразования на ресурсы: мето-
ды экспертной оценки, рыночные методы и
методы определения затрат. Выбор варианта
трансфертного ценообразования зависит от
следующих факторов: степени самостоятель-
ности предприятия; уровня рыночной конку-
ренции; степени соответствия целей и задач
предприятий-участников целям и задачам
кластера в целом; взаимосвязи между спро-
сом и предложением на ресурсы в ближай-
шей перспективе; системы оценки деятельно-
сти предприятий-участников. В условиях
экономической нестабильности целесообраз-
но использовать затратные методы.
Предлагается следующая методика транс-
фертного ценообразования в агрофармацев-
тическом кластере:
1) регулирование трансфертных цен осу-
ществляет совет управляющих;
2) расчет оптимальной трансфертной цены
осуществляется с помощью экономико-
математических моделей.
Основной целью оптимизации формирова-
ния трансфертной цены является повышение
эффективности функционирования, прежде
всего, кластера в целом [26]. Следовательно,
целевой функцией в задаче должна выступать
суммарная прибыль предприятий от реализа-
ции произведенной продукции. Расчет прове-
дем по трем предприятиям-участникам (1):
0
max
Nn
nxF , (1)
где n – номер организации-участника в кла-
стере; 0N – количество организаций-
участников в кластере; nx – маржинальная
прибыль n организации-участника за выче-
том налогов из выручки.
С другой стороны, совокупная маржи-
нальная прибыль агрофармацевтического
кластера состоит из маржинальной прибыли
предприятий, входящих в данное объедине-
ние (2):
211 Jj
jn
Ii
inininin
Ii
n xvzvxx , 1Nn (2)

Modern Economy Success 2016, №1
94
где i – виды продукция; 1I – лекарственное
растительное сырье (продукты его перера-
ботки); inx – трансфертная цена на продук-
цию вида i предприятия вида n ; inv – объем
производства продукции вида i предприятия
вида n ;
inz – удельные переменные издержки на
продукцию вида i предприятия вида n ;
j – виды налогов; 2J – налоги, выплачи-
ваемые предприятиями, производящими
ЛРС; jnx – налоги j , выплачиваемые из вы-
ручки предприятия вида n ; 1N – поставляю-
щие организации.
При этом трансфертная цена поставляю-
щего предприятия является минимальным
размером переменных затрат принимающей
организации (3):
inin xx
, 1Nn , 2Nn , (3)
где 2N – принимающие организации.
Трансфертная цена поставляющей органи-
зации формируется на основе переменных
издержек плюс надбавка (4):
ininin xzx
, 1Ii , 1Nn , (4)
где inx
– используемая надбавка при форми-
ровании трансфертной цены.
Цена принимающей организации состоит
из трансфертной цены поставляющей органи-
зации и остальных затрат (5):
ininin хsxx
, (5)
где inx – трансфертная цена на продукцию
вида i предприятия вида n , 2Nn ; s – за-
траты, включаемые в формирование пере-
менных издержек.
Приведем пример расчета маржинальной
прибыли предприятий занимающихся пере-
работкой ЛРС (6):
211 Jj
jn
Ij
inininin
Ii
n xvzvxx , 2Nn .(6)
Если известны цены на промежуточный
продукт (или его аналог) и цены на конечные
продукты, то внутренние и внешние цены
кластера не должны превышать 20% откло-
нения от известных рыночных цен (7):
iini pxp 2,18,0 , 211 ,, NnNnIi . (7)
Распределение ресурсов в процессе дея-
тельности агрофармацевтического кластера
подчинено управлению координационного
органа. Ключевую роль в кластере играют
потоки технологий и информации между
людьми, предприятиями и институтами. Тех-
нологическое развитие является результатом
взаимосвязей между участниками системы –
предприятиями, университетами и научными
учреждениями. Можно выделить несколько
типов таких потоков: взаимодействие между
предприятиями, прежде всего совместная ис-
следовательская деятельность и иное техни-
ческое сотрудничество; распространение тех-
нологий; мобильность рабочей силы, харак-
теризующая поток «неявных знаний» [8].
Характерной особенностью участников аг-
рофармацевтического кластера является воз-
никновение в них интегрированных цепочек
создания добавленной стоимости, что обу-
словлено следующими эффектами: формиро-
вание ценовой и технологической конкурен-

Modern Economy Success 2016, №1
95
тоспособности; единство стратегии развития
всех участников кластера; включенность в
исследовательские сети; единство производ-
ственных стандартов [7].
Изучение общеизвестных методов иссле-
дования показало, что для анализа эффектив-
ности производства и реализации ЛРС и про-
дуктов его переработки на перспективу наи-
более приемлемо использование метода до-
бавленной стоимости. Критерием оптималь-
ности в этом случае станет чистая прибыль.
Данный критерий является наиболее прием-
лемым, так как во все времена ценились от-
дача от инвестиций и эффективное вложение
денежных средств. Кроме того, при объеди-
нении участников кластера и возникает си-
нергетический эффект, который также требу-
ет учета. При этом предлагается принимать
результативность совместной деятельности
как целого, определяемого отношением сум-
мы индивидуальных эффектов всех партне-
ров, скорректированных с учетом возникаю-
щих синергетических эффектов, к затратам,
обусловившим их получение. Если каждый из
участников не будет уверен в собственной
выгоде и справедливости распределения об-
щего синергетического эффекта, что вызыва-
ет необходимость разработки методики спра-
ведливого разделения прибыли, образование
кластера не состоится, а если и произойдет,
то сотрудничество будет недолгим из-за лич-
ного неудовлетворения участников, приво-
дящего к общей неустойчивости [23].
В предлагаемой модели планируемый ин-
тервал деятельности предприятий представ-
ляется как дискретный [t0; t], состоящий из М
шагов (например, по годам); t – параметр, ха-
рактеризующий номер каждого шага; t = 1 –
первый год в указанном интервале [t0; t], t =
M – последний год на указанном интервале.
Алгоритм имитационного моделирования
развития кластера является упрощенным
описанием производственной деятельности
предприятий.
Модель объединяет предприятия, зани-
мающиеся выращиванием ЛРС, и предпри-
ятия по переработке ЛРС.
Проводятся расчеты оптимального объема
производства ЛРС, оптимального его распре-
деления по направлению переработки. В це-
лях снижения затрат по выращиванию лекар-
ственных трав также определяется объем ин-
вестиций, направляемых на производство для
повышения его эффективности. Предусмот-
рено инвестирование из трех источников: за
счет бюджетных средств, кредитов банков, а
также собственных отчислений из прибыли.
Оптимизируется объем средств, расчет кре-
дита на конкретный временной интервал, пе-
риодичность поступления денежных средств.
Рассчитывается процентная ставка по креди-
тованию и оптимальные цены для реализации
продукции.
Производится расчет производственно-
экономических показателей предприятий по
переработке ЛРС и реализации готовой про-
дукции, где описываются товарно-

Modern Economy Success 2016, №1
96
производственные связи, движение финансо-
вых потоков. Для оптимального производства
необходимо добиться максимального дохода,
в нашем случае – максимума прибыли. При
этом учитываются связи между предпри-
ятиями, занимающимися культивированием
ЛРС и переработкой.
Характеризуется сбытовая деятельность
предприятий, занимающихся реализацией го-
товой продукции.
Определяются основные выходные пара-
метры модели, к которым относятся суммар-
ные гарантированные доходы каждого из
предприятий кластера за планируемый пери-
од. Конечные результаты по оценке макси-
мальных гарантированных доходов получают
только по окончании всех расчетов, так как
параметры всех уровней кластера являются
взаимосвязанными и взаимозависимыми.
Если полученные результаты по каким-
либо причинам не устраивают участников
кластера, то возможно изменение значений
задаваемых в модели параметров и проведе-
ние новых циклов вычислений.
Краткая характеристика разработанной
экономической модели деятельности агро-
фармацевтического кластера, которая опира-
ется на взаимосвязанные информационные и
ресурсные потоки, представлена структурной
экономико-математической моделью [4].
Использована следующая индексация:
j – номер видов лекарственных растений;
i – номер ресурсов, видов товарной продук-
ции; i номер вида товара; k – номер вида
канала; m – вид ресурсов покрытия затрат;
oJ – множество видов лекарственных расте-
ний; 0I – множество видов ЛРС; 1I – множе-
ство видов земельных угодий; 2I – множест-
во видов товаров; 3I – множество видов ас-
сортиментных групп товаров; 0N множество
направлений переработки и реализации сырья
лекарственных растительных трав; 0K –
множество направлений приобретения ЛРС;
1K – множество каналов реализации товаров;
2K – множество направлений выплаты про-
центов по кредитам; 0M – множество на-
правлений покрытия затрат.
Известные задаваемые величины:
iA – ресурсы земельного угодья i ; iа –
количество привлеченных земель вида i ; jV –
урожайность лекарственных растительных
трав вида i ; ija соответственно расход зе-
мельного угодья вида i на единицу отрасли вида
j ; inid – выход товаров вида i с единицы сы-
рья вида i при переработке вида n ; ijс – за-
траты вида i на единицу площади j ; kjс –
затраты вида k на приобретение единицы
сырья вида i ; inc – затраты вида i на про-
изводство единицы товара вида i по направ-
лению вида n ; mm rr
, – соответственно мини-
мальный и максимальный удельный вес m -го
вида источника покрытия; kr – процент воз-
врата заемных средств; niinii
DD ~~ ,~
соответст-
венно минимальное и максимальное количе-

Modern Economy Success 2016, №1
97
ство товара вида i , относящегося к ассорти-
ментной группе вида i
, произведенное при
переработке вида n ; ki
p – количество (де-
нежных) средств вида i
, полученных от реа-
лизации единицы товара, реализованного по
каналу вида k .
Неизвестные искомые величины:
jx – площадь, занятая под выращивание
лекарственных трав вида j ; ix – количество
привлеченных земельных угодий i ; my – по-
требность в инвестиционных ресурсах m ;
inх – количество сырья вида i канала n ; ijx –
количество сырья вида i получаемого при
выращивании лекарственных трав вида j ;
iniх – количество товаров ассортиментной
группы вида i
, полученных в результате пе-
реработки сырья по направлению вида n ;
ki
x~количество товаров вида i
, реализован-
ных по каналу сбыта вида k ; ikx – количест-
во ЛРС вида i , приобретенного по каналу k ;
iy – стоимость товарной продукции вида i ;
iy –инвестиционные ресурсы.
1. Ограничение по использованию земель-
ных угодий для выращивания ЛРС (формула
(8)):
0Jj
iijij xAxa 1Ii . (8)
Ограничение на вовлекаемую в оборот
землю (формула (9)):
ii ax , 1Ii . (9)
2. Ограничение по валовому сбору лекар-
ственных растений (10):
jjji xVх , 0Jj , 1Ii .(10)
3. Ограничение по распределению ЛРС по
направлениям переработки и реализации, т.е.
количество сырья данного вида у организа-
ции равно суммарному объему сырья этого
вида, направляемого на различные виды пе-
реработки и реализации (11):
0Nn
inij xх , 0Jj , 0Ii . (11)
4. Ограничение по производству товаров в
ассортименте, т.е. количество товара данного
вида равно выходу этого вида товара с еди-
ницы сырья, умноженному на объем сырья,
направленному на переработку (12):
niiiinin xdx , 0Nn , 2Ii , 0Ii .(12)
5. Ограничение по предельным объемам
производства, т.е. объем производства това-
ров данного вида должен находиться в преде-
лах от минимального до максимального объ-
ема его производства (13):
iniiniini DxD
, 0Nn , 2Ii , 0Ii .(13)
6. Ограничение по формированию потреб-
ности в инвестиционных ресурсах, т. е. за-
траты данного вида в целом по организации
формируются из затрат этого вида, необхо-
димых для заготовки сырья, для его перера-
ботки, производства товаров и их сбыта (14):
2 0 00 Ii Nn
i
Kk
ikkiinin
Ii
ji yxсxcхс , 0Ii .(14)
7. Ограничение по оценке суммарной вы-
ручки без учета выплат по кредитам, т.е.
стоимость товарной продукции определяется
объемами сбыта и ценами реализации това-
ров, относящихся к конкретным ассорти-

Modern Economy Success 2016, №1
98
ментным группам, реализованным по различ-
ным каналам сбыта (15):
2 1Ii
iikiikiKk
yxp
, 1i . (15)
Целевая функция связывает вышеуказан-
ные ограничения и приводит их к общей цели
(16):
max0
1
m
Mm
kii
i yryy , 2Kk .(16)
Модель позволяет установить критерии эф-
фективности, допущения и ограничения эко-
номической деятельности промышленного
кластера. Основная цель ее разработки – ус-
тойчивое развитие экономики. Данная цель
будет реализована за счет решения таких за-
дач, как формирование конкурентоспособной
экономики в регионах, создание условий для
развития народного хозяйства, разработка
механизмов для налаживания связей между
промышленными и научными организация-
ми, обеспечение условий для повышения эф-
фективности деятельности промышленных
предприятий [6, 15].
Анализ чистой прибыли от реализации
продукции на несколько лет вперед по фирмам-
участникам, расчет синергетического эффекта,
полученного в результате создания
агрофармацевтического кластера, приведен в
табл. 4.
Таблица 4
Расчет синергетического эффекта в результате образования агрофармацевтического кластера
Показатели чистой прибыли на 6 лет
вперед, млрд руб.
1-й
год
2-й
год
3-й
год
4-й
год
5-й
год
6-й
год
Без использования трансфертных цен
ЗАО «Беласептика» 4,7 9,4 14,0 18,7 23,3 28,0
КСУП «Минская овощная фабрика» -26,2 -10,4 5,4 6,3 13,7 15,9
ОАО «Борисовский завод
медицинских препаратов» 129,0 130,0 152,0 164,0 201,0 212,0
Чистая прибыль 107,5 129,0 171,4 189,0 238,0 255,9
Синергетической эффект от
совместной деятельности 10,9 13,0 17,3 19,1 24,0 25,9
С учетом использования трансфертных цен
ЗАО «Беласептика» 7,9 9,5 19,9 28,6 39,0 51,8

Modern Economy Success 2016, №1
99
Продолжение таблицы 4
КСУП «Минская овощная фабрика» -10,0 11,3 12,1 14,1 16,9 18,3
ОАО «Борисовский завод
медицинских препаратов» 156,3 157,7 161,9 167,3 225,2 250,9
Чистая прибыль 154,2 178,5 193,9 210,0 281,1 321,0
Синергетической эффект от
совместной деятельности 15,6 18,0 19,6 21,2 28,4 32,4
Из данных табл. 4 видно, что наибольший
рост синергетического эффекта наблюдается
на пятом году деятельности кластера, в по-
следующем также отмечается его повышение,
но более медленными темпами. При этом от-
метим, что при использовании трансфертных
цен предприятия получат большую величину
суммарной выручки за вычетом себестоимо-
сти и выплат по кредитам.
Кроме полученного эффекта, синергетиче-
ский эффект будет распространяться через:
передачу ноу-хау (участники рынка,
взаимодействуя в рамках конкретных
программ, объединяют свои новейшие
разработки);
совместное использование ресурсов,
что способствует экономии затрат;
создание преимуществ при
согласованности сроков отдельных проектов;
выигрыш за счет более выгодных
условий привлечения заемного капитала;
повышение доверия потребителей
конечного продукта.
Отметим, что наряду с увеличением объемов
производства исследуемых предприятий
возрастает эффективность их деятельности, что
весьма закономерно вследствие актуальности и
социальной значимости объекта их
деятельности.
Вместе с тем перед фирмами стоят задачи не
только повышения своей стабильности в целом
по республике, но также снижения зависимости
от импорта и завоевания прочных позиций на
международном рынке, для решения которых
предлагается создание агрофармацевтического
кластера, предусматривающего получение
синергетического эффекта. Вероятность
появления последнего рассчитывалась с
помощью распределения Бернулли, а численное
выражение эффекта от объединения в кластер –
с помощью метода Монте-Карло.
На основе нормального закона распреде-
ления было сгенерировано 297 эксперимен-
тов при уровне значимости 95% и получена
выборка оценок синергетического эффекта,
по которой рассчитаны статистические ха-
рактеристики распределения:
μ(SE) = 17,86 млрд руб. (средняя);
σ(SE) = 5,7 млрд руб. (стандартное отклоне-
ние); υ(SE) = 42,6% (коэффициент вариации);
min(SE) = 6,49 млрд руб.;
max(SE) = 35,22 млрд руб.; медиа-
на(SE) = 17,18 млрд руб.
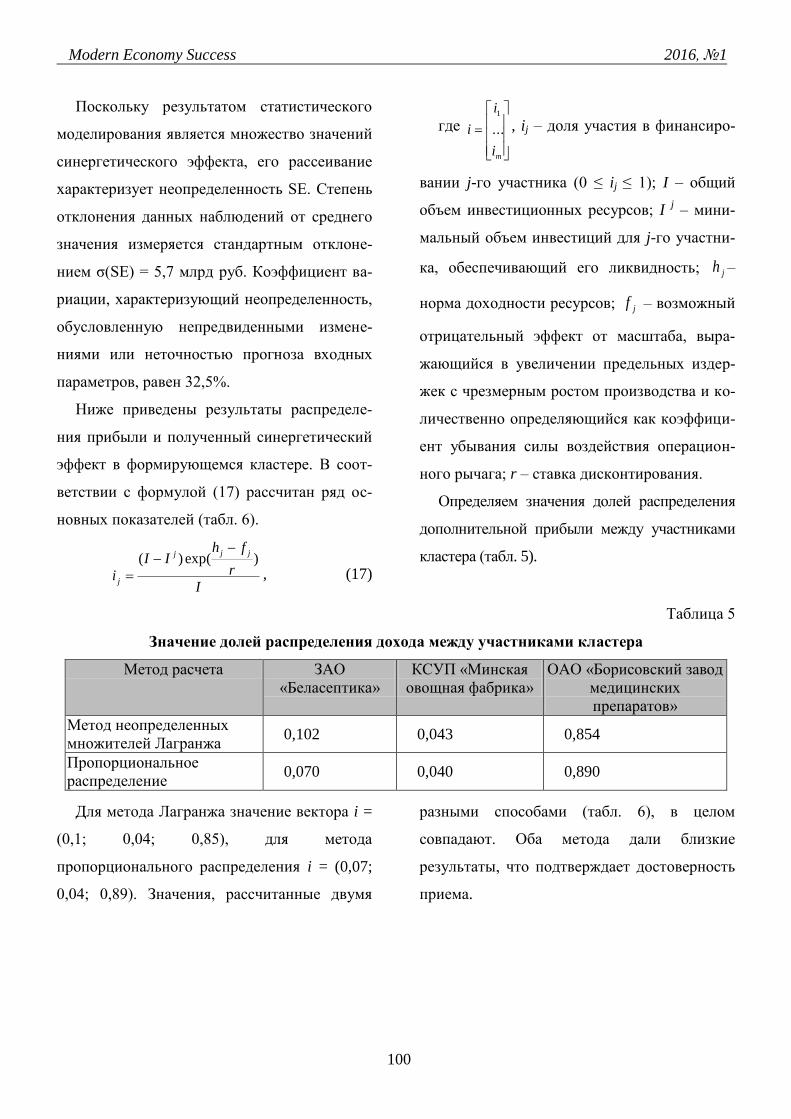
Modern Economy Success 2016, №1
100
Поскольку результатом статистического
моделирования является множество значений
синергетического эффекта, его рассеивание
характеризует неопределенность SE. Степень
отклонения данных наблюдений от среднего
значения измеряется стандартным отклоне-
нием σ(SE) = 5,7 млрд руб. Коэффициент ва-
риации, характеризующий неопределенность,
обусловленную непредвиденными измене-
ниями или неточностью прогноза входных
параметров, равен 32,5%.
Ниже приведены результаты распределе-
ния прибыли и полученный синергетический
эффект в формирующемся кластере. В соот-
ветствии с формулой (17) рассчитан ряд ос-
новных показателей (табл. 6).
I
r
fhII
i
jjj
j
)exp()(
, (17)
где
mi
i
i ...
1
, ij – доля участия в финансиро-
вании j-го участника (0 ≤ ij ≤ 1); I – общий
объем инвестиционных ресурсов; I j – мини-
мальный объем инвестиций для j-го участни-
ка, обеспечивающий его ликвидность; jh –
норма доходности ресурсов; jf – возможный
отрицательный эффект от масштаба, выра-
жающийся в увеличении предельных издер-
жек с чрезмерным ростом производства и ко-
личественно определяющийся как коэффици-
ент убывания силы воздействия операцион-
ного рычага; r – ставка дисконтирования.
Определяем значения долей распределения
дополнительной прибыли между участниками
кластера (табл. 5).
Таблица 5
Значение долей распределения дохода между участниками кластера
Метод расчета ЗАО
«Беласептика»
КСУП «Минская
овощная фабрика»
ОАО «Борисовский завод
медицинских
препаратов»
Метод неопределенных
множителей Лагранжа 0,102 0,043 0,854
Пропорциональное
распределение 0,070 0,040 0,890
Для метода Лагранжа значение вектора i =
(0,1; 0,04; 0,85), для метода
пропорционального распределения i = (0,07;
0,04; 0,89). Значения, рассчитанные двумя
разными способами (табл. 6), в целом
совпадают. Оба метода дали близкие
результаты, что подтверждает достоверность
приема.

Modern Economy Success 2016, №1
101
Таблица 6
Теоретический расчет денежных инвестиций предприятий – участников кластера
Предприятия Норма до-
ходности ре-
сурсов, %
Минимальный объем ин-
вестиций для j-го участ-
ника, обеспечивающий
его ликвидность, млрд
руб.
Порог убываю-
щей отдачи от
масштаба произ-
водства, %
Объем
инвестиций,
млрд руб.
ЗАО «Беласепти-
ка» 11,70 2,3 5,4 28,0
КСУП «Минская
овощная фабрика» 4,13 0,4 1,3 15,9
ОАО «Борисов-
ский завод меди-
цинских препара-
тов»
5,66 1,9 0,1 301,8
Синергетической
эффект от совме-
стной деятельно-
сти
– – – 97,2
Итого – 4,5 100 442,9
Пропорциональное распределение между
участниками промышленного кластера
происходит без учета нормы прибыли,
эффекта операционного рычага и
соотношений отраслевого баланса.
В табл. 7 приведены показатели чистой
прибыли с учетом синергетического эффекта,
определяемые с использованием двух разных
способов – в соответствии с расчетными дан-
ными для вектора i и в случае, если инвести-
ции будут распределены между участниками
пропорционально объему инвестиций (при-
веден анализ финансовых показателей пред-
приятий).

Modern Economy Success 2016, №1
102
Таблица 7
Показатели чистой прибыли с учетом синергетического эффекта
за шесть лет реализации проекта, млрд руб.
Предприятие 1-й
год
2-й
год
3-й
год
4-й
год
5-й
год
6-й
год
Зн
ачен
ие
доп
олн
ите
льн
ого
д
оход
а за
ш
есть
лет
сущ
еств
ован
ия а
гроф
арм
ацев
тичес
кого
клас
тера
ЗАО «Беласептика» (без применения
предложенной методики) 4,7 9,4 14 18,7 23,3 28
ЗАО «Беласептика» (с применением
предложенной методики (пропорцио-
нальное распределение дохода))
17 19,7 21,3 23,1 31 35,3
Разность 12,3 10,3 7,3 4,4 7,7 7,3
ЗАО «Беласептика» (с применением
предложенной методики (распределе-
ние дохода методом неопределенных
множителей Лагранжа))
17,3 20 21,8 23,6 31,6 36,1
Разность 12,6 10,6 7,8 4,9 8,3 8,1
КСУП «Минская овощная фабрика»
(без применения предложенной мето-
дики)
-26,2 -10,4 5,4 6,3 13,7 15,9
КСУП «Минская овощная фабрика» (с
применением предложенной методики
(пропорциональное распределение до-
хода))
-5,2 7,9 8,5 9,2 12,4 14,1
Разность 21 18,3 3,1 2,9 -1,3 -1,8
КСУП «Минская овощная фабрика» (с
применением предложенной методики
(распределение дохода методом неоп-
ределенных множителей Лагранжа))
7,3 8,5 9,2 9,9 13,3 15,2
Разность 33,5 18,9 3,8 3,6 -0,4 -0,7
ОАО «Борисовский завод медицинских
препаратов» (без применением предло-
женной методики)
129 1
30 152 164 201 212

Modern Economy Success 2016, №1
103
Продолжение таблицы 7:
ОАО «Борисовский завод медицинских
препаратов» (с применением предло-
женной методики (пропорциональное
распределение дохода))
146 169 183,6 198,8 266,2 304
Разность 17 39 31,6 34,8 65,2 92
ОАО «Борисовский завод медицинских
препаратов» (с применением предло-
женной методики (распределение дохо-
да методом неопределенных множите-
лей Лагранжа))
145 167,
8 182,3 197,5 264,3 301,8
Разность 16 37,8 30,3 33,5 63,3 89,8
Общий эффект (пропорциональное
распределение дохода) 50,3 67,6 42,1 42,2 71,5 97,5
371,2
Общий эффект (распределение дохода
методом неопределенных множителей
Лагранжа)
62,2 67,4 41,9 42 71,2 97,2
381,8
Данная модель позволяет повысить эффек-
тивность распределения инвестиций между
участниками кластера, что выражается в по-
лучении синергетического эффекта.
Разработанные методы распределения ре-
сурсов агрофармацевтического кластера по-
зволяют повысить объем прибыли в результате
деятельности его участников.
Отметим, что наибольший эффект получен
ОАО «Борисовский завод медицинских пре-
паратов» на шестом году реализации проекта
в размере 92 млрд руб. Общий суммарный
эффект по всем участникам составит 371,2
млрд руб.
Выводы. Таким образом, проведенное
исследования показало актуальность
использования метода имитационного
моделирования, критерий оптимальности в
данном случае был определен как чистая
прибыль. В ходе расчетов получены
оптимальные объемы производства ЛРС, а
также его распределения по направлению
переработки и реализации. Кроме того,
созданием фармацевтического кластера
решаются задачи не только повышения
стабильности отдельных предприятий в
целом по республике, но также снижения
зависимости от импорта и завоевания
прочных позиций на международном рынке.
Разработанная методика обеспечивает
возможность расчета параметров экономико-
математической модели агрофармацевтиче-
ского кластера на рынке ЛРС Республики Бе-
ларусь. Кроме того, данная методика, осно-
Modern Economy Success 2016, №1
104
вывающаяся на использовании имитационно-
го моделирования с высокой степенью точно-
сти воспроизводящая функционирование
объекта наблюдения, позволяет получить
прогнозные значения оценки синергетическо-
го эффекта в интеграционных сделках.
Литература
1. Асанкулова Л., Жусупбаев А. Математическая модель оптимизации производства и ввоза
сельхозпродукции // Успехи современной пауки. 2016. Т. 3. №5. С. 121 – 123.
2. Бондаренко Ю.В. Математический подход к формированию эффективной государственной
поддержки предприятий сельского хозяйства региона / Ю.В. Бондаренко, Т.В. Азарнова, И.Л. Ка-
ширина и др. // Успехи современной пауки. 2016. Том 2. №4. С. 32 – 39.
3. Быковская Е.В, Скобеева А.О. Концепция цифровых технологий для развития открытых ин-
новаций в фармацевтической индустрии // Успехи современной пауки и образования. 2016. Т. 3.
№5. С. 21 – 25.
4. Ермакова А.А. Теоретико-методологические основы экономико-математического моделиро-
вания // Успехи современной пауки и образования. 2016. Т. 2. №8. С. 85 – 88.
5. Дорошкевич Е.И., Суленко Д.М., Дорошкевич И.Н. Влияние уровня минерального питания
на рост, развитие и продуктивность календулы лекарственной в условиях Беларуси. В сборнике:
Ботанические исследования на Урале Пермский государственный университет; Пермское отделе-
ние Русского ботанического общества. 2009. С. 103 – 104.
6. Карачевская Е.В. Методика формирования оптимального ассортимента производственной
программы предприятия, производящего лекарственное растительное сырье // Содружество наук.
Барановичи – 2011: материалы VII Междунар. науч.-практ. конф. молодых исследователей, Бара-
новичи, 19-20 мая 2011 г. В 2 ч. Баранович. гос. ун-т; редкол.: А.В. Никишова (гл. ред.) [и др.]. Ба-
рановичи, 2011. Ч. 1. С. 33 – 34.
7. Карачевская Е.В., Ленькова Р.К. Определение размеров инновационной прибыли в сельско-
хозяйственных предприятиях // Современные проблемы экономики, менеджмента и маркетинга:
материалы XVI Междунар. науч.-практ. конф., Нижний Тагил, 4-5 июня 2010 г. Урал. гос. технич.
ун-т – УПИ им. Б.Н. Ельцина, Нижнетагил. технол. ин-т (фил.); редкол.: М.М. Щербинин и др.
Нижний Тагил, 2010. С. 100 – 102.
8. Карачевская Е.В. Формирование прибыли на сельскохозяйственных предприятиях, произво-
дящих лекарственное растительное сырье // Проблемы экономики: сб. науч. тр. Белорус. гос. с.-х.
акад.; гл. ред.: А.М. Каган. Минск, 2010. Вып. 2 (11). С. 47 – 54.

Modern Economy Success 2016, №1
105
9. Коршевер Н.Г., Сиделышков С.А., Михневич А.В. Защита населения от техногенных аварий,
экстремальных явлений природы и оценка охраны здоровья населения // Успехи современной пау-
ки и образования. 2016. Т. 5. №7. С. 20 – 21.
10. Ленькова Р.К., Карачевская Е.В. Современные экономические условия производства лекар-
ственного растительного сырья // Проблемы экономики: сб. науч. тр. Белорус. гос. с.-х. акад.; гл.
ред.: А.М. Каган. Минск, 2013. 1 (16). С. 101 – 109.
11. Просалова В.С. Влияние этапов жизненного цикла инновационного кластера на его страте-
гическое управление // Успехи современной пауки. 2016. Т. 3. №7. С. 83 – 85.
12. Рзаева У.И. Современное состояние и основные направления формирования инновационно-
го сельскохозяйственного производства в Азербайджанской республике // Успехи современной
пауки. 2016. Т. 4. №6. С. 114 – 118.
13. Рогачев А.Ф., Токарев К.Е. Применение методов многокритериальной экспертной оценки
для управления качеством оказания медицинских услуг // Управление экономическими система-
ми: электронный научный журнал. 2011. №31. С. 25.
14. Рогачев А.Ф., Шубнов М.Г. Оценка прогнозного уровня урожайности сельскохозяйствен-
ных культур на основе нейросетевых моделей динамики // Известия Нижневолжского агроунивер-
ситетского комплекса: Наука и высшее профессиональное образование. 2012. №4. С. 226 – 231.
15. Толстопятенко М.А. Инновационное развитие фармацевтической промышленности на осно-
ве формирования фарма-медицинских кластеров: автореф. дис. ... канд. экон. наук: 08.00.05. Гос.
ун-т упр. М., 2009. 21 c.
16. Трофименко А.Е. Изучение локального рынка фармацевтических услуг в стоматологии: ав-
тореф. дис. ... канд. фарм. наук: 15.00.01. Пятигорск. гос. фарм. акад. Пятигорск, 2006. 24 с.
17. Шкляров А.П. Состояние и перспективы организации лекарственного растениеводства в Бе-
ларуси // Научный поиск и инновационные преобразования в агропромышленном комплексе / М-
во сельск. хоз-ва и продовольствия Респ. Беларусь, Белорус. гос. аграр. техн. ун-т, факультет
предпринимательства и управления. Минск: БГАТУ, 2009. 233 с.
18. Bergman E.M., Charles D. Innovative Clusters: Drivers of National Innovation Systems // Organi-
zation for Economic Cooperation and Development. Paris: Routledge, 2013. 256 р.
19. Investing in Japan // Japan External Trade Organization [Электронный ресурс].2012. Режим
доступа: www.jetro.go.jp/en/invest (дата доступа: 12.08.2012)
20. Кarachevskaya E., Lenkova R. Математическая модель управления финансовыми результата-
ми деятельности предприятий, производящих лекарственное растительное сырье // Устойчивое ло-
кальное развитие. Условия регионального и локального развития = Zrownowazony rozwoj lokalny.
Modern Economy Success 2016, №1
106
Warunki rozwoju regionalnego i lokalnego / red. nauk. prof. Dr hab. Antoni Mickiewicz. – Szczecin:
Wydawnictwo Stowarzyszenie Naukove – Instytut Gospodarki i Rynku, 2010. T. IV. С. 225 – 228.
21. Кarachevskaya E., Lenkova R. Основы кластеризации как феномена повышения инновацион-
но-инвестиционной активности экономии // Annals of Economics Research Foundation European In-
stitute of Sustainable Development. Szczecin, 2013. С. 139 – 142.
22. Lenkova R., Кarachevskaya Е. Методический подход к выбору показателей оценки эффек-
тивности деятельности предприятий, производящих лекарственное растительное сырье // Устойчи-
вое локальное развитие. Условия регионального и локального развития = Zrownowazony rozwoj lokal-
ny. Warunki rozwoju regionalnego i lokalnego / red. nauk. prof. Dr hab. Antoni Mickiewicz. Szczecin:
Wydawnictwo Stowarzyszenie Naukove – Instytut Gospodarki i Rynku, 2010. T. IV. С. 329 – 331.
23. Lenkova R., Кarachevskaya Е. Формирование института финансирования на предприятиях, про-
изводящих лекарственное растительное сырье // Устойчивое развитие на локальном уровне – исследо-
вания, опыт и практика = Zrownowazony rozwoj lokalny – badania, doswiadczenia i praktyka / red. nauk.
prof. Dr hab. Antoni Mickiewicz. Szczecin: Wydawnictwo Stowarzyszenie Naukove – Instytut Gospodarki i
Rynku, 2011. T. II. P. 87 – 89.
24. Murad, S. MOC Team Project Report / S. Murad, T. Hrekh, K. Pesotsky // The Moscow Transportation
Cluster: Harvard Business School. Boston, 2006.
25. Porter, Michael E. The Competitive Advantage of Nations / Michael E. Porter. US: Free Press,
1998. 295 p.
26. Rogachev A. Economic and Mathematical Modeling of Food Security Level in View of Import Substi-
tution / Asian Social Science 2015. V. 11. N20. P. 178 – 184.
27. Rogachev A., Mazaeva T., Egorova E. Economic mechanisms for managing food security in the
system “production-consumption-import” // Asian Social Science. 2015. Т. 11. №20. P. 185 – 192.
28. Rogachev A.F., Shokhnekh A.V., Mazaeva T.I. Manufacturing and Consumption of Agricultural
Products as a Tool of Food Security Management in Russia // Revista Galega de Economia. V. 25-2. July-
December 2016.
29. Skiter N., Rogachev A.F., Mazaeva T.I. Modeling ecological security of a state // Mediterranean
Journal of Social Sciences. 2015. Т. 6. №36. P. 185 – 192.
References
1. Asankulova L., Zhusupbaev A. Matematicheskaja model' optimizacii proizvodstva i vvoza sel'hoz-
produkcii // Uspehi sovremennoj pauki. 2016. T. 3. №5. S. 121 – 123.

Modern Economy Success 2016, №1
107
2. Bondarenko Ju.V. Matematicheskij podhod k formirovaniju jeffektivnoj gosudarstvennoj pod-
derzhki predprijatij sel'skogo hozjajstva regiona / Ju.V. Bondarenko, T.V. Azarnova, I.L. Ka-shirina i dr.
// Uspehi sovremennoj pauki. 2016. Tom 2. №4. S. 32 – 39.
3. Bykovskaja E.V, Skobeeva A.O. Koncepcija cifrovyh tehnologij dlja razvitija otkrytyh in-novacij v
farmacevticheskoj industrii // Uspehi sovremennoj pauki i obrazovanija. 2016. T. 3. №5. S. 21 – 25.
4. Ermakova A.A. Teoretiko-metodologicheskie osnovy jekonomiko-matematicheskogo modeliro-
vanija // Uspehi sovremennoj pauki i obrazovanija. 2016. T. 2. №8. S. 85 – 88.
5. Doroshkevich E.I., Sulenko D.M., Doroshkevich I.N. Vlijanie urovnja mineral'nogo pitanija na rost,
razvitie i produktivnost' kalenduly lekarstvennoj v uslovijah Belarusi. V sbornike: Botanicheskie issledo-
vanija na Urale Permskij gosudarstvennyj universitet; Permskoe otdele-nie Russkogo botanicheskogo
obshhestva. 2009. S. 103 – 104.
6. Karachevskaja E.V. Metodika formirovanija optimal'nogo assortimenta proizvodstvennoj program-
my predprijatija, proizvodjashhego lekarstvennoe rastitel'noe syr'e // Sodruzhestvo nauk. Baranovichi –
2011: materialy VII Mezhdunar. nauch.-prakt. konf. molodyh issledovatelej, Bara-novichi, 19-20 maja
2011 g. V 2 ch. Baranovich. gos. un-t; redkol.: A.V. Nikishova (gl. red.) [i dr.]. Ba-ranovichi, 2011. Ch.
1. S. 33 – 34.
7. Karachevskaja E.V., Len'kova R.K. Opredelenie razmerov innovacionnoj pribyli v sel'sko-
hozjajstvennyh predprijatijah // Sovremennye problemy jekonomiki, menedzhmenta i marketinga: mate-
rialy XVI Mezhdunar. nauch.-prakt. konf., Nizhnij Tagil, 4-5 ijunja 2010 g. Ural. gos. tehnich. un-t – UPI
im. B.N. El'cina, Nizhnetagil. tehnol. in-t (fil.); redkol.: M.M. Shherbinin i dr. Nizhnij Tagil, 2010. S. 100
– 102.
8. Karachevskaja E.V. Formirovanie pribyli na sel'skohozjajstvennyh predprijatijah, proizvo-djashhih
lekarstvennoe rastitel'noe syr'e // Problemy jekonomiki: sb. nauch. tr. Belorus. gos. s.-h. akad.; gl. red.:
A.M. Kagan. Minsk, 2010. Vyp. 2 (11). S. 47 – 54.
9. Korshever N.G., Sidelyshkov S.A., Mihnevich A.V. Zashhita naselenija ot tehnogennyh avarij, jek-
stremal'nyh javlenij prirody i ocenka ohrany zdorov'ja naselenija // Uspehi sovremennoj pauki i obrazo-
vanija. 2016. T. 5. №7. S. 20 – 21.
10. Len'kova R.K., Karachevskaja E.V. Sovremennye jekonomicheskie uslovija proizvodstva lekar-
stvennogo rastitel'nogo syr'ja // Problemy jekonomiki: sb. nauch. tr. Belorus. gos. s.-h. akad.; gl. red.:
A.M. Kagan. Minsk, 2013. 1 (16). S. 101 – 109.
11. Prosalova V.S. Vlijanie jetapov zhiznennogo cikla innovacionnogo klastera na ego strate-
gicheskoe upravlenie // Uspehi sovremennoj pauki. 2016. T. 3. №7. S. 83 – 85.

Modern Economy Success 2016, №1
108
12. Rzaeva U.I. Sovremennoe sostojanie i osnovnye napravlenija formirovanija innovacionnogo
sel'skohozjajstvennogo proizvodstva v Azerbajdzhanskoj respublike // Uspehi sovremennoj pauki. 2016.
T. 4. №6. S. 114 – 118.
13. Rogachev A.F., Tokarev K.E. Primenenie metodov mnogokriterial'noj jekspertnoj ocenki dlja
upravlenija kachestvom okazanija medicinskih uslug // Upravlenie jekonomicheskimi sistema-mi: jelek-
tronnyj nauchnyj zhurnal. 2011. №31. S. 25.
14. Rogachev A.F., Shubnov M.G. Ocenka prognoznogo urovnja urozhajnosti sel'skohozjajstven-nyh
kul'tur na osnove nejrosetevyh modelej dinamiki // Izvestija Nizhnevolzhskogo agrouniversitetskogo
kompleksa: Nauka i vysshee professional'noe obrazovanie. 2012. №4. S. 226 – 231.
15. Tolstopjatenko M.A. Innovacionnoe razvitie farmacevticheskoj promyshlennosti na osnove formi-
rovanija farma-medicinskih klasterov: avtoref. dis. ... kand. jekon. nauk: 08.00.05. Gos. un-t upr. M.,
2009. 21 c.
16. Trofimenko A.E. Izuchenie lokal'nogo rynka farmacevticheskih uslug v stomatologii: av-toref. dis.
... kand. farm. nauk: 15.00.01. Pjatigorsk. gos. farm. akad. Pjatigorsk, 2006. 24 s.
17. Shkljarov A.P. Sostojanie i perspektivy organizacii lekarstvennogo rastenievodstva v Belarusi //
Nauchnyj poisk i innovacionnye preobrazovanija v agropromyshlennom komplekse / M-vo sel'sk. hoz-va
i prodovol'stvija Resp. Belarus', Belorus. gos. agrar. tehn. un-t, fakul'tet predprinimatel'stva i upravlenija.
Minsk: BGATU, 2009. 233 s.
18. Bergman E.M., Charles D. Innovative Clusters: Drivers of National Innovation Systems // Organi-
zation for Economic Cooperation and Development. Paris: Routledge, 2013. 256 r.
19. Investing in Japan // Japan External Trade Organization [Jelektronnyj resurs].2012. Rezhim dostu-
pa: www.jetro.go.jp/en/invest (data dostupa: 12.08.2012)
20. Karachevskaya E., Lenkova R. Matematicheskaja model' upravlenija finansovymi rezul'tata-mi de-
jatel'nosti predprijatij, proizvodjashhih lekarstvennoe rastitel'noe syr'e // Ustojchivoe lokal'noe razvitie.
Uslovija regional'nogo i lokal'nogo razvitija = Zrownowazony rozwoj lokalny. Warunki rozwoju regio-
nalnego i lokalnego / red. nauk. prof. Dr hab. Antoni Mickiewicz. – Szczecin: Wydawnictwo Stowarzys-
zenie Naukove – Instytut Gospodarki i Rynku, 2010. T. IV. S. 225 – 228.
21. Karachevskaya E., Lenkova R. Osnovy klasterizacii kak fenomena povyshenija innovacion-no-
investicionnoj aktivnosti jekonomii // Annals of Economics Research Foundation European In-stitute of
Sustainable Development. Szczecin, 2013. S. 139 – 142.
22. Lenkova R., Karachevskaya E. Metodicheskij podhod k vyboru pokazatelej ocenki jeffek-tivnosti
dejatel'nosti predprijatij, proizvodjashhih lekarstvennoe rastitel'noe syr'e // Ustojchivoe lokal'noe razvitie.
Uslovija regional'nogo i lokal'nogo razvitija = Zrownowazony rozwoj lokalny. Warunki rozwoju regio-

Modern Economy Success 2016, №1
109
nalnego i lokalnego / red. nauk. prof. Dr hab. Antoni Mickiewicz. Szczecin: Wydawnictwo Stowarzysze-
nie Naukove – Instytut Gospodarki i Rynku, 2010. T. IV. S. 329 – 331.
23. Lenkova R., Karachevskaya E. Formirovanie instituta finansirovanija na predprijatijah,
proizvodjashhih lekarstvennoe rastitel'noe syr'e // Ustojchivoe razvitie na lokal'nom urovne –
issledovanija, opyt i praktika = Zrownowazony rozwoj lokalny – badania, doswiadczenia i praktyka / red.
nauk. prof. Dr hab. Antoni Mickiewicz. Szczecin: Wydawnictwo Stowarzyszenie Naukove – Instytut
Gospodarki i Rynku, 2011. T. II. S. 87 – 89.
24. Murad, S. MOC Team Project Report / S. Murad, T. Hrekh, K. Pesotsky // The Moscow Transpor-
tation Cluster: Harvard Business School. Boston, 2006.
25. Porter, Michael E. The Competitive Advantage of Nations / Michael E. Porter. US: Free Press,
1998. 295 p.
26. Rogachev A. Economic and Mathematical Modeling of Food Security Level in View of Import
Substitution / Asian Social Science 2015. V. 11. N20. P. 178 – 184.
27. Rogachev A., Mazaeva T., Egorova E. Economic mechanisms for managing food security in the
system “production-consumption-import” // Asian Social Science. 2015. T. 11. №20. S. 185 – 192.
28. Rogachev A.F., Shokhnekh A.V., Mazaeva T.I. Manufacturing and Consumption of Agricultural
Products as a Tool of Food Security Management in Russia // Revista Galega de Economia. V. 25-2. July-
December 2016.
29. Skiter N., Rogachev A.F., Mazaeva T.I. Modeling ecological security of a state // Mediterranean
Journal of Social Sciences. 2015. T. 6. №36. S. 185 – 192.
Karachevskaiy E.V.
Candidate of Economic Sciences (Ph.D.), The Education Establishment «Belarusian State Agricultur-
al Academy», Gorki, Belarus.
Rogachev A.F.
Doctor of Engineering Sciences (Advanced Doctor), Volgograd State Agrarian University, Volgograd,
Russia.
MODELING AND ESTIMATION OF ECONOMIC EFFICIENCY OF FUNCTIONING OF AN
AGROPHARMACEUTICAL CLUSTER OF REPUBLIC OF BELARUS
Abstract: in the article theoretical principles of construction of production and processing clusters and
the framework for the assessment and modeling their effectiveness. Developed assessment of economic
efficiency of functioning, for example agropharmaceuticals cluster of the Republic of Belarus, including

Modern Economy Success 2016, №1
110
agricultural enterprises producing medicinal raw materials and processing enterprises. Market of medi-
cinal plants, which is a drug plant sometimes used in dried form as medicinal products or to obtain medi-
cines, is quite specific. The calculation of net profit and distribution of a synergistic effect based on the
proposed economic-mathematical optimization model, allowing different group parameters manufacturers
of medicinal raw materials and pharmaceutical products. A structural-logical model of functioning of new
forms of relationship between the parties market of medicinal plants, which enables the total financial re-
sults take into account the contribution of each entity of a cluster in the results of joint activities, and cal-
culate the additional income of each participant. In the calculation obtained the optimal volume of pro-
duction of medicinal plants and its distribution along the direction processing and marketing. The creation
of a pharmaceutical cluster tasks not only enhance the stability of individual enterprises as a whole, but
also to reduce the dependence of Belarus Republic on imports and conquest of a strong position in the
international market. Developed the method ensures the possibility of calculating the parameters of eco-
nomic-mathematical model agropharmaceuticals cluster in the market of medicinal plants. The proposed
method based on the use of simulation, reproducing the functioning of the object of observation, allows to
obtain the forecast values of the evaluation of a synergistic effect in the integration transactions.
Keywords: efficiency of functioning, agro pharmaceutical cluster, economic-mathematical modeling,
optimization, a synergistic effect