Embed Size (px)
Citation preview

Modelling the spread and growth of Caulerpa taxifolia inclosed waterways in southern Australia using cellular
automataL. McArthur, a J. Dunn and S. Schreider
aSchool of Mathematical and Geospatial Sciences, RMIT University, GPO BOX 2476, Melbourne, 3000Email: [email protected]
Abstract: This study presents the mathematical development of a cellular automata model for the speciesCaulerpa taxifolia for closed or intermittently closed waterways along the Australian coast. The model is usedto assess the spatial coverage of C. taxifolia by describing changes in growth, spread and total biomass forthe species. Building upon a foundation model developed by the authors, this study was designed to enhancethe predictive capabilities of a model based upon a discrete version of Laplace’s equation. The improvementsrelate to several components integrated into the Laplacian coefficients; a periodic function which represents theseasonal variations in growth, the incorporation of the prevailing wind to represent the most likely directionof spread, and growth restrictions based on lake depth. The additional complexity improved the predictivecapability of the model.
Cellular Automata (CA) have been used to model changing plant distributions over the last 20 years, providingefficient models for complex environmental systems, particularly of exotic species. In this project the discreteCA algorithm is designed to determine the state or biomass B = {−1, 0, 1, 2} of the current cell using theprimary rule of the discrete Laplacian system. Biomass of−1 refers to land, and the other values represent therelative quantity of the weed in the cell; none, sparse or dense respectively. Cell interactions are governed bythe coefficients of the Laplacian system which is discussed.
The foundation model incorporated simple rules, not unlike those of John Conway’s Game of Life. Thebiomass of the surrounding cells at time t determines the state of the central cell at time t+ 1. The boundaryconditions were catered for by allocating a biomass of negative one to the land cells adjacent to the water.
The results indicate that the model is able to predict the total surface coverage and total biomass at levels ofaccuracy commensurate with the input data, which is important for control measures. Also, high accuracy inthe predicted locational data at Lake Conjola indicates that the model is able to identify appropriate growingconditions to aid in the eradication efforts. At successive time steps, the model produces accurate patchlocation data with a slight overestimation on patch size due to slight error prediction of the decay in the initialwinter season.
The principle objective of this new study is to improve the predictive capabilities of the model developed bythe authors, by taking into account the biological and environmental factors of growth and spread and in doingso, more accurately predict the spatial coverage and colonization locations of C. taxifolia growth and spread ina closed or intermittently closed estuary. This model is designed to inform resource managers and governmentbodies of the most effective methods of eradication.
Keywords: Caulerpa taxifolia, cellular automata, biomass dynamics, Laplacian system
20th International Congress on Modelling and Simulation, Adelaide, Australia, 1–6 December 2013 www.mssanz.org.au/modsim2013
427
McArthur et al., Modelling the spread and growth of Caulerpa taxifolia ...
1 INTRODUCTION
Non-indigenous, invasive, aquatic weeds significantly alter the ecosystems they colonize. This has been ob-served where the marine, green algae Caulerpa taxifolia, ((Vahl) C. Agardh) has been identified in many areasof the world including Europe, America and Australia (Meinesz, 1996; Withgott, 2002; Glasby et al., 2005).Fourteen waterways throughout New South Wales have infestations of C. taxifolia, typically located in thecoastal estuaries (Creese et al., 2004). In New South Wales, C. taxifolia is classified as a Class 1 noxiousspecies under the Fisheries Management Act, 1994 and as a marine “pest” in southern Australian waterways.
Two models of C. taxifolia have previously been developed: The first by Hill et al. (1998) who successfullymodelled dispersal for the Mediterranean Sea invasion site using a coupled geographical information system- stochastic discrete event simulation model for large, open geographical areas with strong water currents.Secondly, the density-dependant rate of increase of C. taxifolia has also been modelled where a specific fo-cus was placed on total biomass, in order to evaluate the success of various control management programs(Ruesink and Collado-Vides, 2006). In contrast, the current study focuses on small-scaled, closed or inter-mittently closed estuaries in shallow waterways and centers around predicting the likely spatial coverage andcolonization locations of C. taxifolia.
Previous work by the authors produced a two-dimensional cellular automata model, based on the discreteLaplace equation, for Lake Conjola in NSW, Australia. This model was not designed to accurately predict C.taxifolia growth and spread; more to identify the most important drivers of the spread and growth patterns.The following factors were identified as the key indicators that were required for model improvement:
- Seasonal biomass fluctuations, in particular the depletion of biomass during winter, (Komatsu and Meinesz,1997), and reduced probability of substrate attachment (Ruesink and Collado-Vides, 2006);
- Fragment recruitment from neighbouring cells due to currents (wind) (Wright and Davis, 2006);
- The incorporation of seagrass data to indicate improved likelihood of growth due to high nutrient levels andimproved substrate structure for new colonisation (Wright and Davis, 2006);
- Depth limitations on growth: No growth has been observed at depths exceeding 10 metres at Lake Conjola;
- Anthropogenic influences on distribution: i.e. transference by boat or anchor (West et al., 2007).
This paper describes the more recent model which was developed to incorporate some of these factors. Inparticular, items 1 - 4 listed above. Item 5, the anthropogenic interference, has not been included due to lackof reliable data.
1.1 Description of C. taxifolia
Caulerpa taxifolia is a marine green seaweed (alga) that is endemic to tropical and sub-tropical regions aroundthe world. In Australia, native populations of C. taxifolia are found in the Northern Territory, Queensland,Western Australia and on Lord Howe Island (Phillips and Price, 2002).
Outbreaks of an invasive strain of C. taxifolia were discovered in the cool waters around Monaco in 1984 andsince that time the seaweed has spread rapidly throughout the Mediterranean. By the end of 2000, C. taxifoliawas estimated to cover approximately 131km2 of seafloor in the Mediterranean (Jaubert et al., 2003). Theinvasive strain in the Mediterranean was dubbed the ‘aquarium strain’ because it was derived from a straincultivated for decoration in aquaria.
It is believed that C. taxifolia does not reproduce sexually, but rather spreads by growth and fragmentation -the species is capable of regenerating from a small fragment of any part of the plant (Wright, 2005). However,this is true only for the invasive strain - sexual reproduction has been observed in some native populations.
Its biomass increases both by natural growth and by the spread of fragments that break off and colonize newlocations. The transport of fragments is facilitated by currents, (in this study represented by wind), interactionwith fishers and boaters and through other marine species physically interacting with the alga.
1.2 Study Region
The study uses data from Lake Conjola, Figure 1a. The data was collected by marine botanists, using GPSsystems and personal observation. C. taxifolia in this waterway has been allowed to grow and spread withoutthe imposition of eradication procedures, and is thus an ideal source of data to develop the model. A secondestuary, the Narrawallee Inlet, is used to test the model’s adaptability to other waterways. Lake Conjola and the
428

McArthur et al., Modelling the spread and growth of Caulerpa taxifolia ...
a) b)
Figure 1. a) Map of study sites: Lake Conjola and the Narrawallee Inlet. b) Initial conditions in Lake Conjola(top) and the Narrawallee Inlet, March 2003.
Narrawallee Inlet are wave-dominated estuaries. The narrow entrances to the Pacific ocean of Lake Conjolaand the Narrawallee Inlet mean that the volume of water exchanged during each tide is small and in dryconditions the entrances are often closed with no water exchanged, and the primary circulation is governed bywind driven currents. The study uses the prevailing wind direction as a proxy for current, and thus controlsthe direction of spread of the fragments. Figure 1b indicates the extent of C. taxifolia invasion in both LakeConjola and Narrawallee Inlet for March 2003.
2 METHODS
2.1 Description of the Model
The model uses a square gridcell representation of the region where the biomass or ‘state’ of each cell iscontained in an m × n array. The biomass data are stored in a matrix of cells B where each cell Bx,y , x =1, 2, 3, . . ., m, y = 1, 2, 3, . . ., n, contains the recorded biomass at time t, Bx,y(t). Here the indices x and ycorrespond to the longitude and latitude coordinate pair (the grid is scaled so that δ(x, y) = 1). Each cell inmatrix B contains biomass Bx,y(t) at time t.
The discrete form, given by the finite difference scheme for the diffusion equation, can be formulated as:
[Bx,y(t+ 1)−Bx,y(t)]δt
=a(t)[Bx+δx,y(t)− 2Bx,y(t) +Bx−δx,y(t)]
δx2
+a(t)[Bx,y+δy(t)− 2Bx,y(t) +Bx,y−δy(t)]
δy2, (1)
where δx and δy are spatial increments and δt is the time step, in this study equivalent to 1 month (McArthuret al., 2006; Dunn et al., 2011).
The growth and spread was simulated using MATLAB, with the biomass in each cell being updated at eachtime step according to a set of rules. Equation (1) indicates that the biomass, B, at location (x, y) at time (t+1)is a linear combination of the biomass in that cell and the neighbouring cells at time t. Equation (1) can berearranged to formulate the equation describing the change in biomass at each time step:
Bx,y(t+ 1) = α(t)Bx,y(t) + βx,y[Bx+δx,y(t) +Bx−δx,y(t) (2)+Bx,y+δy(t) +Bx,y−δy(t)]
where α(t) is the growth function, which changes over time, and βx,y is the spread coefficient which changesover space; both of which can be expressed in terms of a(t), (Dunn et al., 2011).
The model described here also includes contribution from diagonal cells, which simply implies that the rule forthe Laplace operator works in linearly transformed coordinates based on the distance equivalence δt√
δx2+δy2
429
McArthur et al., Modelling the spread and growth of Caulerpa taxifolia ...
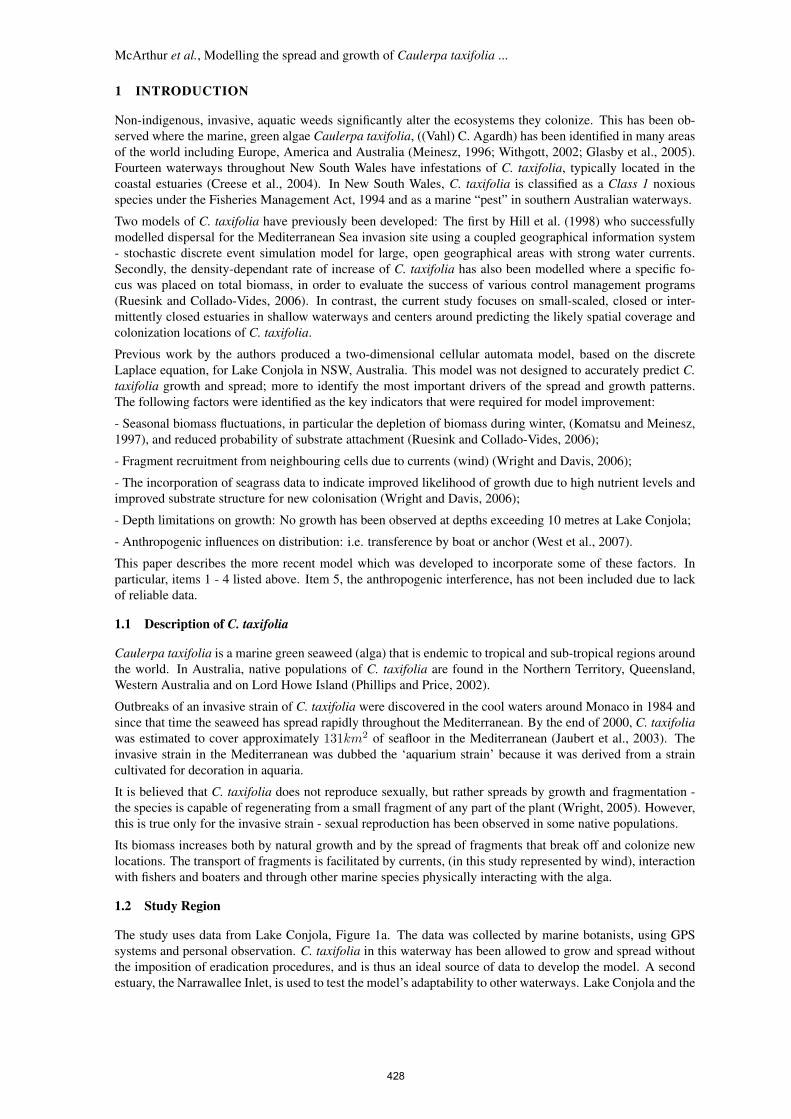
with δ(x, y, t) = 1:
Bx,y(t+ 1) = α(t)Bx,y(t) + βx,y[Bx+δx,y(t) +Bx−δx,y(t)
+Bx,y+δy(t) +Bx,y−δy(t) +1√2Bx−δx,y−δy(t) (3)
+1√2Bx−δx,y−δy(t) +
1√2Bx+δx,y+δy(t) +
1√2Bx+δx,y−δy(t)].
The boundary condition is of Neumann type with no biomass spread from water to land and no biomass lostto outside the estuary. This seems feasible given that growth and fragmentation occurs solely during timesof minimal to zero flow and when entrances are primarily closed. The growth is associated with diffusion,being the natural increase in biomass due to growth (and decrease due to decay) and spread is primarily relatedto new colonizations due to fragments of C. taxifolia breaking off and being transported either by humanintervention or currents driven by wind. These two processes are catered for differently in the algorithm andfor this reason, α(t) is expressed as time dependent, and βx,y spatially dependent.
2.2 Algorithm
Let the sum of the biomass in the neighbouring cells be given by:
Sx,y = Bx+δx,y(t) +Bx−δx,y(t)
+Bx,y+δy(t) +Bx,y−δy(t) +1√2Bx−δx,y−δy(t) (4)
+1√2Bx−δx,y−δy(t) +
1√2Bx+δx,y+δy(t) +
1√2Bx+δx,y−δy(t),
then the growth and spread equation can be formulated as
Bx,y(t+ 1) = α(t)Bx,y(t) + βx,ySx,y(t), (5)
which indicates that the biomass in cell Bx,y at time t + 1 is governed by natural growth or decay at the rategiven by α(t) and the spread from surrounding cells given the correct conditions described below, at the rateof βx,y .
According to a set of rules the biomass in each cell fluctuates between 0 and K = 2, the cell carrying capacity.The land cells, where B = −1 do not change, and are used in the algorithm to indicate the boundary. Fluctu-ations correspond to the growth rate, α(t), and the spread coefficient βx,y . The biomass in a given cell in thenext time-step is a function of the biomass currently in that cell, the biomass in the adjacent cells, the growthrate which is influenced by the presence or absence of seagrass, and the spread from adjacent cells, which isdriven by the wind.
Throughout simulation, the biomass data is converted from categorical data, Bx,y ∈ {−1, 0, 1, 2}, to continu-ous numerical data through application of the algorithm, and back to categorical data for output.
2.3 Growth
Two parameters, p and d are threshold values for equation (5) related to the sum of the biomass in the sur-rounding cells, S. Adjacency is defined by the degree of contact of the surrounding cells and includes all eightcells surrounding cell Bx,y . The time step, t, is month and model is initialized with t0 representing March,2003.
Growth occurs subject to Sx,y > p and decay occurs subject to Sx,y ≤ d. Given that plant growth is seasonallydependant we can describe α(t) by a cyclic function, given by equation (6) where g is the amplitude of growthand f(t) a time dependant sine function adjusted to coincide with t0 ⇒March 2003.
2.4 Seagrass
There is evidence to suggest that C. taxifolia frequently colonizes in seagrass habitats (Bell and Pollard, 1989),and in fact prefers those areas. For additional biomass in a given cell due to the presence of seagrass, theseagrass data for each waterway is stored in an n ×m matrix of cells Ox,y, where each cell takes on a state
430
McArthur et al., Modelling the spread and growth of Caulerpa taxifolia ...
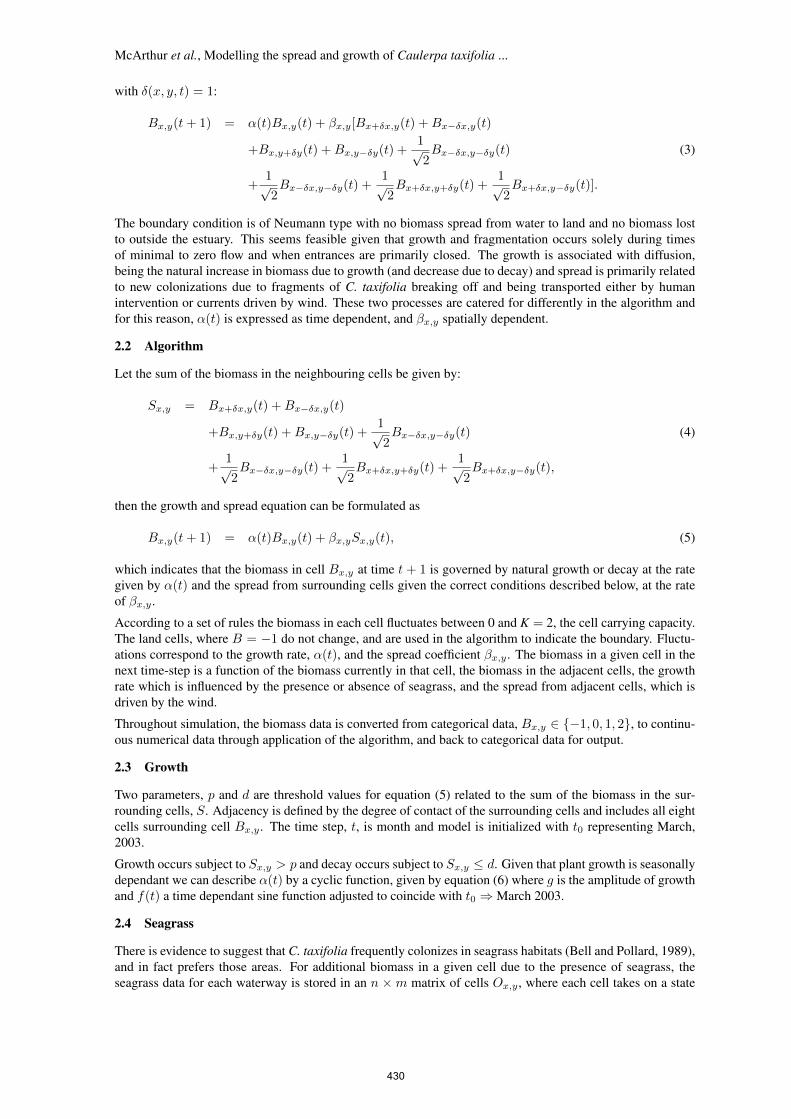
according to Ox,y = 0, 1. The values 0 and 1 represent no seagrass and seagrass presence respectively. If cellx, y contains seagrass, then the ‘favourable growth condition’ is applied. Combining these factors, the growthfunction can be defined as
α(t) = g ∗ z(t) + σOx,y, where z(t) = sin
((t+ 5)π
6
)+ 0.4, (6)
and σ is the weighting factor for the favourable growth condition, and g is the intrinsic growth rate.
2.5 Spread
Spread occurs when growth is positive, given that the surrounding cells have sufficient biomass, specified bythe threshold p. Spread of C. taxifolia is due to fragmentation colonization, and in this model is driven by thefrequency of the prevailing wind, since the dry conditions of the two estuaries during growth periods, α(t) > 0,suggest that the internal water circulation is driven primarily by wind (Wortmann, 1998). In the winter months,the biomass of C. taxifolia decreases, so there is no contribution from fragmentation nor growth.
Plant spread within estuaries is not uniform, so βx,y is defined as an array of coefficients governing the non-uniform dispersal of the plant to surrounding cells, based upon the relative frequency of wind direction. Wrightand Davis (2006) observed that fragments of C. taxifolia do not disperse far from the originating cell due tonegative buoyancy, so only fragmentation to immediate neighbours is included in the model. Thus, the finalmodel, for k, l ∈ {−1, 0, 1} is given by
Bx,y(t+ 1) = α(t)Bx,y(t) + βx+1,yBx+1,y(t) + βx−1,yBx−1,y(t) (7)+βx,y+1Bx,y+1(t) + βx,y−1Bx,y−1(t)
+1√2βx−1,y+1Bx−1,y+1(t) +
1√2βx−1,y−1Bx−1,y−1(t) (8)
+1√2βx+1,y+1Bx+1,y+1(t) +
1√2βx+1,y−1Bx+1,y−1(t),
where β = β if α(t) > 0
= 0 if α(t) < 0.
3 RESULTS
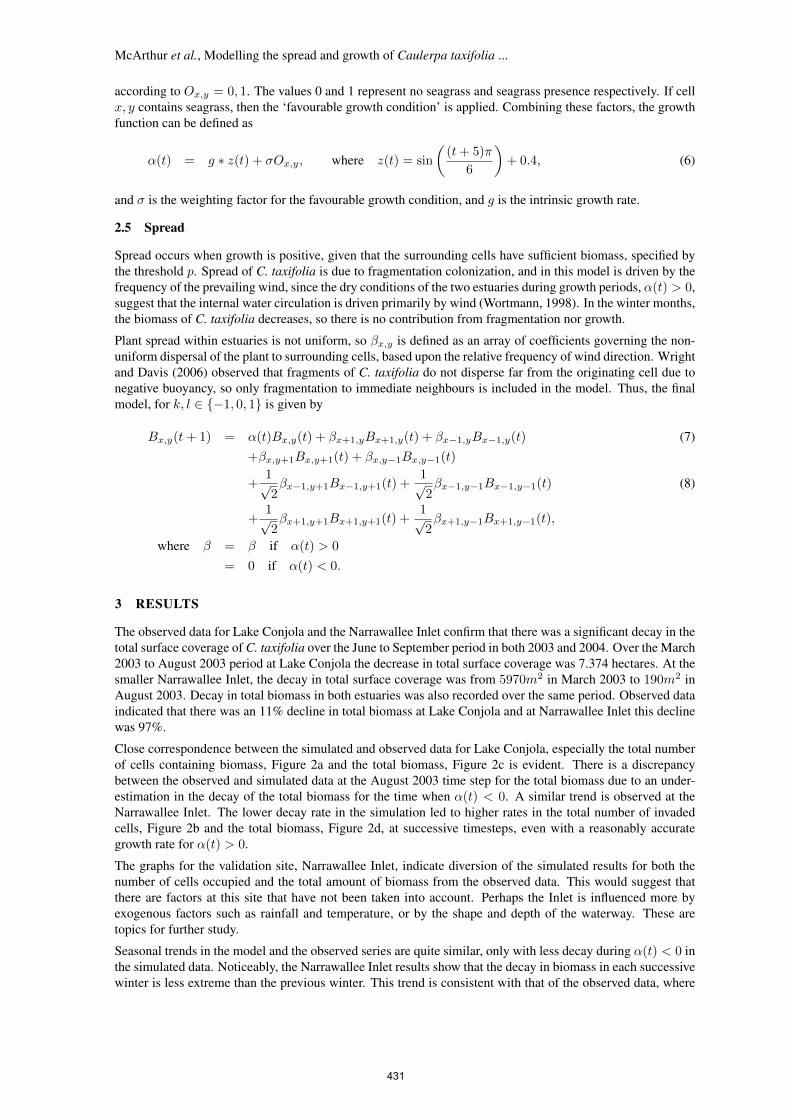
The observed data for Lake Conjola and the Narrawallee Inlet confirm that there was a significant decay in thetotal surface coverage of C. taxifolia over the June to September period in both 2003 and 2004. Over the March2003 to August 2003 period at Lake Conjola the decrease in total surface coverage was 7.374 hectares. At thesmaller Narrawallee Inlet, the decay in total surface coverage was from 5970m2 in March 2003 to 190m2 inAugust 2003. Decay in total biomass in both estuaries was also recorded over the same period. Observed dataindicated that there was an 11% decline in total biomass at Lake Conjola and at Narrawallee Inlet this declinewas 97%.
Close correspondence between the simulated and observed data for Lake Conjola, especially the total numberof cells containing biomass, Figure 2a and the total biomass, Figure 2c is evident. There is a discrepancybetween the observed and simulated data at the August 2003 time step for the total biomass due to an under-estimation in the decay of the total biomass for the time when α(t) < 0. A similar trend is observed at theNarrawallee Inlet. The lower decay rate in the simulation led to higher rates in the total number of invadedcells, Figure 2b and the total biomass, Figure 2d, at successive timesteps, even with a reasonably accurategrowth rate for α(t) > 0.
The graphs for the validation site, Narrawallee Inlet, indicate diversion of the simulated results for both thenumber of cells occupied and the total amount of biomass from the observed data. This would suggest thatthere are factors at this site that have not been taken into account. Perhaps the Inlet is influenced more byexogenous factors such as rainfall and temperature, or by the shape and depth of the waterway. These aretopics for further study.
Seasonal trends in the model and the observed series are quite similar, only with less decay during α(t) < 0 inthe simulated data. Noticeably, the Narrawallee Inlet results show that the decay in biomass in each successivewinter is less extreme than the previous winter. This trend is consistent with that of the observed data, where
431

McArthur et al., Modelling the spread and growth of Caulerpa taxifolia ...
Figure 2. a. Comparison of the total number of cells containing biomass at Lake Conjola over a 12 monthperiod from March 2003 to March 2004. b. Comparison of the total number of cells containing biomass at theNarrawallee Inlet over a 25 month period from March 2003 to April 2005. c. Comparison of the total biomassat Lake Conjola over a 12 month period from March 2003 to March 2004. d. Comparison of the total biomassat the Narrawallee Inlet over a 25 month period from March 2003 to April 2005.
the decrease in decay rates can be attributed to the increase in the density of biomass in each cell and sparseareas of growth (the areas that completely decay over the winter period) are rare. This again indicates that themodelled behaviour of C. taxifolia compares well with the observed behaviour.
The comparison of the location of C. taxifolia for March 2004 at Lake Conjola yields close association betweenthe biomass matrices. There is a slight overestimation of biomass in patches near the edge of the waterway andsignificant variation in the north-east of the waterway. This variation can be attributed to the assigned growthlimitation in the model. Limitations in this case lead to loss of detail in the shallow areas of the waterwayparticularly evident in the north-east corner. The other area of noticeable deviation is the central region inthe North-East when a depletion of growth has formed in the observed data set. Speculation regarding thisphenomenon includes deepening of the area from flooding or formation of islands due to drought, with thesecond more likely.
4 CONCLUSION
The increased complexity of the model by the introduction of the biological and geographical properties hasresulted in the model taking on a sense of realism. The results indicate that the model describes the growthand spread of C. taxifolia in Lake Conjola very well according to the simple metrics developed. Simulation ofC. taxifolia in the Narrawallee Inlet gives a good indication of spread compared with observed data indicatingthe models adaptability to different waterways. The application of the model to the significantly smallerNarrawallee Inlet indicates that even though there are variations in later time steps the model clearly identifiessuitable growth locations.
Discrepancy between actual and predicted biomass for this waterway is suspected to be attributed to the fluctu-ating flow rates in this particularly shallow waterway which results in exposure of the estuary bed on frequentoccasions. Further improvements in the model would include depth data, which would provide addition ofgrowth in each cell as a function of the depth and the water current rather than limiting spread to occur withina distance of the edge of the waterway which is used as a proxy for depth. Additionally, nutrient propertiesneed to be explored for their effect on the growth and decay of C. taxifolia.
There are potential problems with accuracy due to the optimisation and interpretation of parameters. In par-ticular, the increase in growth due to seagrass presence represented by α, and the limitation on the carrying
432
McArthur et al., Modelling the spread and growth of Caulerpa taxifolia ...
capacity K. The foundation model provided a means of identifying the most significant biological and envi-ronmental factors that were necessary for improving the model’s predictability, while ensuring that the modelremained parsimonious and not overly complex. The seasonal fluctuations and spread by fragmentation, pro-duced significant improvement in modelling results and hence in the predictive capabilities of the model.
REFERENCES
Bell, J. D. and D. A. Pollard (1989). Ecology of fish assemblages and fisheries associated with seagrasses.In A. Larkum, A. McComb, and S. Shepherd (Eds.), Biology of seagrasses: A treatise on the biology ofseagrasses with special reference to the Australian region, pp. 565–609. Amsterdam: Elsevier.
Creese, R., A. Davis, and T.M.Glasby (2004, June). Eradicating and preventing the spread of the invasive algaCaulerpa taxifolia in NSW. NSW Fisheries Final Report Series 64, NSW Fisheries.
Dunn, J., L. McArthur, and S. Schreider (2011). Population and nutrient dynamics in aquatic ecosystems:modelling blooming phenomenon. In F. Chan, D. Marinova, and R. Anderssen (Eds.), MODSIM2011, 19thInternational Congress on Modelling and Simulation, pp. 3698–3704.
Glasby, T., P. Gibson, and S. Kay (2005). Tolerance of the invasive marine alga Caulerpa taxifolia to burial bysediment. Aquatic Botany 82, 71–81.
Hill, D., P. Coquillard, J. de Vaugelas, and A. Meinesz (1998). An algorithmic model for invasive species:Application to Caulerpa taxifolia (Vahl) C. Agardh development in the North-West Mediterranean Sea.Ecological Modelling 109, 251–265.
Jaubert, J., J. Chisholm, A. Minghelli-Roman, M. Marchioretti, J. Morrow, and H. Ripley (2003). Re-evaluation of the extent of Caulerpa taxifolia development in the northern Mediterranean using airbornespectrographic sensing. Marine Ecology Progress Series 263, 75–82.
Komatsu, T. and D. Meinesz, A.and Buckles (1997). Temperature and light responses of the alga Caulerpataxifolia introduced into the Mediterranean Sea. Marine Ecology Press Series 146, 145–153.
McArthur, L., S. Schreider, T. Glasby, and A. Alizadeh Shabani (2006). Modelling the spread of Caulerpa tax-ifolia in Lake Conjola, Southern NSW. In M. Hamza (Ed.), Proceedings of the 15th IASTED InternationalConference on Applied Simulation and Modelling, pp. 1–3.
Meinesz, A. (1996). Killer Algae. Chicago, USA: University of Chicago Press.
Phillips, J. and I. Price (2002). How different is Mediterranean Caulerpa taxifolia (Caulerpales: Chlorophyta)to other populations of the species? Marine Ecology Progress Series 238, 61–71.
Ruesink, J. and L. Collado-Vides (2006). Modelling the increase and control of Caulerpa taxifolia - an invasivemarine microalga. Biological Invasions 8, 309–325.
West, E., P. Barnes, J. Wright, and A. Davis (2007). Anchors aweigh: Fragment generation of invasiveCaulerpa taxifolia by boat anchors and its resistance to desiccation. Aquatic Botany 87(3), 196–202.
Withgott, J. (2002). California tries to rub out the monster of the lagoon. Science 295, 2201–2202.
Wortmann, J. (1998). Evalutation the effects of freshwater inflow on the distribution of estuarine macrophytes.Ecological Modelling 106, 213–232.
Wright, J. (2005). Differences between native and invasive Caulerpa taxifolia: a link between asexual frag-mentation and abundances in invasive populations. Marine Biology 147(2), 559–569.
Wright, J. and A. Davis (2006). Demographic feedback between clonal growth and fragmentation in aninvasive seaweed. Ecology 87(7), 1744–1754.
433