Embed Size (px)
Citation preview
Petroleum & Petrochemical Engineering JournalISSN: 2578-4846
MEDWIN PUBLISHERSCommitted to Create Value for Researchers
Modelling the Formation of Gas Hydrate in the Pipelines Pet Petro Chem Eng J
Modelling the Formation of Gas Hydrate in the Pipelines
Saeed Z* and Emamzadeh A1M.Sc of Petroleum Engineering, Science and Research branch, Islamic Azad University, Iran2Associate professor, Mathematics, Islamic Azad University, Iran *Corresponding author: Saeed Zaker, M.Sc of Petroleum Engineering, Science and Research branch, Azad University, Iran, Tel: +989372191977; Email: [email protected]
Research ArticleVolume 5 Issue 1
Received Date: January 13, 2021
Published Date: March 24, 2021
DOI: 10.23880/ppej-16000259
Abstract
Water and hydrocarbon are generally found beside each other in nature i.e., hydrocarbons are formed in aqueous environment. Natural gas and crude oil of storage reservoirs and transferring pipes from petroleum wells to industrial processes of oil and gas are in contact with water and they are in equilibrium with each other. Generally, water is considered as an intruder in oil and gas industry from primary production to ultimate consumption. It causes corrosion in pipelines and reduces the heating value of the fuel. High pressure and low temperature could also cause water condensation and liquid water considerably reduces pipelines efficiency. Low temperatures in winter or an adiabatic pressure drop could ultimately lead to hydrate formation in pipelines. Therefore, hydrate formation causes various problems and costs. In order to prevent hydrate formation, there should be comprehensive information about hydrate formation conditions. The available data on hydrate are outdated and might not have enough accuracy. The data are also specified for a single gas component while mixtures of gases are generally observed in pipelines. The current work tries to increase modeling accuracy of hydrate formation condition in pipelines with different compositions. In this research, a program was coded in MATLAB which specifies hydrate formation condition. In this program, the most accurate equations were used to predict the most efficient condition. Results of the program were compared with real data as well as results of PVTsim simulator. The comparisons indicated that this program could predict hydrate formation condition more accurately.
Keywords: Hydrate; Hydrate Formation Condition; SRK; PR; VPT; PVTsim
Introduction
Gas hydrates are crystal compounds that are formed from trapping of gas molecules in the cages of water ice molecules. These cages are made due to the formation of a hydrogen bond between water molecules around a gas molecule and are stabilized by van der Waals force between gas and water molecules under specific temperature and pressure conditions [1,2].
For more than 70 years gas hydrates have been considered as a big challenge in gas pipelines. Therefore, a great deal of research in this area is concentrated on operational conditions of hydrate formation and effects of the use of inhibitor substances in prevention of hydrate
formation. In the recent decades the research has been focused on methods of hydrate formation prevention [3].
Therefore, considerable improvements have been achieved in the prediction of hydrate formation conditions using thermodynamic models with an acceptable accuracy. However, since use and application of hydrate has not been seriously considered, its production condition and affecting factors are neglected. Only in the last two decades some research has been conducted on the kinetics of hydrate formation [4].
Gas hydrates could cause significant damages during oil and gas wells production. Gas hydrate formation in gas pipelines generally causes obstruction of pipelines. Since

Petroleum & Petrochemical Engineering Journal 2
Saeed Z and Emamzadeh A. Modelling the Formation of Gas Hydrate in the Pipelines. Pet Petro Chem Eng J 2021, 5(1): 000259.
Copyright© Saeed Z and Emamzadeh A.
unblocking the pipelines is costly and might be a long-term process, gas hydrate formation prevention is the wisest way [5]. For this purpose, water separation, increasing the temperature and/or decreasing the pressure as well as addition of chemical inhibitors are used. All the mentioned methods are costly, highlighting the importance of more research on hydrates [6].
Firstly, methods that are based on empirical data, correlations and graphs of quick calculations of hydrate formation condition are presented. Then, more accurate and complicated statistical thermodynamic method is investigated.
After disclosing the structure of hydrate crystals in early 1950s, several theories for macroscopic properties of equilibrium were developed based on microscopic properties. Assuming that each cage has maximum one guest component, it is possible to define distribution of guest molecules using statistics (i.e. the number of ways for placing m different particles in L various boxes). Development of theories led to more accurate calculations. Hydrate equilibrium calculation is the best industrial example for the use of statistical thermodynamic. The first research in this area was done by Stuart and Barrer in 1957 followed by van der Waals and Platteeuw with more accuracy. In fact they are founders of a method that is widely used currently.
Mathematical Back Ground of a Statical Thermodynamic Model of Hydrate Structure
Four major assumptions are crucial for development of a statistical thermodynamic model based on hydrate structure [1]:
1. The share of host molecules in free energy is independent from whole occupation. This assumption means that guest molecules could not cause deformation of holes.
2. No more than a single molecule could be placed in a hole and this molecule could not diffuse between holes.
3. There is no interaction between guest molecules. In another word, the effect of the way guest molecules pass is independent from the number and type of other solution molecules.
4. Considering the quantum effects is not necessary. Classic statistical thermodynamic is based on equations of state.
As a proper starting point, the grand canonical partition function for water is used for integration of above assumptions. Canonical partition function is written as a multiplication of three factors including:
Exponential function of Helmholtz free energy of blank network ( MTA ) on kT
expMTA
kT − (1)
where k is Boltzmann constant and T is the absolute temperature.
The number of ways for distribution of guest molecules type J (1 J M≤ ≤ ) in hole type i is calculated assuming that no more than a molecule could be placed in a hole.
In the specific condition, there are i wNν different holes and we want distribute
1jN same objects. Each hole could
have an object. In this regard, the equation is transformed into the following form:
( )
1 1
!
! !
i w
i w l li j
N
N N N
ν
ν −
∑ ∏ (2)
Where iν the number of is holes type i for each water molecule and Nw is the number of host (water) molecules.
Multiplication of all individual partition functions to the power of the number of particles in a hole type i (
1jN ):
1
1
jNj
j
q∏ (3)
After multiplication of the three mentioned factors in the above equations for holes of type i, van der Waals and Platteeuw obtained canonical partition function as [7]:
( )1
1
1 1
!exp
! !
jMT
Ni wj
i ji w l l
i j
NAQ qkT N N N
ν
ν
= − −
∏ ∏∑ ∏
(4)
In order to obtain grand canonical partition function, Ξ , canonical partition function, Q, is used:
expK
QkTµ Ξ =
∑ (5)
That µ is the chemical potential And for chemical potential and absolute activity we have:
ln expkTkTµµ λ λ = ⇒ =
(6)

Petroleum & Petrochemical Engineering Journal 3
Saeed Z and Emamzadeh A. Modelling the Formation of Gas Hydrate in the Pipelines. Pet Petro Chem Eng J 2021, 5(1): 000259.
Copyright© Saeed Z and Emamzadeh A.
By multiplication of the above relation with activity of each molecule, the number of molecules type j inside hole type i could be determined:
1 1 1 1j j j j j jN N N N N NA A B B j j
i j
λ λ λ λ λ λ=∏∏ (7)
And for calculating total sum of Nj1:
1 1
1exp
i w
j ji i
j j
N
MTN Ni wj j
N i ijNi w ji j
ij j
NA qkT
N N
ν
ν λν λ
Ξ = − −
∑∏ ∏∑ ∏
(8)
The above equation could be rephrased in a more simplified way. Consider the term inside the sigma. If the term is written for a single type of hole and two types of guest molecules (j=A, B), e.g. propane and iso-butane in hole 51264:
( )( ) ( )( )1
1
! w A BA B A B
A B
N N Ni w N N N NA B A B
N N w A B
Nq q l
N N Nνν
λ λν
− −
− − −∑∑
(9)
The last term of the above equation is partition function for blank hole. For blank holes we have:
0 , 1MT MTµ λ= =
The mentioned above equation could be transformed into the following equation using polynomial theory of math [8]:
( ) ( )1 2
1 2
1 2 1 20 0
1
!... ... ...!
r
r
N N NN N N N
r rrN N N
jj
Nx x x x x xN= =
=
+ + + = ∑∑ ∑∏
(10)
1 2 ... rN N N N+ + + =
By comparing equation 9 with the right side of equation 10, following equation is resulted:
( )1 i wNA A B Bq q νλ λ+ + (11)
Therefore, for each i, a similar phrase in the above equation will be available and finally this equation will be in the following form;
1exp 1
wi NMT
j jji
A qkT
ν
ϕ
Ξ = − −
∑∏ (12)
It should also be considered that the above equation is total partition function for guest component and common partition function is for host component. Since 1MTλ = , then
combined host guestQΞ = Ξ (13)
ln ln lncombined host guestkT kT Q kTΞ = Ξ (14)
The above equation could be related to chemical potential (h for host and g for host):
( )ln h h h h hw wd kT Q dA S dT PdV dNµ= − = + − (15)
( ) ( )ln gh g g hj j
jd kT d PV S dT PdV d dNµΞ = − = + −∑
(16)
As entropy and volume are extensive properties,
g hS S S= + , g hV V V= +
By considering these equations,
( )ln combinedj j w w
jd kT SdT PdV d N dNµ µΞ = + − −∑
(17)
By removing the word “combined” and differentiation from the left side and since lnj jd kTµ λ=
( )ln ln ln Hj j w w
jkTd k S dT PdV KTN d dNλ µΞ = − Ξ + + + −∑
(18)
The above equation indicates relationship between partition function and macroscopic properties. All macroscopic thermodynamic properties could be measured. As an example, differentiation of lnΞ to activity of component K, results in total number of guest molecules in all holes of type i:
, , ,
lnlni
w j K
K K Ki K T V N
N Nλ
δλδ λ
≠
Ξ= =
∑ (19)
In this equation, logarithm is resulted from equation 9:
Petroleum & Petrochemical Engineering Journal 4
Saeed Z and Emamzadeh A. Modelling the Formation of Gas Hydrate in the Pipelines. Pet Petro Chem Eng J 2021, 5(1): 000259.
Copyright© Saeed Z and Emamzadeh A.
( ). .ln ln 1
i
MTw
i w j ji j
A T V NN q
KTν λ
Ξ = − + +
∑ ∑
(20)
And then the number of guest molecules is calculated as:
1ii w K K
Ki ji j
j
N qN
qν λ
λ
= +
∑ ∑ (21)
The probability of the presence of a molecule type K in hole type i (
iKY ) could be measured. In this regard, molecules of type K in hole type i would be divided by total number of holes type i:
1i i
i
K K KK
i w ji jj
N qY
N qλ
ν λ= =
+∑ (22)
Solvent chemical potential (host) is calculated using the following equation:
, ,
ln
j
Hw
w T VKT N
λ
µ ∂ Ξ= − ∂
And therefore:
ln 1i
H MTw w
i j ji j
qKT KTµ µ ν λ
= − +
∑ ∑ (24)
Foe these simplifications, first of all chemical potential of an ideal gas and its relation with partition function of particle were obtained. For an ideal gas partition function Q is:
1!
NQ qN
= (25)
And chemical potential of ideal gas could be calculated using the following relation:
,
ln lnT V
Q qkT KTN N
µ ∂ = − = − ∂ (26)
Particles partition function could be separated into two transitional and internal energy parts i.e.
inttransq q q= . Then,
32
2
2q mKT VN h N
π =
(27)
The second root of the term inside the parentheses is called De Broglie average thermal wave length. For an
ideal gas (V KTN P= ):
32
2,
ln 2ln ln lnT V
Q mKTkT KT KT KT q KT PN h
πµ ∂ = − = − − + ∂
(28)And since chemical potential is defined in relation to a
standard reference state:
( )0 lnT KT Pµ µ= + (29)
It could be concluded that320
int2
2ln lnmKTKT KT KT qh
πµ = − −
(30)
Without considering standard chemical potential ( 0µ ) and by considering absolute chemical potential we will have:
32
int2
ln2
PKTmKTKT qh
µπ
=
(31)
And for absolute activity:
32
int22
P
mKTKT qh
λπ
=
(32)
Absolute activity and partition function of individual particles could be transformed into the following equation using constant
iKC :
32
int22
i i
i
K K KK
K
q qC
P mKTKT qh
λ
π= =
(33)
It should be considered that denominator of the above equation includes internal partition of particles and distribution of ideal gas. Therefore, this fraction indicates non-ideal gas impacts. When equation 29 is placed in equation 22, the equation for ,j iθ , part of occupation of hole i with molecule j:
Petroleum & Petrochemical Engineering Journal 5
Saeed Z and Emamzadeh A. Modelling the Formation of Gas Hydrate in the Pipelines. Pet Petro Chem Eng J 2021, 5(1): 000259.
Copyright© Saeed Z and Emamzadeh A.
,,
,1j i j
j ij i j
C PC P
θ =+∑ (34)
For an ideal gas, occupation of hole i with molecule j could be expressed as a possible event. This is one of the most applicable equations in hydrate prediction methods and it may be known as Langmuir attraction. If the equation is written for guest molecule j, therefore, it includes Langmuir constant, ,j iC , as the only unknown. Langmuir constant is a direct function of the direct function of particles in hole length ( ,j iq ) and particle (Cj,i) that includes non-ideal gas. When the fluid is in equilibrium with hydrates of non-ideal gas, fugacity of component j is replaced with the pressure of component j.
By these modifications, the following equation could be very useful for calculations of hydrate properties. This equation sets Langmuir constant with empirical data of hydrates. The method of relating Langmuir constant to empirical conditions is explained in the following sections.
The following equation could calculate chemical potential of hydrate water in holes with partial occupation. The value of water chemical potential in blank holes of hydrates and products of particles of individual holes as well as absolute activity could also be measured.
ln 1H MTw w
i ji ji j
qKT KTµ µ ν λ
= − +
∑ ∑ (35)
Therefore, ultimate product is ji j ji jq C Pλ = and then:
ln 1H MTw w
i ji ji j
C PKT KTµ µ ν
= − +
∑ ∑
(36)
Logarithmic part of the above equation is considered. This part could be simplified into Langmuir constant using
,j iθ i.e. partial occupation of hole type i with molecule of type j.
,,
,
ln 1 ln 11
j i jj i j
j j i j
C PC P
C P
+ = − + ∑ ∑
(37)
,1i
i
K jK
j i jj
C PY
C P=
+∑ (38)
ln 1 ln 1 ln ln 11 1
i i
i i
i i
K K K KK K K
K K K KK K K KK K
C P C PY C P
C P C P
− = − = = − + + +
∑ ∑ ∑ ∑∑ ∑
(39)
By replacing in equation 36, we will have:
ln 1i
H MTw w i K
i KKT Yµ µ ν = + −
∑ ∑ (40)
By using the obtained equations, chemical potential of water in hydrate could be determined. That is one of major parts of statistic thermodynamic model. Equation 40 indicates that by full occupation of holes, chemical potential of water in hydrate phase, H
wµ , reduces and therefore, hydrate stability from thermodynamic point of view increases.
Next step is to relate Langmuir constants to empirical variables in order to reveal a physical interpretation. In this regard, we should measure potential energy of individual guest inside the hole. The force between guest and hole changes by changing potential energy due to guest displacement. First of all, two new assumptions are added to the four pre-determined assumptions for hydrate [1]:
• Direct function of internal movement of guest molecules equals partition function of internal movement for an ideal gas. This means that guest molecules stuck in hydrate network with electric, nuclear, rotational and swing energies is ignored.
• Potential energy of guest molecule with the distance of r from hole center is estimated by spherical symmetric potential, ( )rϖ , which was suggested by Devonshire and Lennard-Jones.
• In this model interaction between guest molecules and the closest water molecules neighboring spherical hole is gathered pair wise. In this regard, ( )rϖ , the average of the sum of forces in all directions of molecule inside the hole is used. Platteeuw and van der Waals used Lennard-Jones potential function for clarifying inter-molecular potential between a water molecule from the wall of hole and a solution molecule (guest). In 1963 Mckoy and Sinanoglu suggested that Kihara spherical potential could be used for bigger and non-spherical molecules in case parameters of this potential are calculated from experimental data of decomposition.
Potential energy between guest molecule and each of water molecules (h) is related to force F from a molecule to another by
Frτ∂
= −∂
, where r is the distance between two
molecules. τ is a function of distance between molecules and is considered the same for all molecules. This function is as follows:
( ) for r 2arτ = ∞ ≤
( )12 6* *
2 2r k
r a r aσ στ ε
= − − −
(41)
Petroleum & Petrochemical Engineering Journal 6
Saeed Z and Emamzadeh A. Modelling the Formation of Gas Hydrate in the Pipelines. Pet Petro Chem Eng J 2021, 5(1): 000259.
Copyright© Saeed Z and Emamzadeh A.
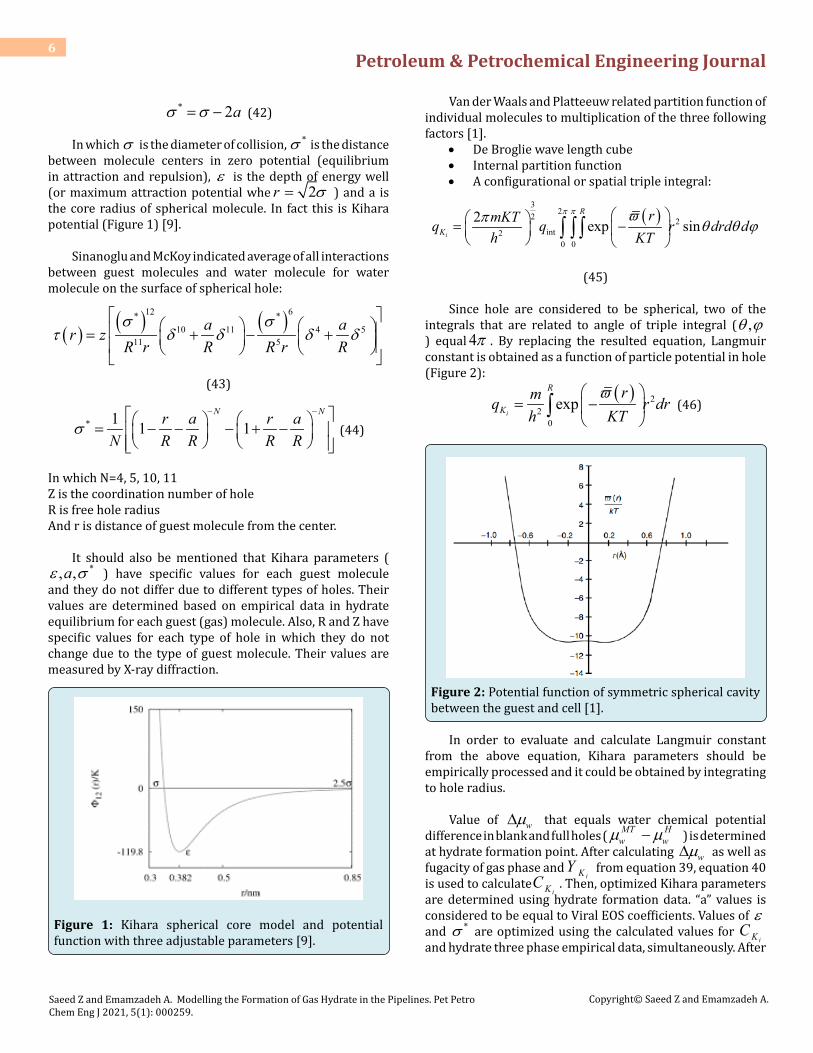
* 2aσ σ= − (42)
In which σ is the diameter of collision, *σ is the distance between molecule centers in zero potential (equilibrium in attraction and repulsion), ε is the depth of energy well (or maximum attraction potential whe 2r σ= ) and a is the core radius of spherical molecule. In fact this is Kihara potential (Figure 1) [9].
Sinanoglu and McKoy indicated average of all interactions between guest molecules and water molecule for water molecule on the surface of spherical hole:
( ) ( ) ( )12 6* *10 11 4 5
11 5
a ar zR r R R r Rσ σ
τ δ δ δ δ
= + − +
(43)
* 1 1 1N Nr a r a
N R R R Rσ
− − = − − − + −
(44)
In which N=4, 5, 10, 11Z is the coordination number of holeR is free hole radiusAnd r is distance of guest molecule from the center.
It should also be mentioned that Kihara parameters (*, ,aε σ ) have specific values for each guest molecule
and they do not differ due to different types of holes. Their values are determined based on empirical data in hydrate equilibrium for each guest (gas) molecule. Also, R and Z have specific values for each type of hole in which they do not change due to the type of guest molecule. Their values are measured by X-ray diffraction.
Figure 1: Kihara spherical core model and potential function with three adjustable parameters [9].
Van der Waals and Platteeuw related partition function of individual molecules to multiplication of the three following factors [1].
• De Broglie wave length cube• Internal partition function• A configurational or spatial triple integral:
( )3
22 2int2
0 0
2 exp sini
R
K
rmKTq q r drd dh KT
π π ϖπ θ θ ϕ = −
∫ ∫ ∫
(45)
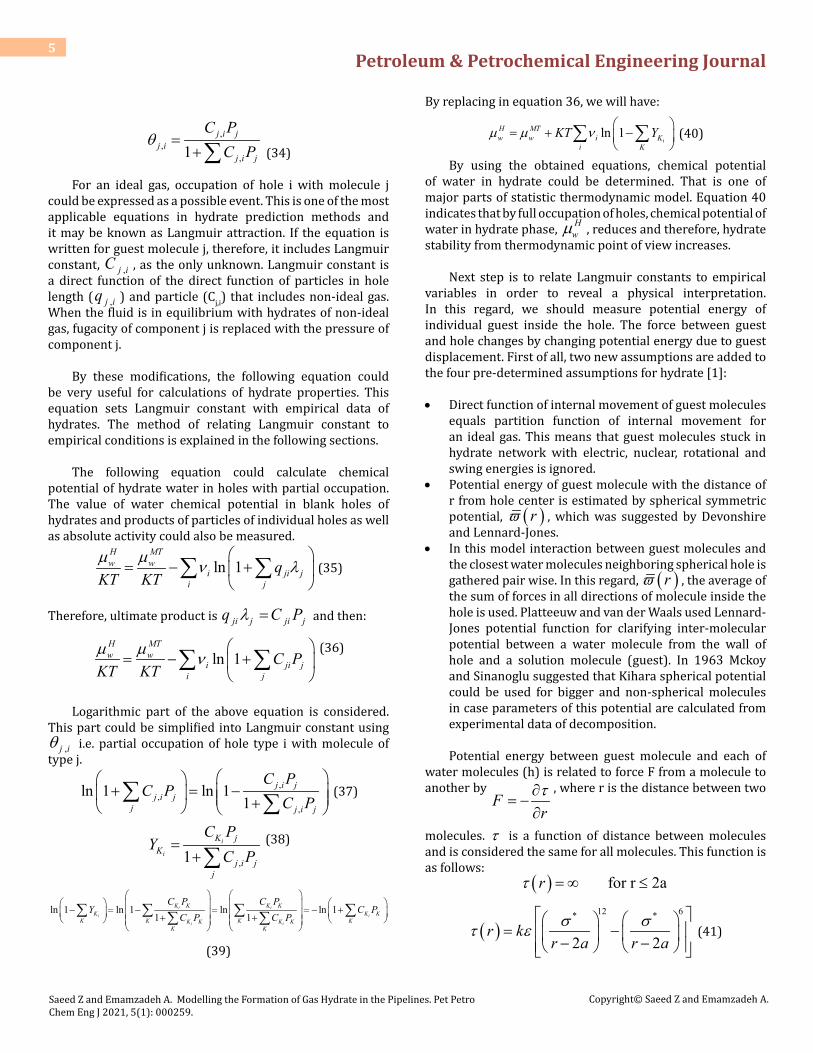
Since hole are considered to be spherical, two of the integrals that are related to angle of triple integral ( ,θ ϕ ) equal 4π . By replacing the resulted equation, Langmuir constant is obtained as a function of particle potential in hole (Figure 2):
( ) 22
0
expi
R
K
rmq r drh KT
ϖ = −
∫ (46)
Figure 2: Potential function of symmetric spherical cavity between the guest and cell [1].
In order to evaluate and calculate Langmuir constant from the above equation, Kihara parameters should be empirically processed and it could be obtained by integrating to hole radius.
Value of wµ∆ that equals water chemical potential difference in blank and full holes ( MT H
w wµ µ− ) is determined at hydrate formation point. After calculating wµ∆ as well as fugacity of gas phase and
iKY from equation 39, equation 40 is used to calculate
iKC . Then, optimized Kihara parameters are determined using hydrate formation data. “a” values is considered to be equal to Viral EOS coefficients. Values of ε and *σ are optimized using the calculated values for
iKC and hydrate three phase empirical data, simultaneously. After

Petroleum & Petrochemical Engineering Journal 7
Saeed Z and Emamzadeh A. Modelling the Formation of Gas Hydrate in the Pipelines. Pet Petro Chem Eng J 2021, 5(1): 000259.
Copyright© Saeed Z and Emamzadeh A.
discussion on the method of Kihara constants measurement, we will discuss wµ∆ calculation method. In this regard, general equilibrium condition (equality of water chemical potential in hydrate with water chemical potential in dense water ( a
wµ for solid water and Lwµ for liquid water)) is
implemented:
or H L H aw w w wµ µ µ µ= = (47)
If dense water phase (liquid or solid) is assumed to be pure, then the value of wµ∆ could be assumed to equal chemical potential difference between water and hydrate phases.
( ) ( )H a H MT MT aw w w w w wµ µ µ µ µ µ− = − + − (48)
By replacing 0H aw wµ µ− = in equation 48 we will have
( ) ( )H MT a MTw w w wµ µ µ µ− = − (49)
Satio, et al. in 1964 proposed a method for measurement of wµ∆ . This method was made simpler later in 1980 by Holder. Since wµ∆ is only a function of temperature and pressure, its changes could be calculated using classic thermodynamic [10].
2w w wh Vd dT dP
RT RT RTµ∆ ∆ ∆ = − +
(50)
In which wh∆ and wV∆ are enthalpy and volume differences, respectively, for water or ice with hydrate phase. By integrating from the above equation, the value of
wµ∆ is resulted in three phase line depending on standard temperature and pressure ( 0 0273.15 , 0T K P= = ) [11]:
0
20 0
T Pw w w w
T
h VdT dPRT RT RT RTµ µ∆ ∆ ∆ ∆ − = − +
∫ ∫ (51)
Above equation is used whenever pure water is the denser phase. Otherwise, it must be modified and water activity, w wxγ or wx must be added to the equation. Since
lnpurew w w wRT xµ µ γ= + , the equation is transformed as
follows:0
20 0 0
lnT P
w w w ww w
h VdT dP xRT RT RT RTµ µ γ∆ ∆ ∆ ∆ = − + −
∫ ∫ (52)
Due to the low solubility of hydrate constituents gases (xK) in water, water concentration is close to unity. For solubility of guest molecule K in water phase, Krichevski-
Kasarnovski relation including Henry constant could be used [1]:
1 1exp
w
Kw K
K
fx xPHRTν −∞
= − = −
(53)
Henry constant for solubility is in form of a function of temperature as follows:
( ) ( ) ( ) ( )
0
0 1 2 3lnln w w w wK K K K
K
H H H T H TH
R RT R R− = + + +
(54)
Henry constant is in atmosphere, R constant in cal/Kmol and T is in K. Values of ( )0
wKH , ( )1wKH , ( )2
wKH and ( )3wKH are
reported in Table 1. Without any considerable error, value of wγ is assumed to be unity; except when there is an inhibitor
or solubility of hydrate constituents gas in water is high (for example 2H S and 2CO ).
Component ( )0wKH ( )1
wKH ( )2wKH ( )3
wKHCH4 -365.183 18106.7 49.7554 -0.000285C2H6 -533.392 16565 74.624 -0.004573C3H8 -628.866 31638.4 88.0808 0
i-C4H10 190.982 -4913 -34.5102 0n-C4H10 -639.209 32785.7 89.1483 0
CO2 -317.658 17371.2 43.0607 -0.002191H2S -297.158 16347.7 40.2024 0.002571N2 -327.85 16757.6 42.84 0.016765
Table 1: Constant Henry parameters for hydrate structures I and II [1].
The value of wV∆ equals 0wV∆ and 0
wh∆ is modified for temperature in order to establish a equation for calculation of wh∆ [12,13].
0
0T
w w PwT
h h C dT∆ = ∆ + ∆∫ (55)
( )00Pw PwC C a T T∆ = ∆ + − (56)
Constant values in the above equations i.e. 0 0 0, , ,w w Pwh C aµ∆ ∆ ∆ are listed in Table 2 by having these
constants, calculation of wµ∆ will be easier and therefore, determination of Kihara potential parameters from empirical data of three phase hydrate formation would be possible.

Petroleum & Petrochemical Engineering Journal 8
Saeed Z and Emamzadeh A. Modelling the Formation of Gas Hydrate in the Pipelines. Pet Petro Chem Eng J 2021, 5(1): 000259.
Copyright© Saeed Z and Emamzadeh A.
Model Description
In order to accelerate run time of the program and make it more user friendly, various data banks in form of data file and subroutine were made for side calculations of hydrate program. Physical properties of substances including critical temperature, critical pressure, and critical compressibility coefficient and acentric factor were stored in a data file. Also, Kihara parameters and Henry constant values in gas solubility equation 4 temperature points of hydrate constituent components were stored in another data file. Values of the parameters as well as their references will be mentioned in the following sections. By specifying an index number for each substance, data from that data file is obtained. Since the purpose of modeling in this research is the modeling of hydrates with structure I and II for natural gases and as major constituents of natural gas are methane, ethane, propane, iso-butane, n-butane, carbon dioxide, sulfide-hydrogen and nitrogen, index numbers from 1 to 8 are dedicated respectively for the mentioned substances.
Different separate subroutines were programmed e.g. for calculations of fugacity coefficients of gas hydrate constituents’ components, compressibility coefficients of components and gas mixture and binary interaction coefficients of mixtures.Program running steps are as follow:1) Gas mixture composition and temperature are read from
program input. Also, all data about hydrate constituents that are necessary in following steps is read from data file.
2) Before starting the calculations, the possibility of hydrate formation for a gas mixture is investigated. If hydrate formation is possible, hydrate formation pressure is calculated. If gas temperature is higher than upper four points temperature (Q1) of hydrate constituents, hydrate is not formed in that temperature. Four points data of natural gas components are used in these calculations. By assuming the existence of structure II constituents in Parrish-Prausnitz algorithm, calculations are done for structure II. Finally, these calculations are repeated for structure I. The possibility of hydrate formation for a structure with low formation pressure is higher. Later researches revealed that structure II is more thermodynamically stable. Therefore, whenever its constituents are available, hydrates of structure II would be formed. Otherwise, hydrates structure I would be formed
3) In this step, numerical integrations from equation 68 as well as equation 69 and equation 70 lead to specification of Langmuir constants for each component in each hole for the specific structure.
Simpson and Gauss-Legendre methods are two
numerical integrating methods with high accuracy. Gauss-Legendre method calculations are faster and more accurate than Simpson method. Due to the rule of integrating
( )1
1
f x dx−∫ in Gauss-Legendre method, the range of
1 1x− ≤ ≤ is divided by the node (xi). By having a series of
weight coefficients (wi), the integral is changed into the following form:
( ) ( )1
11
n
i ni
f x dx w f x R=−
= +∑∫ (57)
Generally, for integrating ( )b
a
f y dy∫ , following variable
change is recommended:
2 2i ib a b ay x− + = +
(58)
And therefore
2b ady dx−
= (59)
( ) ( )1
1
2
2 2 2
b n
i i nia
n
i i ni
b af y dy w f y R
b a b a b aw f x R
=
=
−= +
− − + = + +
∑∫
∑
(60)
Rw is the error of integral calculation and equals:
( ) ( )( ) ( )
( ) ( )2 1 4
23
!
2 1 2 !
nn
n
b a nR f
n nζ
+−=
+
(61)
The higher value for n is resulted in higher accuracy for the integral. In this research n=10. For n=10, the values of wi and xi are listed in the following Table 2.
±xi wi
0.14887434 0.29552420.43339539 0.26926670.67940957 0.21908640.86506337 0.14945130.97390653 0.0666713
Table 2: Lengths and weights of Gauss-Legendre for n=10 [14].
Petroleum & Petrochemical Engineering Journal 9
Saeed Z and Emamzadeh A. Modelling the Formation of Gas Hydrate in the Pipelines. Pet Petro Chem Eng J 2021, 5(1): 000259.
Copyright© Saeed Z and Emamzadeh A.
If the above method is used for calculation of
( )1 2
0
expi
R
K
rI r dr
KTϖ
= −
∫, we will have:
( ) ( )1 20, b=R, f expr
a r rKT
ϖ = = −
(62)
For example for the first node, 0.148874338981631ir = ,
( )if r is calculated as:
( ) ( )1 1 2
1 1 1exp K rf r r f
KTϖ
= − =
(63)
And for the calculation of ( )1 1K rϖ , following equation
is used:
( ) ( ) ( )1
12 6* *10 11 4 5
1 1 11 51 1
K Ka ar z
R r R R r Rσ δ
ϖ ε δ δ δ δ
+ − +
(64)
1
1 1
1 1
1 1 1 N=4,5,10,11 i=1,24
N NN K KK
K K
r a r aR R R R
δ− −
= − − − + −
(65)
i=1 for small holes and i=2 for big holes. K is the hydrate constituent gas.
In this way, for the second group 2 1r r= − and ( )2 2f r f=. Other values of ( )if r are calculated as well and finally:
( )11 2 1 1 1 1 1 1 1
1 1 2 2 10 100
exp ...2 2 2 2 2 2 2i
RK
K
r R R R R R R RI r dr w f r w f r w f rKT
ϖ = − = + + + + + + ∫
(66)
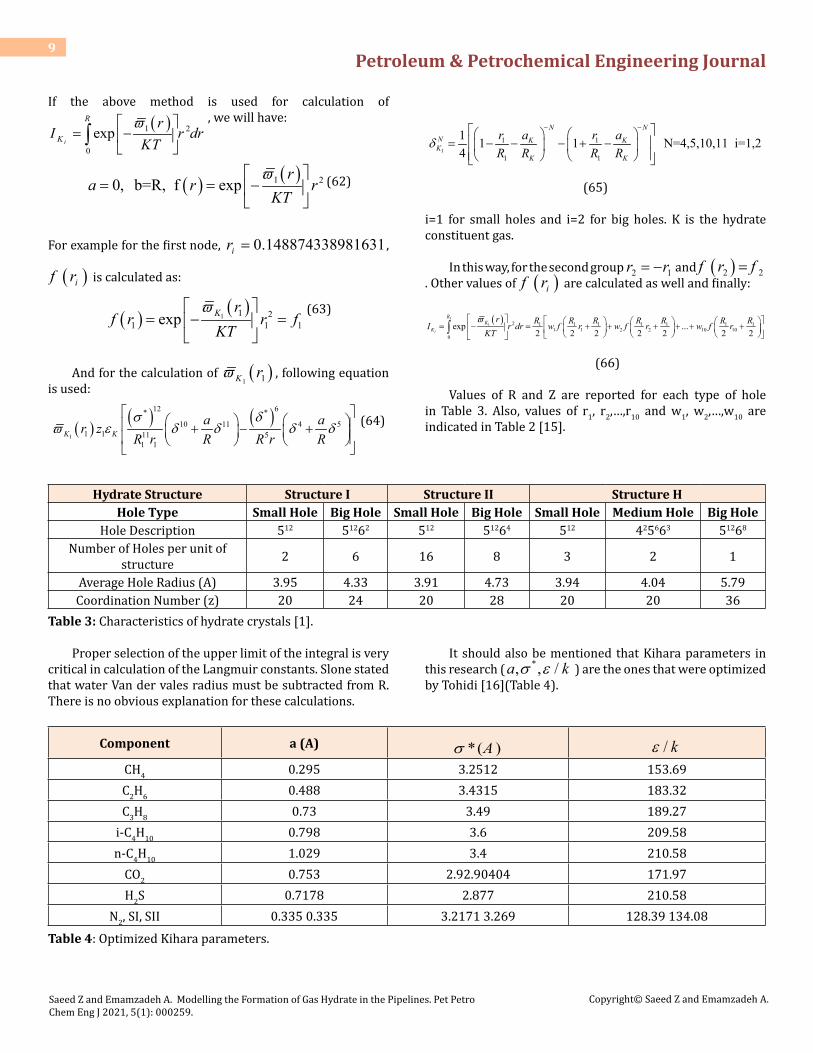
Values of R and Z are reported for each type of hole in Table 3. Also, values of r1, r2,…,r10 and w1, w2,…,w10 are indicated in Table 2 [15].
Hydrate Structure Structure I Structure II Structure HHole Type Small Hole Big Hole Small Hole Big Hole Small Hole Medium Hole Big Hole
Hole Description 512 51262 512 51264 512 425663 51268
Number of Holes per unit of structure 2 6 16 8 3 2 1
Average Hole Radius (A) 3.95 4.33 3.91 4.73 3.94 4.04 5.79Coordination Number (z) 20 24 20 28 20 20 36
Table 3: Characteristics of hydrate crystals [1].
Proper selection of the upper limit of the integral is very critical in calculation of the Langmuir constants. Slone stated that water Van der vales radius must be subtracted from R. There is no obvious explanation for these calculations.
It should also be mentioned that Kihara parameters in this research ( *, , /a kσ ε ) are the ones that were optimized by Tohidi [16](Table 4).
Component a (A) *( )Aσ / kεCH4 0.295 3.2512 153.69C2H6 0.488 3.4315 183.32C3H8 0.73 3.49 189.27
i-C4H10 0.798 3.6 209.58n-C4H10 1.029 3.4 210.58
CO2 0.753 2.92.90404 171.97H2S 0.7178 2.877 210.58
N2, SI, SII 0.335 0.335 3.2171 3.269 128.39 134.08
Table 4: Optimized Kihara parameters.
Petroleum & Petrochemical Engineering Journal 10
Saeed Z and Emamzadeh A. Modelling the Formation of Gas Hydrate in the Pipelines. Pet Petro Chem Eng J 2021, 5(1): 000259.
Copyright© Saeed Z and Emamzadeh A.
By having the value of the integral (iKI ), Langmuir
constants are calculated for each gas component K in cavity i using the following equation:
4i iK KI I
KTπ
= (67)
In which3.14159265356π =
( )231.38066*10 /k j K−=
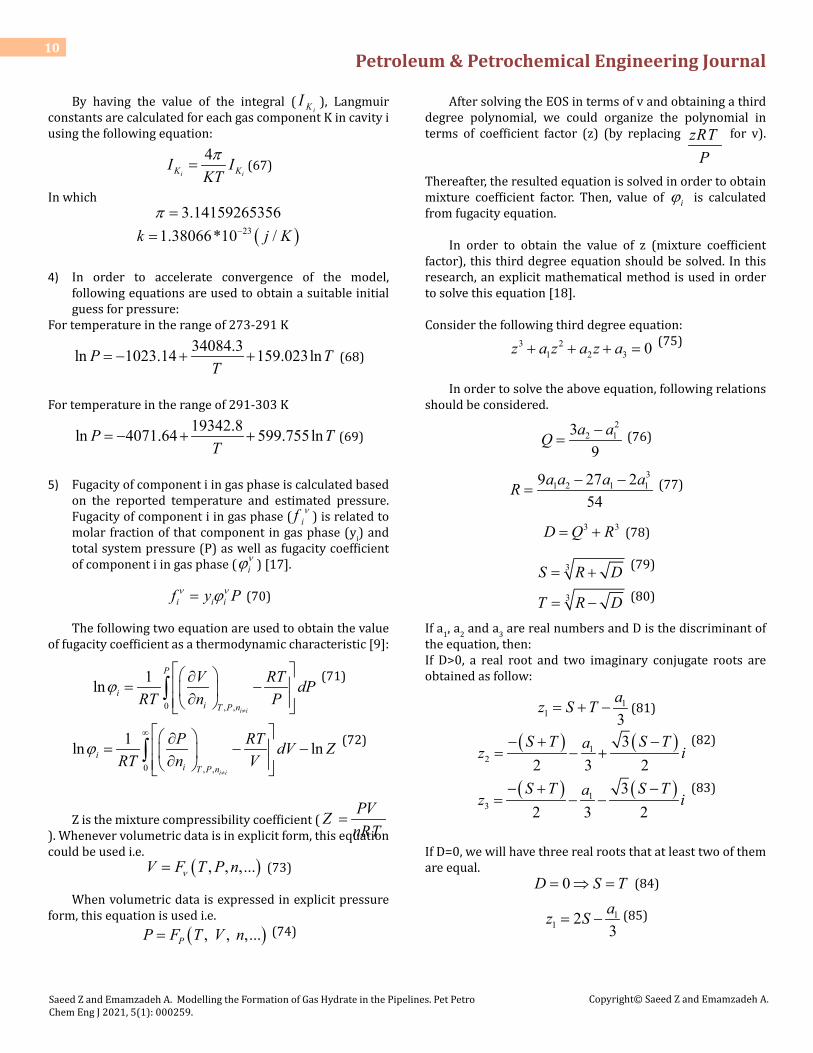
4) In order to accelerate convergence of the model, following equations are used to obtain a suitable initial guess for pressure:
For temperature in the range of 273-291 K34084.3ln 1023.14 159.023lnP T
T= − + + (68)
For temperature in the range of 291-303 K19342.8ln 4071.64 599.755lnP T
T= − + + (69)
5) Fugacity of component i in gas phase is calculated based on the reported temperature and estimated pressure. Fugacity of component i in gas phase ( if ν ) is related to molar fraction of that component in gas phase (yi) and total system pressure (P) as well as fugacity coefficient of component i in gas phase ( i
νϕ ) [17].
i i if y Pν νϕ= (70)
The following two equation are used to obtain the value of fugacity coefficient as a thermodynamic characteristic [9]:
0 , ,
1lni i
P
ii T P n
V RT dPRT n P
ϕ≠
∂ = − ∂ ∫
(71)
0 , ,
1ln lni i
ii T P n
P RT dV ZRT n V
ϕ≠
∞ ∂ = − − ∂ ∫
(72)
Z is the mixture compressibility coefficient (PVZnRT
=). Whenever volumetric data is in explicit form, this equation could be used i.e.
( ), , ,...V F T P nν= (73)
When volumetric data is expressed in explicit pressure form, this equation is used i.e.
( ), , ,...PP F T V n= (74)
After solving the EOS in terms of v and obtaining a third degree polynomial, we could organize the polynomial in terms of coefficient factor (z) (by replacing zRT
P for v).
Thereafter, the resulted equation is solved in order to obtain mixture coefficient factor. Then, value of iϕ is calculated from fugacity equation.
In order to obtain the value of z (mixture coefficient factor), this third degree equation should be solved. In this research, an explicit mathematical method is used in order to solve this equation [18].
Consider the following third degree equation:3 2
1 2 3 0z a z a z a+ + + = (75)
In order to solve the above equation, following relations should be considered.
22 139
a aQ −= (76)
31 2 1 19 27 2
54a a a aR − −
= (77)
3 3D Q R= + (78)
3S R D= + (79)
3T R D= − (80)
If a1, a2 and a3 are real numbers and D is the discriminant of the equation, then:If D>0, a real root and two imaginary conjugate roots are obtained as follow:
11 3
az S T= + − (81)
( ) ( )12
32 3 2
S T S Taz i− + −
= − + (82)
( ) ( )13
32 3 2
S T S Taz i− + −
= − − (83)
If D=0, we will have three real roots that at least two of them are equal.
0D S T= ⇒ = (84)
11 2
3az S= − (85)
Petroleum & Petrochemical Engineering Journal 11
Saeed Z and Emamzadeh A. Modelling the Formation of Gas Hydrate in the Pipelines. Pet Petro Chem Eng J 2021, 5(1): 000259.
Copyright© Saeed Z and Emamzadeh A.
12 3 3
az z S= = − − (86)
If D>0, three real unequal roots are obtained:
11 2 cos
3 3az Q θ = − −
(87)
12
22 cos3 3 3
az Q θ π = − + −
(88)
13
42 cos3 3 3
az Q θ π = − + −
(89)
In which 3
cos RQ
θ =−
.
Compressibility factor of gas phase (the highest root of the equation i.e. Zv) is placed in fugacity coefficient equations. Thereafter, value of if ν is obtained by having the value of i
νϕ in equation 44. 6) In this step, equation 39 is used in equation 40 in order
to obtain a direct relationship for wµ∆ (as follows) and calculate a primary value for chemical potential difference of water at the pre-determined temperature and estimated pressure.
1 1ln 1
c c
i
n nH MT
w w w i K ki k
kT C fµ µ µ ν= =
∆ = − − +
∑ ∑ (90)
nc is the number of gas phase components. As the values of fk and
iKC were calculated in previous steps and vi has a specific value (the number of cavities type i per any water molecule in a specific hydrate structure), wµ∆ is calculated using equation 90. iν values for the two structures are as follow:
Structure I: 1
2 146 23
ν = = (91)
26 346 23
ν = = (92)
Structure II:1
16 2136 17
ν = = (93)
28 1
136 17ν = =
(94)
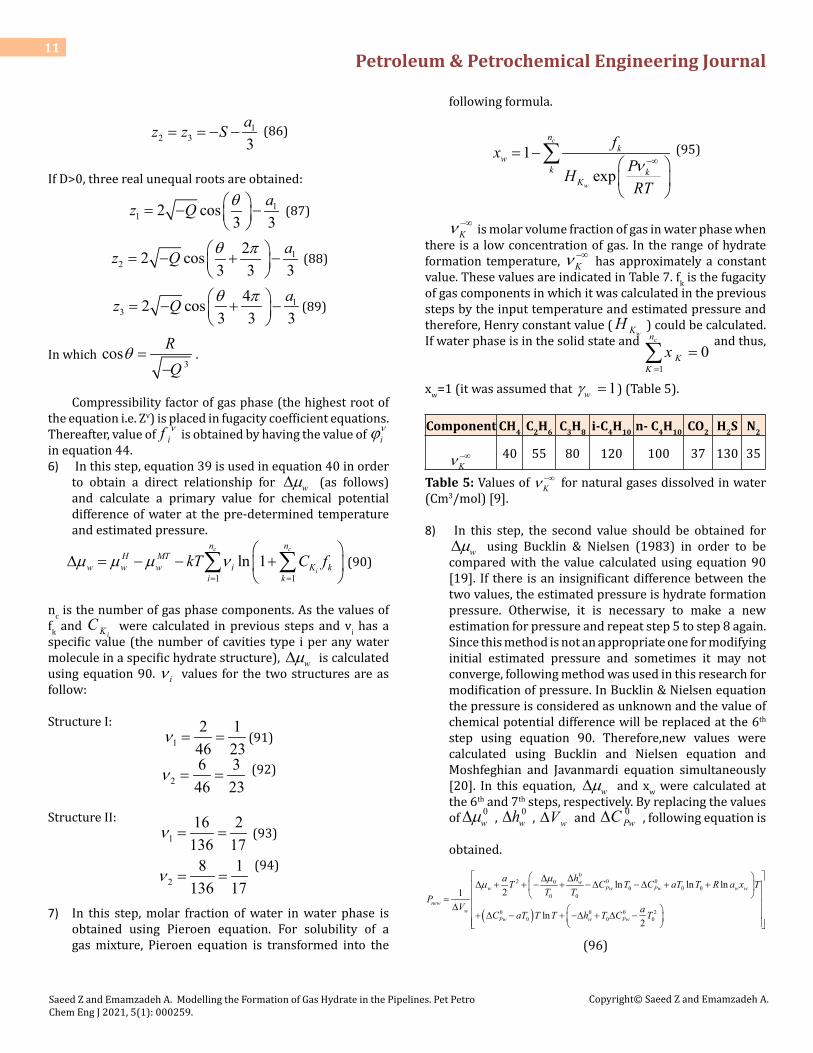
7) In this step, molar fraction of water in water phase is obtained using Pieroen equation. For solubility of a gas mixture, Pieroen equation is transformed into the
following formula.
1exp
c
w
nk
wk k
K
fxPHRTν −∞
= −
∑ (95)
Kν−∞ is molar volume fraction of gas in water phase when
there is a low concentration of gas. In the range of hydrate formation temperature, Kν
−∞ has approximately a constant value. These values are indicated in Table 7. fk is the fugacity of gas components in which it was calculated in the previous steps by the input temperature and estimated pressure and therefore, Henry constant value (
wKH ) could be calculated. If water phase is in the solid state and
10
cn
KK
x=
=∑ and thus,
xw=1 (it was assumed that 1wγ = ) (Table 5).
Component CH4 C2H6 C3H8 i-C4H10 n- C4H10 CO2 H2S N2
Kν−∞ 40 55 80 120 100 37 130 35
Table 5: Values of Kν−∞ for natural gases dissolved in water
(Cm3/mol) [9].
8) In this step, the second value should be obtained for wµ∆ using Bucklin & Nielsen (1983) in order to be
compared with the value calculated using equation 90 [19]. If there is an insignificant difference between the two values, the estimated pressure is hydrate formation pressure. Otherwise, it is necessary to make a new estimation for pressure and repeat step 5 to step 8 again. Since this method is not an appropriate one for modifying initial estimated pressure and sometimes it may not converge, following method was used in this research for modification of pressure. In Bucklin & Nielsen equation the pressure is considered as unknown and the value of chemical potential difference will be replaced at the 6th step using equation 90. Therefore,new values were calculated using Bucklin and Nielsen equation and Moshfeghian and Javanmardi equation simultaneously [20]. In this equation, wµ∆ and xw were calculated at the 6th and 7th steps, respectively. By replacing the values of 0
wµ∆ , 0wh∆ , wV∆ and 0
PwC∆ , following equation is
obtained.
( )
02 0 00
0 0 00 0
0 0 0 20 0 0
ln ln ln21
ln2
ww Pw Pw w w
neww
Pw w Pw
ha T C T C aT T R a x TT T
PV aC aT T T h T C T
µµ ∆ ∆∆ + + − + −∆ −∆ + +
= ∆ + ∆ − + −∆ + ∆ −
(96)
Petroleum & Petrochemical Engineering Journal 12
Saeed Z and Emamzadeh A. Modelling the Formation of Gas Hydrate in the Pipelines. Pet Petro Chem Eng J 2021, 5(1): 000259.
Copyright© Saeed Z and Emamzadeh A.
For structure I
( )6
210 0.0895 499.3176 8.314ln 86.2139 ln 12251.14.6new w wP T x T T Tµ = ∆ + + + − −
(97)And for structure II
( )6
210 0.0895 499.303 8.314ln 86.2139 ln 11887.15.1new w wP T x T T Tµ = ∆ + + + − −
(98)
In the above equation, Pnew is in Pascal unit. Equations 96, 97 and 98 were introduced for the first time in this research. Values of 0
wµ∆ , 0wh∆ and 0
wv∆ which were used
in this research are indicated in Table 6. Holder equation was used for calculation of PwC∆ [21].
( )037.32 0.179PwC T T∆ = − + − (99)
Parameter Structure I
Structure II Structure H
( )0 /w J molµ∆ 1297 937 914.38
( )0 /wh J mol∆ * 1389 1025 846.57
( )0 3 / **w Cm molν∆3 3.4 3.85
Table 6: Reference characteristics of hydrate structure*For water phase, 6009.5 (J/mol) is subtracted due to solid phase**For water phase, 1.601 (J/mol) is added due to solid phase
9) If the calculated pressure in the 8th step equals the estimated pressure in the 4th step, calculations for the considered structure will end. Otherwise, previous pressure will be replaced with the newer one and the 5th, 6th, 7th and 8th steps will be repeated. It should also be mentioned that for the second or higher repetitions, new pressure would be compared with the pressure which was calculated in the previous repetition (instead of comparing with the initial guess in the 4th step) in order to reach an acceptable difference between the newer and older pressure (error<10--4). In this way, hydrate formation pressure would be calculated in the pre-determined temperature and compositions [22].
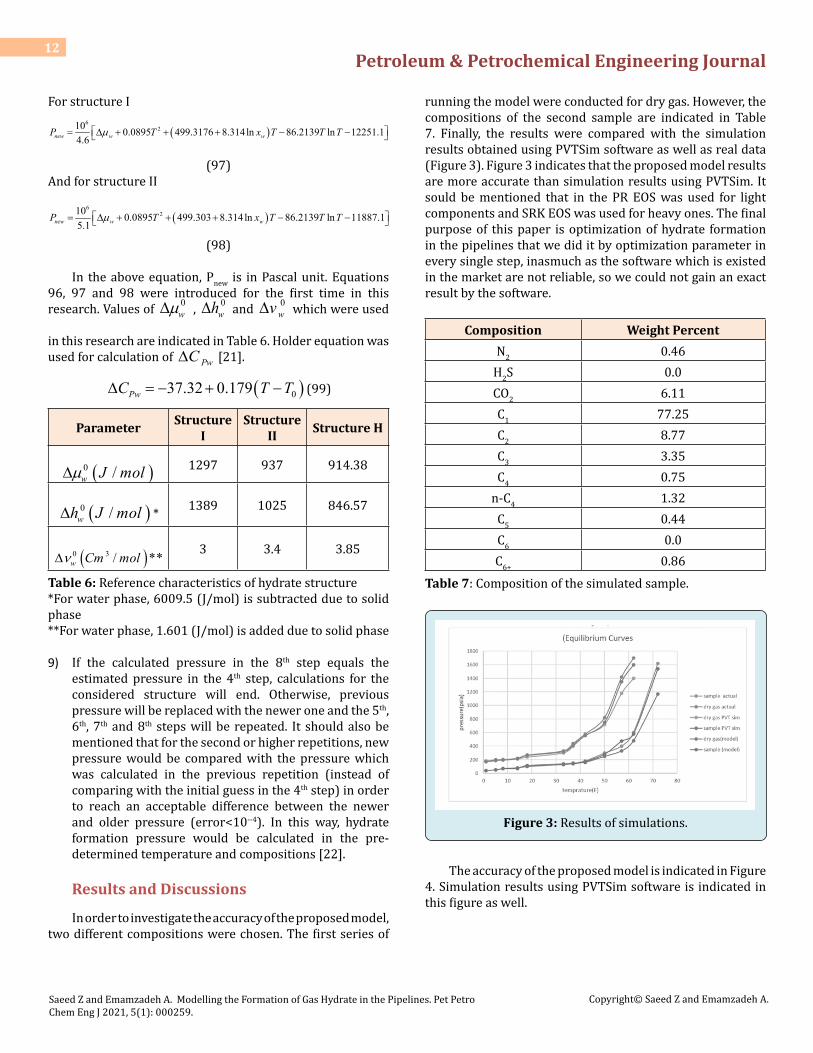
Results and Discussions
In order to investigate the accuracy of the proposed model, two different compositions were chosen. The first series of
running the model were conducted for dry gas. However, the compositions of the second sample are indicated in Table 7. Finally, the results were compared with the simulation results obtained using PVTSim software as well as real data (Figure 3). Figure 3 indicates that the proposed model results are more accurate than simulation results using PVTSim. It sould be mentioned that in the PR EOS was used for light components and SRK EOS was used for heavy ones. The final purpose of this paper is optimization of hydrate formation in the pipelines that we did it by optimization parameter in every single step, inasmuch as the software which is existed in the market are not reliable, so we could not gain an exact result by the software.
Composition Weight PercentN2 0.46
H2S 0.0CO2 6.11C1 77.25C2 8.77C3 3.35C4 0.75
n-C4 1.32C5 0.44C6 0.0C6+ 0.86
Table 7: Composition of the simulated sample.
Figure 3: Results of simulations.
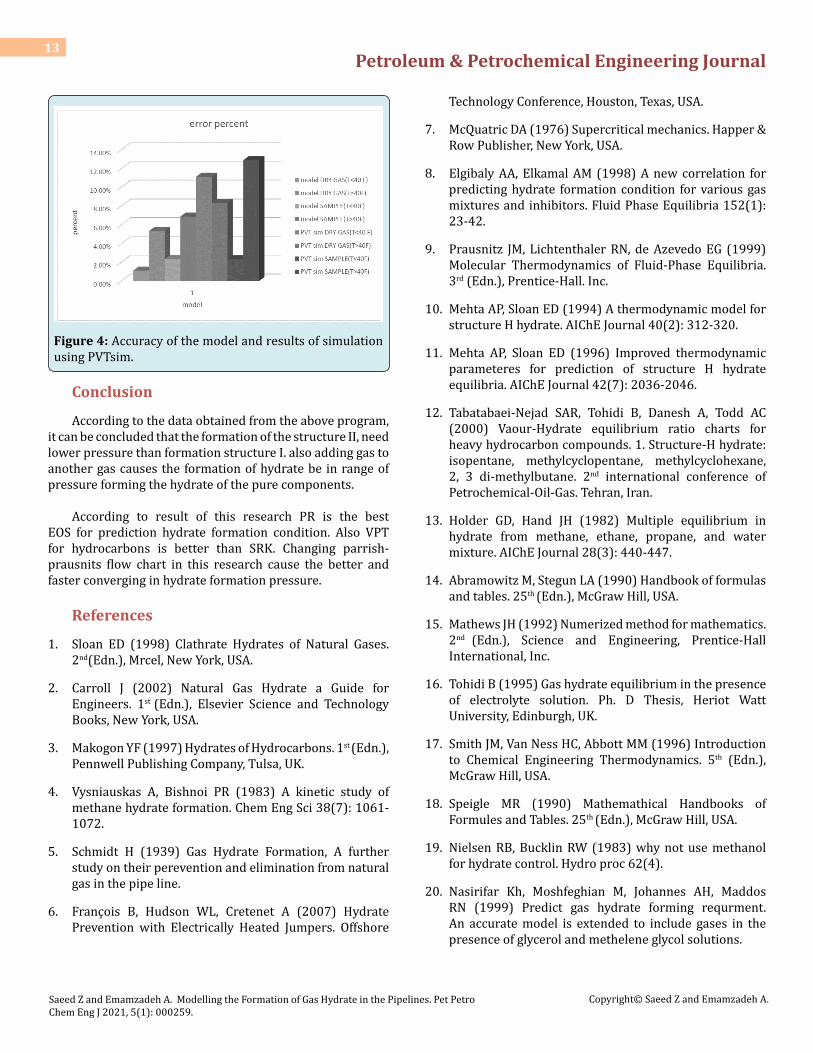
The accuracy of the proposed model is indicated in Figure 4. Simulation results using PVTSim software is indicated in this figure as well.
Petroleum & Petrochemical Engineering Journal 13
Saeed Z and Emamzadeh A. Modelling the Formation of Gas Hydrate in the Pipelines. Pet Petro Chem Eng J 2021, 5(1): 000259.
Copyright© Saeed Z and Emamzadeh A.
Figure 4: Accuracy of the model and results of simulation using PVTsim.
Conclusion
According to the data obtained from the above program, it can be concluded that the formation of the structure Ⅱ, need lower pressure than formation structure I. also adding gas to another gas causes the formation of hydrate be in range of pressure forming the hydrate of the pure components.
According to result of this research PR is the best EOS for prediction hydrate formation condition. Also VPT for hydrocarbons is better than SRK. Changing parrish- prausnits flow chart in this research cause the better and faster converging in hydrate formation pressure.
References
1. Sloan ED (1998) Clathrate Hydrates of Natural Gases. 2nd(Edn.), Mrcel, New York, USA.
2. Carroll J (2002) Natural Gas Hydrate a Guide for Engineers. 1st (Edn.), Elsevier Science and Technology Books, New York, USA.
3. Makogon YF (1997) Hydrates of Hydrocarbons. 1st (Edn.), Pennwell Publishing Company, Tulsa, UK.
4. Vysniauskas A, Bishnoi PR (1983) A kinetic study of methane hydrate formation. Chem Eng Sci 38(7): 1061-1072.
5. Schmidt H (1939) Gas Hydrate Formation, A further study on their perevention and elimination from natural gas in the pipe line.
6. François B, Hudson WL, Cretenet A (2007) Hydrate Prevention with Electrically Heated Jumpers. Offshore
Technology Conference, Houston, Texas, USA.
7. McQuatric DA (1976) Supercritical mechanics. Happer & Row Publisher, New York, USA.
8. Elgibaly AA, Elkamal AM (1998) A new correlation for predicting hydrate formation condition for various gas mixtures and inhibitors. Fluid Phase Equilibria 152(1): 23-42.
9. Prausnitz JM, Lichtenthaler RN, de Azevedo EG (1999) Molecular Thermodynamics of Fluid-Phase Equilibria. 3rd (Edn.), Prentice-Hall. Inc.
10. Mehta AP, Sloan ED (1994) A thermodynamic model for structure H hydrate. AIChE Journal 40(2): 312-320.
11. Mehta AP, Sloan ED (1996) Improved thermodynamic parameteres for prediction of structure H hydrate equilibria. AIChE Journal 42(7): 2036-2046.
12. Tabatabaei-Nejad SAR, Tohidi B, Danesh A, Todd AC (2000) Vaour-Hydrate equilibrium ratio charts for heavy hydrocarbon compounds. 1. Structure-H hydrate: isopentane, methylcyclopentane, methylcyclohexane, 2, 3 di-methylbutane. 2nd international conference of Petrochemical-Oil-Gas. Tehran, Iran.
13. Holder GD, Hand JH (1982) Multiple equilibrium in hydrate from methane, ethane, propane, and water mixture. AIChE Journal 28(3): 440-447.
14. Abramowitz M, Stegun LA (1990) Handbook of formulas and tables. 25th (Edn.), McGraw Hill, USA.
15. Mathews JH (1992) Numerized method for mathematics. 2nd (Edn.), Science and Engineering, Prentice-Hall International, Inc.
16. Tohidi B (1995) Gas hydrate equilibrium in the presence of electrolyte solution. Ph. D Thesis, Heriot Watt University, Edinburgh, UK.
17. Smith JM, Van Ness HC, Abbott MM (1996) Introduction to Chemical Engineering Thermodynamics. 5th (Edn.), McGraw Hill, USA.
18. Speigle MR (1990) Mathemathical Handbooks of Formules and Tables. 25th (Edn.), McGraw Hill, USA.
19. Nielsen RB, Bucklin RW (1983) why not use methanol for hydrate control. Hydro proc 62(4).
20. Nasirifar Kh, Moshfeghian M, Johannes AH, Maddos RN (1999) Predict gas hydrate forming requrment. An accurate model is extended to include gases in the presence of glycerol and methelene glycol solutions.

Petroleum & Petrochemical Engineering Journal 14
Saeed Z and Emamzadeh A. Modelling the Formation of Gas Hydrate in the Pipelines. Pet Petro Chem Eng J 2021, 5(1): 000259.
Copyright© Saeed Z and Emamzadeh A.
21. John VT, Papadopoulas KD, Holder GD (1985) A generalized model for prediction equilibrium condition for gas hydrates. AIChE Journal 31(2).
22. Tabatabaei-Nejad SAR (1999) Phase Behavior Modelling of petroleum wax and Hydrate. Ph.D. Thesis, Heriot-Watt University, Edinburgh, UK.


![Review of Gas Hydrate Plug Dissociation in Oil and Gas ...€¦ · permafrost region [7-12] or on the inhibition of hydrate formation in pipelines and process facilities. [13-15]](https://img.dokumen.tips/doc/110x75/60912f10a21bb63c966327e3/review-of-gas-hydrate-plug-dissociation-in-oil-and-gas-permafrost-region-7-12.jpg)


