Embed Size (px)
Citation preview

Department of Applied Mechanics CHALMERS UNIVERSITY OF TECHNOLOGY Göteborg, Sweden 2016
Modelling of cylinder system friction using P2M tool
Master’s thesis in Automotive Engineering
Abhay Pandurang Pai1, Kishan Gopal Navale
2
1- Chalmers University of Technology, Göteborg
M.Sc. Automotive engineering
2- KTH Royal Institute of Technology, Stockholm
M.Sc. Engineering design – Track Combustion Engineering


1 CHALMERS, Applied Mechanics, Master’s Thesis 2016:71
MASTER’S THESIS 2016:71
Modelling of cylinder system friction using P2M tool
Master’s Thesis in Automotive Engineering
Abhay Pai
Kishan Navale
Department of Applied Mechanics
Advanced Combustion Engineering Department
CHALMERS UNIVERSITY OF TECHNOLOGY
Göteborg, Sweden 2016

2 CHALMERS, Applied Mechanics, Master’s Thesis 2016:71
Modelling of cylinder system friction using P2M tool
Master’s Thesis in Automotive Engineering
Abhay Pai
Kishan Navale
© Abhay Pai
Kishan Navale, 2016-08-30
Master’s Thesis 2016:71
ISSN 1652-8557
Department of Applied Mechanics
Division of Advanced Combustion Engineering
Chalmers University of Technology
SE-412 96 Göteborg
Sweden
Telephone: +46 (0) 31-772 1000
Cover:
The piston from VCC used made with the help of node positions of the points.
Chalmers Reproservice
Göteborg, Sweden 2016

CHALMERS, Applied Mechanics, Master’s Thesis 2016:71 3
Modelling of cylinder system friction using P2M tool
Master’s thesis in Automotive Engineering
Abhay Pandurang Pai
Kishan Gopal Navale
Department of Applied Mechanics
Chalmers University of Technology
Abstract
The internal combustion engines have been there for more than a century now and are constantly
undergoing some improvements. Although the combustion engines have improved the human
efficiency, it has also brought upon serious problems like the exhaust emissions. Over the last few
decades, the number of automobiles have increased manifold and so has the emissions including
carbon monoxide, hydrocarbons, nitrous oxides and particulate matter. This has led to global
warming which has disastrous consequences if not kept in check.
The emission norms are designed to keep the automobiles emissions within a limit. These norms are
becoming stringent every few years to decrease the emissions by a further extent. Car
manufacturers are doing a lot of research to be ahead of the competition and be within the norm to
avoid paying hefty fines. Downsizing is considered to be the future for emission reduction. The
number of engines and the capacity is becoming smaller and turbochargers are installed for better
power and fuel efficiency. Volvo engines for example has downsized their engines from in-line 5
cylinder to 4 and now the next generation engines are 1.5 litre 3 cylinder engines. This downsizing is
one of the most effective ways to decrease the emission.
It is also known that for an engine, on an average the efficiency is only about 30 percent. Though it
has increased slightly over the last few decades, it is very difficult to improve this value substantially.
That is because most of the energy is lost as heat and there are friction losses in the engine. Part of
the heat energy which would have wasted is used in turbochargers which have improved the
efficiency. Efficiency loss due to friction is still a very big area with huge potentials and opportunities.
The thesis here is divided into two parts. The first part deals with the friction calculation in the
piston-cylinder system using the P2M software provided by MIT which studied the piston secondary
motion to calculate the friction loss. The second part deals with the effect of changes in the inputs
like the engine speed, combustion pressure etc. on the friction force and FMEP values.
Keywords: Efficiency, piston-cylinder system, piston secondary motion, MIT, friction force, FMEP.

4 CHALMERS, Applied Mechanics, Master’s Thesis 2016:71

CHALMERS, Applied Mechanics, Master’s Thesis 2016:71 5
Acknowledgement
There is a long list of people who we would like to thank for the successful thesis. First and most
important in list is our thesis supervisor Charbel Nassif from Volvo Car Corporation who has been
our constant support and believed in our ability to take this difficult challenge and produce the best
result. We would also like to thank Fredrik Strömstedt from Volvo Car Corporation who was our
technical guide for the thesis and has provided valuable insight with his enormous experience in this
subject and given us a good path to work on when the things became a bit complicated.
We would also like to thank our advisor from MIT Zhen Meng who has been in constant
communication with us for the development of this tool to work with the Volvo inputs and helped us
with his knowledge about the secondary motion of the piston. We also thank our supervisors from
our universities Sven B. Andersson from Chalmers University of Technology and Anders Hulqvist
from KTH Royal Institute of Technology for guiding us with the thesis work.
We also extend our thanks to our manager at Volvo Car Corporation Ingvar Åkesson and his entire
team for making us feel welcome and making us a part of their team in these 6 months. We would
also like to thank Lars Fahlgren from Volvo Car Corporation who offered us the opportunity to work
with this thesis. We also extend our appreciation to the entire base engines team including Director
Anders Agfors for the great environment that they have made for all the thesis students and
especially us.
We would like to thank the CAE team of Volvo for their inputs which has been helpful for us to work
with the tool.
Finally, we would like to thank our parents and our friends for their constant support during our
entire time here.

6 CHALMERS, Applied Mechanics, Master’s Thesis 2016:71

CHALMERS, Applied Mechanics, Master’s Thesis 2016:71 7
Contents
Abstract ................................................................................................................................................... 3
Acknowledgement .................................................................................................................................. 5
1. Introduction .................................................................................................................................... 9
1.1. Engine cylinder and piston system ......................................................................................... 9
1.2. Previous Work ....................................................................................................................... 11
1.3. Scope of the thesis work ....................................................................................................... 12
2. Methodology ................................................................................................................................. 15
2.1. Piston Skirt Geometry ........................................................................................................... 16
2.2. Compliance Matrix ................................................................................................................ 17
2.3. Asperity Contact Model ........................................................................................................ 18
2.4. Oil Transport ......................................................................................................................... 18
2.5. Numerical method for solution............................................................................................. 20
2.6. Separation model .................................................................................................................. 20
2.7. Calculation on grid ................................................................................................................ 21
3. Results and Discussions ................................................................................................................ 23
3.1. Comparison between MIT and VCC output data .................................................................. 25
3.1.1. Lateral Motion of the piston pin ................................................................................... 25
3.1.2. Tilting Angle of the piston ............................................................................................. 26
3.1.3. Side force exerted by the wrist pin ............................................................................... 27
3.1.4. Asperity contact forces ................................................................................................. 28
3.1.5. Hydrodynamic forces .................................................................................................... 29
3.1.6. Friction force ................................................................................................................. 30
3.1.7. Frictional power loss ..................................................................................................... 31
3.1.8. Friction energy loss ....................................................................................................... 32
3.1.9. Friction Mean Effective Pressure (FMEP)...................................................................... 33
3.2. Simulation Case 1: Low engine speed and low combustion pressure .................................. 34
3.3. Simulation Case 2: Higher initial oil film thickness ............................................................... 39
3.4. Simulation Case 3: Larger cold clearance ............................................................................. 41
4. Conclusion ......................................................................................................................................... 45
5. Future Scope ................................................................................................................................. 49
References ............................................................................................................................................ 51

8 CHALMERS, Applied Mechanics, Master’s Thesis 2016:71
List of Figures
Figure 1: Piston head [3] ......................................................................................................................... 9
Figure 2: Piston-Cylinder Nomenclature [10] ....................................................................................... 15
Figure 3: Asperity contact piston skirt model [10] ................................................................................ 16
Figure 4: Mesh for piston skirt and lands [10]. ..................................................................................... 17
Figure 5: Oil supply to the system [10] ................................................................................................. 19
Figure 6: Comparison between MIT and VCC results for Lateral Motion of piston pin ........................ 25
Figure 7: Comparison between MIT and VCC of tilting angle of piston ................................................ 26
Figure 8: Comparison between MIT and VCC data of side force exerted by wrist pin ......................... 27
Figure 9: Comparison between MIT and VCC data of asperity contact forces on thrust (left) anti-
thrust side (right) .................................................................................................................................. 28
Figure 10: Comparison between MIT and VCC data of hydrodynamic forces on thrust (left) anti-thrust
side (right) ............................................................................................................................................. 29
Figure 11: Comparison between MIT and VCC data of friction force ................................................... 30
Figure 12: Comparison between MIT and VCC of frictional power loss ............................................... 31
Figure 13: Comparison of MIT and VCC data of friction energy loss .................................................... 32
Figure 14: Lateral motion comparison of low engine speed and low peak pressure vs. base reference
case ....................................................................................................................................................... 34
Figure 15: Tilting angle comparison of low engine speed and low peak pressure vs. base reference
case ....................................................................................................................................................... 35
Figure 16: Comparison of side forces between low engine speed and low pressure and the base
reference case ....................................................................................................................................... 36
Figure 17: Comparison of friction forces between low engine speed and low pressure and the base
reference case ....................................................................................................................................... 37
Figure 18: FMEP comparison between case 1 and base reference case .............................................. 38
Figure 19: Comparison of results for the base case and higher oil film thickness............................... 42
Figure 20: FMEP comparison between case 2 and base reference case............................................. 43
Figure 21: Comparison of results for the base case and higher cold clearance ................................... 42
Figure 22: FMEP comparison between case 3 and base reference case .............................................. 43

CHALMERS, Applied Mechanics, Master’s Thesis 2016:71 9
1. Introduction
This chapter deals with the understanding of the engine-cylinder system and the scope of the thesis.
It also includes the previous work carried out in this field over the years.
1.1. Engine cylinder and piston system
The source of power for the car is the engine. The main components of the engine which are
responsible for producing the energy are the cylinder piston system. These work in conjunction with
the connecting rod, crankshaft and the powertrain to transmit the energy produced in the cylinder
head to the wheels. The fuel enters the cylinder head through the inlet valves and depending upon
petrol or a diesel engine, the spark plug or the fuel droplets through the fuel nozzle will lead to
combustion. The piston connected to the connecting rod reciprocates within the cylinder leading to
rotating motion of the crankshaft which is connected to the flywheel. The transmission then
transfers this power from the flywheel with the help of clutches and gears to the tires.
The reciprocating motion of the piston is called the primary motion. The expansion of the fuel which
burns during the combustion process causes the piston to move in the downward direction as it is
constrained in other directions due to the cylinder head. As mentioned above, this motion is
responsible for transmitting the energy from the power stroke to the crankshaft. However, it is not
rigidly constrained in the other directions. There is a small amount of clearance between the piston
and the cylinder which is essential as the piston expands due to the heat generated in the cylinder.
Although the cylinder also expands due to the heat, there is some clearance between the piston and
the cylinder. This gives rise to the lateral motion and oscillatory motion of the piston which is the
secondary motion. This motion is the main topic which will be dealt with in this thesis.
Figure 1: Piston head [3]

10 CHALMERS, Applied Mechanics, Master’s Thesis 2016:71
The primary motion of the piston accounts for only 30-35% of the total energy. Majority of the
energy is wasted as heat energy and the remainder about 10% are the total frictional losses. 40-50%
of this is the loss in the piston skirt-cylinder interaction. The lateral motion generates the friction
between the piston and the cylinder. The tilting angle of the piston is defined as the angle with
which the piston tilts towards the cylinder. The material of the cylinder liner and the material on the
piston skirt as well as the oil between the piston and the cylinder play a very major role in the
friction force generation within the cylinder.
The compression and the oil rings also play an important part in the friction generation. The pistons
which are being used by Volvo in their engine have two compression rings and one oil control ring.
The piston rings fit in the groove on the outside diameter of the piston. The main function of the
compression rings is to ensure proper sealing between the top of the piston and the bottom so that
no fuel or gases can pass down which might lead to further complications and loss of energy. The
rings also play an important part in the heat transfer to the cylinder wall as they are in direct contact
with it. Finally, the oil ring regulates the oil consumption during the strokes [2]. These areas with the
rings are referred to as lands. The top of the piston along with the first compression ring is the top
land followed by the second and the third land. There exists a chamfer region between the third land
and the piston skirt. The piston skirt is the part of the piston which controls excessive rocking of the
piston. It also has total contact with the cylinder wall and is the most important part to focus on
while studying the lateral motion of the piston.
The oil thickness in the regions mentioned above especially between the piston skirt and the cylinder
and in the chamfer region has a significant impact on the hydrodynamic forces generated by the
piston. Thickness of the film is usually in the range of about 20-40 micrometres. The oil is splashed in
to the piston from the oil sump and then flowing in the area between the piston skirt and the
cylinder liner. The oil scrapes through the cylinder liner with the help of the piston rings before
returning to the oil sump. The chamfer region acts as an oil reservoir.
The material of the cylinder liner and the piston skirt are important factors to be considered for
friction. The cylinder liner material is different than the material of the cylinders as its functions are
different. The main reason for this is that the cylinder liner has to resist corrosion and also be wear
resistance at high temperatures. It also protects the piston surface and the piston rings from wear
damage. But it is necessary for the liner material to withstand the high pressures, vibrations etc.
along with the high temperatures. A few possible options for the cylinder liner material are carbon
steel, cast PH stainless steel, cast nickel-chromium alloy, low alloy steel, and wrought PH stainless
steel [4]. A research carried out by M.F. Fakaruddin et al. [4] found out that based on durability,

CHALMERS, Applied Mechanics, Master’s Thesis 2016:71 11
operation requirements in extreme temperatures and wear resistance properties, the cast nickel-
chromium alloy or more commonly known as Inconel 713C was the best material for wet cylinder
liner applications.
Volvo uses grey cast iron as the cylinder liner material for the cylinder block which is made from
aluminium. Grey cast iron has good wear resistance, good vibration damping among other
properties like corrosion resistance and being able to withstand higher loads. These properties make
it one of the most efficient cylinder liner materials.
The piston skirt on the other hand is usually coated with a different material. The piston these days
are mostly made from aluminium or aluminium based alloys for its light weight advantages. The
piston skirt is coated with graphite. The main advantages for using graphite are that the material is
very well known for low friction and is more durable than other coatings. This makes it ideal to be
used in car pistons as this leads to lesser wear and lesser repair and maintenance costs. Other
materials for the piston skirt include polymers, composite coating with resin binder with fillers [5].
The friction generated between the piston-ring assembly and the cylinder liner accounts for about
50 % of the total engine mechanical loss as stated by Tian Tian [6]. He states that in order to reduce
the friction coefficient, there exists an optimum level of oil viscosity above which the boundary
lubrication might introduce friction. A lot of work has been done over the last two decades in the
field of reducing the friction generated in the cylinders. Some of the important work related to the
thesis will be discussed further.
1.2. Previous Work
The reduction of engine friction is an important research for improving the efficiency of the engine.
Reducing friction will not only save more fuel as lesser fuel will be required to produce the same
energy but also improve the life of the cylinder liner and the piston material as lesser forces would
mean lesser scraping of the material. This would lead to lead to lesser repair and maintenance thus
making the vehicle more desirable to the customers.
Massachusetts Institute of Technology (MIT) has done huge amount of research work in the field of
friction in the cylinder-piston system. Volvo Car Corporation is in collaboration with MIT developing
a software tool called P2M (piston secondary motion) which can be used to find out the friction
force and the tilting angle of piston as well as the FMEP and the friction coefficient values. Getting
accurate results from this tool is important as these can then be used and the piston skirt modified
or oil consumption levels changed to get lesser friction forces. MIT has been trying to improve this

12 CHALMERS, Applied Mechanics, Master’s Thesis 2016:71
tool for over a decade now and many thesis works have been carried out with the help of previous
versions of this tool. A few relevant thesis topics will be discussed further.
Most of the work focussed on using the P2M tool and the Laser Induced Fluorescence (LIF)
visualization system to understand the simulation process and to visualise actual real time results
and then compare the two results. Benoist Thirouard [7] carried out research in modelling oil
transport in piston ring pack by implementing two dimensional LIF system and presented an oil
transport scheme by integrating the major paths and mechanisms of oil transport in the piston.
Camille Baelden [8] quantified the impact of deformation of the cylinder with thermal expansion,
tilting of the piston and the oil collection in the chamfer region on the oil flow between the piston
and the cylinder. These research works were vital for the development of the P2M tool as it takes
into account the results from all these topics to give a realistic value of the frictional force and the oil
flow. An initial oil film thickness is also defined in the input model for the tool to work and this is
achieved by studies conducted by Benoist and others mentioned above.
One of the most important works carried out in the P2M development field is the research by Conor
McNally [9] who in the year 2000 made numerical model calculating the piston secondary motion
which can then be used to simulate on the computer by writing a code. The piston assembly is
considered to be a set of independent rigid bodies and equations of motions are formulated for each
part. Reynolds equation is computed for the oil film to achieve the hydrodynamic force. This is
carried out at several circumferential points (nodes) of the piston and the integration of all these
give the total lateral force generated by the piston on the cylinder. This is the heart of the P2M tool.
Future research has been carried out on this to include various additional scenarios like cylinder
deformation and deformation due to pressure and inertia in the piston to obtain close to real test rig
values for the FMEP.
1.3. Scope of the thesis work
The cylinder system stands for a major part of engine friction, both with loaded and motored engine.
For tougher friction target and increased engine specific loading, all other targets and requirements
for the engine still needs to be fulfilled mainly NVH, oil consumption and durability. Cylinder
deactivation on petrol engines can reduce CO2 due to better brake specific fuel consumption on
non-deactivated cylinder; however, it is affecting the oil consumption drastically.
Working with simulation tools is essential to be able to optimize the system. Volvo Cars has unique
capabilities for simulating cylinder system friction and correlate simulations with measurements. On
the simulation side, Volvo Cars is working in close cooperation with MIT – Massachusetts Institute of

CHALMERS, Applied Mechanics, Master’s Thesis 2016:71 13
Technology who is developing simulation tools for lubrication in internal combustion engines. The
goal of the thesis is to work on the oil transport and the friction in the piston cylinder assembly. P2M
tool from MIT is used to calculate the oil transport and friction for different cases while running the
engine. The main objective is to tune the data generated by the FEA team at Volvo Car Corporation
in a format which can be used for the tool. The results including the lateral motion, tilting angle,
friction forces among others has to be obtained by running successful simulations for the Volvo
piston.

14 CHALMERS, Applied Mechanics, Master’s Thesis 2016:71

CHALMERS, Applied Mechanics, Master’s Thesis 2016:71 15
2. Methodology
Before understanding how the research and simulation for the thesis was carried it is very important
to be familiar with the definitions that will be used in this report often.
Consider the base engine as shown in the figure 2. The two dimensional view shows the aspects of
the piston and the cylinder. The main input for the tool is the definition of the thrust and the anti-
thrust side of the piston. The left side of the cylinder is the thrust side and the right is the anti-thrust
side. In three-dimensional sense, the surfaces of the piston from the midpoint to the left end are
considered to be lying on the thrust side and so on. The naming in the above figure will be explained
in detail in the Input Manual.
Figure 2: Piston-Cylinder Nomenclature [10]

16 CHALMERS, Applied Mechanics, Master’s Thesis 2016:71
In order to simplify the calculations which the tool takes into account for generating the outputs,
there are certain assumptions which are made [1]:
Connecting rod big end is frictionless and can rotate freely relative to each other.
Wrist pin bearing is frictionless. This simplifies the calculations immensely. If the friction for
this part is considered, it would lead to creation of more mathematical models which takes
into account the lubrication of the bearing.
Engine speed is assumed to be constant throughout the whole cycle.
Wrist pin centre of gravity is assumed to be at the centre of the piston pin hole on the z-axis
as the pin offset Y_PSCG is considered 0 in the simulations run for this thesis.
The complete dynamics and kinematics based along with the relevant equations on which the tool
has been developed has been explained in the thesis ‘Modelling Piston Skirt Lubrication in Internal
Combustion Engines’ by Dongfang Bai [1] from MIT. In this thesis, the main parts of it will be
elaborated which has relevance to the topics being dealt for the current research.
2.1. Piston Skirt Geometry
The piston skirt has ovality along the circumference. The thrust and anti-thrust have been defined
earlier and the pin axis is perpendicular to the two sides. The piston has more diameter along the
piston skirt to prevent the top lands brushing against the bore and the friction is only focused in the
skirt area. The surface roughness and wavelength of the piston skirt is also defined in the input
model. To give a better understanding of the same, refer figure 3.
Figure 3: Asperity contact piston skirt model [10]

CHALMERS, Applied Mechanics, Master’s Thesis 2016:71 17
The piston skirt is the main area of interest for the tool. By defining the piston skirt area, the
calculation domain is generated. The tool will then work in the calculation domain taking into
account the piston skirt and the piston top land for generating the result. As stated in the literature
above, the tool applies numerical method of calculation for the piston. This is done by generating
grids or meshes and the points at the intersection are the node points at which the forces and the
various parameters are calculated. The reason for the coarse grids and the fine grids for specific
calculations has been described in the further part of the methodology. These mesh points are
mainly used for generating all the output parameters. For getting a general idea about the grid mesh,
refer to the figure 4.
2.2. Compliance Matrix
The skirt and the liner are considered to be flexible bodies by the tool so they undergo deformation
when loads act on it. These deformations are due to the combustion pressure and engine speed
which give rise to force due to pressure and inertia forces. These two inputs are defined in the input
files by the user as well.
The piston skirt is divided into coarse and fine grids as shown above in figure 4. The deformation of
the nodes d is vector as it is defined in the x, y and z directions. The force which acts on the nodes is
F. Compliance C is a constant which relates the deformation to the force as
d=C*F
The piston pin is locked and the deformation at each node is calculated with unit force. This is then
saved in a matrix form which satisfies the compliance equation mentioned earlier. In the current
analysis, the compliance for the Volvo piston skirt was available and is used and a definite necessity
for the tool to process the input and move towards the next step which is running the main P2M tool.
The one for the liner was not calculated but the tool can take the liner compliance into account and
give better results.
Figure 4: Mesh for piston skirt and lands [10].

18 CHALMERS, Applied Mechanics, Master’s Thesis 2016:71
2.3. Asperity Contact Model
When the piston skirt has contact with the bore, there will be surface to surface contact along with
the hydrodynamic lubrication. This contact is defined as the asperity contact. It is necessary to
calculate the pressure generation due to this asperity contact. The asperity depends on the surface
geometry and the material used. The wavelength Ʌ and the wave height Ω is defined in the input
model. Also refer figure 3 for visual understanding of the surface roughness and tooling marks.
Analytical solution is used for a blunt wedge against a plane to calculate the asperity contact
pressure [10] given as
Where h is the height of the tool marks and can also be seen from figure 3.
The program will calculate the constants C1 when the other inputs like wavelength, wave height and
the Young’s Modulus is specifies in the input model file.
2.4. Oil Transport
The oil thickness within the piston and the cylinder plays a vital role and is governed by the
boundary condition defined for it. The system is divided into three parts namely the chamfer area
just below the oil control ring, the skirt region and the oil on the liner below the skirt. The clearance
between the chamfer and the liner is much bigger compared to the skirt and holds more oil and also
acts as oil reservoir which feeds oil in the skirt region during the motion of the piston. The oil
exchange with the surroundings includes oil splash to the liner, scraping down of oil when the piston
moves down towards the bottom dead centre position and oil released through the oil control ring
grooves or drain holes. The initial oil film thickness and the oil splash are defined in the input model.
The current simulations for this thesis do not consider additional oil supply to the system as the
input file for the same is not defined. When the skirt and the liner are in direct contact with each
other, no oil can pass due to zero clearance. This statement is true when a perfect straight shape is
assumed for the liner and the triangular tooling marks are assumed for the skirt. In reality however,
the shapes are not perfect and there will always be a thin film of oil that can pass through these
irregularities. The oil film thickness in solid to solid contact in the tool plays importance as too small
value will lead to rapidly changing pressure profiles which cannot be captured on the fine grid. In the
input, an initial value is set and the program automatically increases the oil film thickness when
convergence is hard to achieve. The flow phenomena governing the oil motion is the Couette and
Poiseuille flow where the oil attachment occurs between the piston skirt and the cylinder liner.

CHALMERS, Applied Mechanics, Master’s Thesis 2016:71 19
Figure 5: Oil supply to the system [10]
The details of the oil flow during the piston motion is explained in detail in Dongfang Bai’s thesis [1]
and a summary of that study has been presented in this thesis report.
The equation which is used to solve the oil in the skirt region is the Universal Reynolds’ Equation
with separation. The thickness of oil within different regions of piston mentioned earlier and the
liner changes as the piston moves from top end to bottom end and vice-versa. This is because of the
inertia of the piston as well as the scraping of oil and such other factors. This leads to different
boundary conditions for the calculation of the oil film by the tool at different piston positions.
When the piston is moving downward, till mid-position, the inertia will be acting upwards which
pushes the oil in the chamfer region upwards while when the piston moves from the mid-stroke to
downward position, the inertia acts downwards and will move the oil downward relative to the
piston. At this instant, the oil may move from chamfer to the skirt region. But as the liner is moving
up relative to the piston, it tries to push the oil back in the chamfer region leading to oil recirculation
in the chamfer region.
When the piston is moving upwards after the bottom dead position, the inertia first acts downwards
till the mid-stroke position and will push oil downwards relative to the piston. Also the liner moves
downward relative to the piston which also pushes the oil downwards. After mid-stroke however,
there is less oil in the chamfer region as lot of oil from the chamfer seeped to the skirt region. Piston
deceleration and the inertia acting upwards forces the oil to move upwards relative to the skirt back
into the chamfer area.

20 CHALMERS, Applied Mechanics, Master’s Thesis 2016:71
One of the features of the tool is that the calculation for the hydrodynamic and asperity contact is
done in the skirt region only and this is fine as this phenomenon occur only in the skirt region and
not in the chamfer or the land region to a great extent.
2.5. Numerical method for solution
The universal Reynolds’ equation is used to solve the hydrodynamic forces and asperity forces while
considering the motion of the oil in the piston-cylinder system. The piston skirt area is divided in
grids as shown in Figure 4. For complete method of defining the variables and solving the Reynolds’
equation refer to chapter 4 of Donfang Bai’s thesis report [1]. The mass flow of the oil during the
upward and downward motion of the piston is calculated with the equations for mass flow written
for each case, the details of which are available in the mentioned chapter above.
Some assumptions for the Reynolds’ equation that the tool uses are described below [12]:
The oil is Newtonian for the equation to be true.
The fluid viscous forces are much higher in magnitude than the inertia forces which is the
main principle of the Reynolds number.
Variation of the oil film is negligible.
The oil film thickness is much less than the width and length of the surface which negates
the effect of curvature.
2.6. Separation model
The solution using Reynolds’ equation assumes full attachment assumption in the partial film region
and does not consider separation phenomenon. There is a different separation model defined for
the tool as separation occurs at different phases within the piston-cylinder system. Two control
volumes are defined with one which has oil on the piston skirt and the other similarly on the liner.
These oil films are separated. The local oil fraction is calculated for different phenomenon which
assumes either full attachment or separation. This local oil friction is the average of the oil film
thickness on skirt and the liner surface respectively.
If hos is the oil film thickness on skirt surface and hoL is the oil film thickness on the liner surface and
hc is the local clearance between the two surfaces.
The local oil fraction is given as follows
Local oil fraction =ℎ𝑜𝑠 + ℎ𝑜𝐿
h𝑐

CHALMERS, Applied Mechanics, Master’s Thesis 2016:71 21
Total separation occurs when there is gas between the oil film of the skirt and the liner. A threshold
is defined in the model and the oil fraction less than this value implies separation or else full
attachment. To solve the model, the Couette flow term which consists of the product of the local oil
fraction, displacement in x-direction (secondary motion direction) and magnitude of z-direction
displacement (reciprocating motion direction) and the time step with the oil film thickness on liner is
calculated using explicit method before each time step. This means that the oil fraction of the
control volume as defined earlier at previous time is checked. Finally, a set of equations are
formulated which have been explained in Bai’s research paper [1] based on which the tool computes
the different outputs discussed in the results section of the report.
One drawback of this method is that the tool takes time steps meaning jumps when it changes from
partial film to full attachment as it crosses the threshold number. In reality, the transition is
smoother and so the calculation is not 100 percent accurate but is necessary to be able to form
equations for solving the partial film phenomenon.
2.7. Calculation on grid The structural deformation is defined on the coarse grid as the deformation is generally smooth and
using a coarse grid will not lead to a significant loss of accuracy. The lubrication calculation on the
other hand needs to be very accurate as the pressure distribution depends on the oil availability and
is hence defined on the fine grid. Interpolation over the coarse grid is used to define the
deformation over the fine grid. Lubrication calculation, pressure distribution, oil transport and the
shear stress is calculated on the fine grid while the normal forces and frictional forces is calculated
on the coarse grid first and the results are then interpolated to get the final output over the fine grid.
The crux of the tool is to define the input in the way that the tool requires. The piston, bore are
defined by their node positions. Thermal deformations of those are taken into account and are
defined by node positions. The deformation due to inertia of the piston and the combustion
pressure is also defined by the node positions of the deformations. Thus, it is necessary to define the
node positions properly to be able to get accurate results. This thesis work dealt mainly with
correcting the input data generated by the FEA team as the data format was not compatible with the
requirement of the tool.

22 CHALMERS, Applied Mechanics, Master’s Thesis 2016:71

CHALMERS, Applied Mechanics, Master’s Thesis 2016:71 23
3. Results and Discussions
The main output from the P2M tool are lateral motion of the piston pin, tilting angle of the piston,
the normal forces exerted on the piston, the hydrodynamic forces due to the oil film, the friction
forces and the friction mean effective pressure. The plots from the MIT piston were used as a
reference to understand the similarities and the differences with the VCC piston. The description of
the above mentioned parameters are as follows
Lateral Motion – The piston motion during the cycle is seen with the help of a plot. The piston pin
motion at different crank angle degrees is plotted. The motions towards the anti-thrust side are
represented as negative values while the motions towards the thrust side are represented as
positive values. The lateral motion depends on factors like the clearance between the cold piston
and bore, the thermal expansion of the two once the cycle starts and the oil film thickness
between the different parts of the piston namely skirt, chamfer area and the lands and the bore.
Tilting Angle – The piston has the tendency to tilt because of the clearance that exists between
the piston and the bore. This tilting in degrees is the second output plotted. It gives an idea about
which direction the piston tilts and by how much at different crank angle degrees. Positive values
here indicate that the piston tilts clockwise and negative values indicate anticlockwise direction.
In other words, positive values mean tilting towards the anti-thrust side and the negative values
means tilting towards the thrust side of the cylinder.
Normal forces exerted on the piston – This plot gives the magnitude and direction of the asperity
contact force, hydrodynamic force as well as the side force exerted by the wrist pin on the piston.
Positive values for the side force indicate the force is pointing to the thrust side and negative
values to anti-thrust side. The asperity contact forces are significant in understanding the
magnitude of forces when the piston hits the thrust or the anti-thrust side at different angles. It
gives a good idea about the motion of the piston at different crank angles helping understand
what happens during the reciprocating motion of the piston at different strokes.
The hydrodynamic force results from the oil film in the clearance between the piston and the
cylinder. This layer of oil film keeps changing because of the thermal expansion as well as
reciprocating motion of the piston. This oil film is very important to decrease the friction as it
lubricates the area between the piston and the cylinder. Without this layer, the asperity contact
force as well as the frictional forces would become very high.
Frictional force and frictional losses – The friction force resulting due to the secondary motion of
the piston is plotted for every crank angle degrees over a cycle. The power loss and energy loss

24 CHALMERS, Applied Mechanics, Master’s Thesis 2016:71
due to the friction force is also plotted on the same graph. The power loss is then used to
calculate the Friction Mean Effective Pressure (FMEP).
FMEP – The FMEP value is saved in a text file for the whole cycle. There are 5 columns which
indicate the FMEP over the cycle, FMEP on thrust and anti-thrust and FMEP from asperity contact
on thrust and anti-thrust side respectively. For the tool to generate FMEP values, it needs to run
at least for 1 cycle or 720 degrees.
A number of different simulation cases have been run to understand the consequences of changing
different input parameters like pressure, cold radial clearance, oil film thickness etc. on the friction
force and other outputs as mentioned above.
MIT case has been taken as a reference to compare with the VCC piston results. The following plots
show the difference in various parameters as described above of these two cases. The plots below
show the curves over 2 cycles of a 4-stroke engine i.e., 1440 crank angle degrees. This is done to see
the repeatability of the results after the first cycle. An explanation for the differences between the
two pistons will follow in the coming explanations.

CHALMERS, Applied Mechanics, Master’s Thesis 2016:71 25
3.1. Comparison between MIT and VCC output data
3.1.1. Lateral Motion of the piston pin
The lateral motion of the piston pin depends largely on the available clearance between the piston
and the bore. The final value takes into consideration the thermal deformations of the bore and the
piston skirt and the surface roughness along with the nominal diameter of the bore and cold which is
specified in the input model file.
The positive values indicate the motion of the piston towards the thrust side and the negative values
indicate the motion of the piston towards the anti-thrust side. The lateral motion of the MIT piston
ranges between 30 micrometre on thrust side and 15 micrometre on anti-thrust side. In case of the
Volvo piston the variation is between 15 micrometre on thrust side and 9 micrometre on anti-thrust
side. This is attributed to the fact that the clearance between the final positions of the piston skirt
and the bore is higher in case of MIT than in case of VCC. It can also be seen that the lateral motion
is maximum just after the combustion thus proving that the maximum lateral motion occurs
immediately after the power stroke.
It can be observed that the lateral motion is same at a few crank angle degrees. This is due to few
errors in the input files that were available. With appropriate input files, the curve would be similar
to the MIT piston.
Figure 6: Comparison between MIT and VCC results for Lateral Motion of piston pin

26 CHALMERS, Applied Mechanics, Master’s Thesis 2016:71
3.1.2. Tilting Angle of the piston
Figure 7 shows a lot of deviation between the MIT piston and the VCC piston. Positive values indicate
the tilting of the piston clockwise and the negative values indicate the tilting of the piston anti-
clockwise. The MIT piston data shows the tilting angle variation between 0.24 degrees clockwise to
0.12 degrees anti-clockwise. The VCC data shows the same between 0.12 degrees approximately on
both sides. This is as a result of lesser clearance as well as no piston pin offset. The pin offset is
defined in the input model. For VCC simulations the offset was 0 in this simulation case while MIT
had a pin offset of 0.5 mm.
It can also be observed that the curve followed by both the curves varies quite a bit. While the MIT
tilts on one side for more crank angle degrees, the VCC piston turns the other way every time the
stroke of the piston changes from top to bottom and vice-versa. The maximum tilting angle is during
the intake stroke as against the power stroke seen in case of MIT. The reasons for these anomalies
range from input data to the compliance matrix data available from the FEA department which was
calculated for steel piston instead of aluminium. However, it is not possible to pin point on these
reasons for the deviations seen in figure 7.
Figure 7: Comparison between MIT and VCC of tilting angle of piston

CHALMERS, Applied Mechanics, Master’s Thesis 2016:71 27
3.1.3. Side force exerted by the wrist pin
Figure 8 shows the side force exerted by the wrist pin to the piston skirt. The positive values indicate
the magnitude of the force on the thrust side and the negative values indicate the magnitude of the
force on the anti-thrust side. As seen above the Volvo data and the MIT data are almost identical in
the curve path followed. This shows that as far as this data is concerned, it depends mostly on the
crank-pin data specified in the input model and the input pressure apart from the clearance. It does
not depend on other input data needed for various other parameters which might have given rise to
anomalies if it did.
The maximum force is just after the spark ignition in the engine. This makes sense as the extreme
pressure after the ignition will result in maximum side forces. The magnitude of the side force is
higher in VCC than in MIT case. This is because it depends on data defined in the input model which
includes pin offset, moment of inertia of the piston, connecting rod and the pin, and the weight of
the piston as well.
Figure 8: Comparison between MIT and VCC data of side force exerted by wrist pin

28 CHALMERS, Applied Mechanics, Master’s Thesis 2016:71
3.1.4. Asperity contact forces
Asperity is defined as the surface unevenness or the roughness of the material. The force due to the
roughness on the thrust and the anti-thrust side called the asperity contact forces are shown in
figure 9. The magnitude of forces are much higher for the VCC piston compared to MIT piston on the
thrust side while the anti-thrust side, the MIT does not have asperity contact after the initial 20
crank angle degrees.
The higher forces on the thrust side show that the piston hits the thrust side more than the anti-
thrust side during the cycle. This is also corroborated by the lateral motion plot where the lateral
motion towards the thrust side is higher than the anti-thrust side. The peak for the asperity force
occurs after ignition towards the anti-thrust side which has a magnitude of 5000 N approximately.
This shows that the piston is moving towards the thrust side after the ignition.
The anti-thrust side for the VCC data in comparison to the MIT data shows a lot of variation. There is
an anti-thrust asperity contact force up to a peak of 630 N for VCC piston. The asperity contact data
depends on the surface roughness of the material as well as the clearance between the piston skirt
and the bore. This might be one of the reasons for the difference in the results.
Figure 9: Comparison between MIT and VCC data of asperity contact forces on thrust (left) anti-thrust side (right)

CHALMERS, Applied Mechanics, Master’s Thesis 2016:71 29
3.1.5. Hydrodynamic forces
The forces exerted on the oil film thickness due to the lateral motion of the piston skirt towards the
thrust and the anti-thrust side are the hydrodynamic forces shown in figure 10. The peak forces are
maximum after ignition on the thrust side and as seen the MIT has higher hydrodynamic force on
both thrust and the anti-thrust side.
The hydrodynamic forces exerted by the piston skirt on the liner have a lot of significance on the
friction forces. With proper lubrication, the effects of piston scuffing can be reduced by a great
extent. In the simulation cases, only the initial oil film had been defined in the input model and
additional oil film supply during the piston motion has not been considered. With the addition of
that file, the results for the hydrodynamic forces and the resulting friction would vary compared to
the base reference cases which have been evaluated in this thesis work.
Figure 10: Comparison between MIT and VCC data of hydrodynamic forces on thrust (left) anti-thrust side (right)

30 CHALMERS, Applied Mechanics, Master’s Thesis 2016:71
3.1.6. Friction force
The data generated in this column through the tool is the most important output for this thesis. It
gives the forces due to the secondary motion of the piston at the skirt-liner interface. The positive
values indicate the friction forces on the thrust side and the negative values indicate the forces on
the anti-thrust side. As seen in figure 11, the nature of the curve in both the cases is the same. The
friction force is towards the thrust side when the lateral motion is towards the thrust side and vice-
versa.
The magnitude of forces in case of Volvo piston is higher than that of MIT piston. The peak value of
the MIT data after the ignition is 137 N in the second cycle while for the peak value for the VCC data
at the same crank angle is 183 N. The friction force depends on the friction coefficient of the
surfaces in contact which was higher in case of VCC at 0.08 as opposed to MIT which was 0.03. It also
depends on the oil film thickness the final clearance between the piston skirt and the bore after the
thermal expansion.
Also, the VCC friction data is slightly erratic compared to the MIT data. The reasons for this are
similar to the difference in results in previous cases like error in compliance data and inertia and
pressure deformations. Bore thermal deformations used are MIT’s as the VCC data was incompatible
to be used with this tool.
Figure 11: Comparison between MIT and VCC data of friction force

CHALMERS, Applied Mechanics, Master’s Thesis 2016:71 31
3.1.7. Frictional power loss
The power loss due to friction data is used for calculating the FMEP values over the complete cycle.
The trend that the two pistons follows is similar as seen in the plot above but the peak values of the
VCC piston are higher approximately 3460 W compared to 2340 W of the MIT piston. This power loss
is the power lost to overcome the friction between the piston-cylinder systems. In other words, this
graph must follow the same pattern as the friction forces plot in the plot above. The power loss data
is available only in terms of magnitude and not in direction hence no thrust and anti-thrust power
loss separately. However, the power loss and the friction plots can be compared to understand
when the power loss happens towards thrust and anti-thrust.
Figure 12: Comparison between MIT and VCC of frictional power loss

32 CHALMERS, Applied Mechanics, Master’s Thesis 2016:71
The FMEP is calculated from the power loss by the following formula:
𝐹𝑀𝐸𝑃 =𝑃 ∗ 𝑁 ∗ 600 ∗ 𝑛𝑐
𝑉𝑑 ∗ 𝑛
FMEP = Friction Mean Effective Pressure over the cycle (bar)
P= Frictional Power Loss (Watt)
nc = Number of revolutions per cycle which is 2 for a 4-stroke engine
Vd = Displacement volume (cu.m)
N= Engine Speed (rpm)
3.1.8. Friction energy loss
The final plot output from the tool is the work friction energy loss. The curve trend is similar in both
cases and the peak values are 11 J for Volvo piston and 7 J for MIT piston. The maximum energy loss
as seen in figure 12 is at the end of each cycle as it is not the absolute value but the accumulated
friction energy loss over the complete cycle.
Figure 13: Comparison of MIT and VCC data of friction energy loss

CHALMERS, Applied Mechanics, Master’s Thesis 2016:71 33
3.1.9. Friction Mean Effective Pressure (FMEP)
Table 1: Comparison of MIT and VCC of FMEP values (all values in bars)
MIT
FMEP (ith
cycle) FMEP (thrust) FMEP (anti-
thrust)
FMEP from
asperity (thrust)
FMEP from
asperity (anti-
thrust)
Cycle 1 (0-720
CAD)
1.854199e-001 1.258643e-001 5.955569e-002 5.938762e-002 1.349374e-004
Cycle 2 (721-
1440 CAD)
2.208365e-001 1.635669e-001 5.726954e-002 1.109999e-001 0.000000e+000
VCC
FMEP (ith
cycle) FMEP (thrust) FMEP (anti-
thrust)
FMEP from
asperity (thrust)
FMEP from
asperity (anti-
thrust)
Cycle 1 (0-720
CAD)
2.673459e-001 1.938496e-001 7.349633e-002 1.245211e-001 2.281095e-002
Cycle 2 (721-
1440 CAD)
2.643063e-001 1.944686e-001 6.983772e-002 1.297459e-001 2.111408e-002
The total mean effective pressure available by burning the fuel is called the Indicated Mean Effective
Pressure. The useful work available from the engine is the Brake Mean Effective Pressure. The
difference between the two is the Friction Mean Effective Pressure. It is the effective pressure
required to overcome the friction in the engine.
The challenge for the automotive industries is to make the FMEP values as low as possible.
Improving this value depends on the skirt design, oil film thickness, expansion due to heat, as well as
the friction of the mating surfaces like the piston skirt material and the bore.
In order to show the effects of changing the various input parameters on the FMEP values, a number
of simulations have been run. Different cases like changing the viscosity of oil, different engine
speeds and different combustion pressure, different oil film thickness etc. have been simulated using
the tool to understand how the output parameters described above change with the change in one
or two input parameters.
34 CHALMERS, Applied Mechanics, Master’s Thesis 2016:71
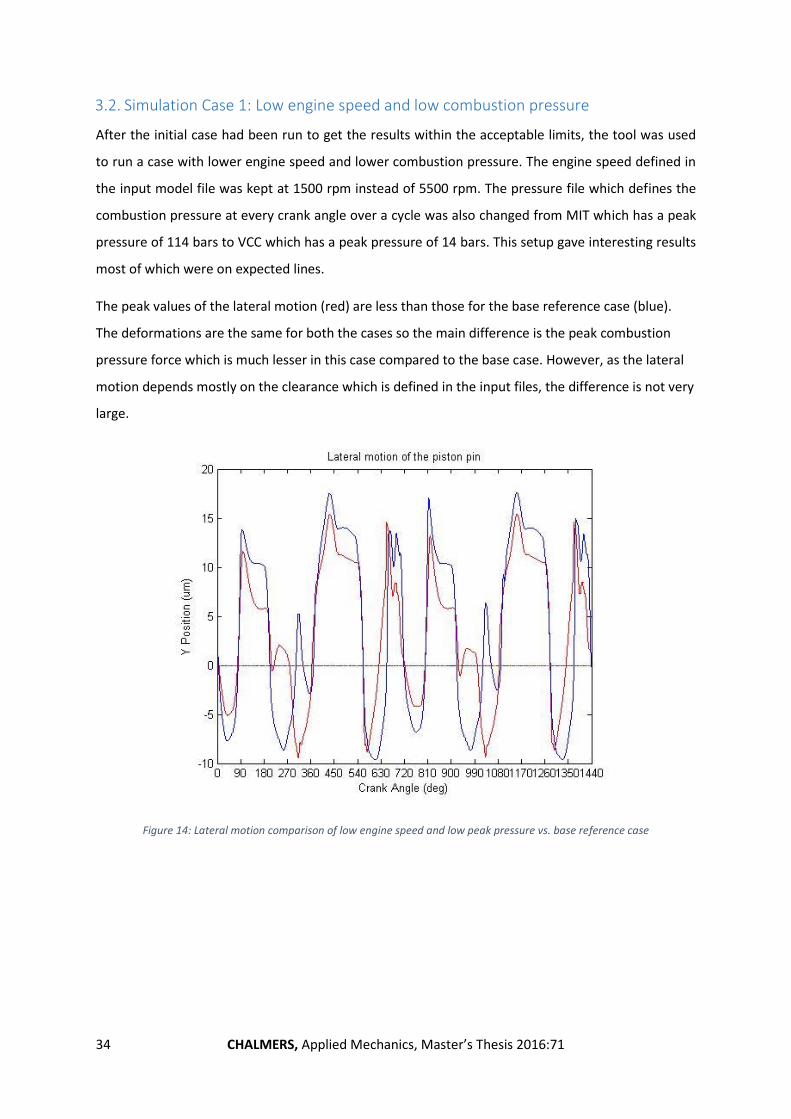
3.2. Simulation Case 1: Low engine speed and low combustion pressure
After the initial case had been run to get the results within the acceptable limits, the tool was used
to run a case with lower engine speed and lower combustion pressure. The engine speed defined in
the input model file was kept at 1500 rpm instead of 5500 rpm. The pressure file which defines the
combustion pressure at every crank angle over a cycle was also changed from MIT which has a peak
pressure of 114 bars to VCC which has a peak pressure of 14 bars. This setup gave interesting results
most of which were on expected lines.
The peak values of the lateral motion (red) are less than those for the base reference case (blue).
The deformations are the same for both the cases so the main difference is the peak combustion
pressure force which is much lesser in this case compared to the base case. However, as the lateral
motion depends mostly on the clearance which is defined in the input files, the difference is not very
large.
Figure 14: Lateral motion comparison of low engine speed and low peak pressure vs. base reference case

CHALMERS, Applied Mechanics, Master’s Thesis 2016:71 35
The tilting angle depends more on the pin offset and clearance than the engine speed and the
combustion pressure. In the plot above, similar to the lateral motion, it can be seen that the peak
values are slightly less but not significant changes compared to the base reference case.
The tilting angle depends more on the pin offset and clearance than the engine speed and the
combustion pressure. In the plot above, similar to the lateral motion, it can be seen that the peak
values are slightly less but not significant changes compared to the base reference case.
The tilting angle depends more on the pin offset and clearance than the engine speed and the
combustion pressure. In figure 15, similar to the lateral motion, it can be seen that the peak values
are slightly less but not significant changes compared to the base reference case.
Figure 15: Tilting angle comparison of low engine speed and low peak pressure vs. base reference case

36 CHALMERS, Applied Mechanics, Master’s Thesis 2016:71
The main parameters that the engine speed and the pressure influence are the forces within the
piston including the frictional forces. This is evident in figures 16 and 17.
The side force as seen above is one-sixth of the original value. The curve trend looks smooth
however that is because of the scale and the original curve trend for the new case is similar to the
reference case. This plot was important as a proof that with the same deformations in both cases,
the tool gives results on expected lines. Lower engine speed and lower combustion pressure has to
give lesser peak normal forces.
Figure 16: Comparison of side forces between low engine speed and low pressure and the base reference case

CHALMERS, Applied Mechanics, Master’s Thesis 2016:71 37
Figure 17: Comparison of friction forces between low engine speed and low pressure and the base reference case
The friction forces, like the side forces above for the new simulation case is one-sixth of the original
value with peak at 30 N after ignition. The power loss and the accumulated work loss are also similar
which gives the FMEP values approximately one-sixth of the base reference. This comparison of the
FMEP values can be better shown in figure 18.

38 CHALMERS, Applied Mechanics, Master’s Thesis 2016:71
Figure 18: FMEP comparison between case 1 and base reference case
Where the numbers 1-5 on the x-axis indicate
1- FMEP over the whole cycle. This is the FMEP value over 720 crank angle degrees.
2- FMEP (thrust). This is the FMEP value on the thrust side of the piston.
3- FMEP (anti-thrust). This is the FMEP value on the anti-thrust side of the piston.
4- FMEP (thrust due to asperity). This is the FMEP value due to asperity or the surface roughness of
the piston on thrust side.
5- FMEP (anti-thrust due to asperity). This is the FMEP value due to asperity or the surface
roughness of the piston on anti-thrust side.

CHALMERS, Applied Mechanics, Master’s Thesis 2016:71 39
3.3. Simulation Case 2: Higher initial oil film thickness
The oil film thickness between the piston and the bore is very important and plays a major role in
the friction forces within the piston-cylinder system as has been explained earlier as well in the
hydrodynamic forces section. A very small oil film would give rise to lot of scuffing of the piston. The
events that lead to this phenomenon are as follows:
The shortage of oil between the piston ring and the liner causes plastic deformation in
surface liners.
As the clearance between the piston and the liner is in terms of microns, with the absence of
oil, the contact area between the piston skirt and the liner increases.
This leads to metallic contact causing adhesion and leading to wear.
This scuffing is avoided by having oil spray in the piston during the start of every cycle when the
piston moves towards the bottom dead position. This oil spray lubricates the contact area between
the piston skirt and the cylinder liner preventing metallic contact and thus reducing wear and
increasing the life of the engine. Many car manufacturers have an additional oil film supply during
the cycle in between to ensure good lubrication. However, in this study, only initial oil film thickness
between different parts of the piston like the piston lands, piston chamfer and the piston skirt and
the cylinder liner are defined in the input model text file. The program does have the ability to deal
with additional oil film supply as well however it requires a special input file to be defined for the
same.
The initial oil film thickness for this simulation case was increased from 15 micrometre to 35
micrometres. The simulation gave interesting results. The output values for all the outputs did not
change significantly especially the side force and friction force was almost the same. The peak
friction force was less by only 6 N compared to the base reference case. The tilting angle in the
beginning of the cycle was bit smoother compared to the base case. This can be seen in the plot
below.

40 CHALMERS, Applied Mechanics, Master’s Thesis 2016:71
Figure 19: Comparison of results for the base case and higher oil film thickness
The hydrodynamic forces increased by 60 N on both the thrust and the anti-thrust side. This is to be
expected as more oil would lead to higher hydrodynamic forces. As seen above, the changes from
the base case are only in the initial 90 crank angle degrees after which it almost follows the
reference curve. The inference that can be drawn from this is that the initial oil film thickness does
not play a major role in the friction forces as the oil will move with the motion of the piston. This is
more evident in the FMEP comparison as shown in figure 20.

CHALMERS, Applied Mechanics, Master’s Thesis 2016:71 41
Figure 20: FMEP comparison between case 2 and base reference case
The FMEP values as seen decreases very less for the one with higher initial oil film thickness
compared to the base reference case. The difference in the peak values over the whole cycle is less
than one-hundredth. Of the different FMEP values, the 4th one which is the FMEP due to asperity on
the thrust side of the piston shows more change compared to the other graphs. This is also proof
that the tool works well as more oil film thickness leads to lesser surface roughness especially on the
thrust side as the thrust side is in contact with the liner after the ignition.
3.4. Simulation Case 3: Larger cold clearance
The cold clearance is defined as the clearance available between the cold piston and the cold bore
which means that the thermal expansions are not considered. There has to be some clearance
between the piston and the bore to account for the thermal expansions as well as oil film to
lubricate the area between the two. This is also important to prevent the wear of the piston and the
liner material as insufficient clearance will lead to increased wear. On the other hand, clearance
more than the optimal value will lead to vibration of the piston within the cylinder and could lead to
more friction.

42 CHALMERS, Applied Mechanics, Master’s Thesis 2016:71
Figure 19: Comparison of results for the base case and higher cold clearance
To understand how the tool responds to the change in the cold clearance, for the third simulation
case, the cold clearance between the piston skirt diameter and the cold bore was increased from 25
micrometre to 45 micrometre. The results on the output plots are as shown in figure 21.
The lateral motion and the tilting angle as mentioned earlier depend mostly on the available
clearance between the piston skirt and the bore. So increasing the clearance by 20 micrometre
increases the peak lateral motion values and tilting angle as seen in figure 21. The side forces are
almost the same but the friction forces increase slightly from 180 to 201 N. it is interesting to note
the curve trend between 0 to 90 crank angle degrees in all the plots above. This is due to the fact
that in the first 90 degrees, there is virtually no thermal expansion and this leads to piston vibration
within the cylinder. However, in later part of the cycle, the piston and bore expand thermally
decreasing the overall clearance and thus reducing the piston vibrations.

CHALMERS, Applied Mechanics, Master’s Thesis 2016:71 43
Figure 202: FMEP comparison between case 3 and base reference case
The FMEP values gave an interesting insight into the importance that the clearance plays on the
Friction mean pressure. There is a significant increase in the overall FMEP as well as the thrust and
anti-thrust FMEP values for the cold clearance case compared to the base reference case. This is
because of the fact that higher cold clearance gives rise to more lateral motion which means the
piston is hitting the cylinder harder leading to more friction force, more power loss and hence higher
FMEP values.

44 CHALMERS, Applied Mechanics, Master’s Thesis 2016:71

CHALMERS, Applied Mechanics, Master’s Thesis 2016:71 45
4. Conclusion
The working of the tool is on the basis that has been summarised in the methodology of this report
and the detailed explanation in Dongfang Bai’s [1] research. The lubrication between the piston skirt
and the cylinder affects different properties like friction, wear rate due to scuffing and oil
consumption during the piston motion. The solution for the tool is divided in two main parts. One
part deals with full flow attachment and applies the Universal Reynolds’ equation to calculate the
output parameters while the other part deals with the separation model and applies the relevant
differential equations for obtaining the solution. The coarse and the fine grids defined for the tool is
where the tool is actually working. The coarse grids solutions include the solutions for the normal
and the frictional forces which are then interpolated to the fine grids. The fine grids contain the
calculation for the lubrication, pressure distribution, shear stress and the oil distribution. This
differentiation helps in the results being accurate as well as the simulation time being reasonable.
The friction force and the FMEP values by the tool are within the actual range which not only shows
the tool to be working as it should but also that with the limited inputs available, the results from
the tool are fairly accurate. In the beginning of the thesis it was assumed that the initial oil film
thickness plays a very important part in the friction values but the results from this tool proved that
the change in the friction values is not very significant.
The parametric study of the tool was done mainly for the pressure and the engine speed as the
temperature files were unavailable. The tool worked well for this case as well. With the same
deformation values, the friction and the FMEP values is significantly less for the case with lower
pressure and lower engine speed.
The above three simulation cases give us not just a better understanding of the impact of changing
the inputs on the output results, but also prove the effectiveness of the P2M tool. It proves that the
tool works on expected lines and can be used for a wider range of changes in inputs and help in
improving the overall friction which will ultimately help in reducing fuel consumption of the vehicle.
The cases that were run were very basic and the tool has much bigger range of use. The outputs
mentioned in this report are not the only outputs given by the tool. It gives many other outputs
which include deformation of the nodes at every crank angle for the cylinder and the bore as well as
the oil film thickness at every point and at every crank angle degree. However, due to time
restrictions that is not included in this report and could be carried over as future work for Volvo Cars.
It is also important to understand that the P2M tool is still in the development phase and Volvo is
one of the customers from MIT using this tool. There are few errors in the tool and that has been

46 CHALMERS, Applied Mechanics, Master’s Thesis 2016:71
communicated to the MIT. There have been some errors in the input files from Volvo as well and so
the results are not hundred percent accurate. Few examples include the deformations for the bore
that have been considered from the MIT bore but the cylinder length has been fixed to imitate the
VCC bore. Also, the chamfer used for the tool is the one from MIT as the VCC one could not be used
in its format. All these changes have been modified to be used with the VCC piston so as to have
minimum deviations from the actual results. The results have also been compared with the results
from the suppliers for the piston and the FMEP values are approximately same as the ones received
from the suppliers.
The main conclusion from using this tool is that the outputs depend wholly on the inputs. There are
almost 14 input files which need to be defined for the basic case to run. This includes piston and
bore cold profiles and the profiles with thermal expansion, deformations due to pressure and inertia,
combustion pressure curve among others. The appendix contains information as to how the inputs
should be defined for the tool to work without any errors.
It is also important to understand the importance of defining the boundary for the tool to work. In
the simulations for the Volvo piston, only the skirt area was defined as the boundary and all the
results are for that defined area. The boundary limits are given in the input model file and the rings
also can be considered. Furthermore, the clearance between the piston and the bore plays a
significant role. Too little will lead to scuffing and wear and too high will lead to more lateral motion,
more vibrations and thus more friction and FMEP values.
The tool has certain limitations in the current form. The major limitation lies in the way to treat the
oil flow in the skirt area (between skirt and liner). When dealing with partially flooded region (where
cavitations occur), the model use a criterion to determine whether to treat the oil film as full
attachment or clear separation. For example, if the oil occupancy (oil film thickness/clearance) is
larger than 0.6, it is assumed that it attaches both skirt and liner; when it's less than 0.6, the tool
assumes that half of the oil film is attached to the liner and the other half to the skirt (and there is
void space in the middle). This assumption may result in some discontinuity.
The other limitation is that the cases where the surface of the skirt is worn are not yet considered in
the calculation. The assumption in the current model is that there is a uniform waviness on the skirt,
which is only accurate when the piston is new.

CHALMERS, Applied Mechanics, Master’s Thesis 2016:71 47
Finally, the main objective of the thesis was to run the tool for the Volvo piston. The tool is not very
user friendly and it took some time to understand the intricacies of its working. However, once it
was understood, the simulations run by changing the inputs gave promising results. This tool is in
early stages of development and has given close to accurate results. The future of this tool looks
good and it is one of the most accurate tools to calculate the secondary motion of the piston.

48 CHALMERS, Applied Mechanics, Master’s Thesis 2016:71

CHALMERS, Applied Mechanics, Master’s Thesis 2016:71 49
5. Future Scope
As mentioned above, the tool has wider range of usability than the ones that have been explored as
part of this thesis work. The tool has the ability to compute many different complex phenomena
occurring in the piston-cylinder system. Some of the additional work which can be carried out with
the current work includes the following:
In the current simulation case, only the compliance of the piston skirt has been taken into
consideration. The inverse of the stiffness matrix is the compliance matrix. The tool has the
ability to consider the liner compliance as well to giver better results. A different input file
for the liner compliance needs to be defined for the same.
The tool also has the ability to consider the effect of viscosity on the oil. For this, the
temperature at every crank angle degree needs to be defined as another input file. There
are some viscosity constants which are defined in the input model file. Using this viscosity
feature of the tool will give more realistic results as viscosity of oil is an important
phenomenon that occurs within the piston cylinder system.
The tool can give the results within 12 hours for simulating 2 cycles. This means that
different skirt designs can be simulated as well as the different oil flow regulations can be
studied. This will lead to faster and more reliable results for the friction and FMEP values
and improving the overall fuel efficiency of the engine.
A script for visualizing the motion of the piston within the cylinder bore and the distribution
of the oil film at different stages of the piston motion can be written for better
understanding of this complex phenomenon.
This thesis has been important from the point of view that with increasing legislations on pollution
from automobiles and fuel consumption issues, the research in the field of friction has grown
intensely in the last decade. Also, necessary to understand is that the simulation and analysis takes
more importance than actual testing as it is more economical, gives better results and can be
repeated with small changes to give different results as well. All this is why the P2M tool by MIT has
been used by a consortium of different OEM’s and suppliers including Volvo Car Corporation for
studying the secondary motion of the piston. There is a lot of research work still pending in this field
and the tool too has a long way to go in being more user friendly and computing more realistic
scenarios to give accurate results.

50 CHALMERS, Applied Mechanics, Master’s Thesis 2016:71

CHALMERS, Applied Mechanics, Master’s Thesis 2016:71 51
References
[1] Dongfang Bai, Modelling Piston Skirt Lubrication in Internal Combustion Engines, Massachusetts
Institute of Technology, 2012, citable URI: http://hdl.handle.net/1721.1/74901.
[2] Federal-Mogul Burscheid GmbH, Piston Ring Handbook, August 2008.
[3] http://www.serviscreen.com/serviscreengallery/index.php, accessed on 24 April 2016.
[4] M.F. Ahmad Fakaruddin, A. Mohd Hafiz and K.Karmegam, Materials selection for wet cylinder
liner, IOSR Journal of Engineering (IOSRJEN) e-ISSN: 2250-3021, September 2012.
[5] https://www.highpowermedia.com/blog/3126/piston-skirt-coatings, accessed on 15 April 2016.
[6] Tian Tian, Modelling the performance of the piston ring-pack in internal combustion engines,
Massachusetts Institute of Technology, 1997, citable URI: http://hdl.handle.net/1721.1/10445.
[7] Benoist Thirouard, Characterization and Modelling of the fundamental aspects of oil transport in
the piston ring pack of internal combustion engines, Massachusetts Institute of Technology,
2001, citable URI: http://hdl.handle.net/1721.1/8890.
[8] Camille Baelden, A multi-scale model for piston ring dynamics, lubrication and oil transport in
internal combustion engines, 2014, citable URI: http://hdl.handle.net/1721.1/92151.
[9] Conor McNelly, Development of a numerical model of piston secondary motion for internal
combustion engines, Massachusetts Institute of Technology, 2000, citable URI:
https://dspace.mit.edu/bitstream/handle/1721.1/26880/46310081-MIT.pdf?sequence=2.
[10] Zhen Meng, Input and Output of the Piston Secondary Motion (P2M) Model Version 5, Sloan
Automotive Laboratory, Massachusetts Institute of Technology, 2016.
[11] Pasquale Totaro, Modelling piston secondary motion and skirt lubrication with applications,
Massachusetts Institute of Technology, 2014, citable URI: http://hdl.handle.net/1721.1/92125.
[12] Reynolds equation, https://en.wikipedia.org/wiki/Reynolds_equation, accessed on 20 May 2016.