Embed Size (px)
Citation preview
Contemporary Engineering Sciences, Vol. 9, 2016, no. 9, 403 - 412
HIKARI Ltd, www.m-hikari.com
http://dx.doi.org/10.12988/ces.2016.6214
Modelling for Causal Interrelationships by
DEMATEL
Siti Aissah Mad Ali, Shahryar Sorooshian and Cheng Jack Kie
Faculty of Industrial Management
Universiti Malaysia Pahang, Malaysia
Copyright © 2016 Siti Aissah Mad Ali et al. This article is distributed under the Creative
Commons Attribution License, which permits unrestricted use, distribution, and reproduction in
any medium, provided the original work is properly cited.
Abstract
This paper aims to propose researchers and professionals to employ DEMATEL
as an essential element in their decision making process. Effort is taken to make it
apparent that DEMATEL would be the most suitable tool when there is composite
and complex mixture of aspects or factors relationship that has to be understood
prior making any decision. The interdependencies could be well understood by
having the Impact Relation Map chalked out via DEMATEL. This visualization
with the calculations that shows the degree of impact would very well furnish
decision makers with aiding information. In this paper, DEMATEL’s capability
and method will be detailed out for general understanding and guidance.
Keywords: DEMATEL, MCDM, Causal Interrelationships, IRM
1. Introduction
Decision making, especially in the operational or management area is never
something to be taken simple. Having decision making perceived less important is
not far from putting the system where decision making is required into lines
approaching failure. Any effort into improvement would be worthless if they’re
not accurately decided where or on which operation of a system should it be
executed; end up being a waste of effort or even a threat to the system if the
decision made is poor.
Basically decision making could be interpreted as a process or a study of
alternatives to decide on the best effort to be implemented based on the criteria,
values, preference, experience, goals, objectives, desires, values and et-cetera [2].

404 Siti Aissah Mad Ali et al.
Generally decision making process could be explained on the generalized
procedural basis: step 1 - define problem, step 2 – determine requirements, step 3
– establish goals, step 4 – identify alternatives, step 5 – define criteria, step 6 –
select a decision making tool, step 7 – evaluate alternatives against criteria and
finally to validate solutions against problem statement [2]. This paper looks into
the fifth step which brings us to two classifications: single criterion decision
making and multi criteria decision making. Our focus is to be adjusted to fall on
the latter; multi criteria decision making and a tool to assist one throughout this
paper.
Decision criteria must be based on goal(s) to enable discrimination among
alternatives. It should be perceived as an objective measure on how well each of
the alternative would achieve the understood and agreed goal. Minimally there’s
at least one decision criterion for each goal, but as the goal’s complexity
increases, it could generate more than that.
Decisions can be based on either single or multiple criteria. Usually, it is
simpler to come to a conclusion on decisions when it involves just one measure.
Optimization could be rather easier when the objective function comprises of just
one criterion. Nemhauster et al [22] has mentioned that there are many techniques
that could be adopted for the solution, linear programming and et-cetera
depending on the form and functional description of the problem; where decision
has to be made.
However, the focus of this paper neglects on the single criterion decision
making as the real business and management in the actual industry life does not
deal with one but many criteria. It is never very simple when it comes to decision
making in real life as one decision will impact not only one operation or practice
but will also lead to another. This phenomenon is called as multi-criteria decision
making (MCDM); where we have finite number of criteria on infinite number of
alternatives [33].
MCDM isn’t anything new to the world especially in the industry. Many
MCDM methods have been introduced to this world such as Analytic Hierarchy
Process (AHP), Analytic Network Process (ANP), Goal Programming (GP),
Multi-attribute Utility Theory (MAUT), Multi-attribute Value Theory (MAVT),
Elimination and Choice Expressing Reality (ELECTRE) and et-cetera [32]. The
method we are to dive into in this paper is DEMATEL.
2. DEMATEL
DEMATEL is abbreviated from Decision Making Trial and Evaluation
Laboratory. It forms as a comprehensive method where the causal relationship of
the criteria can be constructed into a structural model and analyzed further [17]
[6]. This method was first put into action at the Battelle Memorial Institute in
Geneva for the purpose of studying and solving the complicated and intertwined in a complex system which affects a large group of stakeholders with multiple factors

Modelling for causal interrelationships by DEMATEL 405
or decision criteria [9] [22]. DEMATEL has been applied and proved to be a good
and successful MCDM in many areas such as control systems, project
management, strategies, operations management and et-cetera [3] [5] [7] [26] [27]
[29] [30] [31].
It has the capability to solve complex problems by enhancing the
understanding of complicatedly interacted factors and criteria. This shall then lead
and direct to the construction of a hierarchical relevant network system which
shall then be used to solve the complex problems [16] [7]. Putting it simple,
DEMATEL could be employed to construct and Impact-Relation Map (IRM) as
well as to identify and realize the influence levels of each elements over the other
[8]. By knowing the nature and degree of influence an attribute or criterion has on
each other, the reflection on the system’s characteristics could be comprehended
[1]. Making a decision without understanding neither the external nor internal
reality are going to be detrimental to the organization, depending on the
importance, complexity and impact of the decision made to the organization.
Hence, it is important to gain this understanding to have better decisions made
with executive capability [17] [35]. As mentioned, this scientific research method
will at the end enable us to construct the Impact-Relation Map to verify the
relationship among the indicators (IRM) [1] [17] [35]. Prior to employing the
DEMATEL method, it is vital to have the criteria or factors. This shall then be
used as a pre-step into the DEMATEL. Procedures on conducting DEMATEL can
be summarized as the diagram in figure 1 based on the work of a few researchers
[20] [24] [36] [34] [4] [6].
Fig. 1; DEMATEL steps
STEP 1: Gather Expert’s Opinion and Calculate the Average Matrix Z
Let’s consider a group of m experts and n factors for this study. Experts are to be
given a list of factors arranged in sets of i and j. They’re then to be asked to
indicate their believed degree of impact the factors have on each other (pair-wise
comparison); how does factor i affects factor j. The indication can be made on the
Yes
No
Step 1
Gather experts’
opinion and calculate
the average matrix Z
Step 2
Calculate the
normalized initial
direct-relation matrix
D
Step 3
Derive the total
relation matrix T
Step 4
Calculate the sums of
rows and columns of
matrix T
Step 5
Set the threshold
value (α)
Step 6
Build a cause and
effect relationship
diagram
The final cause and
effect relationship
Is the cause and
effect relationship
diagram acceptable?

406 Siti Aissah Mad Ali et al.
scale of 0-3; 0 = no influence, 1 = weak direct influence, 2 = moderate direct
influence, 3 = strong direct influence. However, this scale is just an example as to
be used in this paper, otherwise, the rating scale is subject to the researcher’s
preference.
The degree to which the expert perceive factor i affects factor j is denoted as xij. For each expert, an n x n non-negative matrix is constructed as Xk = [xk
ij],
where k is the expert number of participating in the evaluation process with 1 ≤ k
≤ m. The mathematical notation can be formulated as below:
X =
021
2021
1120
nxnx
nxx
nxx
Thus, we would have X1, X2, X3, …, Xm would be the answer matrix obtained
from the experts. Each element of the matrices is denoted with xij representing the
degree of impact i has on factor j. The diagonal elements of each matrix is set to
zero as DEMATEL does not evaluate self-influence of factors.
An average understanding on the experts’ response has to be reached. This
could be done by calculating the average of the matrix which could be called as an
initial direct-relation matrix. This matrix could be presented as matrix Z = [zij]
based on the method below [17]:
m
i
kijij x
mz
1
1
STEP 2: Normalizing the Initial Direct-Relation Matrix D
Normalized direct relation matrix D then has to be calculated from the average
matrix Z. This is done by dividing each element by the largest row sum of the
average matrix. Total direct influence on the influence scale of the factor with
most direct influence on the other factors can be represented as factor:
nj ijznimax
11
The value of each element in this normalized direct-relation matrix D would range
between [0,1]. The calculation to obtain the meant matrix is as shown:
s
ZD
Where,
n
j
ijzni
maxs
11
Modelling for causal interrelationships by DEMATEL 407
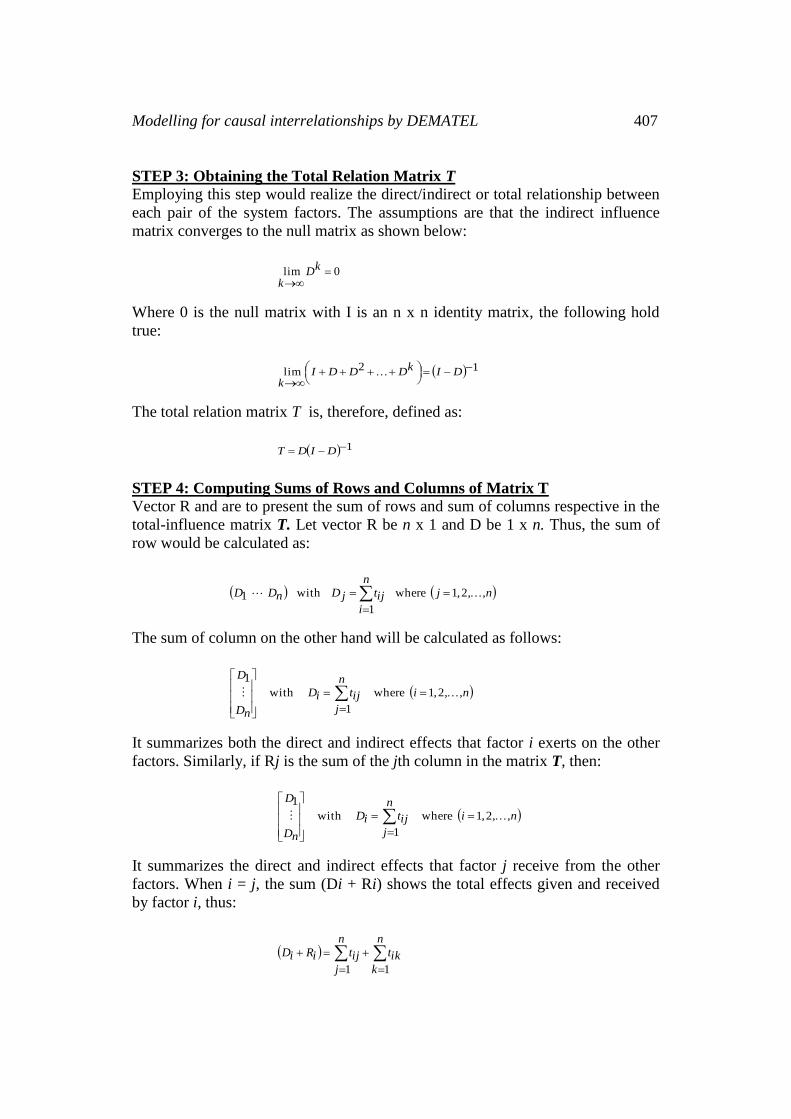
STEP 3: Obtaining the Total Relation Matrix T
Employing this step would realize the direct/indirect or total relationship between
each pair of the system factors. The assumptions are that the indirect influence
matrix converges to the null matrix as shown below:
0lim
kDk
Where 0 is the null matrix with I is an n x n identity matrix, the following hold
true:
12lim
DIkDDDIk
The total relation matrix T is, therefore, defined as:
1 DIDT
STEP 4: Computing Sums of Rows and Columns of Matrix T
Vector R and are to present the sum of rows and sum of columns respective in the
total-influence matrix T. Let vector R be n x 1 and D be 1 x n. Thus, the sum of
row would be calculated as:
n,,,j
n
i
ijtjDnDD 2 1 where
1
with 1
The sum of column on the other hand will be calculated as follows:
n,,,i
n
j
ijtiD
nD
D
2 1 where
1
with
1
It summarizes both the direct and indirect effects that factor i exerts on the other
factors. Similarly, if Rj is the sum of the jth column in the matrix T, then:
n,,,i
n
j
ijtiD
nD
D
2 1 where
1
with
1
It summarizes the direct and indirect effects that factor j receive from the other
factors. When i = j, the sum (Di + Ri) shows the total effects given and received
by factor i, thus:
n
k
ikt
n
j
ijtiRiD
11
408 Siti Aissah Mad Ali et al.
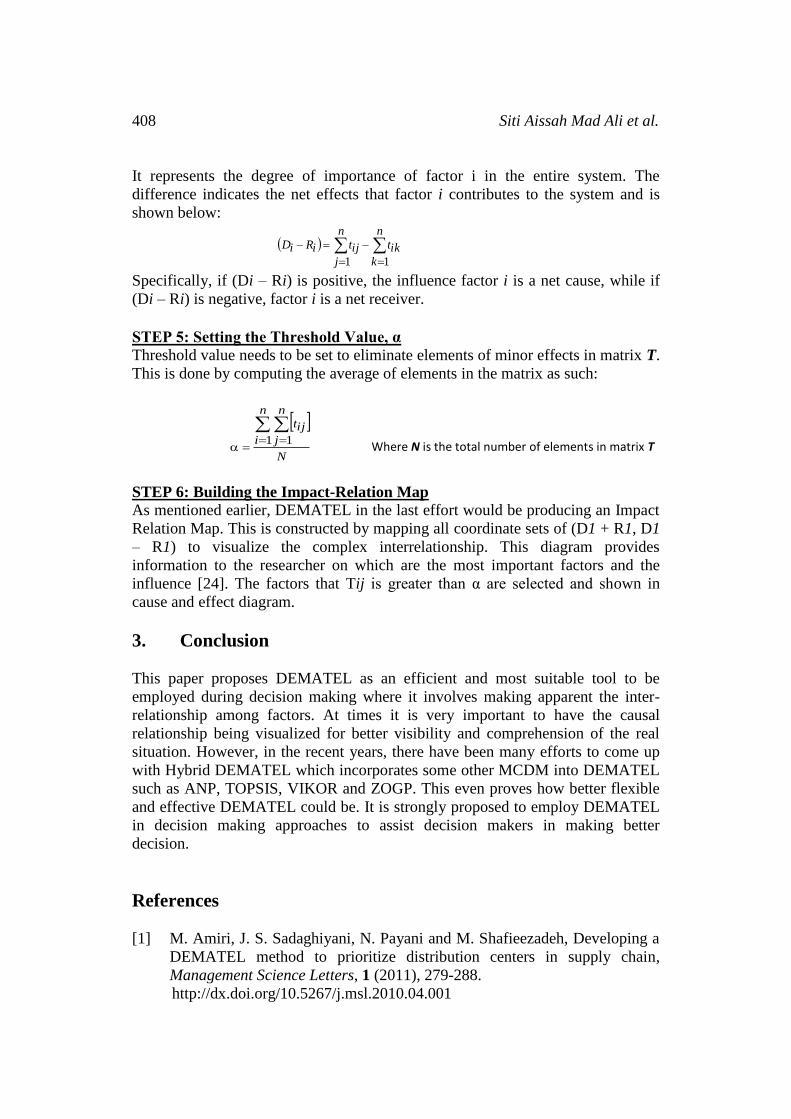
It represents the degree of importance of factor i in the entire system. The
difference indicates the net effects that factor i contributes to the system and is
shown below:
n
j
n
k
iktijtiRiD
1 1
Specifically, if (Di – Ri) is positive, the influence factor i is a net cause, while if
(Di – Ri) is negative, factor i is a net receiver.
STEP 5: Setting the Threshold Value, α
Threshold value needs to be set to eliminate elements of minor effects in matrix T.
This is done by computing the average of elements in the matrix as such:
1 1
N
n
i
n
j
ijt
Where N is the total number of elements in matrix T
STEP 6: Building the Impact-Relation Map
As mentioned earlier, DEMATEL in the last effort would be producing an Impact
Relation Map. This is constructed by mapping all coordinate sets of (D1 + R1, D1
– R1) to visualize the complex interrelationship. This diagram provides
information to the researcher on which are the most important factors and the
influence [24]. The factors that Tij is greater than α are selected and shown in
cause and effect diagram.
3. Conclusion
This paper proposes DEMATEL as an efficient and most suitable tool to be
employed during decision making where it involves making apparent the inter-
relationship among factors. At times it is very important to have the causal
relationship being visualized for better visibility and comprehension of the real
situation. However, in the recent years, there have been many efforts to come up
with Hybrid DEMATEL which incorporates some other MCDM into DEMATEL
such as ANP, TOPSIS, VIKOR and ZOGP. This even proves how better flexible
and effective DEMATEL could be. It is strongly proposed to employ DEMATEL
in decision making approaches to assist decision makers in making better
decision.
References
[1] M. Amiri, J. S. Sadaghiyani, N. Payani and M. Shafieezadeh, Developing a
DEMATEL method to prioritize distribution centers in supply chain,
Management Science Letters, 1 (2011), 279-288.
http://dx.doi.org/10.5267/j.msl.2010.04.001

Modelling for causal interrelationships by DEMATEL 409
[2] D. Baker, D. Bridges, R. Hunter, G. Johnson, J. Krupa, J. Murphy and K.
Sorenson, Guidebook to Decision Making Methods, WSRC-IM-2002-
00002, Department of Energy, USA. Retrieved on 20th February, 2016.
[3] E. Falatoonitoosi, S. Ahmed, S. Sorooshian, A multicriteria framework to
evaluate supplier's greenness, Abstract and Applied Analysis, 2014 (2014),
1-12, 396923. http://dx.doi.org/10.1155/2014/396923
[4] E. Falatoonitoosi, S. Ahmed, S. Sorooshian, Expanded DEMATEL for
determining cause and effect group in bidirectional relations, The Scientific
World Journal, 2014 (2014), 1-7, 103846.
http://dx.doi.org/10.1155/2014/103846
[5] E. Falatoonitoosi, Z. Leman, S. Sorooshian, Modeling for green supply
chain evaluation, Mathematical Problems in Engineering, 2013 (2013), 1-9,
201208. http://dx.doi.org/10.1155/2013/201208
[6] E. Falatoonitoosi, Z. Leman, S. Sorooshian, M. Salimi, Decision-making
trial and evaluation laboratory, Research Journal of Applied Sciences,
Engineering and Technology, 5 (2013), no. 13, 3476-3480.
[7] A. B. Fazlollah, R. M. D. Yusuff, N. Zulkifli, Y. Ismaiel, S. Sorooshian,
Modeling approach to the elements of TQM practice, Advanced Materials
Research, 711 (2013), 719-721.
http://dx.doi.org/10.4028/www.scientific.net/amr.711.719
[8] E. Fontela and A. Gabus, DEMATEL, Innovative Methods, Report no 2,
Structural Analysis of the World Problematique, Batelle Geneva Research
Institute, Geneva, 1974.
[9] J. Heizer, and B. Render, Operations Management: Sustainability and
Supply Chain Management, Pearson, UK, 2014.
[10] J. S. Horng, C. Y. Tsai, H. L. Chih and F. C. Sheng, Reconfiguring strategy
policy portfolios for Taiwan’s tourism industry development with a novel
model application, International Journal of Business Tourism Applied
Sciences, 2012.
[11] H. M. Hsu and C. T. Chen, Aggregation of fuzzy opinions under group
decision making, Fuzzy Sets and Systems, 79 (1996), no. 3, 279-285.
http://dx.doi.org/10.1016/0165-0114(95)00185-9
[12] C. Y. Huang, J. Z. Shyu and G. H. Tzeng, Reconfiguring the innovation
policy portfolios for Taiwan’s SIP mall industry, Technovation, 27 (2007),
no. 12, 744-765. http://dx.doi.org/10.1016/j.technovation.2007.04.002

410 Siti Aissah Mad Ali et al.
[13] A. Ishikawa, M. Amagasa, T. Shiga, G. Tomizawa, R. Tatsuta and H.
Mieno, The max-min Delphi method and fuzzy Delphi method via fuzzy
integration, Fuzz Sets and System, 55 (1993), no. 3, 241-253.
http://dx.doi.org/10.1016/0165-0114(93)90251-c
[14] K. Katerina, Utilizing dematel method in competency modeling, Forum
Scientiae Oeconomia, 2 (2014), no. 1, 95-106.
[15] G. J. Klir, and T. A Folger, Fuzzy Sets, Uncertainty and Information,
Prentic-Hall International, 1988.
[16] C. L. Lin and G. H. A. Tzeng, A value-created system of science
(technology) Park by using DEMATEL, Expert Systems with Applications,
36 (2009), 9683-9697. http://dx.doi.org/10.1016/j.eswa.2008.11.040
[17] K. Lin and C. Lin, Cognition map of experiential marketing strategy for hot
spring Hhotels in Taiwan using the DEMATEL method, 2008 Fourth
International Conference on Natural Computation, 2008.
http://dx.doi.org/10.1109/icnc.2008.472
[18] H. A. Linstone, and M. Turoff, The Delphi Method: Techniques and
Applications, 2002.
[19] J. J. H. Liou, G. H. Tzeng and H. C. Chang, Airline Safety Measurement
Using a Hybrid Model, Journal of Air Transport Management, 13 (2007),
no. 4, 243-249. http://dx.doi.org/10.1016/j.jairtraman.2007.04.008
[20] C. H. Liu, G. H. Tzeng and M. H. Lee, Improving tourism policy
implementation: The use of hybrid MCDM models, Tourism Management,
33 (2012), 413-426. http://dx.doi.org/10.1016/j.tourman.2011.05.002
[21] T. J. Murray, L. L. Pipino, and J. P. Gigch, A Pilot Study of Fuzzy Set
Modification of Delphi, Human Systems Management, 5 (1985), 76-80.
[22] G. L. Nemhauser, A. H. G. Rinnoy Kan, and M. J. Tod, Handbooks in
Operation Research and Management Science. Volume 1 Optimization,
North Holland, Amsterdam, 1989.
[23] D. Sarkar, Lean for Service Organization and Offices: A Holistic Approach
for Achieving Operational Excellence and Improvements Milwaukee, ASQ
Quality Press, Winconsin, 2007.
[24] J. I. Shieh, H. H. Wu and K. K. Huang, A DEMATEL method in identifying
key success factors of hospital service quality, Knowledge Based System, 23
(2010), no. 3, 277-282. http://dx.doi.org/10.1016/j.knosys.2010.01.013

Modelling for causal interrelationships by DEMATEL 411
[25] S. Sorooshian, Fuzzy approach to statistical control charts, Journal of
Applied Mathematics, 2013 (2013), 1-6, 745153.
http://dx.doi.org/10.1155/2013/745153
[26] S. Sorooshian, Study on unbalanceness of the balanced scorecard, Applied
Mathematical Sciences, 8 (2014), no. 84, 4163-4169.
http://dx.doi.org/10.12988/ams.2014.45337
[27] S. Sorooshian, A. Anvari, M. Salimi, E. Falatoonitoosi, Interrelation study
of Entrepreneur's Capability, World Applied Sciences Journal, 17 (2012),
no. 7, 818-820.
[28] S. Sorooshian, A. Azizi, Fuzzy Bases, World Applied Sciences Journal, 26
(2013), no. 10, 1335-1339.
[29] S. Sorooshian, S. M. Dahan, Analysis on factors of non-compliance of Halal
standard, Journal of Engineering and Applied Sciences, 8 (2013), no. 9,
280-281.
[30] S. Sorooshian, J. Dodangeh, Modeling on performance drivers of project
management, Advances in Environmental Biology, 7 (2014), no. 13, 3890-
3894.
[31] S. Sorooshian, M. Jambulingam, M. Mousavi, Business green shift based on
innovation concepts, Journal of Applied Sciences, Engineering and
Technology, 6 (2013), no. 9, 1632-1634.
[32] S. Sorooshian, W. Li, M. D. Yusof Ismail, Landslide susceptibility
mapping: A technical note, Electronic Journal of Geotechnical Engineering,
20 (2015), no. 22, 12547-12550.
[33] R. E. Steuer, Multiple Criteria Optimization: Theory, Computation and
Application, Wiley, New York, 1986.
[34] C. K. Tsai, C. W. Hsu, S. H. Chen and A. H. Hu, Using DEMATEL to
develop a carbon management model of supplier selection in green supply
chain management, Journal of Cleaner Production, 56 (2013), 164-172.
http://dx.doi.org/10.1016/j.jclepro.2011.09.012
[35] G. Tzeng and J. Huang, Multiple Attribute Decision Making: Methods and
Applications, CRC Press, Boca Raton, FL, 2011.
http://dx.doi.org/10.1201/b11032
[36] W. C. Wang, Y. H. Lin, C. L. Lin, C. H. Chung and M. T. Lee, DEMATEL
based model to improve the performance in a matrix organization, Expert

412 Siti Aissah Mad Ali et al.
Systems with Applications, 39 (2012), 4978-4986.
http://dx.doi.org/10.1016/j.eswa.2011.10.016
Received: March 4, 2016; Published: April 21, 2016