Embed Size (px)
Citation preview

304
THE BALTIC JOURNAL OF ROAD
AND BRIDGE ENGINEERING
2 0 1 9/1 4 (3)
ISSN 1822-427X/eISSN 1822-42882019 Volume 14 Issue 3: 304–325https://doi.org/10.7250/bjrbe.2019-14.445
MODELLING AND SIMULATION OF CRASH TESTS ON CURVED BARRIERS TAKING INTO ACCOUNT VEHICLE SPEED LIMITS
MARIAN KLASZTORNY1*, DANIEL BRONISLAW NYCZ2, KAMIL PAWEL ZAJAC1
1Dept of Mechanics and Applied Computer Science, Faculty of Mechanical Engineering,
Military University of Technology, Warsaw, Poland 2Institute of Technology, Jan Grodek State Vocational Academy, Sanok, Poland
Received 5 November 2018; accepted 5 June 2019
Abstract. The reliable speed of a vehicle, assigned to a given road arc, is not usually taken into account in simulation of crash tests on road safety barriers located on horizontal concave arcs with small radii (20−200 m). In this work, the numerical modelling and simulations of TB11, TB32 crash tests for selected road safety barriers on a horizontal concave arc with a small radius of 150 m, at a reliable and increased speed of a vehicle, were conducted. The authors developed the methodology of numerical modelling and simulation and published in the period 2015−2018. In this study, crash tests include two N2 class steel road barriers with the B-type guide rail, i.e. SP-05/1 (with 1.00 m post spacing) and SP-05/2 (with 2.00 m post spacing). Suzuki Swift and Dodge Neon vehicle models were taken from the National Crash Analysis Center (USA) library and modified, respectively. It was proved that road traffic safety on
* Corresponding author. E-mail: [email protected]
Marian KLASZTORNY (ORCID 0000-0003-3773-5281)Daniel Bronislaw NYCZ (ORCID 0000-0002-2756-8814)Kamil Pawel ZAJAC (ORCID 0000-0003-0320-5741)
Copyright © 2019 The Author(s). Published by RTU Press
This is an Open Access article distributed under the terms of the Creative Commons Attribution License (http://creativecommons.org/licenses/by/4.0/), which permits unrestricted use, distribution, and reproduction in any medium, provided the original author and source are credited.
305
Marian Klasztorny, Daniel Bronislaw Nycz, Kamil Pawel Zajac
Modelling and Simulation of Crash Tests on Curved Barriers Taking into Account Vehicle Speed Limits
horizontal concave arcs with small radii is assured if the reliable velocity is not exceeded by drivers. Compacting the post spacing or the uses of a composite-foam protective overlay added to guide rails are not recommended.
Keywords: crash tests, horizontal concave arc, influence of impact velocity, influence of post spacing, modelling and simulation, road safety barrier.
Introduction
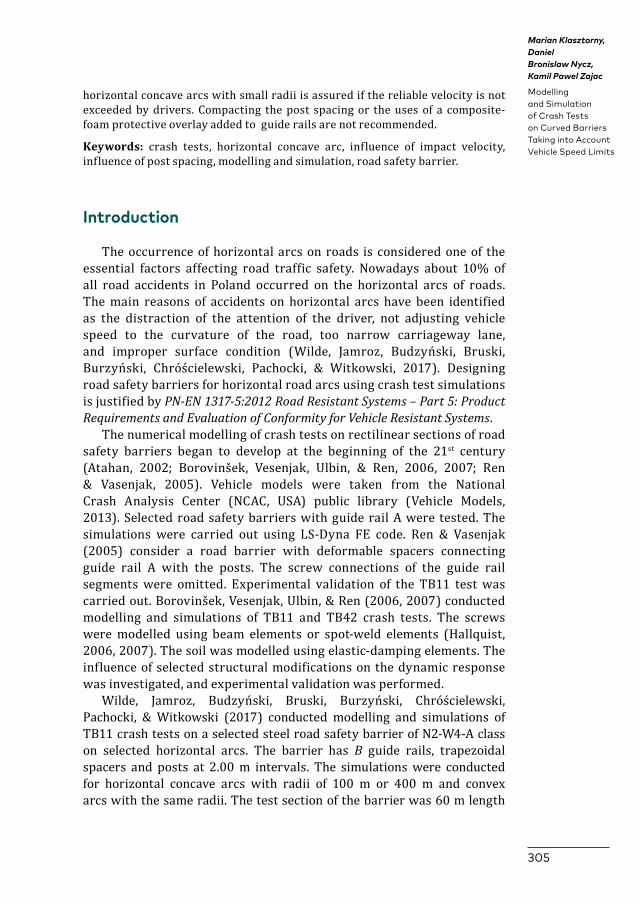
The occurrence of horizontal arcs on roads is considered one of the essential factors affecting road traffic safety. Nowadays about 10% of all road accidents in Poland occurred on the horizontal arcs of roads. The main reasons of accidents on horizontal arcs have been identified as the distraction of the attention of the driver, not adjusting vehicle speed to the curvature of the road, too narrow carriageway lane, and improper surface condition (Wilde, Jamroz, Budzyński, Bruski, Burzyński, Chróścielewski, Pachocki, & Witkowski, 2017). Designing road safety barriers for horizontal road arcs using crash test simulations is justified by PN-EN 1317-5:2012 Road Resistant Systems – Part 5: Product Requirements and Evaluation of Conformity for Vehicle Resistant Systems.
The numerical modelling of crash tests on rectilinear sections of road safety barriers began to develop at the beginning of the 21st century (Atahan, 2002; Borovinšek, Vesenjak, Ulbin, & Ren, 2006, 2007; Ren & Vasenjak, 2005). Vehicle models were taken from the National Crash Analysis Center (NCAC, USA) public library (Vehicle Models, 2013). Selected road safety barriers with guide rail A were tested. The simulations were carried out using LS-Dyna FE code. Ren & Vasenjak (2005) consider a road barrier with deformable spacers connecting guide rail A with the posts. The screw connections of the guide rail segments were omitted. Experimental validation of the TB11 test was carried out. Borovinšek, Vesenjak, Ulbin, & Ren (2006, 2007) conducted modelling and simulations of TB11 and TB42 crash tests. The screws were modelled using beam elements or spot-weld elements (Hallquist, 2006, 2007). The soil was modelled using elastic-damping elements. The influence of selected structural modifications on the dynamic response was investigated, and experimental validation was performed.
Wilde, Jamroz, Budzyński, Bruski, Burzyński, Chróścielewski, Pachocki, & Witkowski (2017) conducted modelling and simulations of TB11 crash tests on a selected steel road safety barrier of N2-W4-A class on selected horizontal arcs. The barrier has B guide rails, trapezoidal spacers and posts at 2.00 m intervals. The simulations were conducted for horizontal concave arcs with radii of 100 m or 400 m and convex arcs with the same radii. The test section of the barrier was 60 m length

306
THE BALTIC JOURNAL OF ROAD
AND BRIDGE ENGINEERING
2 0 1 9/1 4 (3)
terminated with 8 m length endings, a 20° impact angle, 100 km/h impact velocity, and left side impact at 0.333 of the test section length. The barrier was modelled using Belytschko–Tsay finite shell elements and solid finite elements. The numerical model of the Geo Metro vehicle was taken from the website http://www.vegvesen.no/s/robust and subjected to some modifications. About a horizontal concave arc with a radius of 100 m, the simulation showed that the vehicle was blocked in the barrier at ASI = 2.35 (the result was not validated). In other cases, the vehicle was redirected to the road at ASI = 0.69−0.75 and the exit box criterion was met. The simulations were carried out using LS-Dyna FE code.
Klasztorny, Nycz, & Szurgott (2016) and Klasztorny, Zielonka, Nycz, Posuniak, & Romanowski (2018) developed the methodology of advanced numerical modelling and simulation of TB11 and TB32 crash tests on rectilinear road safety barriers and horizontal arcs. The test section of the barrier with a length of 40 m on a horizontal concave arc with a radius of 150 m, terminated with 12 m length endings was assumed. The impact angle, interpreted as the angle between the drive track axis and the tangent to the face of the barrier at the point of intersection, was 20 degree. The impact speeds were 100 km/h and 110 km/h, respectively, for the TB11 and TB32 tests and the impact speed in the TB32 experimental validation test was 97.70 km/h. A right-side impact was assumed at 0.325 of the test section length. Models of Geo Metro (900 kg) and Dodge Neon (1500 kg) vehicles were taken from the NCAC library (Vehicle Models, 2013) and subjected to appropriate modifications. The simulations were carried out for the SP-05/2 steel barrier, class N2-W4-A, based on (System N2 W4 (SP-5/2), 2011), on a horizontal concave arc with a radius of 150 m. It was shown that the barrier does not meet the exit box criterion. A composite-foam protective overlay was designed for the guide rail to meet this criterion. The barrier functionality parameters defined in PN-EN 1317-1:2010 Road Resistant Systems – Part 1: Terminology and General Criteria for Test Methods and PN-EN 1317-2:2010 Road Resistant Systems – Part 2: Performance Classes, Impact Test Acceptance Criteria and Test Methods for Safety Barriers Including Vehicle Parapets were analysed. The LS-Dyna v.971 software was used for the simulation. Experimental validation of the modelling and simulation was carried out.
Modelling and simulation of crash tests on road safety barriers is still being developed by Dziewulski (2016) and by a research team from Gdansk University of Technology, Poland (Bruski, Burzyński, Chróścielewski, Pachocki, & Witkowski, 2019; Burzyński, Chróścielewski, & Pachocki, 2018; Wilde, Jamroz, Budzyński, Bruski, Burzyński, Chróścielewski, Pachocki, & Witkowski, 2017).

307
Marian Klasztorny, Daniel Bronislaw Nycz, Kamil Pawel Zajac
Modelling and Simulation of Crash Tests on Curved Barriers Taking into Account Vehicle Speed Limits
The investigations concern rectilinear protective barriers. Dziewulski (2016) develops a methodology of numerical modelling and simulation of a TB51 virtual crash test on a straight-line bridge safety barrier, using a simplified coach model and LS-Dyna FE code. Wilde, Jamroz, Budzyński, Bruski, Burzyński, Chróścielewski, Pachocki, & Witkowski (2017) investigate the influence of a road safety distance from the curb on the working width in a TB51 crash test. The numerical modelling and simulation are based on Belytschko-Tsay 4-node shell elements with reduced integration (Hourglass control type 4 was used). Burzyński, Chróścielewski, & Pachocki (2018) present the simulations of TB11 and TB32 crash tests on a rectilinear steel road safety barrier at various impact angles and various impact car speeds. The numerical modelling and simulation methodology follows the methodology presented by Klasztorny, Nycz, & Szurgott (2016). Bruski, Burzyński, Chróścielewski, Pachocki, & Witkowski (2019) analyse the Geo Metro vehicle numerical model used for simulations of crash tests on straight-line road safety barriers, about tire/wheel breakage during the impact. Some methods for improvement of the numerical car model are proposed.
The literature review proves that methodology of numerical modelling and simulation of TB11 and TB32 crash tests on road safety barriers, developed by Klasztorny & Nycz (Klasztorny, Nycz, & Szurgott, 2016; Klasztorny, Zielonka, Nycz, Posuniak, & Romanowski, 2018), is the most advanced and used by other researchers. Previous publications by other researchers mostly concern straight-line barriers and standard values of car impact velocity. The literature review also shows that the problem with ensuring road traffic safety occurs only in case of road safety barriers on horizontal concave arcs with small radii (e.g. R = 150 m) when the driver significantly exceeds the reliable speed on the given arc (Decree of the Minister of Infrastructure…, 2016; Klasztorny, Nycz, & Zajac, 2018). For this reason, the impact speeds in tests TB11 (100 km/h) and TB32 (110 km/h), specified in PN-EN 1317-2:2010 for rectilinear barriers, are inadequate in crash tests on barriers on horizontal concave arcs with small radii.
This paper presents the numerical modelling and simulations of TB11 and TB32 crash tests for selected road safety barriers on a horizontal concave arc with a small radius of 150 m, for a constant and increased velocity of a vehicle. The methodology of numerical modelling and simulation developed and validated in Klasztorny, Nycz, & Szurgott (2016) and Klasztorny, Zielonka, Nycz, Posuniak, & Romanowski (2018) was applied. The research concerns steel road barriers of the N2 class, with the codes SP-05/1 (post spacing 1.00 m) and SP-05/2 (post spacing 2.00 m) based on System N2 W4 (SP-5/2) (2011). Vehicle models were taken from the NCAC library (Vehicle Models, 2013) and accordingly modified (Klasztorny, Nycz, & Szurgott, 2016).
308
THE BALTIC JOURNAL OF ROAD
AND BRIDGE ENGINEERING
2 0 1 9/1 4 (3)
1. Analysis of regulations and a brief description of functionality criteria of road barriers
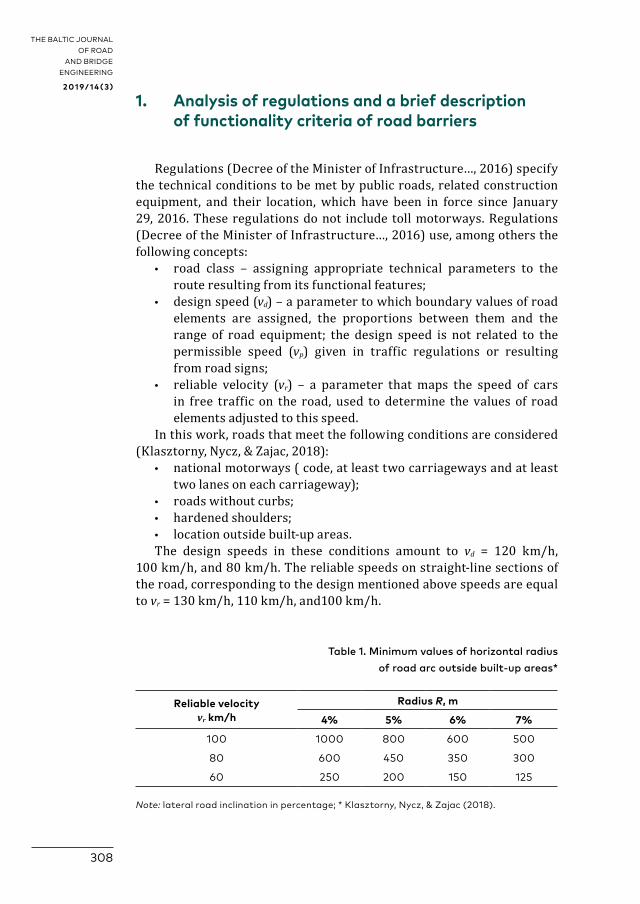
Regulations (Decree of the Minister of Infrastructure…, 2016) specify the technical conditions to be met by public roads, related construction equipment, and their location, which have been in force since January 29, 2016. These regulations do not include toll motorways. Regulations (Decree of the Minister of Infrastructure…, 2016) use, among others the following concepts:
• road class – assigning appropriate technical parameters to the route resulting from its functional features;
• design speed (vd) – a parameter to which boundary values of road elements are assigned, the proportions between them and the range of road equipment; the design speed is not related to the permissible speed (vp) given in traffic regulations or resulting from road signs;
• reliable velocity (vr) – a parameter that maps the speed of cars in free traffic on the road, used to determine the values of road elements adjusted to this speed.
In this work, roads that meet the following conditions are considered (Klasztorny, Nycz, & Zajac, 2018):
• national motorways ( code, at least two carriageways and at least two lanes on each carriageway);
• roads without curbs; • hardened shoulders; • location outside built-up areas.
The design speeds in these conditions amount to vd = 120 km/h, 100 km/h, and 80 km/h. The reliable speeds on straight-line sections of the road, corresponding to the design mentioned above speeds are equal to vr = 130 km/h, 110 km/h, and100 km/h.
Table 1. Minimum values of horizontal radius of road arc outside built-up areas*
Reliable velocityvr km/h
Radius R, m
4% 5% 6% 7%
100 1000 800 600 500
80 600 450 350 300
60 250 200 150 125
Note: lateral road inclination in percentage; * Klasztorny, Nycz, & Zajac (2018).

309
Marian Klasztorny, Daniel Bronislaw Nycz, Kamil Pawel Zajac
Modelling and Simulation of Crash Tests on Curved Barriers Taking into Account Vehicle Speed Limits
On horizontal circular arcs of roads, vehicles must travel at a reduced speed. The minimum values of the horizontal radius of circular arc R for S roads outside built-up areas as a function of the reliable speed are given in Table 1 (selected cases) (Decree of the Minister of Infrastructure…, 2016; Klasztorny, Nycz, & Zajac, 2018).
For a horizontal concave arc with a radius of 150 m, on a S road outside the built-up area, with a lateral inclination of 6%, the reliable velocity of a car is 60 km/h, and the increased velocity of 80 km/h was adopted (Klasztorny, Nycz, & Zajac, 2018).
PN-EN 1317-1:2010 defines the functional criteria of straight-line road safety barriers, tested using crash tests. The main parameters of these criteria are:
• Acceleration Severity Index (ASI); • Theoretical Head Impact Velocity (THIV); • working width (W); • vehicle motion trajectory in the exit box.
The acceleration severity index ASI(t) as a function of time is calculated from the Eq. (1) (PN-EN 1317-1:2010):
ASI ta tâ
a tâ
a tâ
x
x
y
y
z
z
2 2 2
, (1)
a a t t j x y zjt
t
jt d1
,, , , (2)
where âx, ây, âz – limit values of components of acceleration in the x, y, z directions, from the Cartesian local coordinate system of the vehicle (x – horizontal longitudinal axis, y – horizontal transverse axis, z – vertical axis); ax(t), ay(t), az(t) – components of acceleration of the vehicle centre of gravity; āx(t), āy(t), āz(t) – components of acceleration of the vehicle centre of gravity, passed through a Butterworth four-pole, phase-free digital filter, with low-pass bandwidth and the limit frequency of 13 Hz (a component of acceleration values averaged over a moving interval); δ – moving interval (δ = 0.050 s), s; t – time variable, s.
The limit values of the components of acceleration are (PN-EN 1317-1:2010):
âx = 12g, ây = 9g, âz = 10g, (3)
where g – gravity acceleration g = 9.81 m/s2.The functional barrier parameter amounts to
ASI = max[ASI(t)]. (4) t

310
THE BALTIC JOURNAL OF ROAD
AND BRIDGE ENGINEERING
2 0 1 9/1 4 (3)
The impact intensity levels are defined as follows: • level A – ASI − ≤ 1.0; • level B – ASI − ≤ 1.4; • level C – ASI − ≤ 1.9.
PN-EN 1317-1:2010 and PN-EN 1317-2:2010 assume that the occupant is a theoretical head moving freely in such a way that during a change in the vehicle direction, the theoretical head moves rectilinearly and independently of the vehicle until it hits one of the walls of the theoretical cabin. The value of the theoretical head impact velocity with the moving theoretical vehicle cabin is the THIV parameter. It is assumed that the vehicle motion is planar in the horizontal plane to calculate THIV. The THIV parameter is the relative velocity of the head at the moment of impact, T, i.e.:
THIV v T v Tx y2 2
, (5)
where vx, vy – components of the theoretical head velocity relative to the vehicle, calculated by the Equations given in PN-EN 1317-1:2010. For impact intensities, A, B, and C, this parameter meets the condition THIV ≤ 33 km/h.
Working width W is the maximum transverse distance between any part of the not deformed barrier from the face side and the maximum dynamic position in the horizontal plane of any part of this barrier. The selected working width levels are (PN-EN 1317-2:2010):
• level W1 – W ≤ 0.6 m; • level W2 – W ≤ 0.8 m; • level W3 – W ≤ 1.0 m; • level W4 – W ≤ 1.3 m; • level W5 – W ≤ 1.7 m.
After the collision with the barrier, the car with length L (in meters) and width S (in meters) is allowed to move away from the safety barrier so that the wheel track does not cross the line distant from the original line of the barrier face by the distance (PN- EN 1317-2:2010):
d = 2.2 + S + 0.16L (m) (6)
on length B = 10.0 m measured from the point where the track of the last wheel once again intersects the original barrier face line after the impact and permanent contact of the car with the barrier. For the Suzuki Swift (TB11 test), d = 4.38 m is obtained, and for the Dodge Neon (TB32 test) the distance is d = 4.53 m. Another impact of the car with the barrier that occurs after the first impact is not taken into account to assess barrier performance.

311
Marian Klasztorny, Daniel Bronislaw Nycz, Kamil Pawel Zajac
Modelling and Simulation of Crash Tests on Curved Barriers Taking into Account Vehicle Speed Limits
Other functional criteria referring to the barrier and vehicle behaviour during and after the crash test are as follows (PN-EN 1317-2:2010):
• the barrier stops the vehicle from going off the road without completely interrupting the continuity of the guide rail;
• deformation and penetration of the safety barrier into the car cabin is not allowed;
• it is permissible for one wheel of the car to pass over or under the barrier during the test;
• it is unacceptable for the vehicle to overturn during the crash test; • after the crash test, it is confirmed that the length of the barrier
test section is sufficient to demonstrate the full functioning of the safety system, i.e. static lateral displacement of the end sections does not occur.
PN-EN 1317-2:2010 does not impose some other restrictions on the car motion trajectory. In particular, the following behaviour of the vehicle is accepted (Klasztorny, Nycz, & Zajac, 2018):
• blocking of the car in the barrier; • blocking of the car in the barrier and rotation of the car around
the vertical axis (skidding); • skidding and rebounding of the car from the barrier; • breaking of the right front suspension and destruction of the right
front wheel; • sliding of the car along the barrier without rebounding from the
barrier.
2. Brief description of analysed dynamic systems
The subject of numerical tests is the SP-05/1, SP-05/2 N2 class barriers based on System N2 W4 (SP-5/2) (2011). The barrier consists of guide rail segments with a total length of 4.30 m and an effective length of 4.00 m, Sigma-100 posts with a length of 1.90 m and spacing of 1.00 m (SP-05/1) and 2.00 m (SP-05/2), trapezoidal spacers and rectangular pads. The barrier elements are made of structural steel S235JR with different chemical composition in particular parts of the barrier, subjected to the hot-dip galvanising process. M16 class 4.6 bolts were used as the fasteners. System N2 W4 (SP-5/2) (2011) provides some of the results of TB11 + TB32 crash tests for the SP-05/2 barrier, i.e. ASI = 0.8, THIV = 23 km/h, W = 1.10 m. Barrier SP-05/1 is a modification of the SP-05/2 barrier. The length of the barrier test section amounts to L = 40.00 m. Barrier endings with a length of 12.00 m each are modelled by

312
THE BALTIC JOURNAL OF ROAD
AND BRIDGE ENGINEERING
2 0 1 9/1 4 (3)
equivalent beam elements. The barrier is in a horizontal concave arc with the radius of R = 150 m, measured in the post line. The parameters of crash tests are as follows (Klasztorny, Nycz, & Zajac, 2018):
• the impact from the right side; • a 20° impact angle (measured between the longitudinal axis of the
car and the tangent to the barrier face); • the theoretical point of impact at 0.325L; • impact velocity values v = 60 km/h, 80 km/h.
Eight crash tests were simulated (two barriers, two crash tests, two velocities).
3. Description of numerical modelling and simulation methodology of TB11 and TB32 crash tests
A full description of the methodology of modelling and simulation of TB11 and TB32 tests is given in Klasztorny, Nycz, & Szurgott, (2016) and Klasztorny, Zielonka, Nycz, Posuniak, & Romanowski (2018). This methodology is summarised in Table 2 based on these papers. The values of the material constants of the steel, soil, connectors, endings and simulation parameters are summarised in Klasztorny, Nycz, & Szurgott (2016). The following abbreviated description uses labels from the LS-Dyna system (Hallquist, 2006, 2007).
The simulated TB11 tests use the Suzuki Swift vehicle model with over 33 000 finite elements. In the simulated TB32 tests, the Dodge Neon vehicle model with over 279 000 finite elements was used (Vehicle Models, 2013). The barriers are manufactured using S235JR steel. The soil in which the SIGMA-100 posts are embedded is mapped in the form of cylinders with a radius of 1.00 m and a height of 1.30 m, which were meshed with solid elements with the HEX8 and PENTA6 topologies, with the assigned formulation ELFORM_1.
The following CAE systems were used for modelling and simulation: • numerical model preparation − Catia v5r19 (Part Design,
Generative Shape Design, Assembly Design), HyperWorks 11.0 (HyperMesh, HyperMorph), LS-PrePost 4.2;
• simulation − LS-Dyna v971 r7; • results processing − HyperWorks 11.0 (HyperView, HyperGraph),
LS-PrePost 4.2, Excel.The dynamic process duration was 1.5 seconds (TB11 test) and
2 seconds (TB32 test), including vehicle impact on the barrier, contact with the barrier and vehicle motion in the exit box (Klasztorny, Nycz, & Zajac, 2018).

313
THE BALTIC JOURNAL OF ROAD AND BRIDGE ENGINEERING
2 0 1 9/1 4 (3)
Table 2. Parameters or options of numerical modelling and simulation of crash tests on road safety barriers
Item Parameters/options
The meshing of shell steel parts of the barrier
• 4-node shell finite elements of QUAD4 topology; • Belytschko-Tsai formulation with 1 in-plane integration point
and 5 integration points through the thickness (ELFORM_2 formulation).
The material model for shell steel parts of the barrier
• *MAT_PIECEWISE_LINEAR_PLASTICITY (*MAT_24) elastic-plastic model with isotropic hardening;
• material constants are taken from industrial certification excluding FAIL parameter;
• FAIL numerical parameter determined by calibration tests sensitive to meshing (plastic strain to failure and finite element erosion).
6-screw jointsof guide rail segments
• Discrete beam elements with 6 DOFs, reflected by six stiffness characteristics (ELFORM_6 formulation);
• *NONLINEAR_PLASTIC_DISCRETE_BEAM (*MAT_068) nonlinear elastoplastic and linear viscous model;
• parameters and stiffness characteristics determined by comparison of 3D and 2D tension test modelling of guide rail joint section;
• 3D modelling: � 8-node solid elements of HEX8 topology; � constant stress solid element (ELFORM_1 formulation); � Flanagan-Belytschko stiffness form of hourglass control.
Guiderail–post screw joints
• *CONSTRAINED_GENERALIZED_WELD_SPOT kinematic constraints; • load capacities are taken from bolt characteristics.
Screw preload • Dynamic relaxation procedure and *INITIAL_STRESS_SECTION option; • the approach used in 3D modelling only.
Asphalt/concrete pavement surface;roadside surface
• Rigid horizontal plane.
Roadside soil meshing
• Posts embedded in soil cylinders; • 3D finite elements of HEX8 and PENTA6 topology; • 8-node solid element, trilinear shape functions, one integration point
(ELFORM_1 formulation).
Roadside soil material model
• *MAT_SOIL_AND_FOAM (*MAT_005) model; • material constants are taken from NCAC library; • soil cylinders coated with artificial shell with properties of *MAT_NULL
(*MAT_009) material; • for car wheels, a roadside surface is a rigid plane.

314
THE BALTIC JOURNAL OF ROAD
AND BRIDGE ENGINEERING
2 0 1 9/1 4 (3)
THE BALTIC JOURNAL OF ROAD
AND BRIDGE ENGINEERING
Item Parameters/options
Vibration damping • *DAMPING_PART_STIFFNESS damping model; • damping ratios:
� shell steel parts of the barrier − 0.03; � roadside soil − 0.10.
Car models • Geo Metro and Dodge Neon car numerical models taken from NCAC library;
• corrections to adapt car models to oblique crash tests: � changing tire model from *AIRBAG model into *AIRBAG_SIMPLE_
PRESSURE_VOLUME model; � declaration of tire pressure equal to 2.3 bar; � correction of suspension (application of *MAT_66 material model
and BEAM elements in ELFORM_6 formulation, stiffness and damping suspension adjustment, adding preload in dynamic relaxation process);
� dynamic relaxation (influence of gravity load) before starting vehicle collision with a barrier;
� declaration of vehicle linear velocity and wheel angular velocity at start time point;
� adjustment of wheel alignment and wheel rotation axis; � correction of contact options; � correction of control cards; � hourglass control (elimination of non-physical forms of vibration); � placing *ELEMENT_SEATBELT_ACCELEROMETER at car centre
of gravity on rigid solid element connected to chassis using *CONSTRAINED_EXTRA_NODES bonds;
� correction of bond stiffness.
Contact • *CONTACT_AUTOMATIC_SINGLE_SURFACE model between potential contact pairs;
• additionally, *CONTACT_INTERIOR for roadside soil.
Friction • Coulomb kinematic friction; • experimental identification based on standards; • friction coefficients:
� steel – steel pairs − 0.25; � steel – soil pairs − 0.30; � dry asphalt/concrete – tire pairs − 0.90; � dry roadside – tire pairs − 0.68.
Hourglass control • Global stiffness procedure in Flanagan-Belytschko formulation.
Displacements • Large.
Strains • Large.
Numerical integration
• Explicit; • finite difference method; • time step assumed based on Courant-Friedrichs-Levy criterion.
Note: based on Klasztorny, Nycz, & Szurgott (2016) and Klasztorny, Zielonka, Nycz, Posuniak, & Romanowski (2018).

315
Marian Klasztorny, Daniel Bronislaw Nycz, Kamil Pawel Zajac
Modelling and Simulation of Crash Tests on Curved Barriers Taking into Account Vehicle Speed Limits
4. Simulation of TB11 and TB32 crash tests – results and discussion
The results of the simulated TB11 and TB32 crash tests of SP-05/1 and SP-05/2 barriers located in a horizontal concave horizontal arc with the radius of R = 150 m are presented in Figures 1−9. Figure 1 shows the ASI(t) graphs. Figures 2−9 present the final position of the Suzuki Swift and Dodge Neon cars (top view) as well as the deformation and destruction of the cars at adopted end times. The motion trajectory of
Table 3. Results of simulated TB11 crash tests of SP-05/1, SP-05/2 barriers*
Barrier
Impact velocity
vc,km/h
End velocity
ve,km/h
Acceleration Severity
IndexASI
Theoretical Head
Impact Velocity
THIV,km/h
Working width
W,m
Trajectory Testresult
SP-05/1 60 45.7 0.87 13.0 0.18 T1 approved
SP-05/2 60 22.9 0.86 20.5 0.32 T2 approved
SP-05/1 80 45.7 1.10 16.8 0.38 T4 approved
SP-05/2 80 28.9 0.69 17.2 0.49 T4 approved
Note: *Klasztorny, Nycz, & Zajac (2018)
Table 4. Results of simulated TB32 crash tests of SP-05/1, SP-05/2 barriers*
Barrier
Impact velocity
vc,km/h
End velocity
ve,km/h
Acceleration Severity
IndexASI
Theoretical Head
Impact Velocity
THIV,km/h
Working width
W,m
Trajectory Testresult
SP-05/1 60 34.9 0.62 20.1 0.33 T3 approved
SP-05/2 60 29.9 0.61 13.1 0.53 T3 approved
SP-05/1 80 15.9 0.78 22.1 0.53 T5 failed
SP-05/2 80 41.3 0.61 15.6 0.75 T3 approved
Note: *Klasztorny, Nycz, & Zajac (2018)

316
THE BALTIC JOURNAL OF ROAD
AND BRIDGE ENGINEERING
2 0 1 9/1 4 (3)
Figure 1. Acceleration Severity Index graphs for examined barriers (Klasztorny, Nycz, & Zajac, 2018)
a) test TB11, vc = 60 km/h
b) test TB32, vc = 60 km/h
c) test TB11, vc = 80 km/h
d) test TB32, vc = 80 km/h
0.0
0.2
0.4
0.6
0.8
1.0
0.0 0.3 0.6 0.9 1.2 1.5
Accele
rati
on
Sev
eri
ty I
nd
ex
Time, s
SP-05/1 SP-05/2
0.0
0.1
0.2
0.3
0.4
0.5
0.6
0.7
0.0 0.5 1.0 1.5 2.0
Accele
rati
on S
everi
ty I
nd
ex
Time, s
SP-05/1 SP-05/2
0.0
0.2
0.4
0.6
0.8
1.0
1.2
0.0 0.3 0.6 0.9 1.2 1.5
xe
dnI
ytire
ve
S n
oitar
ele
cc
A
Time, s
SP-05/1 SP-05/2
0.0
0.1
0.2
0.3
0.4
0.5
0.6
0.7
0.8
0.0 0.5 1.0 1.5 2.0
xe
dnI
ytire
ve
S n
oitar
ele
cc
A
Time, s
SP-05/1 SP-05/2
0.0
0.2
0.4
0.6
0.8
1.0
0.0 0.3 0.6 0.9 1.2 1.5
Accele
rati
on
Sev
eri
ty I
nd
ex
Time, s
SP-05/1 SP-05/2
0.0
0.1
0.2
0.3
0.4
0.5
0.6
0.7
0.0 0.5 1.0 1.5 2.0
Accele
rati
on S
everi
ty I
nd
ex
Time, s
SP-05/1 SP-05/2
0.0
0.2
0.4
0.6
0.8
1.0
1.2
0.0 0.3 0.6 0.9 1.2 1.5
xe
dnI
ytire
ve
S n
oitar
ele
cc
A
Time, s
SP-05/1 SP-05/2
0.0
0.1
0.2
0.3
0.4
0.5
0.6
0.7
0.8
0.0 0.5 1.0 1.5 2.0
xe
dnI
ytire
ve
S n
oitar
ele
cc
A
Time, s
SP-05/1 SP-05/2

317
Marian Klasztorny, Daniel Bronislaw Nycz, Kamil Pawel Zajac
Modelling and Simulation of Crash Tests on Curved Barriers Taking into Account Vehicle Speed Limits
the rear wheel, length of contact with the barrier and exit box are also marked (Klasztorny, Nycz, & Zajac, 2018).
The functionality criteria corresponding to the performed tests are listed in Tables 3 and 4. Depending on the type of barrier, type of test and impact speed, the following car motion trajectories in the exit box occurred (Klasztorny, Nycz, & Zajac, 2018):
• T1 − car rebound off the barrier and correct redirecting of the car to the road;
• T2 − stopping of the car by the barrier and skidding of the car in the exit box;
• T3 − sliding of the car along the guide rail without rebounding; • T4 − car rebound off the barrier and barely correct redirecting
of the car to the road; • T5 − car rebound off the barrier, skidding and incorrect
redirecting of the car to the road.
Figure 2. Suzuki Swift vehicle motion trajectory at an impact velocity of 60 km/h
a) SP-05/1 barrier
b) SP-05/2 barrier
10.00 m
2.35 m
4.38
m
Time = 1.50 s
Time = 1.50 s
3.97 m
10.00 m
4.38
m

318
THE BALTIC JOURNAL OF ROAD
AND BRIDGE ENGINEERING
2 0 1 9/1 4 (3)
Figure 3. Suzuki Swift vehicle deformation and destruction at an impact velocity of 60 km/h.
b) SP-05/2 barrier
Figure 4. Dodge Neon vehicle motion trajectory at an impact velocity of 60 km/h
a) SP-05/1 barrier
a) SP-05/1 barrier b) SP-05/2 barrier
Time = 2.00 s
Time = 2.00 s
10.00 m
10.00 m
7.09 m
4.53
m
4.53
m
5.28 m

319
THE BALTIC JOURNAL OF ROAD AND BRIDGE ENGINEERING
2 0 1 9/1 4 (3)
Figure 5. Dodge Neon vehicle deformation and destruction at an impact velocity of 60 km/h
a) SP-05/1 barrier b) SP-05/2 barrier
a) SP-05/1 barrier
b) SP-05/2 barrier
Figure 6. Suzuki Swift vehicle motion trajectory at an impact velocity of 80 km/h
Time = 1.50 s
Time = 1.50 s
10.00 m
10.00 m
8.13 m
4.69 m
4.53
8 m
4.38
m

320
THE BALTIC JOURNAL OF ROAD
AND BRIDGE ENGINEERING
2 0 1 9/1 4 (3)
a) SP-05/1 barrier b) SP-05/2 barrier
Figure 7. Suzuki Swift vehicle deformation and destruction at an impact velocity of 80 km/h
a) SP-05/1 barrier
b) SP-05/2 barrier
Figure 8. Dodge Neon vehicle motion trajectory at an impact velocity of 80 km/h (Klasztorny, Nycz, & Zajac, 2018)
Time = 2.00 s
Time = 2.00 s
10.00 m
10.00 m
9.78 m
7.82 m
4.53
m
4.53
m

321
THE BALTIC JOURNAL OF ROAD AND BRIDGE ENGINEERING
2 0 1 9/1 4 (3)
The functional criteria imposed on ASI, THIV, W for the SP-05/1, SP-05/2 barriers on a horizontal concave arc with the radius of 150 m are met for the impact velocities of 60 km/h and 80 km/h. The results correspond to the N2-W1-A class except for the TB11 test for the SP-05/1 barrier at 80 km/h (N2-W1-B class) and the TB32 test for the SP-05/2 barrier at 80 km/h (N2-W2-A class).
The car motion trajectories in the exit box vary widely depending on the type of car and the impact velocity. The exit box criterion is met in all the tested cases except the TB32 test for the SP-05/1 barrier at the increased velocity of 80 km/h (Klasztorny, Nycz, & Zajac, 2018). The typical vehicle motion trajectory recommended by PN-EN 1317-1:2010 and PN-EN 1317-2:2010 is trajectory T1, which occurred in the TB11 test for the SP-05/1 barrier at the velocity of 60 km/h. Trajectories T2, T3, T4, occurring in most tests, are acceptable in the light of PN-EN 1317-1:2010 and PN-EN 1317-2:2010. Trajectory T5, which occurred in test TB32 for the SP-05/1 barrier at the increased velocity of 80 km/h, leads to failure of the test. However, the TB11, TB32 crash tests are approved at the competent velocity of 60 km/h.
A two-fold reduction in post spacing positively influenced the TB11 test at 60 km/h, whereas it is wrong for the TB32 test at 60 km/h or TB11 at 80 km/h and negatively affected the TB32 test at 80 km/h. Therefore, reducing post spacing for the tested barriers is not recommended. Following the results of Klasztorny, Nycz, & Szurgott (2016) and Klasztorny, Zielonka, Nycz, Posuniak, & Romanowski (2018) and the results in this study, adding a composite-foam overlay to the type guide rail is not recommended.
a) SP-05/1 barrier b) SP-05/2 barrier
Figure 9. Dodge Neon vehicle deformation and destruction at an impact velocity of 80 km/h

322
THE BALTIC JOURNAL OF ROAD
AND BRIDGE ENGINEERING
2 0 1 9/1 4 (3)
Crash tests TB11 and TB32 on horizontal concave arcs with small radii performed in Klasztorny, Nycz, & Szurgott (2016) and Klasztorny, Zielonka, Nycz, Posuniak, & Romanowski (2018) at 100 km/h and 110 km/h or a slightly reduced velocity, respectively, lead to conclusions inadequate correspond to the real conditions on road bends.
Validation of the numerical modelling and simulation of crash tests of road safety barriers developed in Klasztorny, Nycz, & Szurgott (2016), was carried out in Klasztorny, Zielonka, Nycz, Posuniak, & Romanowski (2018) on the example of the TB32 test for the SP-05/2 barrier, with an impact velocity of 97.70 km/h. Therefore, the results of simulated crash tests in the present study (Tables 3, 4, Figures 1−9) are strongly reliable and indicate the need to modify the standard TB11, TB32 crash tests on horizontal road arcs, namely in the case of concave arcs with small radii. These tests ought to be carried out at competent velocities, significantly smaller than the standard velocities by PN-EN 1317-2:2010.
Conclusions
By the Polish road code, cars are allowed to develop velocities up to 120 km/h on straight-line sections of dual carriageway motorways. Then, the standard velocities of 100 km/h, 110 km/h of the TB11 and TB32 crash tests of N2 class barriers are justified. On horizontal arcs, on the road sections, drivers must adjust the velocity of the car in free motion to the radius of the road curve. Competent velocities depend on the road parameters, including the radius of curvature and lateral gradient. Regarding roads outside built-up areas, the radius of the horizontal concave arc of 150 m and the transverse slope of 6%, the competent velocity is 60 km/h. For research purposes, simulations were also carried out for an increased impact velocity of 80 km/h.
The conclusions from the simulations of road crash tests are as follows:
1. Crash tests on N-class road barriers with B-type guide rail, located on horizontal concave arcs with small radii should be performed at the reliable speed for a given horizontal arc.
2. Criteria for parameters Acceleration Severity Index, Theoretical Head Impact velocity, and Working width, for road barriers SP-05/1, SP-05/2 located on a horizontal concave arc with the radius of 150 m are met for the reliable impact speed of 60 km/h and the increased impact speed of 80 km/h.

323
Marian Klasztorny, Daniel Bronislaw Nycz, Kamil Pawel Zajac
Modelling and Simulation of Crash Tests on Curved Barriers Taking into Account Vehicle Speed Limits
3. Motion trajectories of the vehicles in the exit box are diverse and depend on the type of barrier, car type and affect velocity. The exit box criterion is met for all cases tested except for the TB32 test on the SP-05/1 barrier at the impact velocity of 80 km/h.
4. The vehicle motion trajectories T1, T2, T3, and T4 lead to approval of the exit box criterion. Trajectory T5, which occurred in test TB32 for barrier SP-05/1 at the increased speed of 80 km/h, leads to failure of the test.
5. Double reduction in the post spacing in the SP-05/2 barrier located on a horizontal concave arc with a radius of 150 m is not recommended.
6. Application of a composite-foam overlay connected to the guide of barrier SP-05/2 is not recommended because the recommendations in previous papers of the authors were based on velocities of 100 km/h and 110 km/h, unacceptable on a horizontal concave arc with a radius of 150 m.
7. After the impact of the car with the SP-05 barrier, successive posts were and overturned by the right front wheel of the car, which quickly loses its kinetic energy. The horizontal concave arc prolongs the contact of the car with the barrier. Too much of a loss in kinetic energy of the car results in blocking the car in the barrier or skidding with an unacceptable trajectory in the exit box.
8. The SP-05/2 barrier modified with longer spacers will behave much better on horizontal concave arcs, to the reduction in the number of posts destroyed by the right front wheel.
Acknowledgements
This work was partly supported the National Centre for Research and Development, Poland under Grant PBS1/B6/14/2012. Translation of the article was provided by Mrs Christine Frank–Szarecka, Canada.

324
THE BALTIC JOURNAL OF ROAD
AND BRIDGE ENGINEERING
2 0 1 9/1 4 (3)
REFERENCES
Atahan, A. O. (2002). Finite element simulation of a strong-post W-beam guardrail system. Simulation, 78(10), 587-599. https://doi.org/10.1177%2F0037549702078010001
Borovinšek, M., Vesenjak, M., Ulbin, M., & Ren, Z. (2006). Simulating the impact of a truck on a road-safety barrier. Strojniski Vestnik, 52(2), 101-111.
Borovinšek, M., Vesenjak, M., Ulbin, M., & Ren, Z. (2007). Simulation of crash tests for high containment levels of road safety barriers. Engineering failure analysis, 14(8), 1711-1718. https://doi.org/10.1016/j.engfailanal.2006.11.068
Bruski, D., Burzyński, S., Chróścielewski, J., Pachocki, Ł., & Witkowski, W. (2019). On the validation of the LS-DYNA Geo Metro numerical model. In MATEC Web of Conferences (Vol. 262, p. 10001). EDP Sciences. https://doi.org/10.1051/matecconf/201926210001
Burzyński, S., Chróścielewski, J., & Pachocki, Ł. (2018). Finite element method simulations of various cases of crash tests with N2/W4/A steel road barrier. In MATEC Web of Conferences (pp. 1-9). https://doi.org/10.1051/matecconf/201823101005
Decree of the Minister of Infrastructure and Construction of 23 December 2015 on the publication of a uniform text of the Regulation of the Minister of Transport and Maritime Economy on technical conditions to be met by public roads and their location (January 2016). Polish Journal of Laws 124. (in Polish)
Dziewulski, P. (2016). Modelling and numerical simulations of a TB51 road crash test using a simplified coach model. Archiwum Motoryzacji, 72(2).
Hallquist, J. O. (2006). LS-DYNA theory manual. Livermore Software Technology Corporation, Livermore, CA, USA.
Hallquist, J. O. (2007). LS-DYNA keyword user’s manual. Livermore Software Technology Corporation, Livermore, CA, USA.
Klasztorny, M., Nycz, D. B., & Szurgott, P. (2016). Modelling and simulation of crash tests of N2-W4-A category safety road barrier in horizontal concave arc. International Journal of Crashworthiness, 21(6), 644-659. https://doi.org/10.1080/13588265.2016.1212962
Klasztorny, M., Nycz, D. B., & Zajac, K. P. (2018). Modelling and Simulation of TB11 and TB32 Crash Tests of Two N2 class Barriers on Horizontal Concave Arc Taking into Account Car Speed Limits, pp. 1-4, in Online abstracts of the XV Konferencja Naukovo-Techniczna “Techniki komputerowe w inžynierii”, October 16−19, 2018, Jora Wielka, Poland.
Klasztorny, M., Zielonka, K., Nycz, D. B., Posuniak, P., & Romanowski, R. K. (2018). Experimental validation of simulated TB32 crash tests for SP-05/2 barrier on horizontal concave arc without and with composite overlay. Archives of Civil and Mechanical Engineering, 18(2), 339-355. https://doi.org/10.1016/j.acme.2017.07.007
PN-EN 1317-1:2010 Road Resistant Systems – Part 1: Terminology and General Criteria for Test Methods (in Polish)

325
Marian Klasztorny, Daniel Bronislaw Nycz, Kamil Pawel Zajac
Modelling and Simulation of Crash Tests on Curved Barriers Taking into Account Vehicle Speed Limits
PN-EN 1317-2:2010 Road Resistant Systems – Part 2: Performance Classes, Impact Test Acceptance Criteria and Test Methods for Safety Barriers Including Vehicle Parapets (in Polish)
PN-EN 1317-5:2012 Road Resistant Systems – Part 5: Product Requirements and Evaluation of Conformity for Vehicle Resistant Systems (in Polish)
Ren, Z., & Vesenjak, M. (2005). Computational and experimental crash analysis of the road safety barrier. Engineering Failure Analysis, 12(6), 963-973. https://doi.org/10.1016/j.engfailanal.2004.12.033
System N2 W4 (SP-5/2) (2011). Stalprodukt S.A., Bochnia, Poland.Vehicle Models (2013). National Crash Analysis Center, USA. Wilde, K., Jamroz, K., Budzyński, M., Bruski, D., Burzyński, S., Chróścielewski,
J., Pachocki, Ł., & Witkowski, W. (2017). Symulacje numeryczne stalowej bariery ochronnej na łuku drogi. Czasopismo Inżynierii Lądowej, Środowiska i Architektury 34(64, 3(1)), 535–546. (in Polish)


![arXiv:1907.12647v1 [cs.CV] 15 Jul 2019 · (e.g., concrete barriers, metal crash barriers, rumble strips) play an important role in preventing or mitigating vehicle crashes. Accurate](https://img.dokumen.tips/doc/110x75/5f5a06f8adc2aa22602be5fe/arxiv190712647v1-cscv-15-jul-2019-eg-concrete-barriers-metal-crash-barriers.jpg)