Embed Size (px)
Citation preview
RESEARCH ARTICLE Open Access
Modelling and prediction of global non-communicable diseasesYang Wang1,2 and Jinfeng Wang1,2*
Abstract
Background: Non-communicable diseases (NCDs) are the main health and development challenge facinghumankind all over the world. They are inextricably linked to socio-economic development. Deaths caused byNCDs should be different in different socio-economic development stages. The stratified heterogeneity of NCDdeaths is currently not fully explored.
Methods: Countries were classified according to their socio-economic types and development stages, which wereillustrated as a tree-like structure called Geotree. NCD deaths were linked to the countries and so were attached tothe Geotree, which was modelled by a multilevel model (MLM) approach. Accordingly, the levels of NCD deathindexes were predicted for 2030.
Results: Through the Geotree structure constructed in the study, it can be seen that the NCD death index hasobvious stratified heterogeneity; that is, the NCD death index shows different trends in different country types andsocio-economic development stages. In the first-level branches (country type), as national income increases, NCDmortality rate decreases and the proportion of NCD deaths to total deaths increases. In the secondary-level trunks(socio-economic development stage), as a country’s development stage rises, the NCD mortality rate decreases andthe proportion of NCD deaths to total deaths increases. In addition, combined with the hierarchical nature of theevolution tree model, the MLM was used to predict the global NCD death index for 2030. The result was that by2030, the global average age-standardized NCD mortality rate would be 510.54 (per 100,000 population) and theglobal average mortality for NCD deaths of the total number of deaths would be 75.26%.
Conclusions: This study found that there is a significant association between socio-economic factors and NCDdeath indicators in the tree-like structure. In the Geotree, countries on the same branch or trunk can learn fromcountries with higher development stages to formulate more effective NCD response policies and find the rightprevention and treatment path.
Keywords: Non-communicable diseases, Geotree, Socio-economic factors, Prediction
BackgroundNon-communicable diseases (NCDs)—namely cardiovas-cular diseases, diabetes, cancer and chronic respiratorydiseases—have a higher morbidity and mortality rateglobally than do all other causes combined [1]. They are
the main health and development challenge facing hu-mankind in the twenty-first century. They have causedcertain damage to the socio-economic structure of hu-man beings and countries, especially low- and middle-income countries (LMICs) [1]. The distribution of NCDswas mainly widespread in developed countries in theearly years. However, the NCD incidence and mortalityin LMICs have been increasing in recent years [2]. It isworth mentioning that in all continents, except Africa,the number of deaths from NCDs has now exceeded the
© The Author(s). 2020 Open Access This article is licensed under a Creative Commons Attribution 4.0 International License,which permits use, sharing, adaptation, distribution and reproduction in any medium or format, as long as you giveappropriate credit to the original author(s) and the source, provide a link to the Creative Commons licence, and indicate ifchanges were made. The images or other third party material in this article are included in the article's Creative Commonslicence, unless indicated otherwise in a credit line to the material. If material is not included in the article's Creative Commonslicence and your intended use is not permitted by statutory regulation or exceeds the permitted use, you will need to obtainpermission directly from the copyright holder. To view a copy of this licence, visit http://creativecommons.org/licenses/by/4.0/.The Creative Commons Public Domain Dedication waiver (http://creativecommons.org/publicdomain/zero/1.0/) applies to thedata made available in this article, unless otherwise stated in a credit line to the data.
* Correspondence: [email protected] Key Laboratory of Resources and Environmental Information System,Institute of Geographic Sciences and Natural Resources Research, ChineseAcademy of Sciences, Beijing 100101, China2University of Chinese Academy of Sciences, Beijing 100049, China
Wang and Wang BMC Public Health (2020) 20:822 https://doi.org/10.1186/s12889-020-08890-4

total number of deaths from communicable, maternal,perinatal and nutritional conditions [1, 3]. The WorldHealth Organization (WHO) estimates that by 2020,NCDs will account for 80% of the global disease burden.Seven out of every ten deaths in developing countriesare caused by NCDs, and about half of these deaths arein people younger than 70 years [4–7]. Moreover, theglobal NCD burden will increase by 17% in the nextdecade, and in Africa, it will increase by 27%. Nearly halfof all deaths in Asia are attributable to NCDs, account-ing for 47% of the global disease burden [4]. TheInternational Symposium on “NCDs in DevelopingCountries” was held on 22 March 2014 at Ludwig-Maximilians-Universität in Munich, Germany, to discussthe direction of NCD control in developing countries[8]. This is an indication that developing countries arebeginning to pay more attention to NCDs.NCDs are a kind of “rich and noble diseases” in peo-
ple’s conventional cognition. Their impact has beenattracting attention in countries and regions with a highdegree of economic development and a severely ageingpopulation, and they are also a matter of significant con-cern internationally. Developed countries have beenbearing the NCD burden from the early years, so theyhave accumulated more experience in the disease pre-vention and control. But, in recent years, people havediscovered that NCDs are not just “rich and noble dis-eases”, and their impact on developing countries cannotbe underestimated [9]. Developing countries and regionshave not shaken off the impact of infectious diseases,and the NCD burden has increased rapidly [10]. Espe-cially for LMICs and regions, NCDs have even become abarrier to their continued economic development andprogress [11]. Ultimately, the mechanism of NCDs is in-extricably linked with the influence of socio-economicfactors, and the transition of human disease burden frominfectious to non-infectious diseases has been driven bymany factors indicating economic development [12]. Itis just that the leading factors for and risks of NCDs incountries and regions at different economic developmentstages are different. The specific manifestations of hu-man socio-economic development related to the occur-rence of NCDs have the following major aspects: interms of economy, increased financial capacity and in-creased disposable income [13–17]; in terms of diet, thetransition from traditional foods to high-fat, high-saltand high-sugar processed foods, with diet structure be-coming unhealthy [17–23]; in terms of work and life-style, because of the change in the type and nature ofwork and the increase in living pressure—coupled withchanges in the type of daily recreational activities—people have become more sedentary and lack physicalactivity [16, 17, 24–29]; and in terms of educationalawareness, including alcohol and tobacco consumption
and control [13, 20, 25, 26, 30–40]. In addition, infec-tious diseases can be effectively controlled through med-ical means such as vaccines and drugs, but NCDs haveno effective means of control because of their relativelycomplicated mechanism of action. Therefore, the pro-portion of NCD deaths will continue to increase [12].Hence, whether in developed or developing countries,the NCD burden on human beings cannot be ignored.This study also explores the changing trend of NCD
deaths from the perspective of socio-economics, whichis based on the study of socio-economic factors. Unlikeprevious studies, this study considers the stratified het-erogeneity of socio-economic development as the entrypoint. The socio-economic development of differentcountries around the world does not necessarily followthe same path and laws, but different types showdifferent development paths. NCD deaths are related tosocio-economic development, so they may also showcorresponding stratified heterogeneity. That is to say,the development trend of NCD deaths in different coun-try types and development stages would also be differ-ent, whereas the same country types may show similardevelopment laws. Exploring the change and develop-ment of NCD deaths on such a layered basis will getmore accurate results than do ordinary global studies.The evolution tree model (Geotree) is a multidimen-sional visualization model with stratified heterogeneityas its core [41, 42]. The spatio-temporal evolution treemodel is not limited by dimensions. By combining thedevelopment law of things, the mechanisms and evolu-tion that may exist in multidimensional data areexpressed in a simple and clear visual form [42]. Inaddition, the multilevel model (MLM) in Geotree iscompletely based on stratified heterogeneity for modelfitting and predicting future changes in NCD deaths,which provides better accuracy than ordinary globalmodels do. It is worth mentioning that Geotree not onlyhas the results of quantitative analysis, but also coversthe qualitative description, which makes it possible toexplain the changing trend of NCD deaths mechanically.
MethodsNCD death dataThere were two types of NCD death data used in thisstudy: (i) data on NCD deaths from 176 countries inthe world in 2015 and (ii) data on NCD deaths of thetotal number of deaths from 176 countries in theworld in 2015. Both types of data were sourced fromthe WHO database [43]. The NCDs data used in thisarticle mainly include diseases such as cancer, dia-betes mellitus, cardiovascular diseases, digestive dis-eases, skin diseases, musculoskeletal diseases, andcongenital anomalies.
Wang and Wang BMC Public Health (2020) 20:822 Page 2 of 13
Socio-economic dataCurrent dataIn terms of economic development, the gross domesticproduct (GDP) per capita was a proxy variable for acountry’s level of economic development and was usedto define the type of development of the country. Thedata for 2015 were from the World Bank database.In terms of social development, the urbanization rate
was used as an indicator to reflect the degree of socialdevelopment and was used to define the developmentstage of a country. The data for 2015 were sourced fromthe World Bank database.In terms of medical development, the neonatal infant
mortality rate was used as a proxy variable for the levelof medical development and was used to define the de-velopment stage of a country. The data for 2015 werefrom the World Bank database.
Future dataThis study used an MLM to predict the levels of NCDdeaths in countries around the world for 2030. Therewere two sources of socio-economic factor data used forprediction. Part of the data were from the Shared Socio-economic Pathways (SSP) database [44–47]. The indica-tors used were global population data, global GDP dataand global urbanization rate data.The neonatal infant mortality data were linearly ex-
trapolated from the 1960–2016 data (sourced from theWorld Bank database) to obtain neonatal infant mortal-ity data from countries around the world for 2030 andused as explanatory variables in the MLM in predictionexperiments.
Geotree method—tree structure constructionAs a complex object, the manner in which a countryevolves is not completely explained by a single-modelmethod. This complex, multidimensional developmentprocess is similar to the evolution of organisms. Theevolution tree model draws on the evolutionary theoryof biology, and the development path of the country canbe described by the growth process of the tree structure.Generally, the evolution tree model consists of a two-
level classification. In this study, the first- and second-level classifications were the country type and countrydevelopment stage, respectively. The statistical unit ofthe research object was 176 countries over the world,and different aspects of socio-economic factors were se-lected as indicators for the two-level classification. In theconstructed tree structure, the first branches, secondtrunks and leaves of the evolution tree represented dif-ferent classification information, which are the countrytype, development stage, and country individual, respect-ively. The calculation results of the evolution treeprovide hierarchical heterogeneity information for
subsequent research, which is a new idea to the predic-tion of development trend of NCD death.
First branches—country typesThe level of income is currently the internationally usedstandard for classifying countries, reflecting the overalleconomic development of a country and the degree ofwealth of its citizens. According to the World Bank’s2018 income standards, low-income economies are de-fined as those with a gross national income (GNI) percapita of $1025 or less in 2018; lower middle-incomeeconomies are those with a GNI per capita between$1026 and $3995; upper middle-income economies arethose with a GNI per capita between $3996 and $12,375;and high-income economies are those with a GNI percapita of $12,376 or more. GDP per capita is roughlyequivalent to GNI per capita [48], so this study divided176 countries into four different country types on thebasis of their level of GDP per capita. The four countrytypes were (I) low-income economies (26 countries), (II)lower middle-income economies (50 countries), (III)upper middle-income economies (51 countries) and (IV)high-income economies (49 countries) (Fig. 1, Table 1).
Second trunks—country development stagesThe country development stage used a more detailedmeasurement of the level of social development andmedical care and chose to use the urbanization and neo-natal infant mortality rates as indicators for calculation.Each indicator was divided into six strata by the naturaldiscontinuity method, and the weights were interpretedby calculating the explanatory power of influencing fac-tors on NCD deaths, which was finally synthesized intothe total development stage. The amount of explanatorypower was chosen to be measured using the Geodetectorq-statistic (Table 2). After calculation, the weights ofneonatal infant mortality and urbanization rates in thesecondary trunks of the NCD mortality rate evolutiontree were 0.55 and 0.45, respectively. In contrast, forNCD death proportion evolution tree, the weights ofneonatal infant mortality and urbanization rates were0.75 and 0.25, respectively.
LeavesEach of the 176 countries was classified as a countrytype and development stage and was represented byleaves on the trunks, which were associated withbranches on the evolution tree.
MLM methodThe combination of evolution tree model and MLMacted as the key to the prediction function of theevolution tree model. The evolution tree presented ahierarchical structure that could be modelled using an
Wang and Wang BMC Public Health (2020) 20:822 Page 3 of 13
MLM. The MLM extended general regression by ana-lysing stratified [49] and cross-classified data [50, 51]while examining the effects of group- and individual-level covariates on individual-level outcomes (e.g.urban land expansion or disease rates) [52]. TheMLM decomposed the total variance into differentlevels in the context phenomenon [53]. In addition, it
operated on multiple scales or levels, so the overallmodel could include the microscale of the individualand the macroscale of the population [54].
Cross-classified MLMEntities such as countries can be cross-classified intocountry types and development stages. Cross-
Table 1 Countries belong to type I to IV
Countrytype
Country name
Type I Afghanistan, Benin, Burkina Faso, Burundi, Central African Republic, Chad, Democratic Republic of the Congo, Eritrea, Ethiopia, Gambia,Guinea, Guinea-Bissau, Liberia, Madagascar, Malawi, Mali, Mozambique, Nepal, Niger, Rwanda, Senegal, Sierra Leone, Togo, Uganda,United Republic of Tanzania, Zimbabwe
Type II Angola, Armenia, Bangladesh, Bhutan, Bolivia (Plurinational State of), Cabo Verde, Cambodia, Cameroon, Congo, Côte d’Ivoire, Djibouti,Egypt, El Salvador, Georgia, Ghana, Guatemala, Honduras, India, Indonesia, Jordan, Kenya, Kiribati, Kyrgyzstan, Lao People’s DemocraticRepublic, Lesotho, Mauritania, Micronesia (Federated States of), Mongolia, Morocco, Myanmar, Nicaragua, Nigeria, Pakistan, Papua NewGuinea, Philippines, Republic of Moldova, Sao Tome and Principe, Solomon Islands, Sri Lanka, Sudan, Tajikistan, Timor-Leste, Tunisia,Ukraine, Uzbekistan, Vanuatu, Viet Nam, Yemen, Zambia
Type III Albania, Algeria, Argentina, Azerbaijan, Belarus, Belize, Bosnia and Herzegovina, Botswana, Brazil, Bulgaria, China, Colombia, Costa Rica,Croatia, Cuba, Dominican Republic, Ecuador, Equatorial Guinea, Fiji, Gabon, Grenada, Guyana, Iran (Islamic Republic of), Iraq, Jamaica,Kazakhstan, Lebanon, Libya, Malaysia, Maldives, Mauritius, Mexico, Montenegro, Namibia, Panama, Paraguay, Peru, Republic of NorthMacedonia, Romania, Russian Federation, Saint Lucia, Saint Vincent and the Grenadines, Samoa, Serbia, South Africa, Suriname, Thailand,Tonga, Turkey, Turkmenistan, Venezuela (Bolivarian Republic of)
Type IV Antigua and Barbuda, Australia, Austria, Bahamas, Bahrain, Barbados, Belgium, Brunei Darussalam, Canada, Chile, Cyprus, Czechia,Denmark, Estonia, Finland, France, Germany, Greece, Hungary, Iceland, Ireland, Israel, Italy, Japan, Kuwait, Latvia, Lithuania, Luxembourg,Malta, Netherlands, New Zealand, Norway, Oman, Poland, Portugal, Republic of Korea, Saudi Arabia, Seychelles, Singapore, Slovakia,Slovenia, Spain, Sweden, Switzerland, Trinidad and Tobago, United Arab Emirates, United Kingdom of Great Britain and NorthernIreland, United States of America, Uruguay
Fig. 1 Spatial distribution of the four country types
Wang and Wang BMC Public Health (2020) 20:822 Page 4 of 13
classification allows effects from two different “back-grounds”: country type and development stage. The cross-classification model was applicable to the research objectof this study, and its formula expression is as follows [55]:
yi t;sð Þ ¼ β0 þ β1x1i t;sð Þ þ ut þ us þ ei t;sð Þ
ut � N 0; σ2u tð Þ� �
; us � N 0; σ2u sð Þ� �
; ei t;sð Þ � N 0; σ2e� � ð1Þ
where yi(t, s) is the NCD death parameter of country i,contained in the cell defined by country type t and de-velopment stage s, which is explained by the tree; β0 isthe mean NCD death parameter across all group-levelunits (i.e. country type and development stage), ut is theeffect of country type t, us is the effect of developmentstage s, and ei(t, s) is the country-level residual error termfor city i contained in the cell defined by country type tand development stage s.
Geodetector methodThis method involves weight allocation to the two indica-tors in the calculation of the country development stage.The country development stage was calculated byurbanization and neonatal mortality rates, and the weightof each indicator was determined according to the inten-sity of the interpretation of the explained variables. Here,we used the q-statistic of the Geodetector to measure theintensity of interpretation, which is mainly used to detectthe difference of geographic elements and their factors in-fluencing the spatial distribution of research objects [56].The q-statistic of the Geodetector can be used to ex-
plain the explanatory power of the influencing factors onthe research object. The higher the q-value, the higherthe explanatory power. In this study, the magnitude ofthe q-value of the Geodetector was used to judge the ex-planatory power of second trunks influencing factorsthat affect the country development stage in order to al-locate a weight ratio and synthesize the final compre-hensive development stage. The model formula is asfollows:
q ¼ 1−1
Nσ2XL
h¼1Nhσ2h ð2Þ
where q is the detection force indicator of the influencingfactors of NCD deaths; Nh is the number of sample unitsin the secondary region; N is the number of sample unitsin the entire area; L is the number of secondary areas; σ2
is the variance of NCD deaths in the entire region; and σ2his the variance of the secondary area. The value range of qis [0, 1]. When q = 0, the explanatory power of the ex-planatory variable to the interpreted variable is 0, and thehigher the q-value, the higher the explanatory power ofthe explanatory variable to the explained variable.
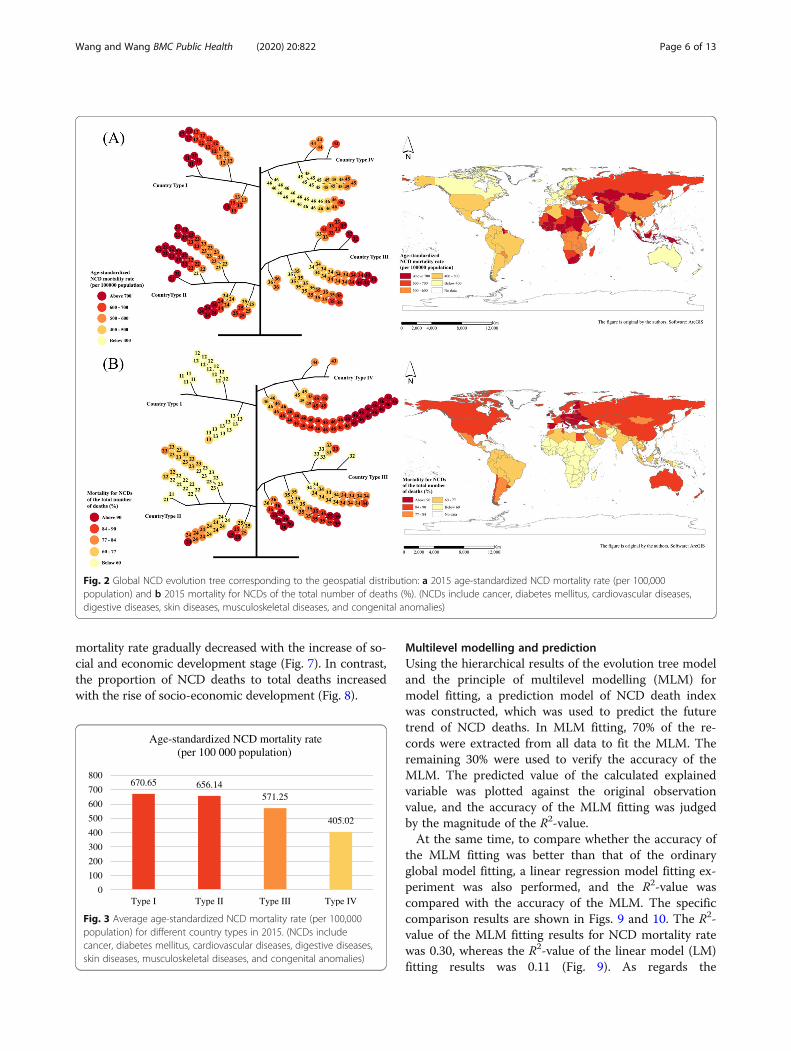
ResultsCountry-type geographic distributionAfter classification calculation, the global NCD death in-dicator evolution tree was constructed, and the treestructure is shown in Fig. 2. From the distribution ofNCD deaths shown in the map, it can be seen that theNCD death index did not show a very significant spatialaggregation and other distribution rules in space, so theevolution tree model was used to explore the dimensionof attributes. In addition, the distribution of NCD deathindexes in different branches of the tree structure can befurther explored.
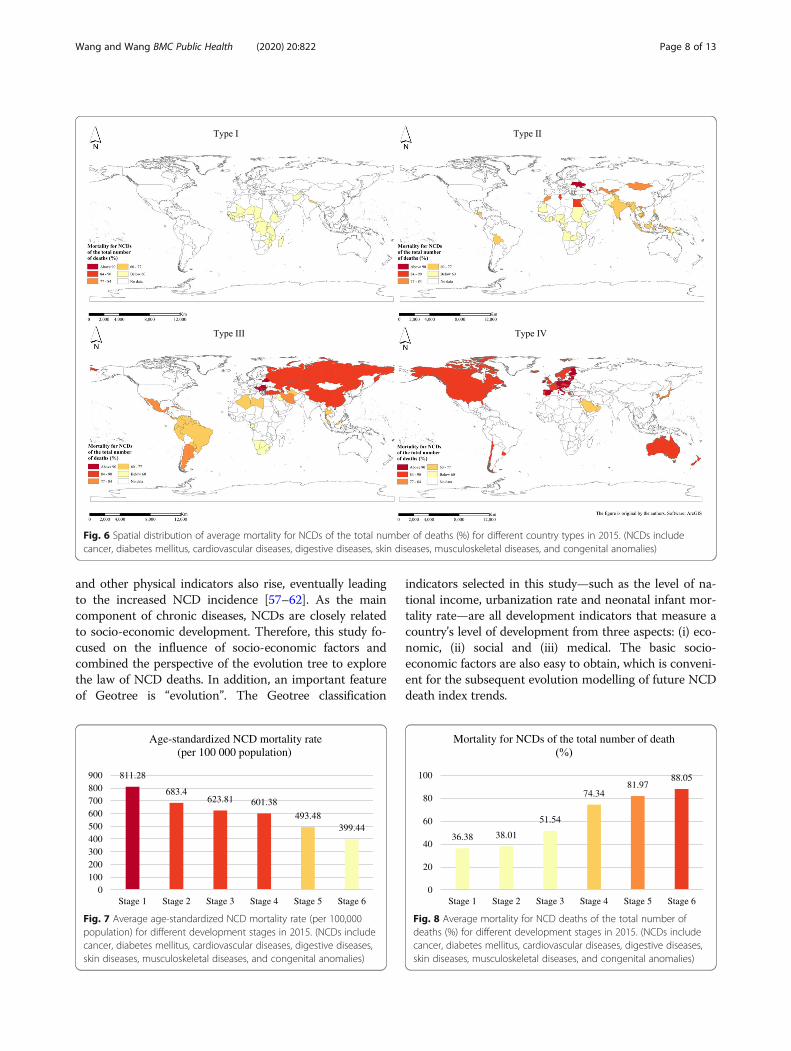
Comparison and trend of NCD death indexes for differentcountry typesThe NCD death index presents different distributionpatterns and development trends in different countrytypes. As for the NCD mortality rate, as the national in-come increases, the mortality rate shows a gradual de-cline. The order of the average NCD mortality rate fromhigh to low is as follows: low-income countries, lowermiddle-income countries, upper middle-income coun-tries and high-income countries (Fig. 3). Figure 4 showsthe geospatial distribution.As regards the proportion of NCD deaths to total
deaths, it shows an upward trend as the country’s incomeincreases. That is, the proportion of average NCD deathsto total deaths from low to high is low-income countries,lower middle-income countries, upper middle-incomecountries and high-income countries (Fig. 5). Figure 6shows the geospatial distribution.
Comparison and trend of NCD death indexes at differentcountry development stagesThe countries were classified according to their socio-economic development stages by measuring the neonatalinfant mortality and level of urbanization, and the NCDdeath indicators in different countries at different develop-ment stages also showed different distribution laws andtrends. According to calculation and analysis, the NCD
Table 2 q-Values of the second trunks indicators for NCD deathindexes. (NCDs include cancer, diabetes mellitus, cardiovasculardiseases, digestive diseases, skin diseases, musculoskeletaldiseases, and congenital anomalies)
Newborn infant mortality Urbanization rate
Age-standardized NCD mortality rate (per 100,000 population)
q statistic 0.46647 0.389107
p value 0.000 0.000
Mortality for NCDs of the total number of death (%)
q statistic 0.780991 0.258799
p value 0.000 0.000
Wang and Wang BMC Public Health (2020) 20:822 Page 5 of 13
mortality rate gradually decreased with the increase of so-cial and economic development stage (Fig. 7). In contrast,the proportion of NCD deaths to total deaths increasedwith the rise of socio-economic development (Fig. 8).
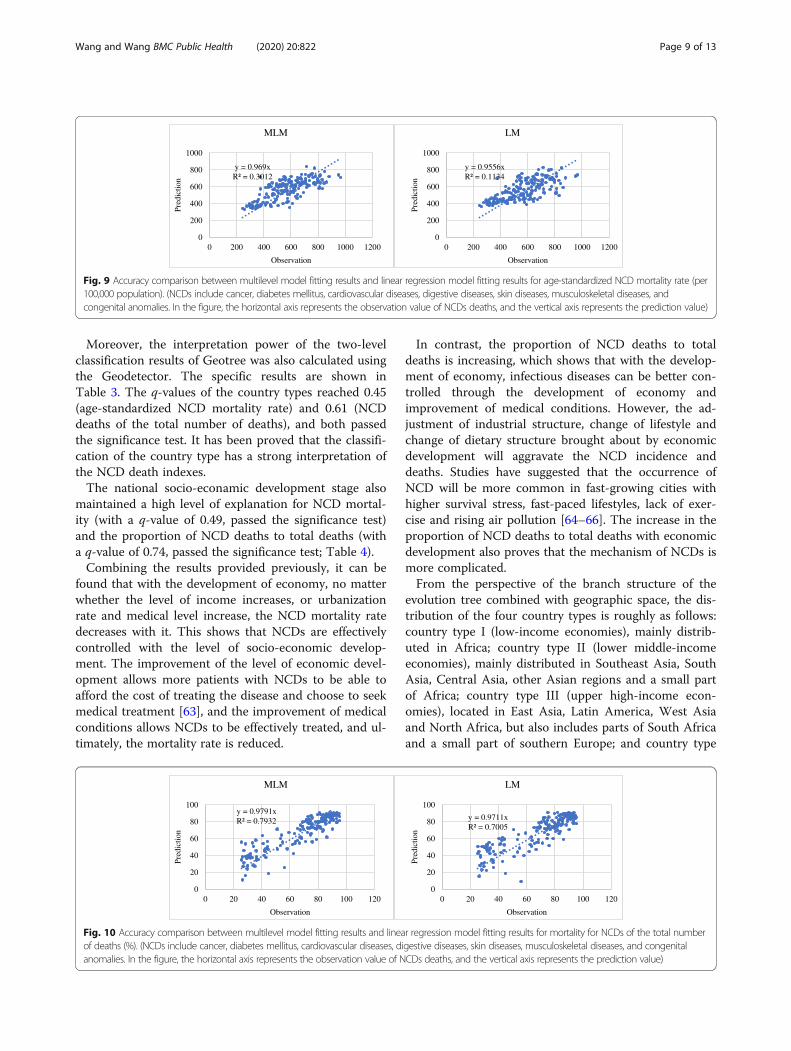
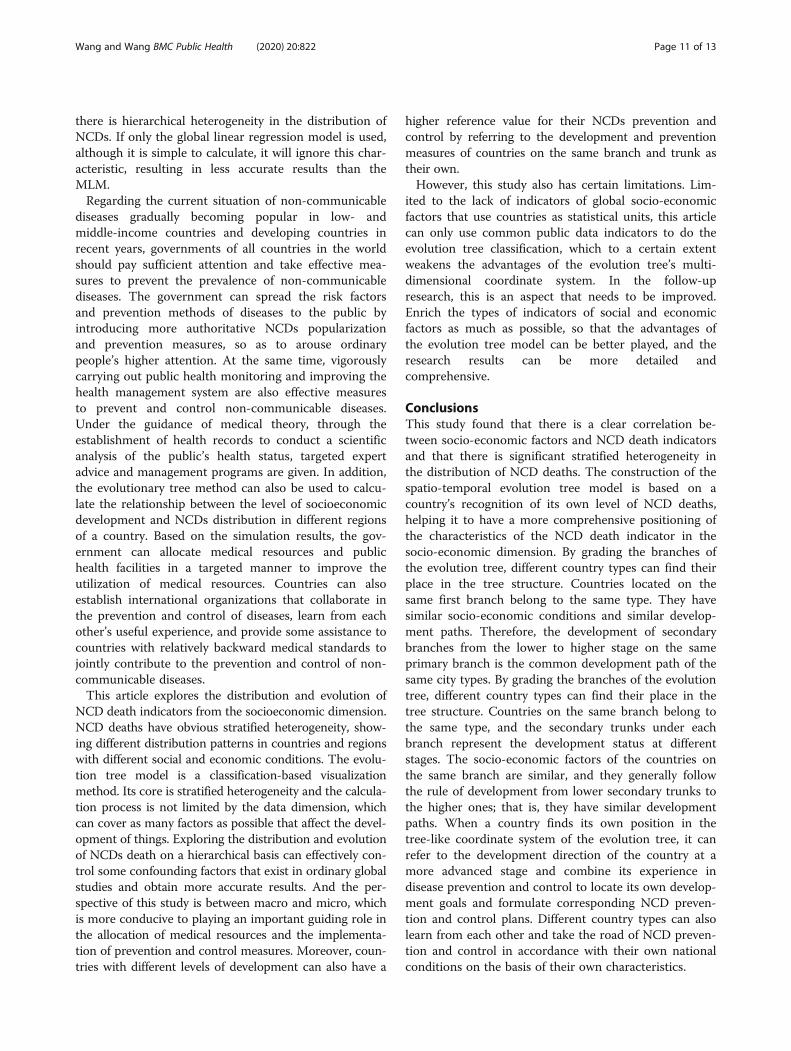
Multilevel modelling and predictionUsing the hierarchical results of the evolution tree modeland the principle of multilevel modelling (MLM) formodel fitting, a prediction model of NCD death indexwas constructed, which was used to predict the futuretrend of NCD deaths. In MLM fitting, 70% of the re-cords were extracted from all data to fit the MLM. Theremaining 30% were used to verify the accuracy of theMLM. The predicted value of the calculated explainedvariable was plotted against the original observationvalue, and the accuracy of the MLM fitting was judgedby the magnitude of the R2-value.At the same time, to compare whether the accuracy of
the MLM fitting was better than that of the ordinaryglobal model fitting, a linear regression model fitting ex-periment was also performed, and the R2-value wascompared with the accuracy of the MLM. The specificcomparison results are shown in Figs. 9 and 10. The R2-value of the MLM fitting results for NCD mortality ratewas 0.30, whereas the R2-value of the linear model (LM)fitting results was 0.11 (Fig. 9). As regards the
670.65 656.14571.25
405.02
0
100
200
300
400
500
600
700
800
Type I Type II Type III Type IV
Age-standardized NCD mortality rate (per 100 000 population)
Fig. 3 Average age-standardized NCD mortality rate (per 100,000population) for different country types in 2015. (NCDs includecancer, diabetes mellitus, cardiovascular diseases, digestive diseases,skin diseases, musculoskeletal diseases, and congenital anomalies)
Fig. 2 Global NCD evolution tree corresponding to the geospatial distribution: a 2015 age-standardized NCD mortality rate (per 100,000population) and b 2015 mortality for NCDs of the total number of deaths (%). (NCDs include cancer, diabetes mellitus, cardiovascular diseases,digestive diseases, skin diseases, musculoskeletal diseases, and congenital anomalies)
Wang and Wang BMC Public Health (2020) 20:822 Page 6 of 13

proportion of NCD deaths to total deaths, the R2-valuesof the MLM and LM fitting results were 0.79 and 0.70,respectively (Fig. 10). It was found that the fitting accur-acy of the MLM is generally higher than that of the or-dinary global linear regression model.Using this feature and advantage of the MLM, this
study predicted the NCD death indicators in 176 coun-tries around the world for 2030. The specific results are
shown in Fig. 11. It has been predicted that by 2030, theglobal average age-standardized NCD mortality ratewould be 510.54 (per 100,000 population) and the globalaverage NCD deaths of the total number of deathswould be 75.26%.
DiscussionIn this study, the level of national income was se-lected as a classification indicator of the first branchesof the NCD evolution tree. The level of income (orGDP) is one of the most direct factors for measuringa country’s economic development, and it is also auniversal standard for international classification ofcountries. In the construction of the secondary trunksof the evolution tree, this study opted to use the levelof urbanization and neonatal mortality as the calcula-tion indicators, mainly because the development ofurban areas and the improvement of medical condi-tions are also two important aspects to measure thesocial and economic development of a country. Somestudies have found that, with the development ofurbanization, the diet structure tends to be high insugar, salt and oil, there is lack of exercise, andpeople tend to lead a sedentary life. Their averagebody mass index (BMI), blood lipids, blood pressure
Fig. 4 Spatial distribution of average age-standardized NCD mortality rate (per 100,000 population) for different country types in 2015. (NCDsinclude cancer, diabetes mellitus, cardiovascular diseases, digestive diseases, skin diseases, musculoskeletal diseases, and congenital anomalies)
34.32
61.78
77.2586.22
0
20
40
60
80
100
Type I Type II Type III Type IV
Mortality for NCDs of the total number of death
Fig. 5 The mortality for NCD deaths of the total number of deaths(%) for different country types in 2015. (NCDs include cancer,diabetes mellitus, cardiovascular diseases, digestive diseases, skindiseases, musculoskeletal diseases, and congenital anomalies)
Wang and Wang BMC Public Health (2020) 20:822 Page 7 of 13
and other physical indicators also rise, eventually leadingto the increased NCD incidence [57–62]. As the maincomponent of chronic diseases, NCDs are closely relatedto socio-economic development. Therefore, this study fo-cused on the influence of socio-economic factors andcombined the perspective of the evolution tree to explorethe law of NCD deaths. In addition, an important featureof Geotree is “evolution”. The Geotree classification
indicators selected in this study—such as the level of na-tional income, urbanization rate and neonatal infant mor-tality rate—are all development indicators that measure acountry’s level of development from three aspects: (i) eco-nomic, (ii) social and (iii) medical. The basic socio-economic factors are also easy to obtain, which is conveni-ent for the subsequent evolution modelling of future NCDdeath index trends.
Fig. 6 Spatial distribution of average mortality for NCDs of the total number of deaths (%) for different country types in 2015. (NCDs includecancer, diabetes mellitus, cardiovascular diseases, digestive diseases, skin diseases, musculoskeletal diseases, and congenital anomalies)
811.28
683.4623.81 601.38
493.48399.44
0100200300400500600700800900
Stage 1 Stage 2 Stage 3 Stage 4 Stage 5 Stage 6
Age-standardized NCD mortality rate (per 100 000 population)
Fig. 7 Average age-standardized NCD mortality rate (per 100,000population) for different development stages in 2015. (NCDs includecancer, diabetes mellitus, cardiovascular diseases, digestive diseases,skin diseases, musculoskeletal diseases, and congenital anomalies)
36.38 38.01
51.54
74.3481.97
88.05
0
20
40
60
80
100
Stage 1 Stage 2 Stage 3 Stage 4 Stage 5 Stage 6
Mortality for NCDs of the total number of death
Fig. 8 Average mortality for NCD deaths of the total number ofdeaths (%) for different development stages in 2015. (NCDs includecancer, diabetes mellitus, cardiovascular diseases, digestive diseases,skin diseases, musculoskeletal diseases, and congenital anomalies)
Wang and Wang BMC Public Health (2020) 20:822 Page 8 of 13
Moreover, the interpretation power of the two-levelclassification results of Geotree was also calculated usingthe Geodetector. The specific results are shown inTable 3. The q-values of the country types reached 0.45(age-standardized NCD mortality rate) and 0.61 (NCDdeaths of the total number of deaths), and both passedthe significance test. It has been proved that the classifi-cation of the country type has a strong interpretation ofthe NCD death indexes.The national socio-econamic development stage also
maintained a high level of explanation for NCD mortal-ity (with a q-value of 0.49, passed the significance test)and the proportion of NCD deaths to total deaths (witha q-value of 0.74, passed the significance test; Table 4).Combining the results provided previously, it can be
found that with the development of economy, no matterwhether the level of income increases, or urbanizationrate and medical level increase, the NCD mortality ratedecreases with it. This shows that NCDs are effectivelycontrolled with the level of socio-economic develop-ment. The improvement of the level of economic devel-opment allows more patients with NCDs to be able toafford the cost of treating the disease and choose to seekmedical treatment [63], and the improvement of medicalconditions allows NCDs to be effectively treated, and ul-timately, the mortality rate is reduced.
In contrast, the proportion of NCD deaths to totaldeaths is increasing, which shows that with the develop-ment of economy, infectious diseases can be better con-trolled through the development of economy andimprovement of medical conditions. However, the ad-justment of industrial structure, change of lifestyle andchange of dietary structure brought about by economicdevelopment will aggravate the NCD incidence anddeaths. Studies have suggested that the occurrence ofNCD will be more common in fast-growing cities withhigher survival stress, fast-paced lifestyles, lack of exer-cise and rising air pollution [64–66]. The increase in theproportion of NCD deaths to total deaths with economicdevelopment also proves that the mechanism of NCDs ismore complicated.From the perspective of the branch structure of the
evolution tree combined with geographic space, the dis-tribution of the four country types is roughly as follows:country type I (low-income economies), mainly distrib-uted in Africa; country type II (lower middle-incomeeconomies), mainly distributed in Southeast Asia, SouthAsia, Central Asia, other Asian regions and a small partof Africa; country type III (upper high-income econ-omies), located in East Asia, Latin America, West Asiaand North Africa, but also includes parts of South Africaand a small part of southern Europe; and country type
y = 0.969xR² = 0.3012
0
200
400
600
800
1000
0 200 400 600 800 1000 1200
Pred
ictio
n
Observation
MLM
y = 0.9556xR² = 0.1134
0
200
400
600
800
1000
0 200 400 600 800 1000 1200
Pred
ictio
n
Observation
LM
Fig. 9 Accuracy comparison between multilevel model fitting results and linear regression model fitting results for age-standardized NCD mortality rate (per100,000 population). (NCDs include cancer, diabetes mellitus, cardiovascular diseases, digestive diseases, skin diseases, musculoskeletal diseases, andcongenital anomalies. In the figure, the horizontal axis represents the observation value of NCDs deaths, and the vertical axis represents the prediction value)
y = 0.9791xR² = 0.7932
0
20
40
60
80
100
0 20 40 60 80 100 120
Pred
ictio
n
Observation
MLM
y = 0.9711xR² = 0.7005
0
20
40
60
80
100
0 20 40 60 80 100 120
Pred
ictio
n
Observation
LM
Fig. 10 Accuracy comparison between multilevel model fitting results and linear regression model fitting results for mortality for NCDs of the total numberof deaths (%). (NCDs include cancer, diabetes mellitus, cardiovascular diseases, digestive diseases, skin diseases, musculoskeletal diseases, and congenitalanomalies. In the figure, the horizontal axis represents the observation value of NCDs deaths, and the vertical axis represents the prediction value)
Wang and Wang BMC Public Health (2020) 20:822 Page 9 of 13

IV (high-income economies), mainly North America,Europe and a small part of Oceania. On the contrary,the regions with higher NCD mortality rate are countrieswith lower levels of economic development, mainlycountries in Africa and some countries in Asia(Southeast Asia, South Asia, etc.). The regions with ahigher proportion of NCD deaths to total deaths are de-veloped regions such as North America and Europe.This also proves from the side that the NCD death in-dexes and level of economic development show a highcorrelation; that is, the NCD mortality rate and the levelof economic development generally show a negative cor-relation, and the proportion of NCD deaths to totaldeaths and the level of economic development areroughly positively correlated.Although the close relationship between NCDs and
socio-economic development shows a positive or nega-tive correlation as a whole, the leading factors for the oc-currence of NCDs are different in countries and regionsat different socio-economic development stages. In com-parison, in less developed areas (such as country type Iand II), the residents have higher levels of alcohol andcigarette consumption and start smoking at a young age(including second-hand smoke); even tobacco consump-tion by some poor families is equivalent to the dietary
expenditures of one or two undernourished children [36,66–70]. These people also consume insufficient fruit andvegetables [16, 32, 66, 71–73]. Moreover, they may de-velop NCDs because of some congenital factors or theinduction of a harsh living environment, such as poorbreastfeeding and being underweight during childhood[74]. In addition, because of the backward level of socio-economic development, fossil fuels account for a rela-tively high proportion in household use, such as heatingand cooking, so household air pollution is also the causeof some kinds of NCDs [74]. In contrast, the residents inregions with high levels of socio-economic development(such as country type III and IV) display lack of physicalactivities and consume more high-oil and high-salt proc-essed foods [66, 75–77]. Therefore, in contrast to under-developed regions, NCDs caused by abnormal physicalindicators (blood pressure, blood lipids, BMI, etc.) re-sulted from acquired dietary habits and living habits arethe main part of NCD incidence [59]; this part alsoneeds to be explored in future experiments.In the MLM fitting experiment, an MLM and a gen-
eral global linear regression model were used for fitting.From the calculation results, it can be seen that the pre-diction accuracy of the MLM is better than that of thegeneral global linear regression model. This shows that
Fig. 11 Spatial prediction of NCD death indexes in 2030: a global age-standardized NCD mortality rate (per 100,000 population) and b globalmortality for NCDs of the total number of deaths (%). (NCDs include cancer, diabetes mellitus, cardiovascular diseases, digestive diseases, skindiseases, musculoskeletal diseases, and congenital anomalies)
Table 3 q-Values of the country types for different NCD deathindexes. (NCDs include cancer, diabetes mellitus, cardiovasculardiseases, digestive diseases, skin diseases, musculoskeletaldiseases, and congenital anomalies)
Age-standardizedNCD mortality rate
Mortality for NCDs of thetotal number of deaths
q statistic 0.452723 0.612019
p value 0.000 0.000
Table 4 q-Values of the national socio-economic developmentstage for different NCD death indexes. (NCDs include cancer,diabetes mellitus, cardiovascular diseases, digestive diseases, skindiseases, musculoskeletal diseases, and congenital anomalies)
Age-standardizedNCD mortality rate
Mortality for NCDs of thetotal number of deaths
q statistic 0.492107 0.735285
p value 0.000 0.000
Wang and Wang BMC Public Health (2020) 20:822 Page 10 of 13
there is hierarchical heterogeneity in the distribution ofNCDs. If only the global linear regression model is used,although it is simple to calculate, it will ignore this char-acteristic, resulting in less accurate results than theMLM.Regarding the current situation of non-communicable
diseases gradually becoming popular in low- andmiddle-income countries and developing countries inrecent years, governments of all countries in the worldshould pay sufficient attention and take effective mea-sures to prevent the prevalence of non-communicablediseases. The government can spread the risk factorsand prevention methods of diseases to the public byintroducing more authoritative NCDs popularizationand prevention measures, so as to arouse ordinarypeople’s higher attention. At the same time, vigorouslycarrying out public health monitoring and improving thehealth management system are also effective measuresto prevent and control non-communicable diseases.Under the guidance of medical theory, through theestablishment of health records to conduct a scientificanalysis of the public’s health status, targeted expertadvice and management programs are given. In addition,the evolutionary tree method can also be used to calcu-late the relationship between the level of socioeconomicdevelopment and NCDs distribution in different regionsof a country. Based on the simulation results, the gov-ernment can allocate medical resources and publichealth facilities in a targeted manner to improve theutilization of medical resources. Countries can alsoestablish international organizations that collaborate inthe prevention and control of diseases, learn from eachother’s useful experience, and provide some assistance tocountries with relatively backward medical standards tojointly contribute to the prevention and control of non-communicable diseases.This article explores the distribution and evolution of
NCD death indicators from the socioeconomic dimension.NCD deaths have obvious stratified heterogeneity, show-ing different distribution patterns in countries and regionswith different social and economic conditions. The evolu-tion tree model is a classification-based visualizationmethod. Its core is stratified heterogeneity and the calcula-tion process is not limited by the data dimension, whichcan cover as many factors as possible that affect the devel-opment of things. Exploring the distribution and evolutionof NCDs death on a hierarchical basis can effectively con-trol some confounding factors that exist in ordinary globalstudies and obtain more accurate results. And the per-spective of this study is between macro and micro, whichis more conducive to playing an important guiding role inthe allocation of medical resources and the implementa-tion of prevention and control measures. Moreover, coun-tries with different levels of development can also have a
higher reference value for their NCDs prevention andcontrol by referring to the development and preventionmeasures of countries on the same branch and trunk astheir own.However, this study also has certain limitations. Lim-
ited to the lack of indicators of global socio-economicfactors that use countries as statistical units, this articlecan only use common public data indicators to do theevolution tree classification, which to a certain extentweakens the advantages of the evolution tree’s multi-dimensional coordinate system. In the follow-upresearch, this is an aspect that needs to be improved.Enrich the types of indicators of social and economicfactors as much as possible, so that the advantages ofthe evolution tree model can be better played, and theresearch results can be more detailed andcomprehensive.
ConclusionsThis study found that there is a clear correlation be-tween socio-economic factors and NCD death indicatorsand that there is significant stratified heterogeneity inthe distribution of NCD deaths. The construction of thespatio-temporal evolution tree model is based on acountry’s recognition of its own level of NCD deaths,helping it to have a more comprehensive positioning ofthe characteristics of the NCD death indicator in thesocio-economic dimension. By grading the branches ofthe evolution tree, different country types can find theirplace in the tree structure. Countries located on thesame first branch belong to the same type. They havesimilar socio-economic conditions and similar develop-ment paths. Therefore, the development of secondarybranches from the lower to higher stage on the sameprimary branch is the common development path of thesame city types. By grading the branches of the evolutiontree, different country types can find their place in thetree structure. Countries on the same branch belong tothe same type, and the secondary trunks under eachbranch represent the development status at differentstages. The socio-economic factors of the countries onthe same branch are similar, and they generally followthe rule of development from lower secondary trunks tothe higher ones; that is, they have similar developmentpaths. When a country finds its own position in thetree-like coordinate system of the evolution tree, it canrefer to the development direction of the country at amore advanced stage and combine its experience indisease prevention and control to locate its own develop-ment goals and formulate corresponding NCD preven-tion and control plans. Different country types can alsolearn from each other and take the road of NCD preven-tion and control in accordance with their own nationalconditions on the basis of their own characteristics.
Wang and Wang BMC Public Health (2020) 20:822 Page 11 of 13
AbbreviationsBMI: Body mass index; GDP: Gross domestic product; GNI: Gross nationalincome; LMICs: Low- and middle-income countries; MLM: Multilevel model;LM: Linear model; NCDs: Non-communicable diseases; WHO: World HealthOrganization
AcknowledgementsNot applicable.
Authors’ contributionsWY conceived of the study and designed the study. WY did the analyses.WJF contributed to refining the ideas. All authors discussed the results andrevised the manuscript. All authors read and approved the final manuscript.
FundingThis study was supported by the National Natural Science Foundation ofChina (grant nos: 41531179 and 41421001) and the Ministry of Science andTechnology of China (grant nos: 2016YFC1302504). These funding bodieshad no role in study design, collection or analysis/interpretation of data; theyalso had no role in manuscript writing.
Availability of data and materialsAll data needed to evaluate the conclusions in the paper are present in thepaper. Additional data related to this paper may be requested from theauthors.
Ethics approval and consent to participateNot applicable.
Consent for publicationNot applicable.
Competing interestsThe authors declare they have no competing financial interests.
Received: 9 March 2020 Accepted: 11 May 2020
References1. World Health Organization. Global status report on noncommunicable
diseases—2014. Geneva: WHO; 2014. Available at: http://www.who.int/nmh/publications/ncd-status-report-2014/en/.
2. Terzic A, Waldman S. Chronic diseases: the emerging pandemic. Clin TranslSci. 2011;4(3):225–6.
3. World Health Organization. Global health observatory—2011. Geneva: WHO;2012. Available at: https://www.who.int/gho/publications/world_health_statistics/2011/en/.
4. World Health Organization. Global action plan for the prevention andcontrol of noncommunicable diseases: 2013–2020. Geneva: WHO; 2013.Available at: https://www.who.int/nmh/events/ncd_action_plan/en/.
5. Abegunde DO, Mathers CD, Adam T, Ortegon M, Strong K. The burden andcosts of chronic diseases in low-income and middle-income countries.Lancet. 2008;370(9603):1929–38.
6. Mathers CD, Loncar D. Projections of global mortality and burden of diseasefrom 2002 to 2030. PLoS Med. 2006;3(11):e442.
7. Geneau R. Raising the priority of preventing chronic diseases: a politicalprocess. Lancet. 2010;376(9753):1689–98.
8. Islam S, Purnat T, Phuong N, Mwingira U, Schacht K, Fröschl G. Non-communicable diseases (NCDs) in developing countries: a symposiumreport. Glob Health. 2014;10(1):81.
9. Clark H. NCDs: a challenge to sustainable human development. Lancet.2013;381(9866):510–1.
10. Allotey P, Davey T, Reidpath DD. NCDs in low and middle-incomecountries—assessing the capacity of health systems to respond topopulation needs. BMC Public Health. 2014;14(Suppl 2):S1.
11. Beaglehole R, Yach D. Globalisation and the prevention and control of non-communicable disease: the neglected chronic diseases of adults. Lancet.2003;362(9387):903–8.
12. Hancock C, Kingo L, Raynaud O. The private sector, internationaldevelopment and NCDs. Glob Health. 2011;7(1):23.
13. Zaman MJ, Patel A, Jan S, Hillis GS, Raju PK, Neal B, et al. Socio-economicdistribution of cardiovascular risk factors and knowledge in rural India. Int JEpidemiol. 2012;41(5):1302–14.
14. Kar SS, Thakur JS, Virdi NK, Jain S, Kumar R. Risk factors for cardiovasculardiseases: is the social gradient reversing in northern India? Natl Med J India.2010;23(4):206–9.
15. Dhungana RR, Devkota S, Khanal MK, Gurung Y, Giri RK, Parajuli RK, et al.Prevalence of cardiovascular health risk behaviors in a remote ruralcommunity of Sindhuli district, Nepal. BMC Cardiovasc Disord. 2014;14:92.
16. Kinra S, Bowen LJ, Lyngdoh T, Prabhakaran D, Reddy KS, Ramakrishnan L,et al. Sociodemographic patterning of non-communicable disease riskfactors in rural India: a cross sectional study. BMJ. 2010;341:c4974.
17. Zeba AN, Delisle HF, Renier G. Dietary patterns and physical inactivity, twocontributing factors to the double burden of malnutrition among adults inBurkina Faso, West Africa. J Nutr Sci. 2014;3:e50.
18. Badruddin SH, Molla A, Khurshid M, Vaz S, Hassanali S. Cardiovascular riskfactors in school children from low middle income families in Karachi,Pakistan. J Pak Med Assoc. 1994;44(5):106–12.
19. Ali RA, Rastam S, Fouad FM, Mzayek F, Maziak W. Modifiable cardiovascular riskfactors among adults in Aleppo, Syria. Int J Public Health. 2011;56(6):653–62.
20. Menon J, Vijayakumar N, Joseph JK, David PC, Menon MN, Mukundan S,et al. Below the poverty line and non-communicable diseases in Kerala: theepidemiology of non-communicable diseases in rural areas (ENDIRA) study.Int J Cardiol. 2015;187:519–24.
21. Ganesan S, Raman R, Kulothungan V, Sharma T. Influence of dietary-fibreintake on diabetes and diabetic retinopathy: Sankara Nethralaya-diabeticretinopathy epidemiology and molecular genetic study (report 26). Clin ExpOphthalmol. 2012;40(3):288–94.
22. Agrawal S, Millett CJ, Dhillon PK, Subramanian S, Ebrahim S. Type of vegetariandiet, obesity and diabetes in adult Indian population. Nutr J. 2014;13(1):89.
23. Delisle H, Ntandou-Bouzitou G, Agueh V, Sodjinou R, Fayomi B.Urbanisation, nutrition transition and cardiometabolic risk: the Benin study.Br J Nutr. 2011;107(10):1534–44.
24. Bunker CH, Ukoli FA, Okoro FI, Olomu AB, Kriska AM, Huston SL, et al.Correlates of serum lipids in a lean black population. Atherosclerosis. 1996;123(1–2):215–25.
25. Charles S, Hélène D, Victoire A, Roger S, Gervais N, Michel M. Lifestyle anddietary factors associated with the evolution of cardiometabolic risk overfour years in west-African adults: the Benin study. J Obes. 2013;2013:1–9.
26. Deepa M, Anjana RM, Manjula D, Narayan KMV, Mohan V. Convergence ofprevalence rates of diabetes and cardiometabolic risk factors in middle andlow income groups in urban India: 10-year follow-up of the Chennai urbanpopulation study. J Diabetes Sci Technol. 2011;5(4):918.
27. Hosey GM, Samo M, Gregg EW, Padden D, Bibb SG. Socioeconomic anddemographic predictors of selected cardiovascular risk factors among adults livingin Pohnpei, Federated States of Micronesia. BMC Public Health. 2014;14(1):895.
28. Trinh OT, Nguyen ND, Dibley MJ, Phongsavan P, Bauman AE. Theprevalence and correlates of physical inactivity among adults in Ho ChiMinh City. BMC Public Health. 2008;8(1):204.
29. Lee I, Shiroma EJ, Lobelo F, Puska P, Blair SN, Katzmarzyk PT. Effect of physicalinactivity on major non-communicable diseases worldwide: an analysis ofburden of disease and life expectancy. Lancet. 2012;380(9838):219–29.
30. Taylor OG, Oyediran OA, Bamgboye AE, Afolabi BM, Osuntokun BO. Profileof some risk factors for coronary heart disease in a developing country:Nigeria. Afr J Med Sci. 1996;25(4):341–6.
31. Rahlenbeck SI, Gebre-Yohannes A. Cardiovascular risk factors in Ethiopianmedical students. Ann Biol Clin (Paris). 1998;56(6):705–9.
32. Hashibe M, Jacob BJ, Thomas G, Ramadas K, Zhang ZF. Socioeconomicstatus, lifestyle factors and oral premalignant lesions. Oral Oncol.2003;39(7):664–71.
33. Cubbins LA, Kasprzyk D, Montano D, Jordan LP, Woelk G. Alcohol use andabuse among rural Zimbabwean adults: a test of a community-levelintervention. Drug Alcohol Depend. 2012;124(3):333–9.
34. Laux TS, Bert PJ, González M, Unruh M, Lacourt CT. Prevalence of obesity,tobacco use, and alcohol consumption by socioeconomic status among sixcommunities in Nicaragua. Rev Panam Salud Publica. 2012;32(3):217–25.
35. Palipudi K, Rizwan SA, Sinha DN, Andes LJ, Amarchand R, Krishnan A, et al.Prevalence and sociodemographic determinants of tobacco use in fourcountries of the World Health Organization: South-East Asia region:findings from the global adult tobacco survey. Indian J Cancer. 2014;51(Suppl 1):S24–32.
Wang and Wang BMC Public Health (2020) 20:822 Page 12 of 13

36. Hosseinpoor AR, Parker LA, Tursan d’Espaignet E, Chatterji S. Socioeconomicinequality in smoking in low-income and middle-income countries: resultsfrom the world health survey. PLoS One. 2012;7(8):e42843.
37. Narayan KM, Chadha SL, Hanson RL, Tandon R, Shekhawat S, Fernandes RJ,et al. Prevalence and patterns of smoking in Delhi: cross sectional study.BMJ. 1996;312(7046):1576–9.
38. Gupta R, Sharma KK, Gupta BK, Gupta A, Gupta RR, Deedwania PC.Educational status-related disparities in awareness, treatment and control ofcardiovascular risk factors in India. Heart Asia. 2015;7(1):1–6.
39. Chawla R, Sathian B, Mehra A, Kiyawat V, Garg A, Sharma K. Awareness andassessment of risk factors for lung cancer in residents of Pokhara Valley.Asian Pac J Cancer Prev. 2010;11(6):1789.
40. Owusu-Dabo E, Lewis S, Mcneill A, Gilmore A, Britton J. Smoking uptake andprevalence in Ghana. Tob Control. 2009;18(5):365–70.
41. Wang JF, Liu X-H, Peng L, Chen H-Y, Driskell L, Zheng X-Y. Cities evolution tree andapplications to predicting urban growth. Popul Environ. 2012;33(2–3):186–201.
42. Jinfeng WANG, Yong GE, Lianfa LI, Bin MENG, Jilei WU, Yanchen BO, et al.Spatiotemporal data analysis in geography. Acta Geograph Sin. 2014;69(9):1326–45.
43. World Health Organization. The global health observatory. Geneva: WHO;2019. Available at: https://www.who.int/data/gho/data/indicators/indicator-details/GHO/total-ncd-deaths-(in-thousands).
44. Riahi K, Kriegler E, Edmonds J, O’Neill BC, Fujimori S, Bauer N, et al. Theshared socioeconomic pathways and their energy, land use, andgreenhouse gas emissions implications: an overview. Glob Environ Chang.2017;42:153–68.
45. Samir KC, Lutz W. The human core of the shared socioeconomic pathways:population scenarios by age, sex and level of education for all countries to2100. Glob Environ Chang. 2014;42:181–92.
46. Cuaresma JC. Income projections for climate change research: a frameworkbased on human capital dynamics. Glob Environ Chang. 2015;42:226–36.
47. Jiang L, O’Neill BC. Global urbanization projections for the sharedsocioeconomic pathways. Glob Environ Chang. 2017;42:193–9.
48. Statistics CsNBo: national economic accounting. 2019. Available at: http://www.stats.gov.cn/tjsj/zbjs/201912/t20191202_1713058.html. Accessed 20Feb 2020.
49. Leyland AH, Groenewegen PP. Multilevel modelling and public healthpolicy. Scand J Public Health. 2003;31(4):267–74.
50. Goldstein RH. Efficient analysis of mixed hierarchical and cross-classifiedrandom structures using a multilevel model. J Educ Behav Stat. 1994;19(4):337–50.
51. Leckie G. The complexity of school and neighbourhood effects andmovements on school differences in models of educational achievement. JR Stat Soc. 2009;172(3):537–54.
52. Diez-Roux AV. Multilevel analysis in public health research. Annu Rev PublicHealth. 2000;21(1):171–92.
53. Merlo J. A brief conceptual tutorial on multilevel analysis in socialepidemiology: investigating contextual phenomena in different groups ofpeople. J Epidemiol Community Health. 2005;59(9):729–36.
54. Jones K, Duncan C. People and places: the multilevel model as a generalframework for the quantitative analysis of geographical data. Spat AnalModel GIS Environ. 1996:79–104.
55. Goldstein H. Multilevel statistical models (vol. 922). Hoboken: Wiley; 2011.56. Wang JF, Li XH, Ghristakos G, Liao YL, Zhang T, Gu X, et al. Geographical
detectors-based health risk assessment and its application in the neuraltube defects study of the Heshun Region, China. Int J Geogr Inf Syst. 2010;24(1):107–27.
57. Goryakin Y, Rocco L, Suhrcke M. The contribution of urbanization to non-communicable diseases: evidence from 173 countries from 1980 to 2008.Econ Hum Biol. 2017;26:151–63.
58. Allender S, Wickramasinghe K, Goldacre M, Matthews D, Katulanda P.Quantifying urbanization as a risk factor for noncommunicable disease. JUrban Health. 2011;88(5):906–18.
59. Popkin BM. Urbanization, lifestyle changes and the nutrition transition.World Dev. 1999;27(11):1905–16.
60. Howell WH, McNamara DJ, Tosca MA, Smith BT, Gaines JA. Plasma lipid andlipoprotein responses to dietary fat and cholesterol: a meta-analysis. Am JClin Nutr. 1997;65(6):1747–64.
61. Sacks FM, Katan M. Randomized clinical trials on the effects of dietary fatand carbohydrate on plasma lipoproteins and cardiovascular disease. Am JMed. 2002;113(Suppl 9B):13S–24S.
62. Schaefer EJ, Gleason JA, Dansinger ML. Dietary fructose and glucosedifferentially affect lipid and glucose homeostasis. J Nutr. 2009;139(6):1257S–62S.
63. Yu D, Shi J, Zhang H, Wang Z, Lu Y, Zhang B, et al. Identifying patterns ofnon-communicable diseases in developed eastern coastal China: alongitudinal study of electronic health records from 12 public hospitals. BMJOpen. 2017;7(10):e016007.
64. Yang H, Huang X, Zhou Z, Wang HHX, Tong X, Wang Z, et al. Determinantsof initial utilization of community healthcare services among patients withmajor non-communicable chronic diseases in South China. PLoS One. 2014;9(12):e116051.
65. Ling Z. Analysis of the chronic diseases components of inpatient in ahospital of Wuhan from 2008–2012. Med Soc. 2014;614(3):66–77.
66. Allen L, Williams J, Townsend N, Mikkelsen B, Roberts N, Foster C, et al.Socioeconomic status and non-communicable disease behavioural riskfactors in low-income and lower-middle-income countries: a systematicreview. Lancet Glob Health. 2017;5(3):e277–89.
67. Efroymson D, Ahmed S, Townsend J, Alam SM, Dey AR, Saha R, et al.Hungry for tobacco: an analysis of the economic impact of tobaccoconsumption on the poor in Bangladesh. Tob Control. 2001;10(3):212–7.
68. Lynch JW, Kaplan GA, Salonen JT. Why do poor people behave poorly?Variation in adult health behaviours and psychosocial characteristics bystages of the socioeconomic lifecourse. Soc Sci Med. 1997;44(6):809.
69. Bauld L, Judge K, Platt S. Assessing the impact of smoking cessation serviceson reducing health inequalities in England: observational study. TobControl. 2007;16(6):400–4.
70. Jha P, Peto R, Zatonski W, Boreham J, Jarvis M, Lopez A. Social inequalitiesin male mortality, and in male mortality from smoking: indirect estimationfrom national death rates in Europe and North America. Lancet. 2006;368(9533):367–70.
71. Irala-Estévez JD, Groth M, Johansson L, Oltersdorf U, Prättälä R, Martínez-González MA. A systematic review of socio-economic differences in foodhabits in Europe: consumption of fruit and vegetables. Eur J Clin Nutr. 2000;54(9):706–14.
72. Lallukka T, Laaksonen M, Rahkonen O, Roos E, Lahelma E. Multiple socio-economiccircumstances and healthy food habits. Eur J Clin Nutr. 2007;61(6):701–10.
73. Giskes K, Avendano M, Brug J, Kunst AE. A systematic review of studies onsocioeconomic inequalities in dietary intakes associated with weight gainand overweight/obesity conducted among European adults. Obes Rev.2010;11(6):413–29.
74. Lim SS, Vos T, Flaxman AD, Danaei G, Ezzati M. A comparative riskassessment of burden of disease and injury attributable to 67 risk factorsand risk factor clusters in 21 regions, 1990–2010: a systematic analysis forthe global burden of disease study 2010. Lancet. 2012;380(9859):2224–60.
75. Drenowatz C, Eisenmann JC, Pfeiffer KA, Welk G, Heelan K, Gentile D, et al.Influence of socio-economic status on habitual physical activity and sedentarybehavior in 8- to 11-year old children. BMC Public Health. 2010;10(1):214.
76. Elhakeem A, Cooper R, Bann D, Hardy R. Childhood socioeconomic positionand adult leisure-time physical activity: a systematic review. Int J Behav NutrPhys Act. 2015;12(1):92.
77. Gidlow C, Johnston LH, Crone D, Ellis N, James D. A systematic review ofthe relationship between socio-economic position and physical activity.Health Educ J. 2006;65(4):338–67.
Publisher’s NoteSpringer Nature remains neutral with regard to jurisdictional claims inpublished maps and institutional affiliations.
Wang and Wang BMC Public Health (2020) 20:822 Page 13 of 13