Embed Size (px)
Citation preview
Journal of Engineering Science and Technology Vol. 11, No. 2 (2016) 212 - 227 © School of Engineering, Taylor’s University
212
MODELLING AND OPTIMISATION OF A BIMORPH PIEZOELECTRIC CANTILEVER BEAM IN AN ENERGY
HARVESTING APPLICATION
CHUNG KET THEIN1,*, BENG LEE OOI
2, JING-SHENG LIU
3,
JAMES M. GILBERT3
1School of Engineering, Taylor’s University, Taylor's Lakeside Campus,
No. 1 Jalan Taylor's, 47500, Subang Jaya, Selangor DE, Malaysia 2Faculty of Integrative Sciences and Technology, Quest International University Perak,
Plaza Teh Teng Seng (Level 2), 227, Jalan Permaisuri Bainun,
30250 Ipoh, Perak, Malaysia 3School of Engineering, University of Hull, HU6 7RX, Hull, UK
*Corresponding Author: [email protected]
Abstract
Piezoelectric materials are excellent transducers in converting vibrational
energy into electrical energy, and vibration-based piezoelectric generators are
seen as an enabling technology for wireless sensor networks, especially in self-
powered devices. This paper proposes an alternative method for predicting the
power output of a bimorph cantilever beam using a finite element method for
both static and dynamic frequency analyses. Experiments are performed to
validate the model and the simulation results. In addition, a novel approach is
presented for optimising the structure of the bimorph cantilever beam, by which the power output is maximised and the structural volume is minimised
simultaneously. Finally, the results of the optimised design are presented and
compared with other designs.
Keywords: Piezoelectric, Multi-disciplinary optimisation, Shape optimisation,
Energy harvesting, Bimorph cantilever beam.
1. Introduction
Recent trends in electronic technology have enabled a decrease in both the size
and power consumption of complex digital systems, meaning that wireless sensor
networks are now poised to be a significant enabling technology in many fields. It
Modelling and Optimisation of a Bimorph Piezoelectric Cantilever Beam . . . . 213
Journal of Engineering Science and Technology February 2016, Vol. 11(2)
Nomenclatures
b* Strain related to vertical displacement of the beam
c Damping coefficient
Cp Capacitance of the piezoelectric device, F
d Piezoelectric strain coefficient
k Coupling coefficient
lb Length of base, mm
lf Length of clamp, mm
lm Length of tip mass, mm
meff Effective mass, kg
mtip Tip mass, kg
tc Thickness of the piezoelectric material, mm
tsh Thickness of the shim material, mm
Vs Structural volume, mm3
Y Young’s modulus, GPa
Yc Young’s Modulus for the piezoelectric material, GPa
Greek Symbols
ε Vertical displacement at the tip end, m
is highly desirable for wireless sensor nodes to be self-powered. There are many
potential power sources for wireless sensor nodes, especially ambient vibrations
around the node [1, 2]. It is possible to convert part of the ambient energy around
the node into electrical energy using various methods, including the use of
piezoelectric beams. Piezoelectric materials are physically deformed in the presence
of an electric field, and conversely, produce an electrical charge when deformed.
When mechanical stress is applied to a piezoelectric material, an open-circuit
voltage (a charge separation) appears across the material. Likewise, if a voltage is
placed across the material, mechanical stress develops in the material. In this paper,
a 31-mode piezoelectric material, mounted as a cantilever beam, is investigated and
optimised. The 31-mode material is able to create relatively large deflections, takes
up less space, and has lower resonant frequency than material used in 33-mode [3].
Many recent studies have focused on the performance of a cantilever beam
with various geometries, in order to identify design geometries that maximise the
scavenging performance in terms of output power density [4-6]. Sodano et al. [7,
8] performed experiments to investigate a piezoelectric composite actuator for
power generation. Three different materials were assessed for their effectiveness
in power-harvesting applications: Quick Pack, piezoelectric material (PZT) (lead
zirconate titanate), and MFC (micro-fibre composite) were mounted to a
cantilever beam which was tested at 12 different resonant frequencies. PZT was
shown to be more effective in the random vibration environments that are usually
encountered when dealing with ambient vibrations.
Miller et al. [9] reported an increase in the weighted strain of a cantilever with
the addition of a slit through the middle of the beam, which yielded a weighted
strain that is more than twice that of a rectangular cantilever. Hence, the authors
concluded that a typical solid rectangular cantilever beam is non-optimized for
micro-scale energy scavenging. Mateu and Moll [10] performed an analytical
comparison between rectangular and triangular cantilevers in which they assumed
214 Chung K. Thein et al.
Journal of Engineering Science and Technology February 2016, Vol. 11(2)
uniform stress across the width of the cantilever. This revealed that a triangular
cantilever with the same beam volume as a rectangular beam has a higher average
strain and larger deflection for a given load, thereby producing more power per
unit volume. Simon and Yves [11] showed that the tapered beam with 0.3° slope
angle could increase the energy harvested by 69%. These proved that the
geometry of the cantilever beam affects the power output. Roundy also reported
that the power density of a beam can be increased by using a smaller volume, and
that the strain is distributed more evenly in the case of a trapezoidal cantilever
beam, which generates more than twice the energy of a rectangular beam for a
given volume [12]. Dhakar et al. [13] demonstrated that by reducing the resonant
frequency of the trapezoidal cantilever beam the overall power output could
significantly be increased. All the above mentioned studies suggest that
optimising the structural details of the trapezoidal cantilever beam may further
increase the power output.
The power output of a cantilever beam is directly related to the shape. What is
the best design of a trapezoidal cantilever beam that generates the maximum
power density? To answer this question, the sensitivity of power density to beam
should be examined. In this paper, a multi-objective method, MOST (multifactor
optimisation of structures technique) [14-15], is extended to automatically
accommodate and execute problems related to energy-harvesting optimisation.
The MOST technique utilizes commercially available finite element codes (e.g.,
ANSYS) and combines static analysis, dynamics analysis (for vibration
frequency), and a unique optimisation technique, with the aim of simultaneously
increasing both the power output and the power density. The MOST optimisation
system can efficiently and systematically solve complex engineering-design
problems, which may have multiple objectives and involve multiple disciplines,
by performing a parameter profile analysis [16], thereby seeking the optimum
solution. This method incorporates an assessment system which brings the scores
and merit indices into a defined range (in this case 0–10) for all performance and
loading cases. These features make MOST a powerful, cost-effective, and reliable
tool with which to optimise complex structural systems.
This paper proposes an alternative method of predicting the power output of a
piezoelectric cantilever beam by static and dynamic (modal) analyses using the finite
element method. The power outputs of the proposed method are verified by
comparison with the results of both experimental and analytical analyses (the Roundy
method [3]). A new method is presented in optimising a bimorph piezoelectric
cantilever beam in an energy harvesting application, with the aim of simultaneously
maximising power output and minimising structural volume, while also satisfying the
strength and stiffness requirements of the structure. The performance of the optimised
design is compared with triangular and rectangular shapes.
2. Predicting the output power of piezoelectric generator designs with
different geometrical shapes using finite element analysis (FEA)
The constitutive equations for a piezoelectric material are as follows [17]:
dEY
+=σδ
σε dED += (1)
Modelling and Optimisation of a Bimorph Piezoelectric Cantilever Beam . . . . 215
Journal of Engineering Science and Technology February 2016, Vol. 11(2)
where δ is mechanical strain, σ is mechanical stress, Y is the modulus of elasticity,
d is the piezoelectric strain coefficient, E is the electric field, D is electric
displacement, and ε is the dielectric constant of the piezoelectric material. Roundy
[3] proposed that the magnitude of voltage transferred to the load for a
piezoelectric bender can be given as follows (assuming that the driving frequency
is not matched with the natural frequency):
( )2
22222
*
212
11in
p
nnn
p
n
p
cc
A
RCkj
RCRC
bdtYj
V
−+++
+−
−=
ωζω
ωωωζωω
εω
(2)
where V is the generated voltage from the piezoelectric material, ω is the driving
frequency, Yc is Young’s Modulus for a piezoelectric material, d is the piezoelectric
strain coefficient, tc is the thickness of the piezoelectric material, b* is strain related
to vertical displacement of the beam, ε is the dielectric constant of the piezoelectric
material, R is the load resistance, Cp is the capacitance of the piezoelectric device,
ωn is the natural frequency of the system, ζ is the mechanical damping ratio, k is a
coupling coefficient, and Ain is the magnitude of the input acceleration.
This section focuses on the development of the power equation of a
piezoelectric bender. Several terms from Eq. (2) need to be redefined to
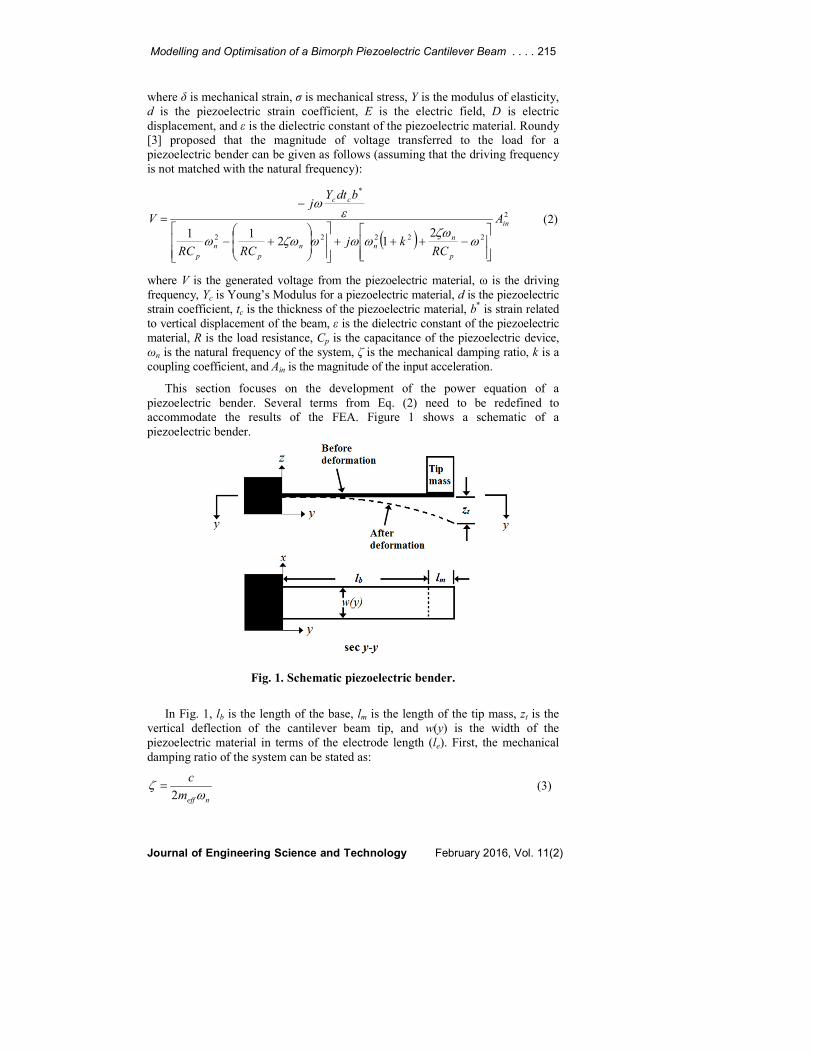
accommodate the results of the FEA. Figure 1 shows a schematic of a
piezoelectric bender.
Fig. 1. Schematic piezoelectric bender.
In Fig. 1, lb is the length of the base, lm is the length of the tip mass, zt is the
vertical deflection of the cantilever beam tip, and w(y) is the width of the
piezoelectric material in terms of the electrode length (le). First, the mechanical
damping ratio of the system can be stated as:
neffm
c
ωζ
2= (3)
216 Chung K. Thein et al.
Journal of Engineering Science and Technology February 2016, Vol. 11(2)
where meff is the effective mass and c is a damping coefficient. The effective mass
and natural frequency can be found from the FEA. Second, the capacitance of the
beam is defined as:
∫= el
c
cp dx
t
ywnC
0
)(ε (4)
where nc is the number of piezoelectric layers. Using Hooke’s law, b* in Eq. (2)
can be related to the average element stress (σave) as follows:
∑=
=cn
cc
c
aven 1
1σσ (5)
tc
ave
zYb
σ=*
(6)
The power transferred to the load is simply V2/R. Equation (2) can be further
simplified if the natural frequency (ωn) is assumed that it is equivalent to the
driving frequency (ω). This is because the generated power is maximised when
the vibration frequency is equal to the resonant frequency. Thus, the natural
frequency and the environment frequency must be very similar [3, 18]. The power
output (P) of the beam can then be formulated as follows:
( )( ) ( ) ( )2
22242
2
2
224 42
1in
npnp
t
avecp
n
ARCkRCk
z
dtRC
Pζωζωζ
εσ
ω +++
= (7)
The optimum resistance can be found by differentiating Eq. (7) with respect to
R, setting the result equal to zero and solving for R. The optimum resistance (Ro)
is as follows:
424
2
kCR
pn
o
+=
ζω
ζ (8)
3. Verification of ANSYS Simulations, Experimental and
Theoretical Results
3.1. Design constraints, load, and ANSYS simulation setup
A cantilever beam is modelled and analysed. The ANSYS SOLID92 element is
used to generate the model rather than the SOLID98 element, although both
elements are 10-node tetrahedral shapes suitable for large deflection and stress-
stiffening behaviour. The SOLID92 element adapts well to the free meshing of
irregular shapes. Both static analysis and dynamic (modal) analysis (for vibration
frequency) are performed in the analysis. The cantilever beam (known as a
‘bimorph’ system) is composed of two layers of piezoelectric materials and a
layer of shim material. The initial model consists of 9620 elements (both
piezoelectric and shim elements) with a uniform element length of 0.8 mm.
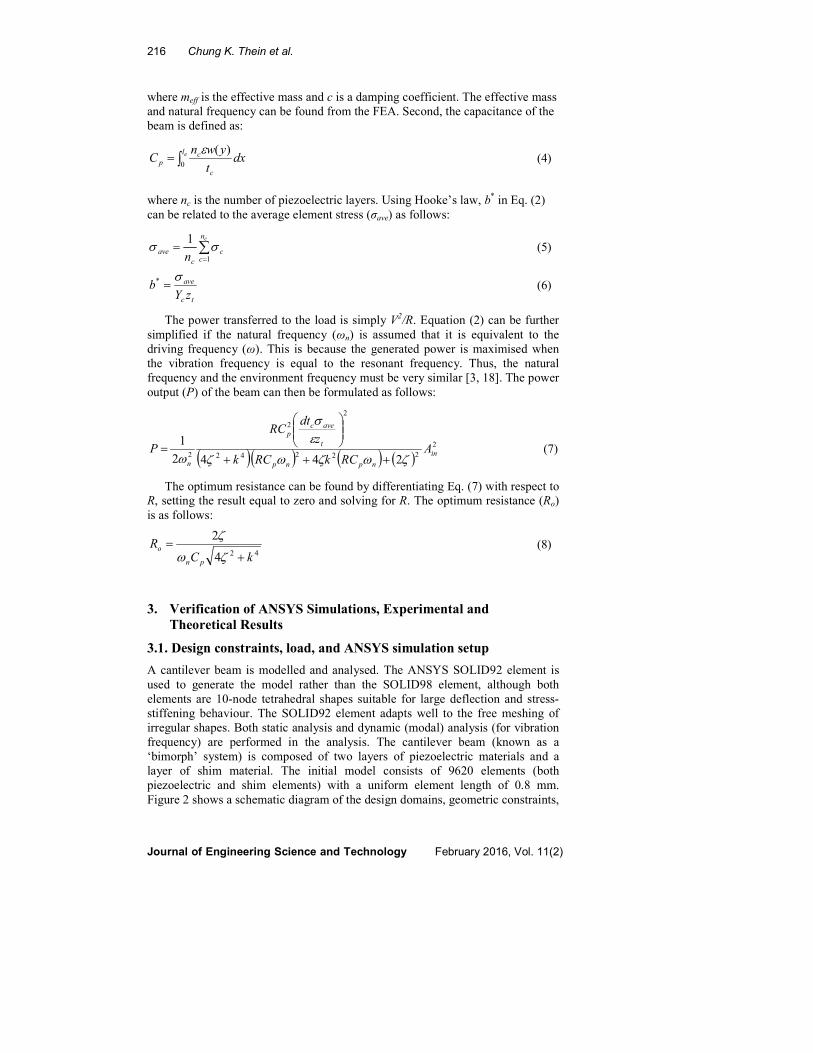
Figure 2 shows a schematic diagram of the design domains, geometric constraints,
Modelling and Optimisation of a Bimorph Piezoelectric Cantilever Beam . . . . 217
Journal of Engineering Science and Technology February 2016, Vol. 11(2)
load, and boundary conditions of the design. Points A and D are fixed at three
coordinates (x, y, and z). A concentrated pressure is applied at the free end of the
cantilever beam (between B and C). The initial dimensions of the beam are listed
in Table 1. The values of the mechanical and electric properties of the
piezoelectric material (PZT-5A4E) and brass shim are given in Table 2 [19, 20].
Fig. 2. Load and boundary conditions of the simulation setup.
Table 1. Dimensions of the initial design.
Parameters Initial value
(mm)
Thickness of piezoelectric material (tc) 0.19
Thickness of shim material (tsh) 0.13
Length of base (lb) 21.5
Length of tip mass (lm) 2.00
Effective length of piezoelectric material PZT (le = lm + lb) 23.5
Width (w(y)) 1 ≤ w(y) ≤ 12.7 mm 12.7
Table 2. Mechanical and electrical properties used in the FEA.
Property Piezoelectric material Brass shim
Young’s modulus (GPa) 66 117
Yield stress (MPa) 24* 200
Maximum deflection (µm) 300 -
Poisson’s ratio 0.31 0.324
Density (kg/m3) 7800 7165
Relative dielectric constant 1800 -
d31 (m/V) –190 × 10–12
-
*Dynamic peak tensile strength [21]
3.2. Experiment setup
An experimental validation of the model based on Eq. (2) for a rectangular
cantilever beam has been conducted. A vertical vibration generated from a shaker
(model Number LDS-V406/8) was used to excite the cantilever and the vibration
was also monitored using an accelerometer (MTN1800. The voltage generated by
the piezoelectric material for a given load resistance was captured by an
oscilloscope (Agilent MSO-6054A), along with the accelerometer signal). The
vibration is in the periodic behaviour [22]. The obtained data from the oscilloscope
were transferred to the MATLAB workspace via a USB flash drive. In the
218 Chung K. Thein et al.
Journal of Engineering Science and Technology February 2016, Vol. 11(2)
MATLAB workspace, the data were subjected to a fast Fourier transform, and the
frequency spectrum of the generated voltage and the vibration source plotted.
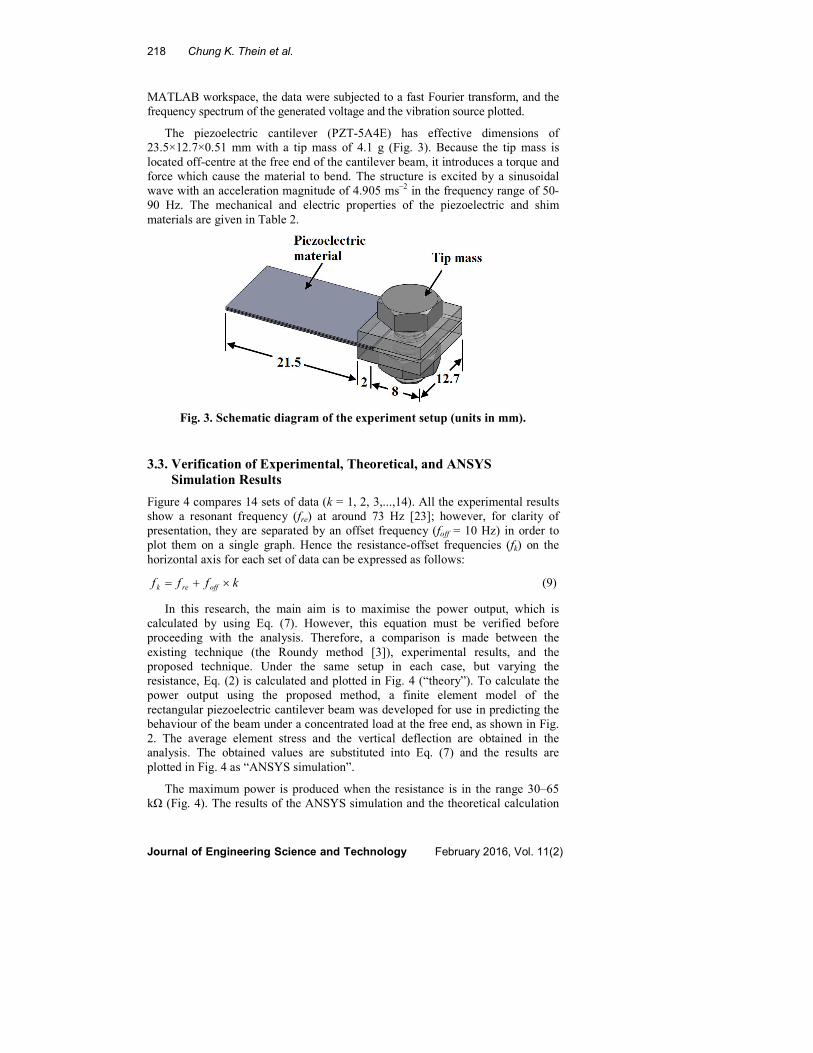
The piezoelectric cantilever (PZT-5A4E) has effective dimensions of
23.5×12.7×0.51 mm with a tip mass of 4.1 g (Fig. 3). Because the tip mass is
located off-centre at the free end of the cantilever beam, it introduces a torque and
force which cause the material to bend. The structure is excited by a sinusoidal
wave with an acceleration magnitude of 4.905 ms–2
in the frequency range of 50-
90 Hz. The mechanical and electric properties of the piezoelectric and shim
materials are given in Table 2.
Fig. 3. Schematic diagram of the experiment setup (units in mm).
3.3. Verification of Experimental, Theoretical, and ANSYS
Simulation Results
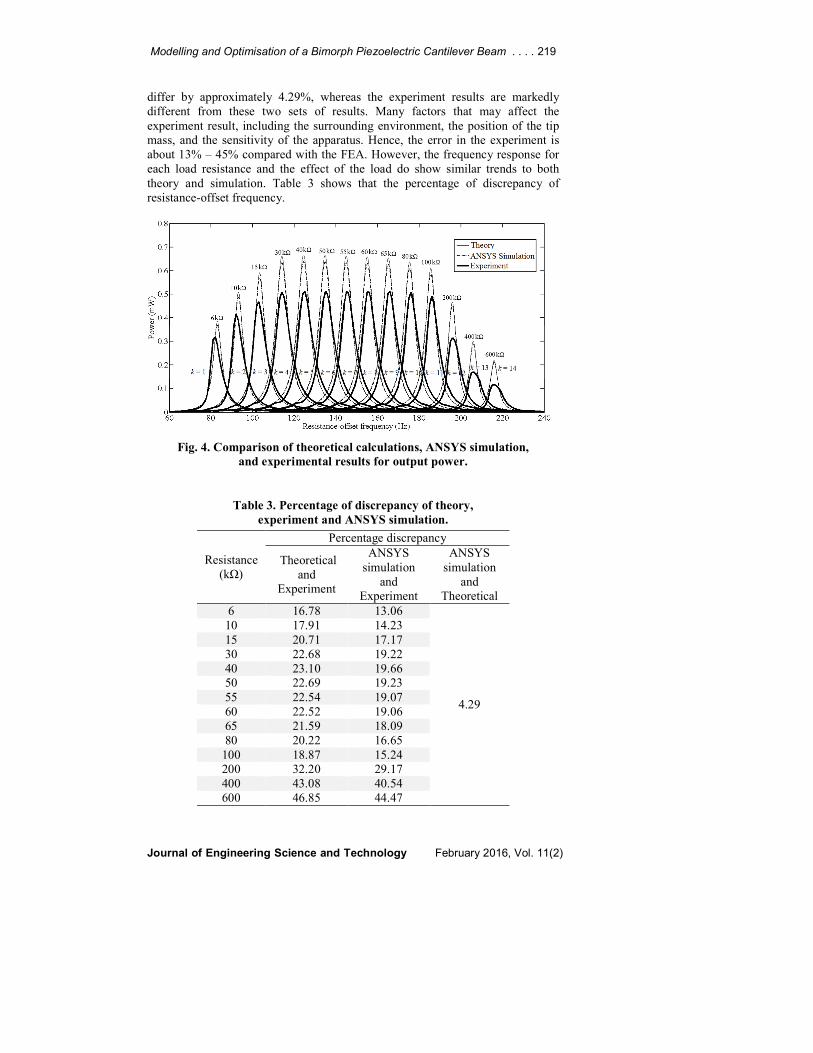
Figure 4 compares 14 sets of data (k = 1, 2, 3,...,14). All the experimental results
show a resonant frequency (fre) at around 73 Hz [23]; however, for clarity of
presentation, they are separated by an offset frequency (foff = 10 Hz) in order to
plot them on a single graph. Hence the resistance-offset frequencies (fk) on the
horizontal axis for each set of data can be expressed as follows:
kfff offrek ×+= (9)
In this research, the main aim is to maximise the power output, which is
calculated by using Eq. (7). However, this equation must be verified before
proceeding with the analysis. Therefore, a comparison is made between the
existing technique (the Roundy method [3]), experimental results, and the
proposed technique. Under the same setup in each case, but varying the
resistance, Eq. (2) is calculated and plotted in Fig. 4 (“theory”). To calculate the
power output using the proposed method, a finite element model of the
rectangular piezoelectric cantilever beam was developed for use in predicting the
behaviour of the beam under a concentrated load at the free end, as shown in Fig.
2. The average element stress and the vertical deflection are obtained in the
analysis. The obtained values are substituted into Eq. (7) and the results are
plotted in Fig. 4 as “ANSYS simulation”.
The maximum power is produced when the resistance is in the range 30–65
kΩ (Fig. 4). The results of the ANSYS simulation and the theoretical calculation
Modelling and Optimisation of a Bimorph Piezoelectric Cantilever Beam . . . . 219
Journal of Engineering Science and Technology February 2016, Vol. 11(2)
differ by approximately 4.29%, whereas the experiment results are markedly
different from these two sets of results. Many factors that may affect the
experiment result, including the surrounding environment, the position of the tip
mass, and the sensitivity of the apparatus. Hence, the error in the experiment is
about 13% – 45% compared with the FEA. However, the frequency response for
each load resistance and the effect of the load do show similar trends to both
theory and simulation. Table 3 shows that the percentage of discrepancy of
resistance-offset frequency.
Fig. 4. Comparison of theoretical calculations, ANSYS simulation,
and experimental results for output power.
Table 3. Percentage of discrepancy of theory,
experiment and ANSYS simulation.
Resistance
(kΩ)
Percentage discrepancy
Theoretical
and
Experiment
ANSYS
simulation
and
Experiment
ANSYS
simulation
and
Theoretical 6 16.78 13.06
4.29
10 17.91 14.23 15 20.71 17.17 30 22.68 19.22 40 23.10 19.66 50 22.69 19.23 55 22.54 19.07 60 22.52 19.06 65 21.59 18.09 80 20.22 16.65
100 18.87 15.24 200 32.20 29.17 400 43.08 40.54 600 46.85 44.47
220 Chung K. Thein et al.
Journal of Engineering Science and Technology February 2016, Vol. 11(2)
3.4. Optimisation methodology – multifactor optimisation of
structures technique
The requirements for a complex structural design dictate that the optimisation
must involve multiple objectives, multiple disciplines, and a large number of
design variables. An m × n matrix (dij)—the so-called performance data matrix
(PDM)—is defined by a set of performance parameters Pi (i = 1, 2,…, m) and
loading case parameters Cj (j = 1, 2,…, n), respectively. The PDM is a schematic
representation of a collection of data as shown in Table 4. Thus, the data point dij
is the i-th performance Pi of the structure at the loading case C
j. In this case the
data points of the matrix are obtained by a finite element analysis of the structure.
The matrix lists every loading case as well as every performance parameter
relevant to the individual loading cases.
Table 4. Performance data matrix.
C1 C2 ⋯ Cn
P1 d11 d12 ⋯ d1n
P2 d21 d22 ⋯ d2n
⋮ ⋮ ⋮ ⋮
Pm dm1 dm2 ⋯ dmn
A parameter profile matrix (PPM) is created to review the profile of the
performances for different loading cases (Table 5). To simplify the calculations,
the values of the performance indices are normalised to the range 0–10. This
enables different loading cases and parameters to be compared, in order to gain an
overall perspective of the characteristics of the system. The PPM assesses the
character of the structure with respect to the actual performances at their worst
acceptable limits and the best expected values of the performances.
Table 5. Parameter profile matrix.
C1 C2 ⋯ Cn
P1 D11 D12 ⋯ D1n
P2 D21 D22 ⋯ D2n
⋮ ⋮ ⋮ ⋮
Pm Dm1 Dm2 ⋯ Dmn
The data point Dij for one acceptable limit (e.g., lower limit) is calculated as
follows:
10×−
−=
ijij
ijij
ijlb
ldD (10)
where dij is the actual value of the performance obtained from the PDM, and l
ij
and bij are the lower acceptable limit and the best expected value, respectively.
Eq. (10) is valid for lij < dij < bij; for dij > bij, Dij = 10; and for dij < lij, Dij = 0. The
Modelling and Optimisation of a Bimorph Piezoelectric Cantilever Beam . . . . 221
Journal of Engineering Science and Technology February 2016, Vol. 11(2)
data point for the cases of acceptable upper limit and double acceptable limits can
be calculated in a similar way.
The mean and standard deviation (SD) are calculated for each parameter and
loading case in each column and row in the PPM. A well-designed system should
have low SDs and high mean values (close to 10). The existence of high SDs
signifies that the system is likely to have significant problematic areas. Therefore,
a high SD for a row indicates variable system performance at different loading
cases for a particular parameter. Conversely, a high SD for a column indicates the
system is likely to have significant problematic performance for the specific
loading case.
The system can be further analysed using a parameter performance index
(PPI) and a case performance index (CPI), which are defined as follows:
∑ =
=n
j ij
iD
nPPI
11
, mi ,,2 ,1 L= and
∑ =
=m
i ij
jD
mCPI
11
nj ,,2 ,1 L= (11)
When i-th parameter is very vulnerable, some data points Dij of the PPM will
have values close to 0 and hence the PPIi will also close to 0. Similarly, when the
system is vulnerable at the j-th loading case, CPIj will be close to 0. The highest
values for PPI and CPI are 10. PPI and CPI values close to 10 indicate good
design, whereas values close to zero indicate poor design. The mean values, CPIs,
PPIs, and SDs provide an overall performance assessment for the system and
loading cases. These indices are calculated by summing the inverse of the data
points as a performance rating to avoid the effect associated with low scores being
hidden by high scores. The mean values are not used directly to rate the
performance. The system may be reviewed by using the information in the
indices, as follows:
• A comparison of PPIs indicates whether the system performs better with
respect to some performances than to others.
• A comparison of CPIs shows whether the system performs better under certain
loading cases than under others.
According to the matrix profile analysis, PPI and CPI are measures of the
vulnerability of each performance parameter and each loading case, respectively.
Hence, the integration of PPI and CPI indicates the vulnerability of a particular
parameter/loading case combination. An overall performance index (OPI) is used
to develop the overall objective function. The OPI, which takes the form of a
qualitative score, can be established for the system by considering all the
performances and all the loading cases. The OPI function lies in the range of 0–
100. The OPI can be expressed as follows:
∑∑= =
⋅×⋅×
=m
i
n
jjCiP CPIWPPIW
nmOPI
ji1 1
100 (12)
where Wpi and WC
j are weighting factors in the range of 0–1 reflecting the
preference for each performance parameter and each loading case. The OPI can
be used to compare the performances of different designs. The higher the OPI
222 Chung K. Thein et al.
Journal of Engineering Science and Technology February 2016, Vol. 11(2)
,,2,1, maxmin kixxx iii K=≤≤
score, the more reliable the design would be. The objective function is maximised
using the effective zero-order method, employing conjugate search directions
[13]. An effective polynomial interpolation uni-dimensional search method is also
used in the algorithm. This optimisation technique has the advantage of forcing
the performances to approach their optimal values. The nearer the performances
to the acceptable limits, the stricter the ‘punishment’ (penalties) will be.
4. Electrical Energy and Structural Optimisation of a Bimorph
Piezoelectric Cantilever Beam
The power output of a cantilever beam is directly related to its shape. This study
considers the sensitivity of the power to the shape of the cantilever. The main
objective is to find the optimum geometrical shape of a bimorph cantilever beam
that yields the maximum power and has the minimum structural volume. In
addition, the beam must satisfy the strength and stiffness requirements. A
dynamic analysis (for the vibration frequency) is also required in the power
calculation as indicated in Eq. (7).
4.1. Formulation of the optimisation problem
In this study, the optimal shape of the bimorph cantilever is determined by
MOST, which is used in conjunction with the ANSYS finite element software.
The design problem is therefore to maximise the power output and the average
element stress, and simultaneously to minimise the structural volume, subject to
the design constraints. The optimisation to be solved is stated as follows:
find X = (x1, x2,…, xk)
min Vs(X)
and
max Pj(X) and σave,j(X)
s.t. Pj ≥ Pini,j; Vs ≤ Vs,ini; σave,j ≥ σini,j; σmax,j ≤ σy; δini,j ≤ δj ≤ δlim,jand
j = 1, 2,…, n
where k is the number of design variables, Vs is the structural volume (excluding
the volume of the tip mass), σave is the average element stress of the structure, δ is
the displacement of point E (see Fig. 2), σmax is the maximum Von Mises stress of
the structure, and P is the power output. The subscript ‘ini’ indicates the initial
value for the structure (here, the initial iteration when ni = 0), and n is the number
of loading cases (here, n = 1). The subscript ‘lim’ indicates a specified
performance limit for the structure. In this research, the cantilever beam is
optimised to carry a tip mass of 4.1 g with a maximum vertical displacement of
δlim
= 300 µm at any node, satisfying a maximum strength of σy = 24 MPa (see
Table 1).
min
ix and max
ix are the lower and upper bounds of the design variables
of xi, respectively. There are eight design variables in the structural model, which
represent the width of the cantilever beam. In this case, the lower and upper
bounds are set to 1 and 15 mm, respectively.
Modelling and Optimisation of a Bimorph Piezoelectric Cantilever Beam . . . . 223
Journal of Engineering Science and Technology February 2016, Vol. 11(2)
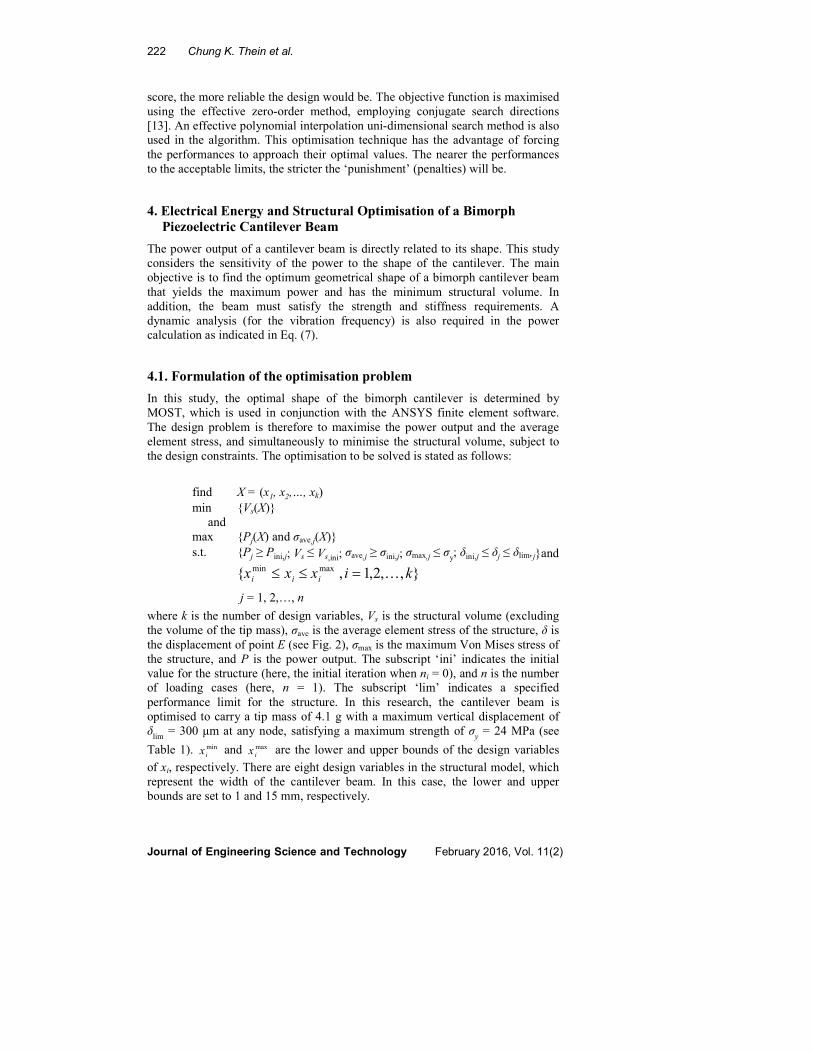
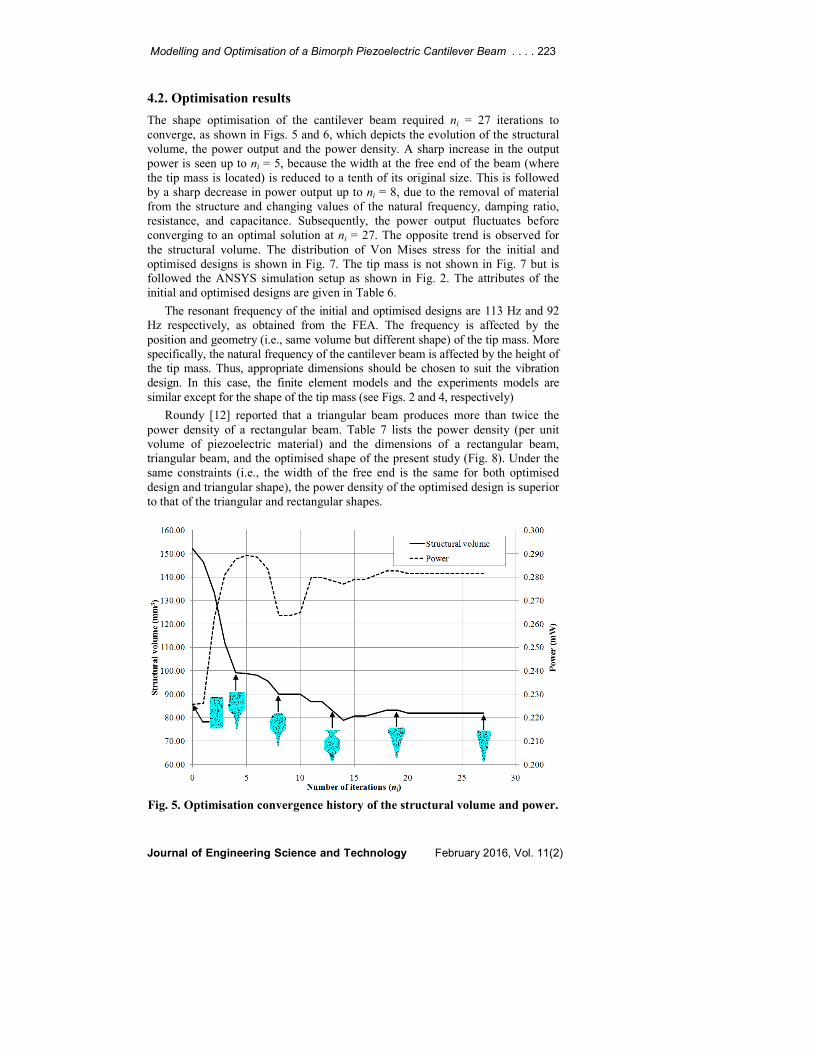
4.2. Optimisation results
The shape optimisation of the cantilever beam required ni = 27 iterations to
converge, as shown in Figs. 5 and 6, which depicts the evolution of the structural
volume, the power output and the power density. A sharp increase in the output
power is seen up to ni = 5, because the width at the free end of the beam (where
the tip mass is located) is reduced to a tenth of its original size. This is followed
by a sharp decrease in power output up to ni = 8, due to the removal of material
from the structure and changing values of the natural frequency, damping ratio,
resistance, and capacitance. Subsequently, the power output fluctuates before
converging to an optimal solution at ni = 27. The opposite trend is observed for
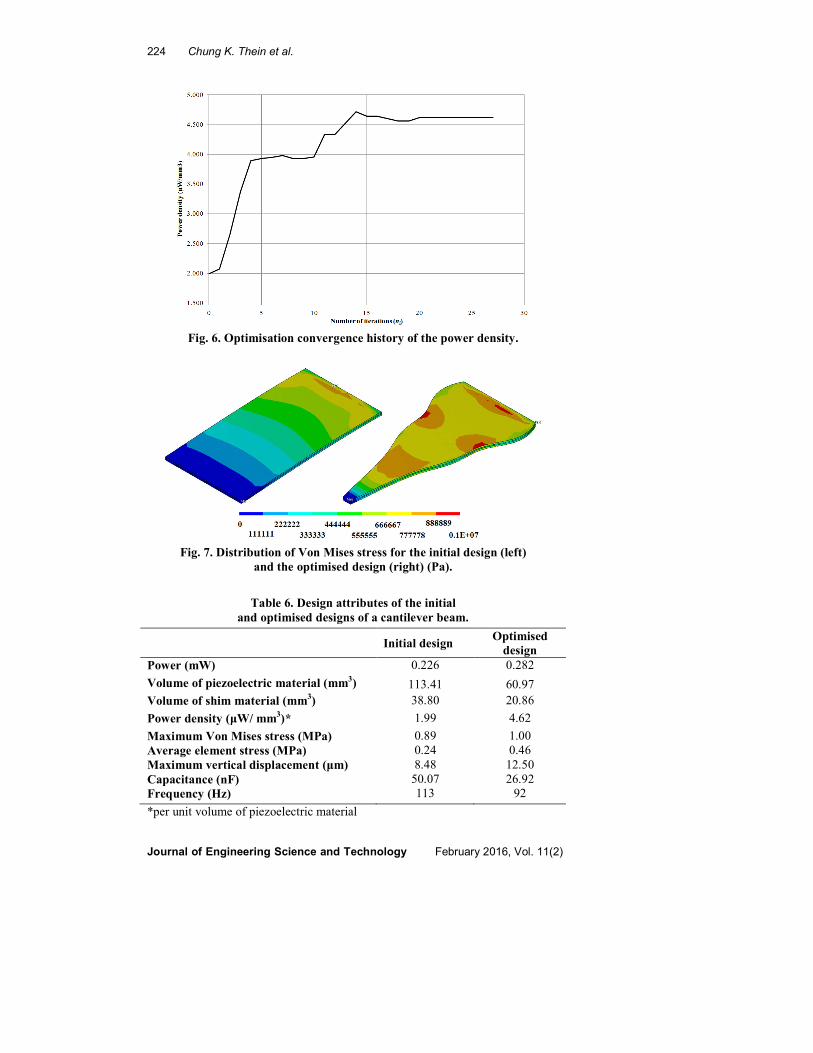
the structural volume. The distribution of Von Mises stress for the initial and
optimised designs is shown in Fig. 7. The tip mass is not shown in Fig. 7 but is
followed the ANSYS simulation setup as shown in Fig. 2. The attributes of the
initial and optimised designs are given in Table 6.
The resonant frequency of the initial and optimised designs are 113 Hz and 92
Hz respectively, as obtained from the FEA. The frequency is affected by the
position and geometry (i.e., same volume but different shape) of the tip mass. More
specifically, the natural frequency of the cantilever beam is affected by the height of
the tip mass. Thus, appropriate dimensions should be chosen to suit the vibration
design. In this case, the finite element models and the experiments models are
similar except for the shape of the tip mass (see Figs. 2 and 4, respectively)
Roundy [12] reported that a triangular beam produces more than twice the
power density of a rectangular beam. Table 7 lists the power density (per unit
volume of piezoelectric material) and the dimensions of a rectangular beam,
triangular beam, and the optimised shape of the present study (Fig. 8). Under the
same constraints (i.e., the width of the free end is the same for both optimised
design and triangular shape), the power density of the optimised design is superior
to that of the triangular and rectangular shapes.
Fig. 5. Optimisation convergence history of the structural volume and power.
224 Chung K. Thein et al.
Journal of Engineering Science and Technology February 2016, Vol. 11(2)
Fig. 6. Optimisation convergence history of the power density.
Fig. 7. Distribution of Von Mises stress for the initial design (left)
and the optimised design (right) (Pa).
Table 6. Design attributes of the initial
and optimised designs of a cantilever beam.
Initial design
Optimised
design
Power (mW) 0.226 0.282
Volume of piezoelectric material (mm3) 113.41 60.97
Volume of shim material (mm3) 38.80 20.86
Power density (µW/ mm3)* 1.99 4.62
Maximum Von Mises stress (MPa)
Average element stress (MPa)
0.89
0.24
1.00
0.46
Maximum vertical displacement (µm)
Capacitance (nF)
8.48
50.07
12.50
26.92
Frequency (Hz) 113 92
*per unit volume of piezoelectric material
Modelling and Optimisation of a Bimorph Piezoelectric Cantilever Beam . . . . 225
Journal of Engineering Science and Technology February 2016, Vol. 11(2)
Table 7. Comparison of power density among beams with different shapes.
Rectangular
shape
Triangular
shape
Optimised
design
Volume of piezoelectric
material (mm3)
113.41 61.30 60.97
Power density (µW/mm3) 1.99 4.49 4.62
Fig. 8. Dimension of (a) rectangular, (b) triangular,
and (c) optimised shapes (in ratio).
5. Conclusions
The output power is increased from approximately 0.226 to 0.282 mW, which
corresponds to an increase of approximately 25% compared with the initial
design. The structural volume (piezoelectric and shim material combined) is
reduced significantly from 152.21 to 81.83 mm3, representing a 46.2% saving in
materials. The power density of the optimised design is more than twice that of
the initial design, and the vertical deflection of the cantilever beam is increased by
about 47%, from 8.48 to 12.50 µm. The maximum Von Mises stress shows an
increase from 0.89 to 1.00 MPa. These results are well within the stiffness and
strength constraints (δlim = 300 µm) and yield stress (σy = 24 MPa).
The results show good agreement between the finite element simulation and
the theoretical results, which differs by approximately 4.5% in terms of the
maximum power output. The maximum power output differs by ~20% between
the finite element results and the experimental results, reflecting the fact that the
experimental results were affected by various conditions (e.g., the environment
effect). Therefore, the finite element simulation yields more accurate and reliable
results compared with theoretical values. Thus, Eq. (7) presented in this paper is a
novel development in estimating the power output of piezoelectric cantilever
beams of various sizes and shapes by means of finite element analysis.
In the second part of this paper, a shape optimisation of the piezoelectric
cantilever beam was presented. Simulation results indicate that the optimised
design can generate 4.62 µW/mm3 for a piezoelectric volume of 60.97 mm
3.
226 Chung K. Thein et al.
Journal of Engineering Science and Technology February 2016, Vol. 11(2)
Future research will focus on maximising the power density by seeking the
optimum “topology” of a bimorph cantilever beam. The results demonstrate the
efficiency of the MOST technique.
The results obtained for the bimorph cantilever beam demonstrate that the
proposed method was successful in identifying the optimum design, resulting in
improved performance in terms of power output and power density.
In future work, the effect of stochastic forcing case on the optimised geometry
may be considered.
References
1. Gilbert, J.M.; and Balouchi, F. (2008). Comparison of energy harvesting
systems for wireless sensor networks. International Journal of Automation
and Computing, 5(4), 334-347.
2. Roundy, S.; Steingart, D.; Frechette, L.; Wright, P.; and Rabaey. J. (2004).
Power source for wireless sensor networks. Wireless sensor network-Lecture
Notes in Computer Science, Springer-Verlag, 2920, 1-17.
3. Roundy, S. (2003). Energy Scavenging for wireless sensor nodes with a focus
on vibration to electricity conversion. PhD thesis, University of California
Berkely.
4. Goldschmidtboeing, F.; and Woias, P. (2008). Characterization of different
beam shapes for piezoelectric energy harvesting. Journal of Micromechanics
and Microengineering, 18(10), 1-7.
5. Benasciutti, D.; Moro, L.; and Zelenika, S. (2010). Vibration energy
scavenging via piezoelectric bimorphs of optimized shapes. Microsystem
Technologies, 16(5), 657-668.
6. Dietl, J.M.; and Garcia, E. (2010). Beam shape optimisation for power
harvesting. Journal of Intelligent Material Systems and Structures, 21(6),
633-646.
7. Sodano, H.A.; Inman, D.J.; and Park, G. (2005). Comparison of Piezoelectric
Energy Harvesting Devices for Recharging Batteries. Journal of Intelligent
Material Systems and Structures, 16(10), 799-807.
8. Sodano, H.A.; Inman, D.J.; and Park, G. (2005). Generation and Storage of
Electricity from Power Harvesting Devices. Journal of Intelligent Material
Systems and Structures, 16(1), 67-75.
9. Miller, L.M.; Emley, N.C.; Shafer, P.; and Wright, P.K. (2008). Strain
Enhancement within Cantilevered, Piezoelectric MEMS Vibrational Energy
Scavenging Devices. Advances in Science and Technology, Smart Materials
and Mico/Nanosystems, 54, 405-410.
10. Mateu, L.; and Moll, F. (2005). Optimum piezoelectric bending beam
structures for energy harvesting using shoe inserts. Journal of Intelligent
Material Systems Structures, 16, 835–845.
11. Simon, P.; and Yves, S.A. (2009). Electromechanical Performances of
Different Shapes of Piezoelectric Energy Harvesters. International Workshop
Smart Materials and Structures, 22-23 Oct 2009, Montreal, Canada
Modelling and Optimisation of a Bimorph Piezoelectric Cantilever Beam . . . . 227
Journal of Engineering Science and Technology February 2016, Vol. 11(2)
12. Roundy, S. (2005). On the effectiveness of vibration-based energy
harvesting. Journal of Intelligent Material Systems Structures, 16, 809-823.
13. Dhakar, L.; Liu, H.; Tay, F.E.H.; and Lee, C. (2013). A new energy harvester
design for high power output at low frequencies. Sensors and Actuators, 199,
344-352.
14. Liu, J.S.; and Hollaway, L. (2000). Design optimisation of composite panel
structures with stiffening ribs under multiple loading cases. Computers and
Structures, 78(4), 637-647.
15. Liu, J.S.; and Lu, T.J. (2004). Multi-objective and multi-loading optimization
of ultralight weight truss materials. International Journal of Solids and
Structures, 41, 619-635.
16. Liu, J.S.; and Thompson, G. (1996). The multi-factor design evaluation of
antenna structures by parameters profile analysis. Proceedings of the
Instituition of Mechanical Engineers, Part B: Journal of Engineering
Manufacture, 210(5), 449-456.
17. Ikeda, T. (1996). Fundamentals of piezoelectricity. Oxford science
publications, Oxford.
18. Shu, Y.C.; and Lien, I.C. (2006). Analysis of power output for piezoelectric
energy harvesting systems. Smart Materials and Structures, 15, 1499-1512.
19. Gallas, Q.; Wang. G.; Papila, M.; Sheplak, M.; and Cattafesta, L. (2003).
Optimization of synthetic jet actuators. 41st AIAA Aerospace Sciences
Meeting and Exhibit, Reno, NV, USA, AIAA-2003-0635.
20. Piezo System (2009), Inc. CATALOG #7C (2008). Retrieved July 31, 2009,
from http://www.piezo.com/catalog.html.
21. Bert, C.W.; and Birman, V. (1998). Effects of stress and electric field on the
coefficients of piezoelectric materials: one-dimensional formulation.
Mechanics Research Communications, 25(2), 165-169.
22. Friswell, M.I.; Ali, S.F.; Bilgen, O.; Adhikari, S.; Lees, A.W.; and Litak, G.
(2012). Non-linear piezoelectric vibration energy harvesting from a vertical
cantilever beam with tip mass. Journal of Intelligent Material Systems and
Structures, 23(13), 1505-1521.
23. Ooi, B.L. (2010). Optimisation and frequency tuning concepts for a vibration
energy harvester. PhD Thesis, University of Hull.


![Piezoelectric Bimorph Actuator with Integrated Strain Sensing … · 2018-06-07 · gauges can be used as displacement sensors for controlling piezoelectric stack actuators [12]](https://img.dokumen.tips/doc/110x75/5e793c4c8085ef1b260e813c/piezoelectric-bimorph-actuator-with-integrated-strain-sensing-2018-06-07-gauges.jpg)