Embed Size (px)
Citation preview
NOVATECH 2010
1
Modelling and mapping of urban storm water flooding - Communication and prioritizing actions through mapping urban flood resilience
Modélisation et cartographie des inondations en zone urbaine : actions de communication et gestion des priorités en appui sur la cartographie de la résilience des villes face aux inondations
Kluck J.1,3, Claessen E.G.1, Blok G.M.1, Boogaard F.C.1,2
1 Tauw bv, Zekeringstraat 43 g, 1014 BV Amsterdam, the Netherlands 2 . Delft university of Technology. Department of Sanitary Engineering, Faculty of Civil Engineering and Geosciences, P.O. Box 5048, NL-2600 GA, Delft, the Netherlands 3 University of Applied Technology, Weesperzijde 190, Amsterdam, the Netherlands Email corresponding author: [email protected]
RÉSUMÉ Le changement climatique va augmenter la fréquence des inondations en zones urbaine. Les intensités de pluies de courte durée dépasseront les capacités des réseaux d'eaux pluviales et entraîneront l’inondation des rues et éventuellement des bâtiments et maisons d’habitation. L’eau doit disposer de plus d’espace au sol pour rendre les villes moins sensibles aux inondations, le problème étant de convaincre du bien-fondé de cette exigence les autres secteurs professionnels impliqués dans la planification et la maintenance des zones urbaines. Pour étayer ce point de vue, une méthode à base de SIG pour la cartographie des eaux de pluie urbaines a été développée. Sur la base d’une CEN (carte d’évaluation numérique), les cartes fournissent des informations sur l’écoulement et le stockage d’eau en surface. D’un concept simple, la méthode est facilement compréhensible par tous les acteurs de la gestion urbaine et elle favorise la collaboration de ces acteurs dans la recherche et la mise en œuvre de solutions. Dans la ville d’Apeldoorn (Pays Bas), qui a subi des inondations en raison d’évènements pluvieux extrêmes en juillet 2009, cette méthode a été utilisée pour identifier des mesures en surface de lutte contre les inondations. Les cartes ont été présentées sur des tables tactiles au cours d’un atelier pour maximiser les possibilités d’interaction entre les différents professionnels des espaces urbains (eau, espaces verts, voirie). Les résultats ont semblé très satisfaisants et cette méthode est donc utilisée dans de nombreuses villes des Pays Bas et même dans d’autres pays comme à Bergen (Norvège) et Rio de Janeiro (Brésil).
ABSTRACT Due to climate change, urban areas will flood more frequently. Short peak rainfall intensities will exceed the storm water drainage capacity and cause flooding of streets and possibly buildings and homes. In order to make cities more resilient to flooding more space for water at ground level is needed. The main problem is how to convince other professionals, concerned with planning and maintenance of urban areas, of the importance of space for water. To support this view, a GIS-based method for mapping urban storm water has been developed. Based on an accurate DEM the maps provide insight in the above ground flow and storage of water. Due to its straightforward concept the method is easily understandable for all stakeholders in the urban management. This promotes the collaboration of those stakeholders in finding and maintaining solutions. For the city of Apeldoorn in the Netherlands, which suffered flooding from extreme rainfall in July 2009, this method has been used to search for above ground measures against flooding. In order to maximize the possibilities of interaction between professionals of different spatial fields (water, green, road) the maps were presented in a workshop using a touch table. This appeared very successful and this method is therefore used for many cities in Holland and even outside of the Netherlands like Bergen (Norway) and Rio the Janeiro.
KEYWORDS GIS Modeling, mapping flooding, flood resilience, Communication, urban flooding

SESSION 1.9
2
INTRODUCTION Climate change will have a considerable impact on urban areas. One of the effects of the global warming for Western Europe is the increase of storm water peak intensities during rainfall and another is likely to be an increase in the frequency of these showers. These extreme events with a duration of up to several hours cause the urban storm water drainage system to be overloaded, either due to the intensity of the rain or due to runoff from urban green space which normally infiltrates into the ground. When the sewer discharge capacity is exceeded, storm water will flood the streets or even buildings and homes. At the same time, it creates a possible health risk. Other reasons for more frequent problems due to extreme rainfall in Dutch cities are the increase of paved area and the recent changes of the street profile, for example shopping areas without any kerbs and without storage capacity at street level. This paper focuses on the problems due to extreme rainfall which accumulates and flows at street level. It excludes other causes of flooding, such as high surface water levels or collapsing sea and river levees. As an example this paper presents maps of the situation in the city of Apeldoorn. In July 2009, Apeldoorn (figure 1) suffered flooding after extreme rainfall (115 mm in 90 minutes).
Figure 1: Extreme rainfall in the municipality of Apeldoorn on July 3rd 2009 caused a large number of streets to flood
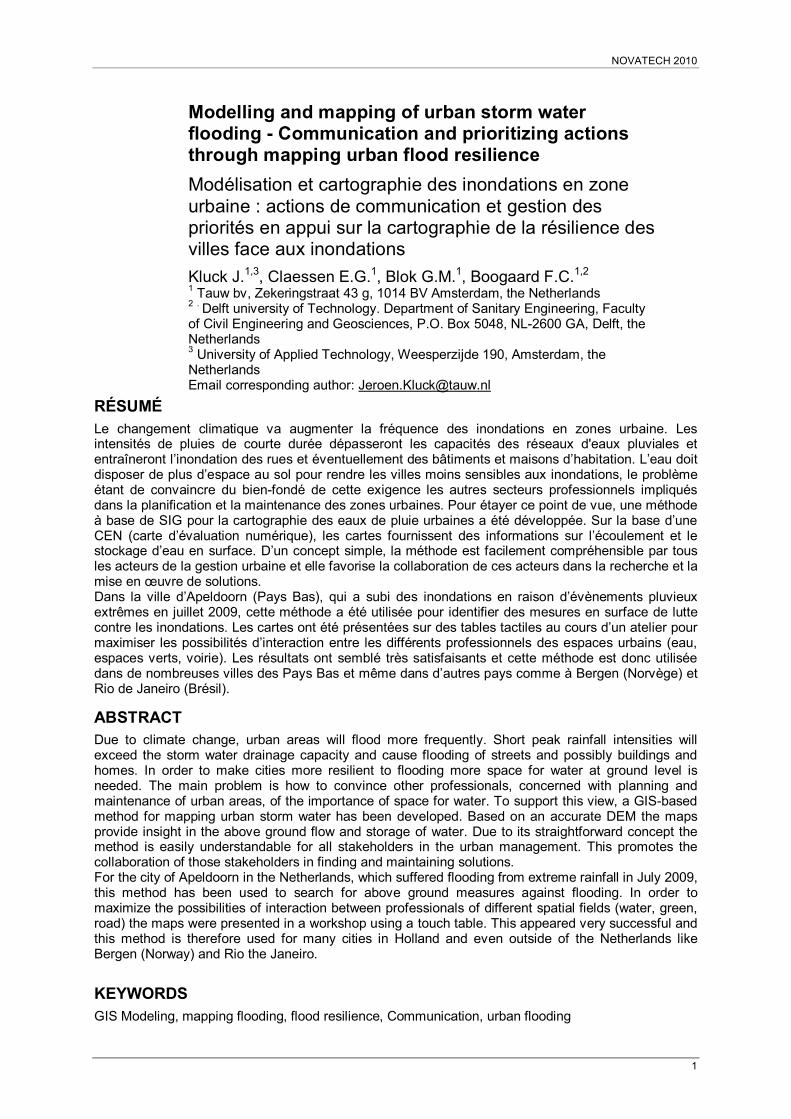
It is becoming commonly accepted that these kind of problems need to be solved by providing more space for water at ground level. The European Flood Risk Directive [EU, 2007] promotes flood risk management plans with non-structural measures aiming at resilience of urban infrastructures and preparedness of the social system. There is a growing consensus that sewer capacity is limited and that there is a need to consider all aspects of water drainage during extreme rainfall events. [Geldof and Kluck 2008] promotes the so-called “Three points approach” for dealing with extreme events in urban water management: Point 1) standard design capacity, Point 2) functioning at extreme events, Point 3) Every day situation, see figure 2.
NOVATECH 2010
3
Point 1) The drainage system is designed at a certain drainage standard. In the Netherlands the general standard is that all rain is drained without water on the streets for an extreme storm event with a return period of 2 years (20 mm in one hour). This is achieved with technical facilities such as sewers. Point 2) Next to the functioning of sewers during standard rainfall events, also the functioning during far more extreme rainfall events should be evaluated and measures to reduce flooding should be evaluated. These measures will mainly consist of above ground measures and require spatial and urban planning.
Point 3) Finally, measures to reduce problems due to flooding should also contribute to a well functioning urban living environment: e.g. it is more likely that a low laying area for storing water will be accepted and be a success if it is also set up as a nice park or a square. The main problem is how to convince other professionals, concerned with urban planning and maintenance, of the importance of space for water. To support this discussion, Tauw bv, a Dutch engineering company, has developed a GIS-based method for mapping urban storm water. This urban storm water flooding map shows in detail the water flow paths during extreme rainfall events, as well as highlighting the depressions in the urban landscape where water pools and illustrating the overall extent of the problem. The model and its resulting maps make it possible to identify potential and observed locations of flooding, and implement and test the effects of mitigation measures at street level. Accurate DTM of the Netherlands is available with average 1 point per m2 (AHN1) and partly already 10 points per m2 (AHN2) [AHN, 2009], providing a solid base for this GIS-model. To solve the inconvenient situation of flooding due to an overloaded sewer system, modifications at ground level can be implemented into the DTM to redirect water to less vulnerable areas, where it can be drained or temporarily stored. Before measures to efficiently and effectively guide the water away from inconvenient locations can be made, the ground level of the urban area needs to be mapped properly. METHOD The urban storm water model is a GIS-based model, which doesn’t require a lot of data. However, the required data needs to be as accurate as possible. The required input for the model includes:
- High resolution surface map, for example AHN1 in the Netherlands [AHN, 2009] and other LiDAR based, preferably with a resolution of at least 1 point per m2.
- Land use: Impervious and paved surface map, surface water and green area’s. External input to support the review of the model output and complete the urban storm water map, includes registration of any known data about flooding in the urban area. This data can be obtained from registered complaints made by residents and from specific knowledge of the involved professionals. The first step in the modeling process is removal of any “noise” from the surface map. This is needed because of the mapping method made by airplanes. The laser data bounces back from the surface, but also from treetops or parked cars. This is undesirable, because it gives an impression that the water cannot flow into another direction while in reality it can. To remove those obstacles a semi-automatic method has been set up. All points within a certain frame which are higher than the average surface level plus a threshold are simply removed. Afterwards a check for the situation around dikes, elevated roads and bridges need to be made. But this is necessary anyway. These steps are expected not to be needed when the newer elevation data in the Netherlands (AHN2) is available, since trees
SESSION 1.9
4
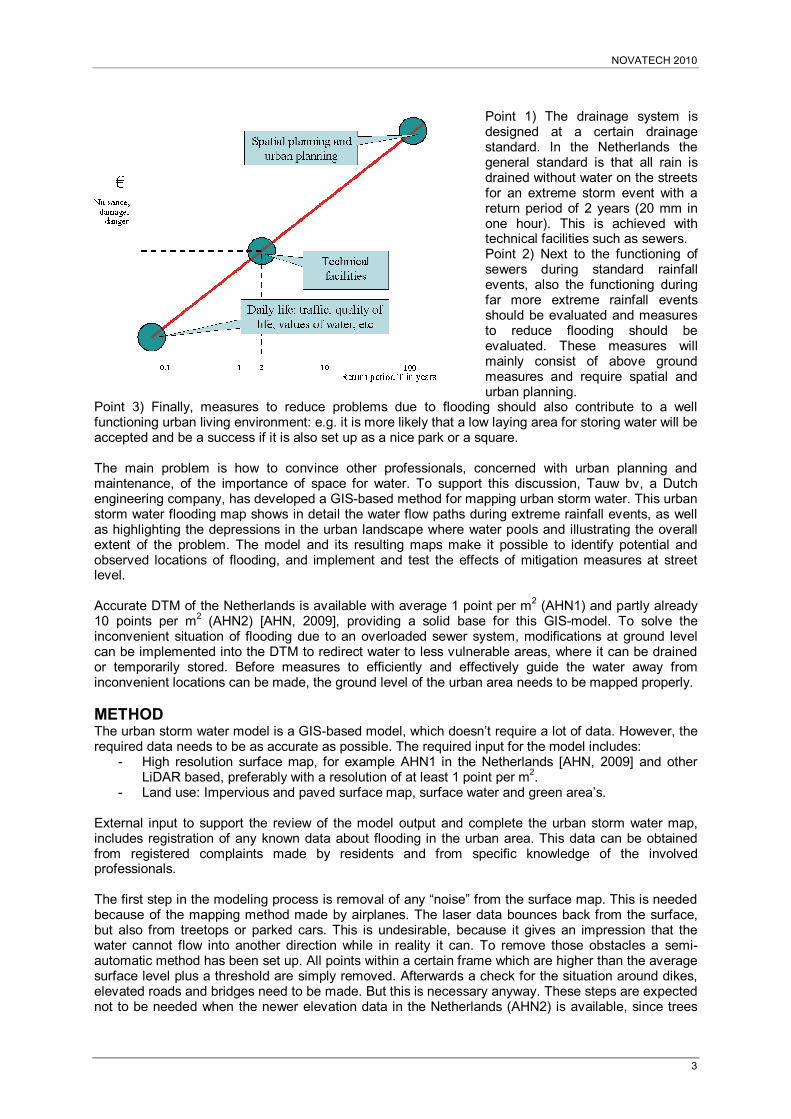
and cars are supposed to be already filtered out. A careful assessment of the elevation map will be needed anyway in order to decide on how to deal with viaducts, bridges and roads crossing at different levels. After the surface map has been improved, the land use map layer (accounting for impervious and paved surfaces) is used to define from which surfaces water will flow off. At this point it is possible to assume that only water from impervious or paved areas will be available for run off (assuming that the water from the other areas will infiltrate). It is however also possible to assume that from green areas a certain percentage off the rainfall will be available for runoff. Once the model has been run, the generated output needs to be presented in such a way that flow direction and water accumulation are readily identifiable. Measures to reduce flooding can be implemented in the model and the effects of these measures can be simulated in a second phase of modeling. These measures are implemented in a form of elevating or lowering the surface map to represent real life designs, such as water storages or ditches to hold the water and speed bumps to redirect water. RESULTS The results shown here are from a small example area, showing a depression between houses filled with 50 to 100 cm of water, as can be seen in figure 3a. When above floor level, this leads to water flooding.
Figures 3: The initial modeled location of urban storm water flooding. 3a: Height of the water above ground level in mm and 3b the stream tracks.
The modeled stream tracks in figure 3b show that the water comes from the west. In figure 3b the the depression has been completely filled. From that moment on, the “storage” has become unavailable and additional water flows through the problem area and further to the east. After the water flooding system has been mapped and discussed, measures to reduce the flooding can be investigated. For example, figure 4a shows a speed bump preventing water from flowing into that particular street and a ditch (green storage) redirecting the water to a street north of the area which has a much better capacity to transport water. The resulting new stream tracks are in figure 4b and figure 5. These measures prevent the area between the houses to be completely flooded.

NOVATECH 2010
5
Figures 4: Effect of above ground measures. 4a: Red shows the surface elevation to avoid water from flowing into the flood susceptible area, whereas green indicates where surface lowering is used to guide water to the northern
road. 4b shows the stream tracks diverted further north after the measures have been implemented in the modeling. This solves the flooding problem at of figure 3.
Figure 4 Flooding like the “red” areas in figure 3 no longer occurs after the measurements of figure 3. VALIDATION There are no measurements of such extreme events available to validate the model results. Validation of the results is done by discussion of the outcome with the local water managers. From experience, they know up to a certain extend how the system responds to extreme events. Also video clips of the extreme event at the 9th of July from the internet provide information for some validation. People tend to publish interesting events on the internet. In the Netherlands a discussion on the modeling of storm water discharge in extreme events has been started. This year for some selected locations the storm water discharge in extreme events will be modeled in different ways and evaluated. The models will vary from the GIS-approach presented in this paper to expanding of models for sewer flow to street flow and also 2D modeling of overland flow. DISCUSSION The model presented is a useful tool in finding solutions to prevent flooding, even far upstream from the actual location of the risk areas. Measures that can control and redirect the water flow can be investigated and used to support a case for tackling the actual problems at its source in order to prevent vulnerable areas downstream from flooding. The model setup is deliberately simple in order not to raise high expectations of accuracy. It is more important to “get the feeling” and visualization of the situation and to initiate discussions, than to correctly compute the overland water flows in a complicated 3-dimensional sewer model. Professionals involved with urban areas often know very well how matters function. Furthermore the accuracy of more fundamental approaches is limited to the accuracy of the input data. It is expected that in complex or specific cases more detailed simulations will be needed for a good representation of the actual discharge. The GIS-analyses will provide the first insight in which areas are vulnerable to flooding and what kind solutions are feasible. However, up to now this first analyses appeared to be so important and giving so much direction and possibilities that a more detailed modeling has not been started yet.

SESSION 1.9
6
A commonly used rain peak in this model is a T=100 years rainfall event. This is 60 mm in one hour, of which it is presumed that 20 mm is drained by the sewer system. The sewer system is hereby considered overloaded and temporarily “out of function”. The remaining 40mm will be used as input for the calculation model, without infiltration into the ground and sewer system, and spread over the entire paved area of interest. This simplification provides a clear and relatively fast insight into how the storm water runs off at street level. Due to the assumptions named above, the amount of water which is stored at street level is exaggerated, as well as the length of the stream tracks; the catchment areas are possibly very large for an urban situation. A COMMUNICATION TOOL A big advantage of this method for visualizing storm water flooding, is that it provides a relatively easily interpretable insight to the problem and the cause of it, making this tool ideal for multidisciplinary decision-making. Because the measures are implemented at street level, it is necessary for sewer specialists to discuss possible areas for ground level measures with professionals responsible for roads and greenery. These non-water related professionals can join the discussion in how to solve the problem, without costly sewer adjustment. In order to take full advantage of the visual power of the maps for managers of the urban area in Apeldoorn a multi-disciplinary workshop has been organized. In this workshop the results were not presented on physical maps but on a touch table (figure 5). Advantages are:
Figure 5 An interactive meeting for discussing urban storm water flooding maps using a touch table in the municipality of Apeldoorn (November 2009)
Easy interpretable symbols understandable to non-water professionals and specialists Possibility to publish map data digitally, saving the layer structures (ArcPublisher) Meetings with people from several different backgrounds, with a ‘DiamondTouch (r) table’
where meeting attendees can draw and comment on the digital maps, during the discussion Touch table is used to:
Identify areas of interest Analyze the model output at those areas Decide whether to solve the identified problem Decide find and discuss solutions
Direct input from multiple disciplines, for each other to use in the decision-making This leads to fast decisions which are commonly accepted within the municipality and the
parties involved

NOVATECH 2010
7
An additional advantage of the touch table was the possibility of presenting photos and even films of recent floods on the maps. These were entered as links and could be activated (figure 6). In fact You Tube appeared to be an important serious source of information on what really happened after the extreme rainfall.
Figure 6 Media items can be linked to the urban storm water flooding maps to find area’s of interest
This meeting with the municipality of Apeldoorn was successful in the way that the water managers, one green planner, some road managers, a transport adviser and some project leaders for the living areas used the touch table to discuss about the encountered and modeled water on the surface. They switched on and off layers, zoomed and panned and sometimes looked at photos or video clips from the recent floods which had been connected to their locations. Specific vulnerable locations were identified and solutions were discussed. Some of the selected solutions were upstream of the problem areas to prevent water flowing into the area. At other points the local storage of water seemed better. The main achievement was that different managers of the urban area now realize that space for water on the streets is needed. The transportation specialist asked afterwards for the map showing the streamlines in order to check that map for future changes in the streets. Up to now there has been no need to make further more exact computations of the water discharge during extreme events. This will possibly come when the proposed measures will have to be designed. TRANSNATIONAL APPROACH Transnational knowledge exchange plays an important role in spreading information about flood mapping around the world. This is recognized in the project Skills Integration and New Technologies (SKINT) which emphasizes the need for speaking a multi disciplinary language to integrate the worlds of spatial planning and water management. SKINT encourages the implementation of innovative technical and sustainable solutions around the North Sea Region which have already proved to be successful. Therefore this method which has been successfully used in the municipality of Bergen in the Netherlands (Egmond aan Zee) is used to investigate good locations to implement SUDS in the city of Bergen in Norway where severe floods have taken place in the last decades.

SESSION 1.9
8
Figure 7: Analysis of flooding in Bergen, Norway The approach seemed also transportable to other regions because of its simplicity and focus on what is really happening outside. In fact, discussions around a map with different stakeholders is the first step needed to reduce (changes of) flooding. The understanding of the situation and need for space for water by the different stakeholders make real lasting (in the sense that they won’t be removed after a few dry years) solutions possible. The GIS analysis can help to support this is in attractive and comprehensive way. Severe urban flooding as recently in Rio the Janeiro can quickly be assessed with such a GIS-analyses so the problem can be addressed while the feel of urgency is still high. .
Figure 8: Analyses of flooding in Rio de Janeiro, April 2010
With a DEM with less points than 1 per m2 the accuracy might be less, but for extreme events still the results still can be valuable. The main ‘danger’ of a coarse grid is that some critical alleys or streets might be omitted.

NOVATECH 2010
9
CONCLUSIONS The GIS-based method of modeling and mapping urban storm water flooding is an effective tool in deciding how to prevent urban storm water flooding in a cost effective way. The output of the model is generated in a manner which allows any specialist (of various disciplines) involved in determining measures at ground level, to comprehend the process. The urban storm water flood maps improve the communication between various disciplines, generating an environment for fast, successful and cost effective decision-making in prevention of urban storm water flooding. The use of a touch table contributes to that. In the near future this communication tool will be used in several projects like Skills Integration and New Technologies (SKINT) which emphasizes the need for speaking a multi disciplinary language to integrate the worlds of spatial planning and water management. LIST OF REFERENCES Geldof, G.D., Kluck, J.(2008), The Three Points Approach, ICUD 11, Edinburgh/Scotland 2008 Claessen. E.G., Kluck, J. (2009), Verslag worshop wateroverlast met touch table (in Dutch), Tauw bv,
November 2009 SKINT North Sea Skills Integration and New Technologies ‘SKINT’ (http://www.skintwater.eu/),
Boogaard, F.C, TU Delft, 2009 AHN Algemeen Hoogtebestand Nederland (http://www.ahn.nl) European Union (2007). Directive 2007/60/EC of the European Parliament and of the Council, of 23
October 2007, on the assessment and management of flood risks.