Embed Size (px)
Citation preview
25-‐26 Febbraio 2017 Frasca2 (Roma)
Modelli alimentari
Franca Marangoni
Nutri2on Founda2on of Italy
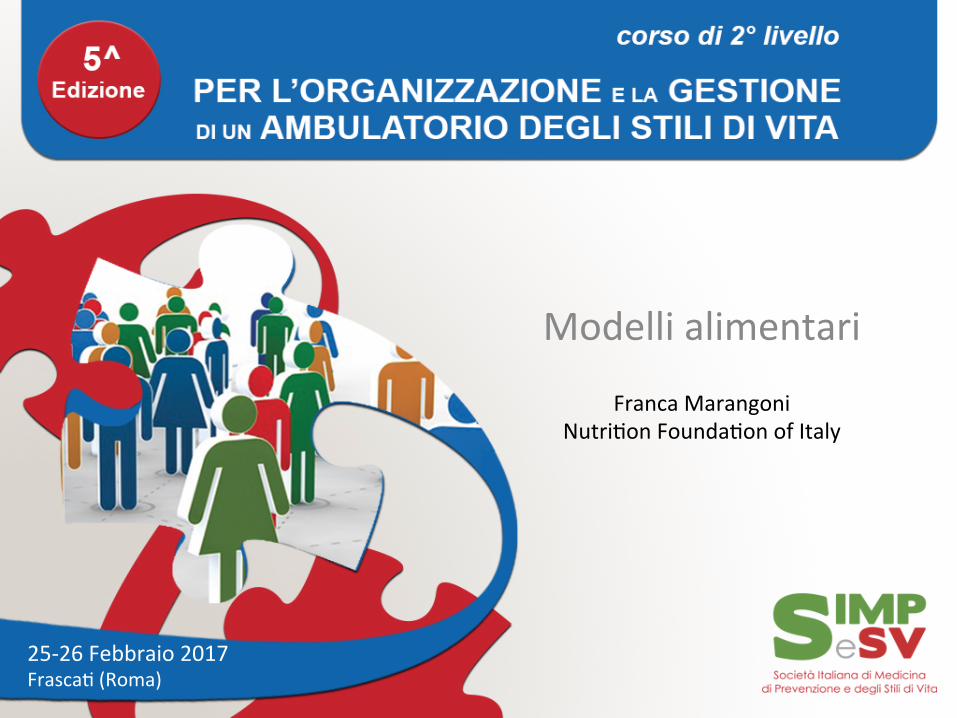
BMI adults % pre-‐obese (25.0-‐29.99)
32,4%
© Copyright World Health Organiza2on (WHO), 2012. All Rights Reserved
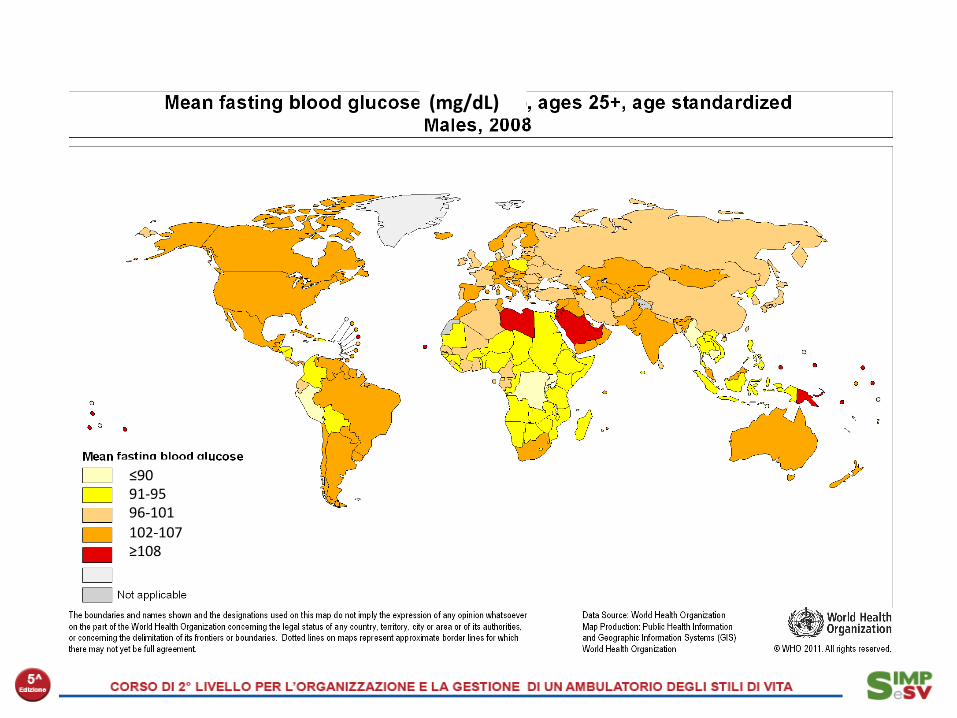
≤90 91-‐95 96-‐101 102-‐107 ≥108
(mg/dL)

16 yrs
5 yrs
An ongoing process...
OECD Life expectancy at birth

Centro Nazionale di Epidemiologia, Sorveglianza e Promozione della Salute
Cause delle malattie croniche
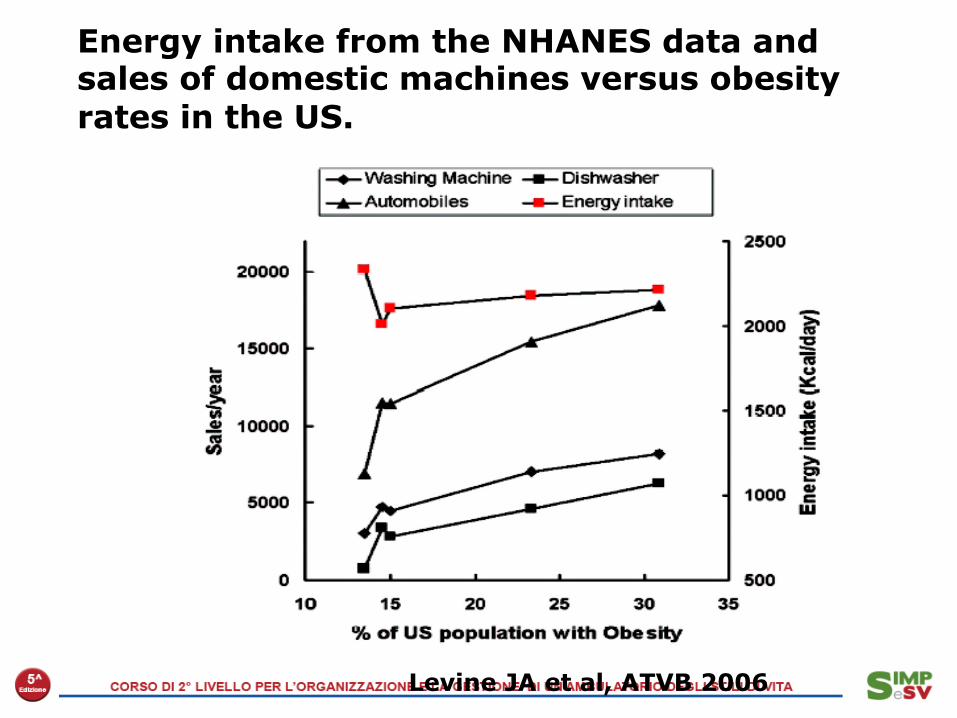
Energy intake from the NHANES data and sales of domestic machines versus obesity rates in the US.
Levine JA et al, ATVB 2006

Saturi
Sana alimentazione: composizione della dieta
Proteine
Grassi
Carboidra< Monoinsaturi
Polinsaturi
Zuccheri
Omega-‐3
Omega-‐6
Fibra
Acqua
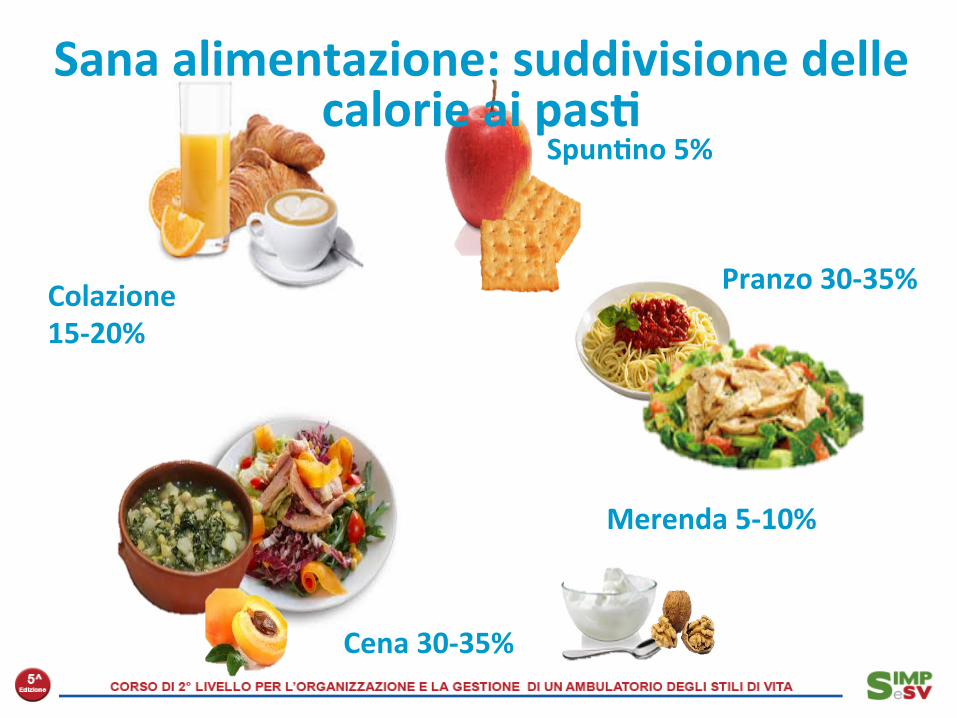
Colazione 15-‐20%
Pranzo 30-‐35%
Cena 30-‐35%
Merenda 5-‐10%
Spun<no 5%
Sana alimentazione: suddivisione delle calorie ai pas<

Presupposti teorici ai 5 pasti
Assenza o inadeguatezza prima
colazione
Merenda/cena molto abbondante
Fame e debolezza nella tarda ma]nata
Scarso appe2to a pranzo
Merenda molto abbondante
Andrea Ghiselli, 2015
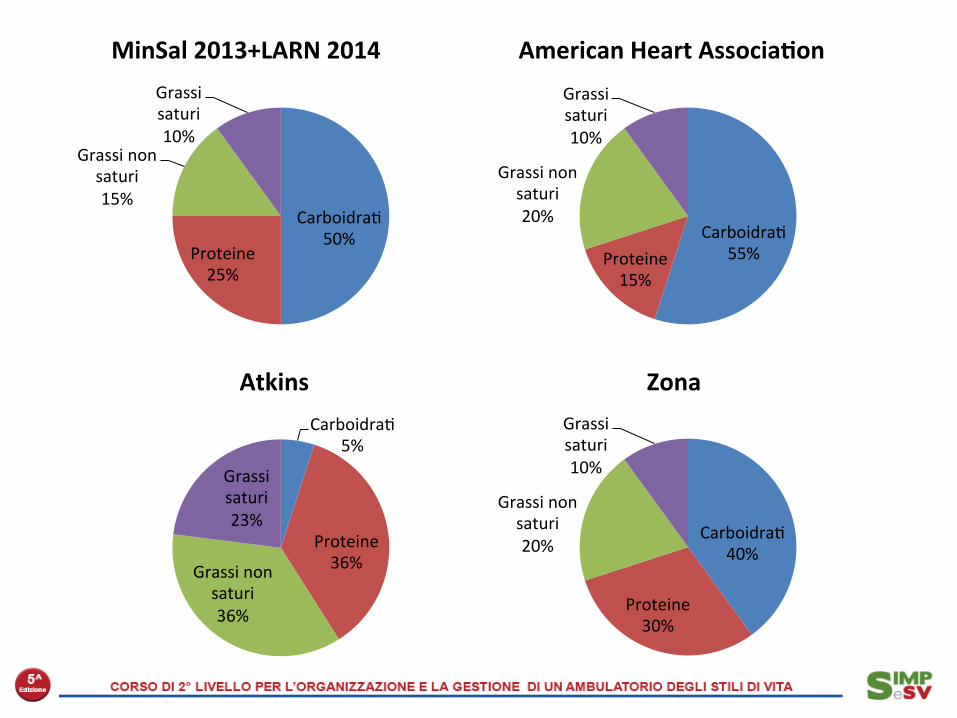
Carboidra2 50%
Proteine 25%
Grassi non saturi 15%
Grassi saturi 10%
Carboidra2 5%
Proteine 36% Grassi non
saturi 36%
Grassi saturi 23%
Carboidra2 55% Proteine
15%
Grassi non saturi 20%
Grassi saturi 10%
Carboidra2 40%
Proteine 30%
Grassi non saturi 20%
Grassi saturi 10%
MinSal 2013+LARN 2014 American Heart Associa<on
Atkins Zona
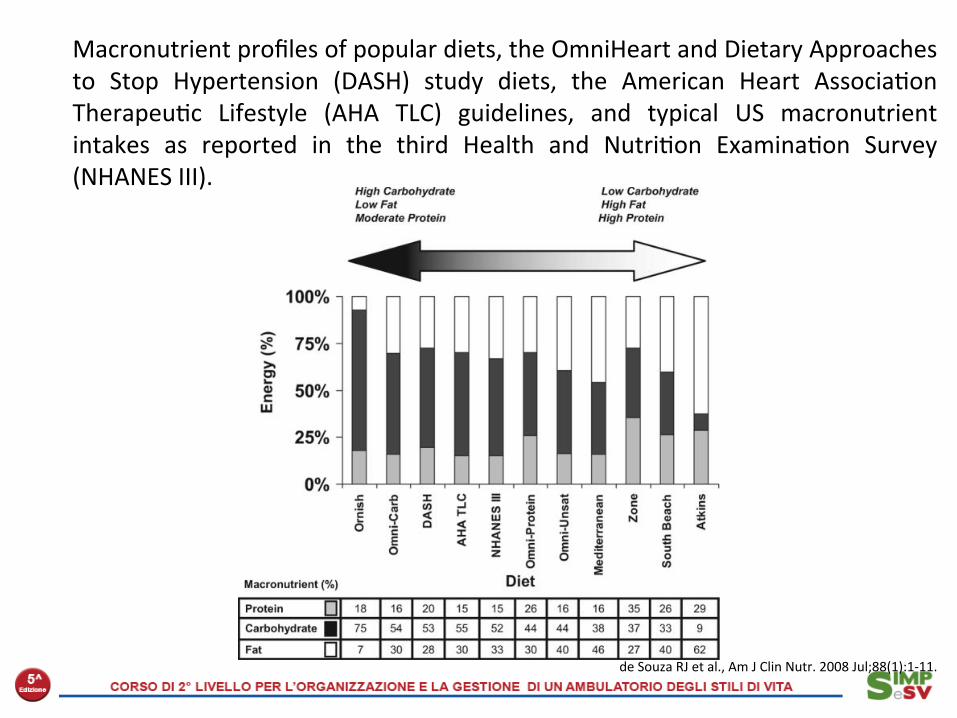
Macronutrient profiles of popular diets, the OmniHeart and Dietary Approaches to Stop Hypertension (DASH) study diets, the American Heart Associa2on Therapeu2c Lifestyle (AHA TLC) guidelines, and typical US macronutrient intakes as reported in the third Health and Nutri2on Examina2on Survey (NHANES III).
de Souza RJ et al., Am J Clin Nutr. 2008 Jul;88(1):1-‐11.
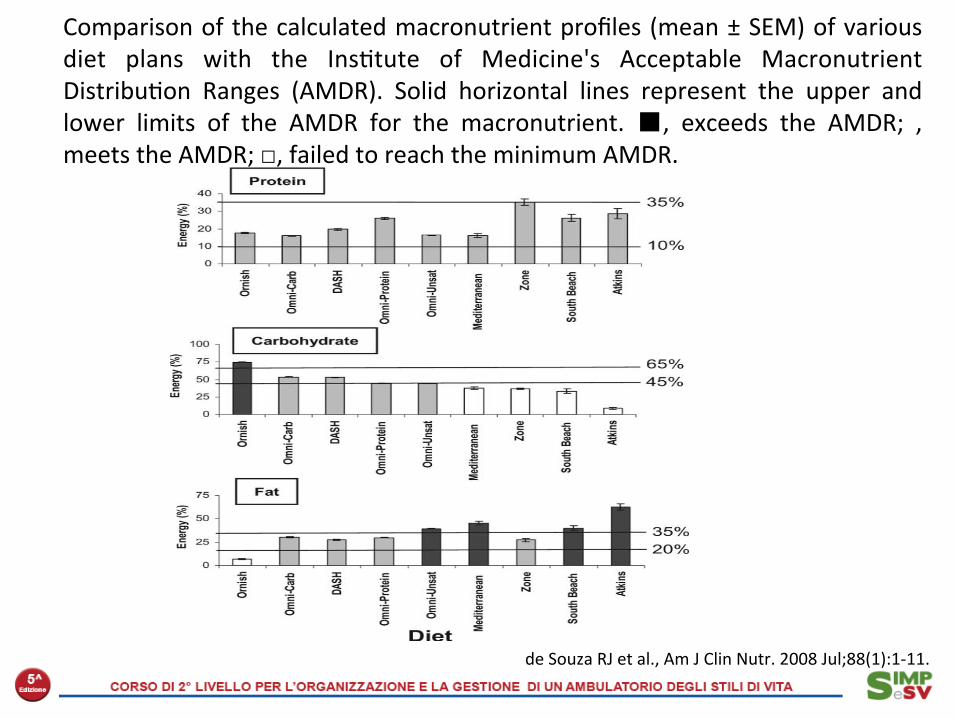
Comparison of the calculated macronutrient profiles (mean ± SEM) of various diet plans with the Ins2tute of Medicine's Acceptable Macronutrient Distribu2on Ranges (AMDR). Solid horizontal lines represent the upper and lower limits of the AMDR for the macronutrient. ■, exceeds the AMDR; , meets the AMDR; □, failed to reach the minimum AMDR.
de Souza RJ et al., Am J Clin Nutr. 2008 Jul;88(1):1-‐11.

Typical fajy acid profiles of popular diet sand typical US macronutrient intakes as reported in the third Health and Nutri2on Examina2on Survey (NHANES III) as “reference points.” Solid horizontal line represents the 7% upper level of intake for saturated fat proposed by the AHA.
de Souza RJ et al., Am J Clin Nutr. 2008 Jul;88(1):1-‐11.

February 26 2009;360:859-73.
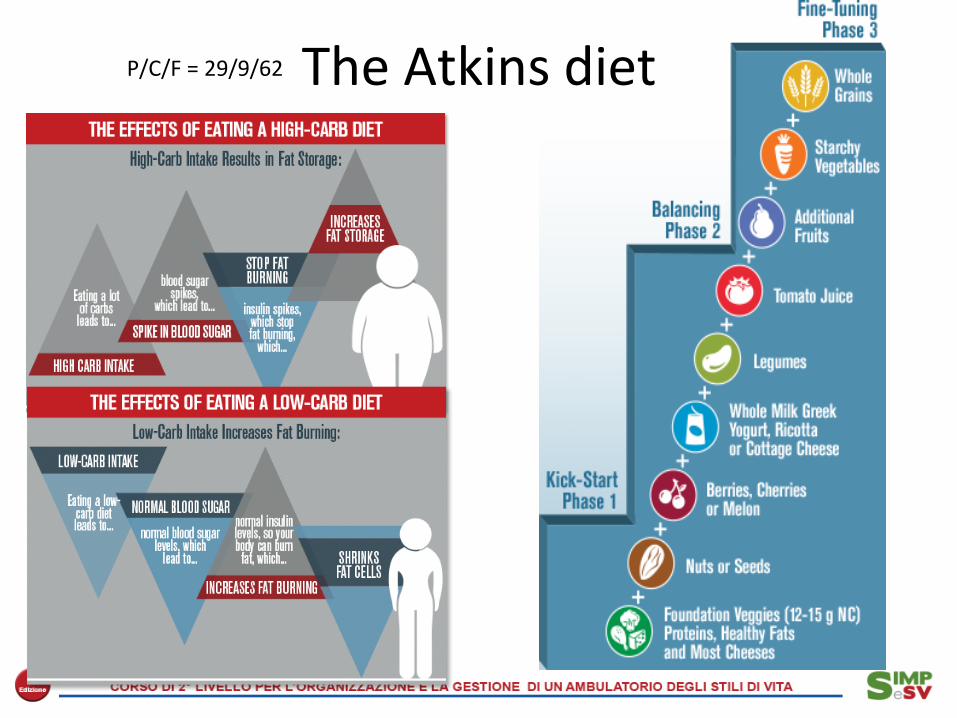
The Atkins diet P/C/F = 29/9/62
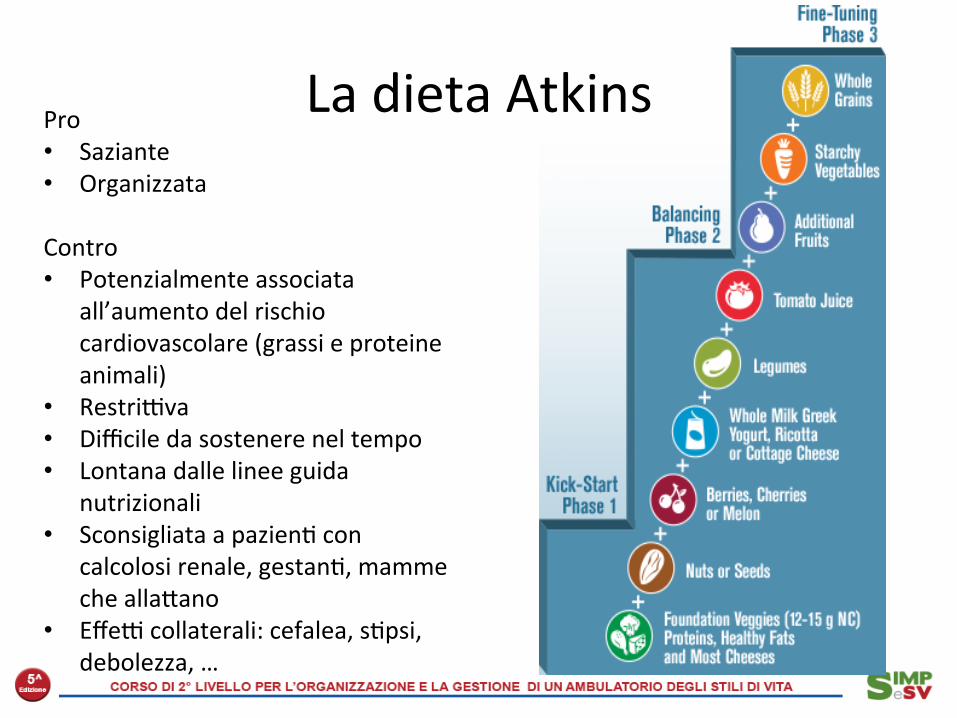
La dieta Atkins Pro • Saziante • Organizzata
Contro • Potenzialmente associata
all’aumento del rischio cardiovascolare (grassi e proteine animali)
• Restri]va • Difficile da sostenere nel tempo • Lontana dalle linee guida
nutrizionali • Sconsigliata a pazien2 con
calcolosi renale, gestan2, mamme che allajano
• Effe] collaterali: cefalea, s2psi, debolezza, …

La dieta Ornish • E’ una dieta vegetariana • E’ iperglucidica (70%En da
carboidra2, non semplici) e ipolipidica (10% En)
• Non implica restrizione calorica
• Ha un rapporto alimen2:calorie più elevato rispejo ad altre diete
• Viene associata ad a]vità fisica regolare e alla riduzione dello stress
• E’ molto restri]va • Non è indicata per alcune
condizioni par2colari (età pediatrica, gravidanza, allajamento, anziano)
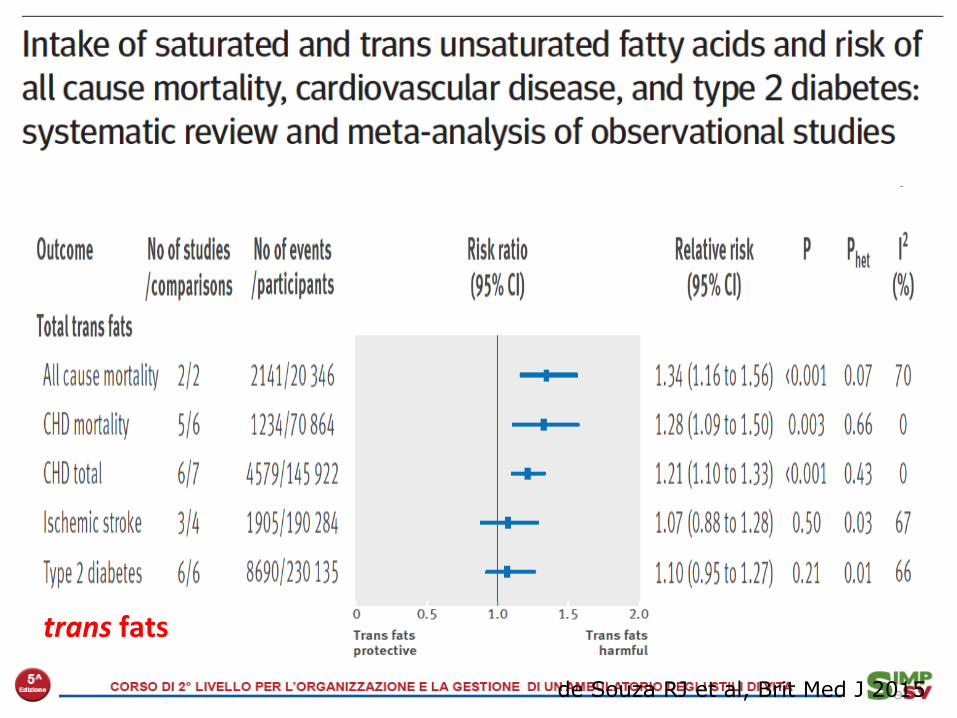
de Souza RJ et al, Brit Med J 2015
trans fats
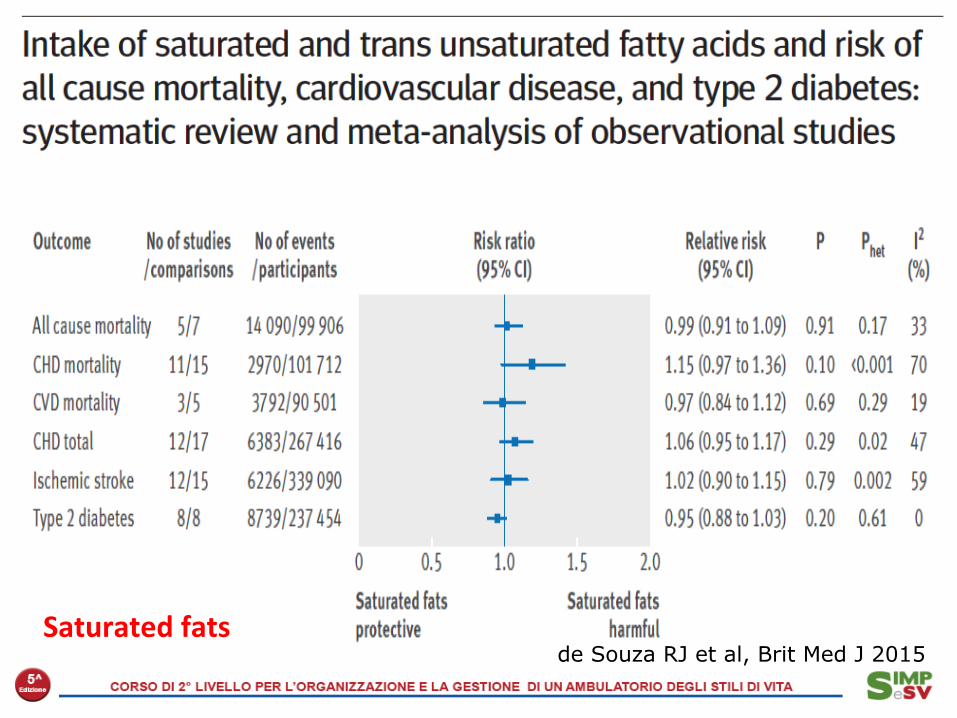
de Souza RJ et al, Brit Med J 2015 Saturated fats


de Souza RJ et al, Brit Med J 2015
trans fats

Milk and CVD: a metanalysis
(per 200 mL/d) and CHD (RR: 1.00; 95% CI: 0.96, 1.04).There was no evidence of between-study heterogeneity inthese analyses (I2 = 27%, P = 0.2). From stratified analyses bycontinent, differences were found between the studies in theUnited States (n = 2) and those in Europe (n = 4), with RRs of1.03 (95% CI: 0.99, 1.08) and 0.96 (95% CI: 0.92, 1.02),respectively, which were not significant (P = 0.3). No sig-nificant effect modification for age (P for interaction = 0.8),sex (P for interaction = 0.4), or degree of confounding (fullycompared with not fully adjusted; P for interaction = 0.6) wasseen.
Pooled results from a limited number of studies on the as-sociation between total dairy (n = 4), total high-fat (n = 4), andtotal low-fat (n = 3) dairy consumption and CHD risk showed nosignificant association between total dairy product intake andCHD (RR: 1.02; 95% CI: 0.93; 1.11, I2 = 26%, P = 0.3), totalhigh-fat dairy and CHD (RR: 1.04; 95% CI: 0.89, 1.21; I2 = 0%,P = 0.9), and total low-fat dairy and CHD (RR: 0.93; 95% CI:0.74, 1.17; I2 = 56%, P = 0.1) (see supplemental Figures 1–3under “Supplemental data” in the online issue). We assessed fornonlinear relations via restricted cubic spline functions, butfound none to be significant.
FIGURE 2. Relation between milk (per 200 mL/d) and cardiovascular disease: dose-response meta-analyses of 4 prospective cohort studies (n = 13,518, no.of cases = 2283). Shown are author names, reference number, year of publication, country of study, and the size of the association per study expressed insquares (size of square indicates weight of the study to the overall meta-analysis); the horizontal lines indicate 95% CIs. The last 2 columns contain the actualestimated relative risks (RRs) and 95% CIs pooled across the categories of milk exposure with the generalized least-squares method and the actual weights. Onthe x axis, the RR is plotted with a line through the RR (= 1) that indicates no significant association between exposure and outcome. The diamond at thebottom indicates the pooled result, with the RR in the middle and the 95% CI. A test for heterogeneity, the Higgins and Thompson I-squared value, shows howmuch heterogeneity is due to between-study variation with a P value (if P , 0.05).
FIGURE 3. Relation between milk (per 200 mL/d) and coronary heart disease: dose-response meta-analyses of 6 prospective cohort studies (n = 259,162,no. of cases = 4391). Shown are author names, reference number, year of publication, country of study, and the size of the association per study expressed insquares (size of square indicates weight of the study to the overall meta-analysis); the horizontal lines indicate 95% CIs. The last 2 columns contain the actualestimated relative risks (RRs) and 95% CIs pooled across the categories of milk exposure with the generalized least-squares method and the actual weights. Onthe x axis, the RR is plotted with a line through the RR (= 1) that indicates no significant association between exposure and outcome. The diamond at thebottom indicates the pooled result, with the RR in the middle and the 95% CI. A test for heterogeneity, the Higgins and Thompson I-squared value, shows howmuch heterogeneity is due to between-study variation with a P value (if P , 0.05).
166 SOEDAMAH-MUTHU ET AL
Soedamah-Muthu SS et al, Am J Clin Nutr 2011
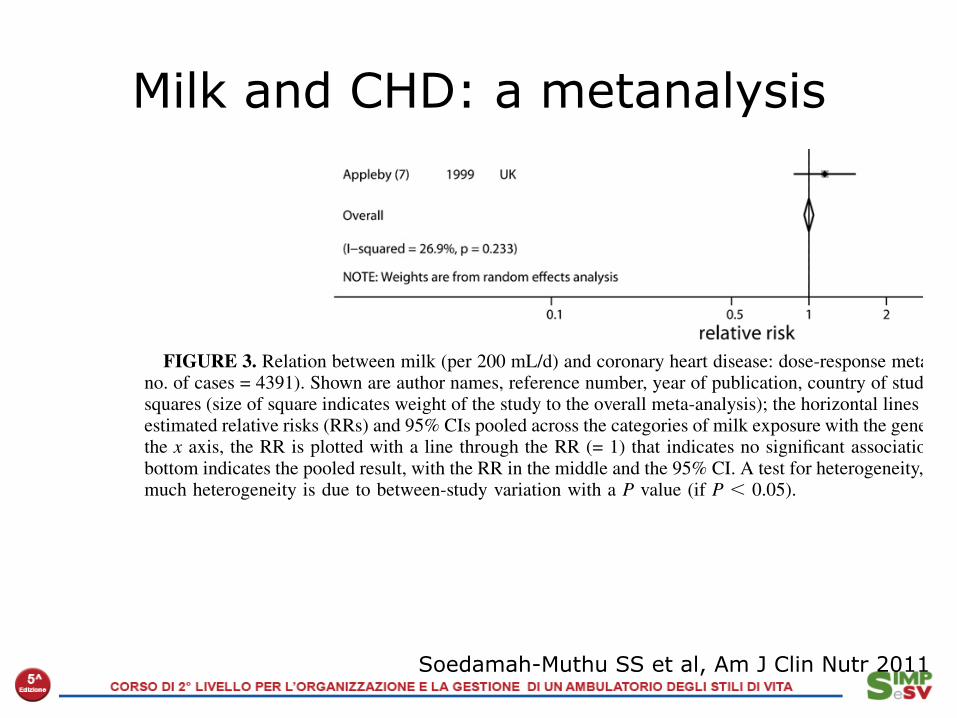
Milk and CHD: a metanalysis
Soedamah-Muthu SS et al, Am J Clin Nutr 2011
(per 200 mL/d) and CHD (RR: 1.00; 95% CI: 0.96, 1.04).There was no evidence of between-study heterogeneity inthese analyses (I2 = 27%, P = 0.2). From stratified analyses bycontinent, differences were found between the studies in theUnited States (n = 2) and those in Europe (n = 4), with RRs of1.03 (95% CI: 0.99, 1.08) and 0.96 (95% CI: 0.92, 1.02),respectively, which were not significant (P = 0.3). No sig-nificant effect modification for age (P for interaction = 0.8),sex (P for interaction = 0.4), or degree of confounding (fullycompared with not fully adjusted; P for interaction = 0.6) wasseen.
Pooled results from a limited number of studies on the as-sociation between total dairy (n = 4), total high-fat (n = 4), andtotal low-fat (n = 3) dairy consumption and CHD risk showed nosignificant association between total dairy product intake andCHD (RR: 1.02; 95% CI: 0.93; 1.11, I2 = 26%, P = 0.3), totalhigh-fat dairy and CHD (RR: 1.04; 95% CI: 0.89, 1.21; I2 = 0%,P = 0.9), and total low-fat dairy and CHD (RR: 0.93; 95% CI:0.74, 1.17; I2 = 56%, P = 0.1) (see supplemental Figures 1–3under “Supplemental data” in the online issue). We assessed fornonlinear relations via restricted cubic spline functions, butfound none to be significant.
FIGURE 2. Relation between milk (per 200 mL/d) and cardiovascular disease: dose-response meta-analyses of 4 prospective cohort studies (n = 13,518, no.of cases = 2283). Shown are author names, reference number, year of publication, country of study, and the size of the association per study expressed insquares (size of square indicates weight of the study to the overall meta-analysis); the horizontal lines indicate 95% CIs. The last 2 columns contain the actualestimated relative risks (RRs) and 95% CIs pooled across the categories of milk exposure with the generalized least-squares method and the actual weights. Onthe x axis, the RR is plotted with a line through the RR (= 1) that indicates no significant association between exposure and outcome. The diamond at thebottom indicates the pooled result, with the RR in the middle and the 95% CI. A test for heterogeneity, the Higgins and Thompson I-squared value, shows howmuch heterogeneity is due to between-study variation with a P value (if P , 0.05).
FIGURE 3. Relation between milk (per 200 mL/d) and coronary heart disease: dose-response meta-analyses of 6 prospective cohort studies (n = 259,162,no. of cases = 4391). Shown are author names, reference number, year of publication, country of study, and the size of the association per study expressed insquares (size of square indicates weight of the study to the overall meta-analysis); the horizontal lines indicate 95% CIs. The last 2 columns contain the actualestimated relative risks (RRs) and 95% CIs pooled across the categories of milk exposure with the generalized least-squares method and the actual weights. Onthe x axis, the RR is plotted with a line through the RR (= 1) that indicates no significant association between exposure and outcome. The diamond at thebottom indicates the pooled result, with the RR in the middle and the 95% CI. A test for heterogeneity, the Higgins and Thompson I-squared value, shows howmuch heterogeneity is due to between-study variation with a P value (if P , 0.05).
166 SOEDAMAH-MUTHU ET AL
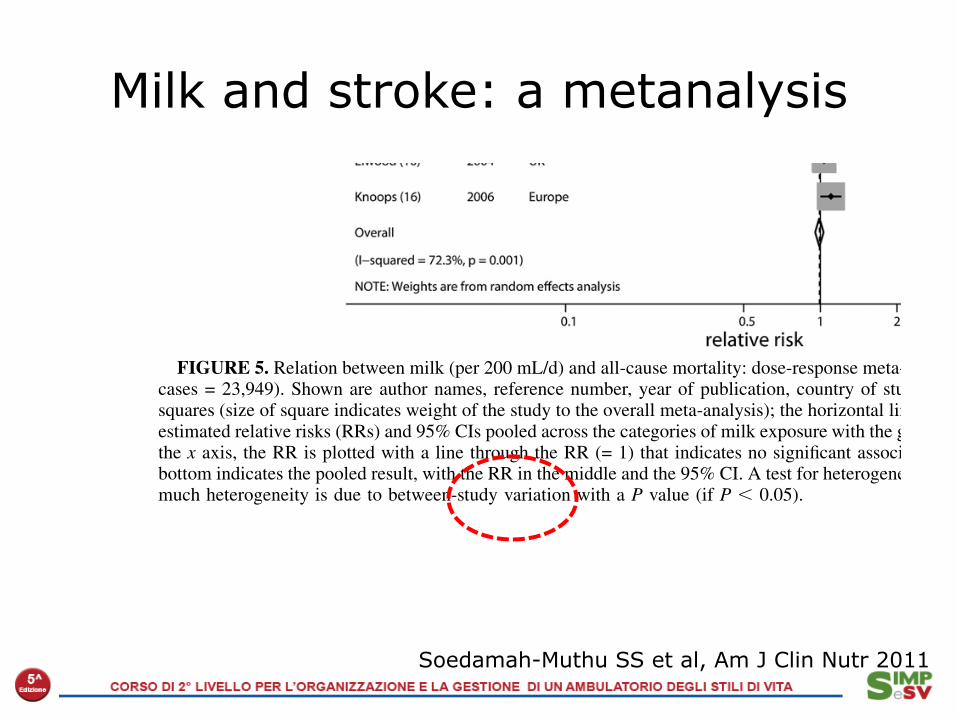
Milk and stroke: a metanalysis
Soedamah-Muthu SS et al, Am J Clin Nutr 2011
Stroke
Data from a total of 375,381 participants and 15,554 fatal andnonfatal stroke cases were analyzed in 6 prospective cohortstudies, with milk as the main exposure. The mean (6SD) agewas 52 6 5 y. Most of the studies consisted of men, and themean (6 SD) follow-up was 18 6 5 y. The mean milk intakeover these 6 studies was 219 mL/d (range: 0–850 mL/d). Themost recent study, by Larsson et al (8), presented the results of
high-fat and low-fat milk separately and did not have data ontotal milk. Two separate meta-analyses were carried out, in-cluding either the low-fat or high-fat milk results of Larsson et al(8). The pooled estimate of all studies (Figure 4) with Larssonet al’s high-fat milk data suggested an inverse association, but itwas not statistically significant (RR: 0.87; 95% CI: 0.72, 1.07).The pooled estimate for the studies including Larsson et al’slow-fat milk data showed similar results (RR: 0.87; 95% CI:
FIGURE 4. Relation between milk (per 200 mL/d) and stroke; dose-response meta-analyses of 6 prospective cohort studies (n = 375,381, no. of cases =15,554). This figure includes the data from the Larsson study on high-fat milk. The pooled relative risk (RR) including Larsson’s low-fat milk instead of high-fat milk is similar (RR: 0.87; 95% CI: 0.72, 1.05). Shown are author names, reference number, year of publication, country of study, and the size of theassociation per study expressed in squares (size of square indicates weight of the study to the overall meta-analysis); the horizontal lines indicate 95% CIs. Thelast 2 columns contain the actual estimated RRs and 95% CIs pooled across the categories of milk exposure with the generalized least-squares method and theactual weights. On the x axis, the RR is plotted with a line through the RR (= 1) that indicates no significant association between exposure and outcome. Thediamond at the bottom indicates the pooled result, with the RR in the middle and the 95% CI. A test for heterogeneity, the Higgins and Thompson I-squaredvalue, shows how much heterogeneity is due to between-study variation with a P value (if P , 0.05).
FIGURE 5. Relation between milk (per 200 mL/d) and all-cause mortality: dose-response meta-analyses of 8 prospective cohort studies (n = 62,779, no. ofcases = 23,949). Shown are author names, reference number, year of publication, country of study, and the size of the association per study expressed insquares (size of square indicates weight of the study to the overall meta-analysis); the horizontal lines indicate 95% CIs. The last 2 columns contain the actualestimated relative risks (RRs) and 95% CIs pooled across the categories of milk exposure with the generalized least-squares method and the actual weights. Onthe x axis, the RR is plotted with a line through the RR (= 1) that indicates no significant association between exposure and outcome. The diamond at thebottom indicates the pooled result, with the RR in the middle and the 95% CI. A test for heterogeneity, the Higgins and Thompson I-squared value, shows howmuch heterogeneity is due to between-study variation with a P value (if P , 0.05).
DAIRY AND CVD META-ANALYSIS 167
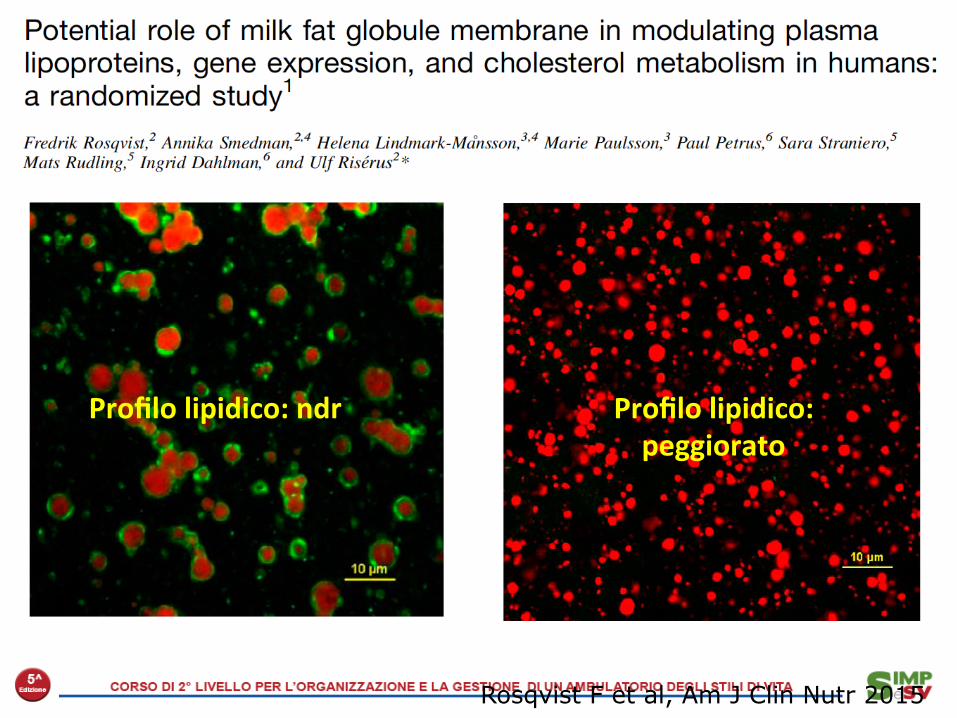
Rosqvist F et al, Am J Clin Nutr 2015
Cream/milk bujer
Profilo lipidico: ndr Profilo lipidico: peggiorato

Tripep<di del laVe: riduzione PAS e PAS basale negli studi controlla< disponibili
PAS baseline
160150140130120110
Delta
PAS
2
0
-2
-4
-6
-8
-10
-12
-14
-16
- - -
Cicero A et al, personal comunication, 2009
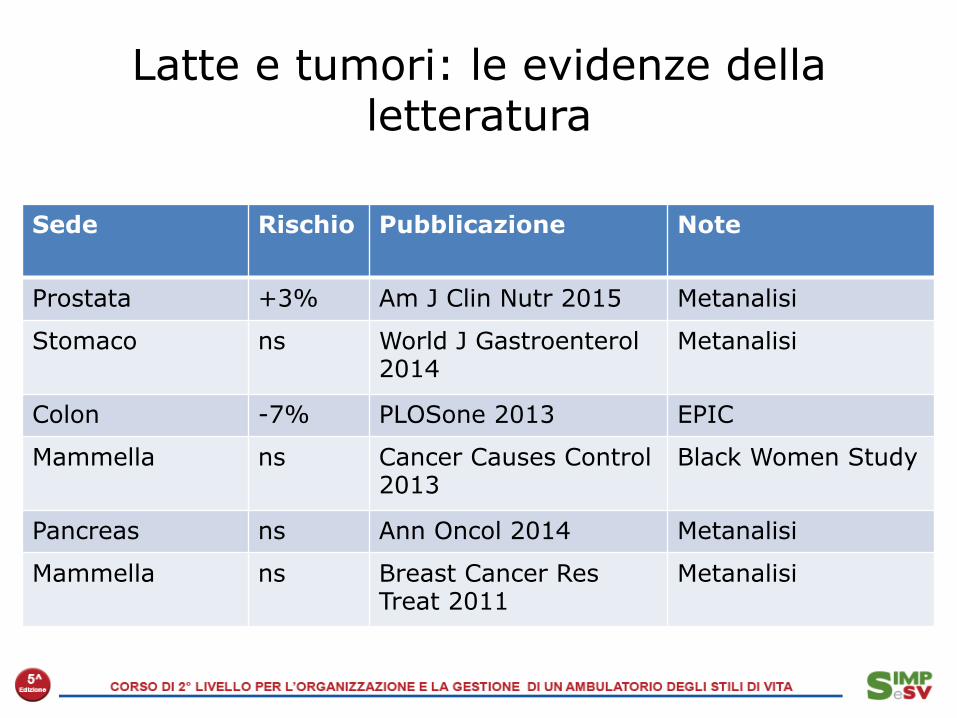
Latte e tumori: le evidenze della letteratura
Sede Rischio Pubblicazione Note
Prostata +3% Am J Clin Nutr 2015 Metanalisi
Stomaco ns World J Gastroenterol 2014
Metanalisi
Colon -7% PLOSone 2013 EPIC
Mammella ns Cancer Causes Control 2013
Black Women Study
Pancreas ns Ann Oncol 2014 Metanalisi
Mammella ns Breast Cancer Res Treat 2011
Metanalisi

Astrup A, Am J Clin Nutr 2014
A changing view on SFAs and dairy: from enemy to friend

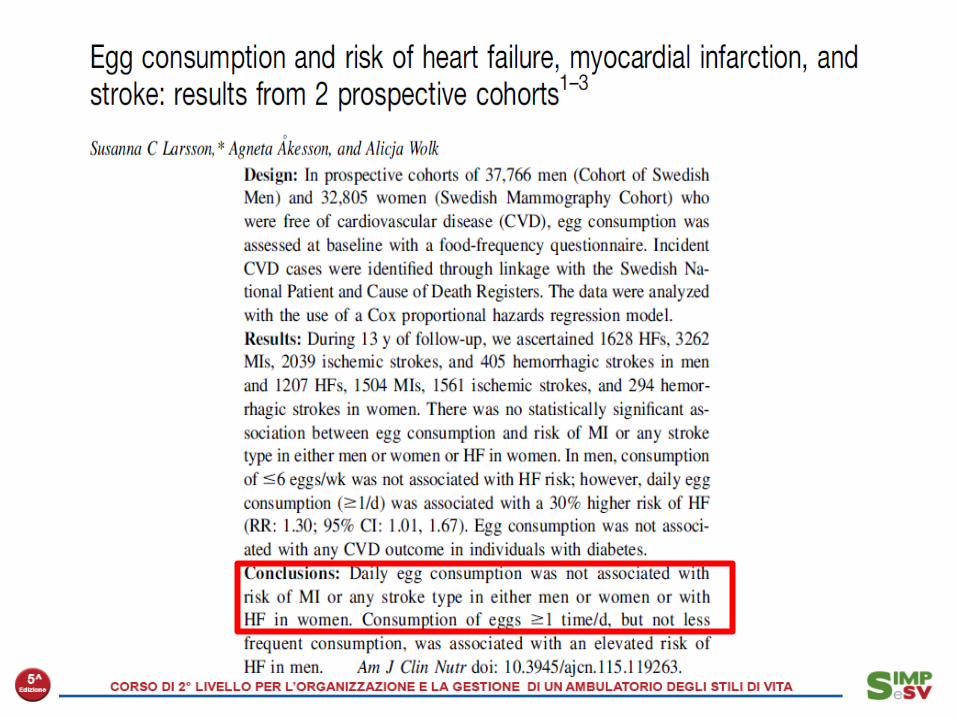
Uova e colesterolo alimentare: un tema da ripensare?
Spence, Jenkins & Davignon, Aherosclerosis 2012

Carolyn A Miller et al. Am J Clin Nutr 2014;100:778-786
Plasma TMAO. Six healthy volunteers (subjects) consumed a standardized low-choline diet on the day before each of 5 randomly assigned doses of 0, 1, 2, 4, or 6 egg yolks.
Effect of egg ingestion on trimethylamine-N-oxide production in humans: a randomized, controlled,
dose-response study

of 30% of daily energy from carbohydrate. Unlike someprevious studies, our trial included men and women whodid not have diabetes and CVD at baseline and compre-hensively measured cardiovascular risk profiles.
Our results with regard to body weight are consistentwith those of other trials (23, 24) and a recent meta-analysis (25). The underlying mechanisms that may ac-count for differences in weight loss by diet are still notfully identified, but a recent study indicated that low-carbohydrate diets may have a more favorable effect onresting energy expenditure and total energy expenditurethan low-fat diets (26). In addition, our findings suggestthat the loss of fat mass accounts for most of the reductionin body weight on a low-carbohydrate diet, which is con-sistent with other study findings (19, 21).
We found that a low-carbohydrate diet resulted in asignificantly greater reduction in the ratio of total–HDLcholesterol, which has been identified as a strong and in-dependent predictor of CHD (27). This finding is consis-tent with at least 1 previous study (23) but not others thathad small sample sizes or high rates of loss to follow-up(20, 21). The decreases in HDL cholesterol and triglycer-
ide levels that we observed were within the range reportedin previous weight-loss studies (25).
A major concern that has been frequently raised aboutlow-carbohydrate diets is their potential to elevate LDLcholesterol levels, an established risk factor for CVD (8,28). In contrast, a recent meta-analysis showed that bothlow-fat and low-carbohydrate diets reduced LDL choles-terol levels, although the reduction was less for personsassigned to low-carbohydrate diets (25). Our study alsofound reductions in LDL cholesterol level among partici-pants in both groups, with no significant difference be-tween the groups.
We also observed moderate reductions in blood pres-sure and plasma glucose, serum insulin, and serum creati-nine levels that did not differ significantly between groups.In our study, participants on the low-carbohydrate diet hadgreater decreases in CRP levels than those on the low-fatdiet. Two previous studies that examined CRP levels foundno difference between the diets (19, 29); however, bothhad relatively small sample sizes and may have beenunderpowered.
Figure 2. Predicted mean changes in body weight, fat mass, total–HDL cholesterol ratio, and triglyceride level in the low-fat andlow-carbohydrate diet groups.
Cha
nge
in B
ody
Wei
ght,
kg
Baseline 12 mo6 mo3 mo
–8.0
–7.0
–6.0
–5.0
–4.0
–3.0
–2.0
–1.0*
0
*
*
Cha
nge
in F
at M
ass,
%
Baseline 12 mo6 mo3 mo
–2.5
–2.0
–1.5
–1.0
–0.5
0
0.5
1.0
1.5
*
*
Cha
nge
in T
otal
–HD
L C
hole
ster
ol R
atio
Baseline 12 mo6 mo3 mo
–0.8
–0.6
–0.4
–0.2
0
0.2
0.4
**
Cha
nge
in T
rigl
ycer
ide
Leve
l, mmol/L
Baseline 12 mo6 mo3 mo
–0.4
–0.3
–0.2
–0.1
0
0.1
0.2
**
*
Low-fat diet Low-carbohydrate diet----
Results are from random-effects models and are expressed as means, with error bars representing 95% CIs. To convert triglyceride values to mg/dL, divideby 0.0113. HDL ! high-density lipoprotein.* P " 0.05 for between-group difference.
Original Research Effects of Low-Carbohydrate and Low-Fat Diets
316 2 September 2014 Annals of Internal Medicine Volume 161 • Number 5 www.annals.org
Downloaded From: http://annals.org/ by a Polo San Paolo User on 09/02/2014
Low fat vs Low carb diets: a RCT. Effects on weight and fat mass
Bazzano AL et al, Ann Intern Med 2014
∆: 3 Kg ∆: 1,5 Kg

Low fat vs Low carb diets: a RCT. Effects on HDL-‐c and Triglycerides
Bazzano AL et al, Ann Intern Med 2014
of 30% of daily energy from carbohydrate. Unlike someprevious studies, our trial included men and women whodid not have diabetes and CVD at baseline and compre-hensively measured cardiovascular risk profiles.
Our results with regard to body weight are consistentwith those of other trials (23, 24) and a recent meta-analysis (25). The underlying mechanisms that may ac-count for differences in weight loss by diet are still notfully identified, but a recent study indicated that low-carbohydrate diets may have a more favorable effect onresting energy expenditure and total energy expenditurethan low-fat diets (26). In addition, our findings suggestthat the loss of fat mass accounts for most of the reductionin body weight on a low-carbohydrate diet, which is con-sistent with other study findings (19, 21).
We found that a low-carbohydrate diet resulted in asignificantly greater reduction in the ratio of total–HDLcholesterol, which has been identified as a strong and in-dependent predictor of CHD (27). This finding is consis-tent with at least 1 previous study (23) but not others thathad small sample sizes or high rates of loss to follow-up(20, 21). The decreases in HDL cholesterol and triglycer-
ide levels that we observed were within the range reportedin previous weight-loss studies (25).
A major concern that has been frequently raised aboutlow-carbohydrate diets is their potential to elevate LDLcholesterol levels, an established risk factor for CVD (8,28). In contrast, a recent meta-analysis showed that bothlow-fat and low-carbohydrate diets reduced LDL choles-terol levels, although the reduction was less for personsassigned to low-carbohydrate diets (25). Our study alsofound reductions in LDL cholesterol level among partici-pants in both groups, with no significant difference be-tween the groups.
We also observed moderate reductions in blood pres-sure and plasma glucose, serum insulin, and serum creati-nine levels that did not differ significantly between groups.In our study, participants on the low-carbohydrate diet hadgreater decreases in CRP levels than those on the low-fatdiet. Two previous studies that examined CRP levels foundno difference between the diets (19, 29); however, bothhad relatively small sample sizes and may have beenunderpowered.
Figure 2. Predicted mean changes in body weight, fat mass, total–HDL cholesterol ratio, and triglyceride level in the low-fat andlow-carbohydrate diet groups.
Cha
nge
in B
ody
Wei
ght,
kg
Baseline 12 mo6 mo3 mo
–8.0
–7.0
–6.0
–5.0
–4.0
–3.0
–2.0
–1.0*
0
*
*
Cha
nge
in F
at M
ass,
%
Baseline 12 mo6 mo3 mo
–2.5
–2.0
–1.5
–1.0
–0.5
0
0.5
1.0
1.5
*
*
Cha
nge
in T
otal
–HD
L C
hole
ster
ol R
atio
Baseline 12 mo6 mo3 mo
–0.8
–0.6
–0.4
–0.2
0
0.2
0.4
**
Cha
nge
in T
rigl
ycer
ide
Leve
l, mmol/L
Baseline 12 mo6 mo3 mo
–0.4
–0.3
–0.2
–0.1
0
0.1
0.2
**
*
Low-fat diet Low-carbohydrate diet----
Results are from random-effects models and are expressed as means, with error bars representing 95% CIs. To convert triglyceride values to mg/dL, divideby 0.0113. HDL ! high-density lipoprotein.* P " 0.05 for between-group difference.
Original Research Effects of Low-Carbohydrate and Low-Fat Diets
316 2 September 2014 Annals of Internal Medicine Volume 161 • Number 5 www.annals.org
Downloaded From: http://annals.org/ by a Polo San Paolo User on 09/02/2014
∆: 0.4 ∆: 0.2 mmol
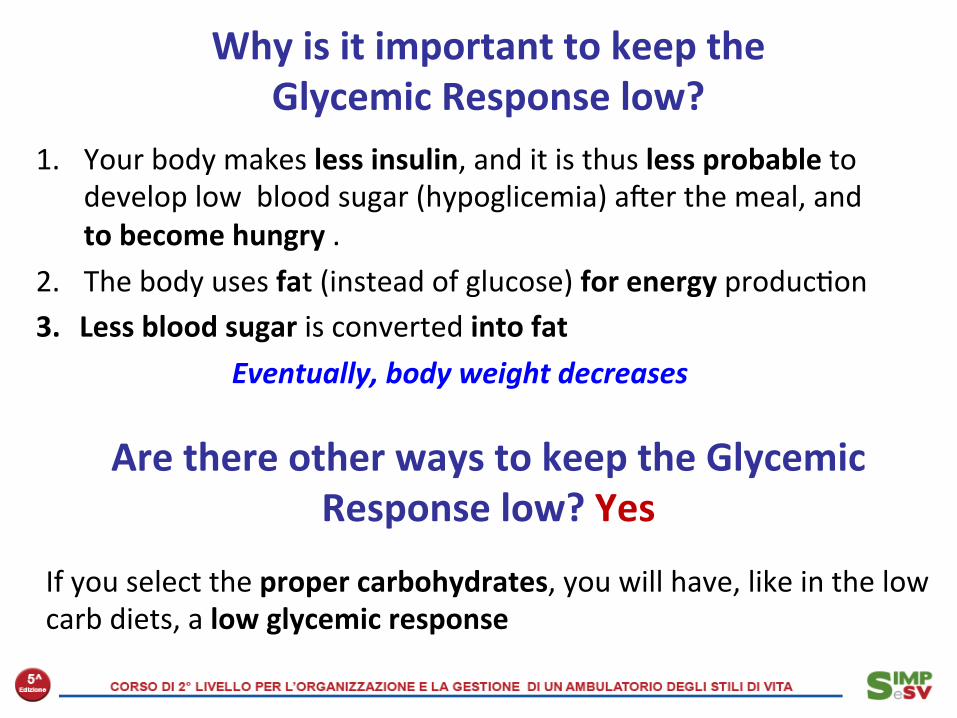
1. Your body makes less insulin, and it is thus less probable to develop low blood sugar (hypoglicemia) awer the meal, and to become hungry .
2. The body uses fat (instead of glucose) for energy produc2on 3. Less blood sugar is converted into fat
Eventually, body weight decreases
Why is it important to keep the Glycemic Response low?
Are there other ways to keep the Glycemic Response low? Yes
If you select the proper carbohydrates, you will have, like in the low carb diets, a low glycemic response
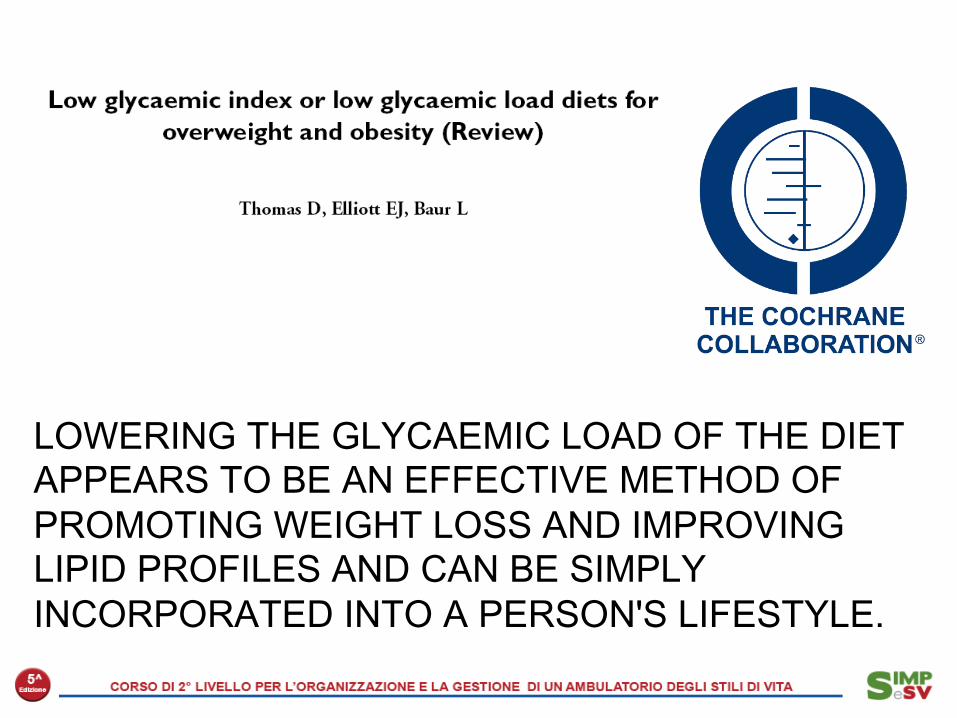
Cochrane Database Syst Rev. 2007 Jul 18;(3):CD005105.
LOWERING THE GLYCAEMIC LOAD OF THE DIET APPEARS TO BE AN EFFECTIVE METHOD OF PROMOTING WEIGHT LOSS AND IMPROVING LIPID PROFILES AND CAN BE SIMPLY INCORPORATED INTO A PERSON'S LIFESTYLE.

GLYCEMIC RESPONSE AFTER A WHITE BREAD OR A SPAGHETTI MEAL
Ludwig, J Am Med Assoc, 2002
-25
0
25
50
0 20 30 40 50 60 90 105 120 150 180
White Bread Spaghetti
Time, minutes
∆ Glic., mg/dL

Post-prandial glucose excursions and urinary excretion of 8-iso PGF2 alfa, a measure of oxidant
stress.
Monnier L et al, JAMA 2006

Il glucosio ematico aumenta rispetto ai livelli basali dopo assunzione di pane bianco pane tostato , pizza e gnocchi di patate . *p< 0.05, **p<0.01 gnocchi vs pane bianco.
IG 114 IG 104
IG 74
Riccardi, Nutrition Reviews, 2003

L’analisi al microscopio elettronico a scansione dimostra che gli gnocchi hanno una struttura compatta come altri alimenti a base di carboidrati a basso indice glicemico. Al contrario negli alimenti lievitati l’elevata porosità conseguente all’incorporazione di gas che espande durante la cottura, aumenta enormemente la superficie esposta all’attività enzimatica.
Riccardi, Nutrition Reviews, 2003
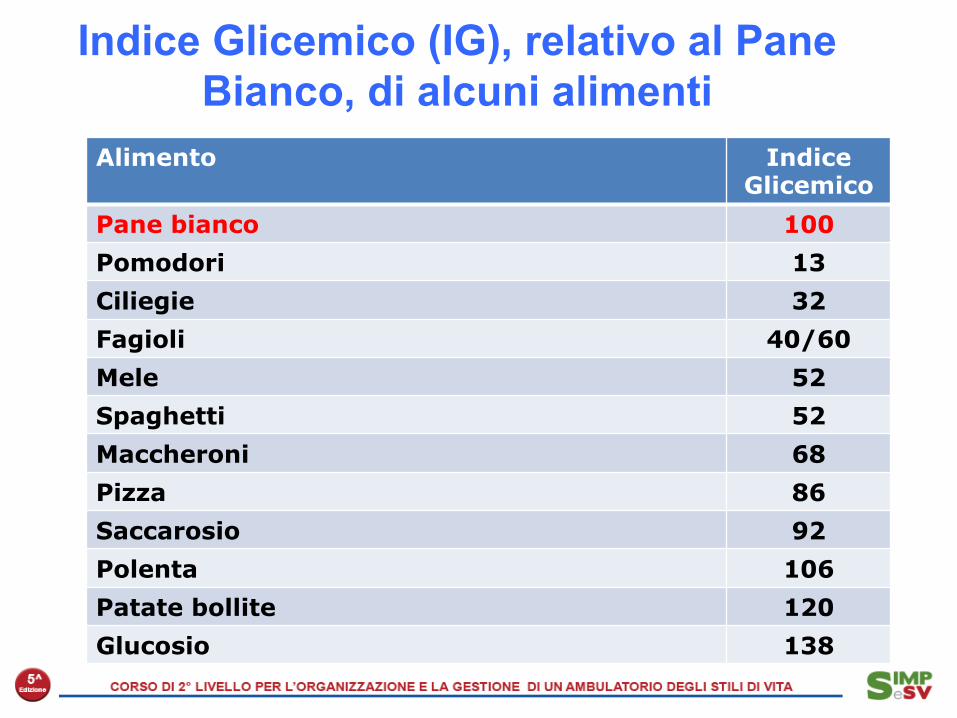
Indice Glicemico (IG), relativo al Pane Bianco, di alcuni alimenti
Pomodori 13 Ciliegie 32 Fagioli 40-60 Mele 52 Pasta (spaghetti) 52 Pasta (maccheroni) 68 Pizza 86 Saccarosio 92 Polenta 106 Cornflakes 100-120 Miele 120 Patate bollite 120 Glucosio 138
Alimento Indice Glicemico
Pane bianco 100
Pomodori 13
Ciliegie 32
Fagioli 40/60
Mele 52
Spaghetti 52
Maccheroni 68
Pizza 86
Saccarosio 92
Polenta 106
Patate bollite 120
Glucosio 138

Indice glicemico di alcuni alimenti assunti singolarmente o con pasti composti

Association between 4-y changes in servings of protein foods with long-term weight change.
Jessica D Smith et al. Am J Clin Nutr 2015;101:1216-1224
P r o t e i n e d a f o n t i “ m a g r e ” e carboidrati a basso indice glicemico promuovono e mantengono nel tempo un miglior controllo ponderale
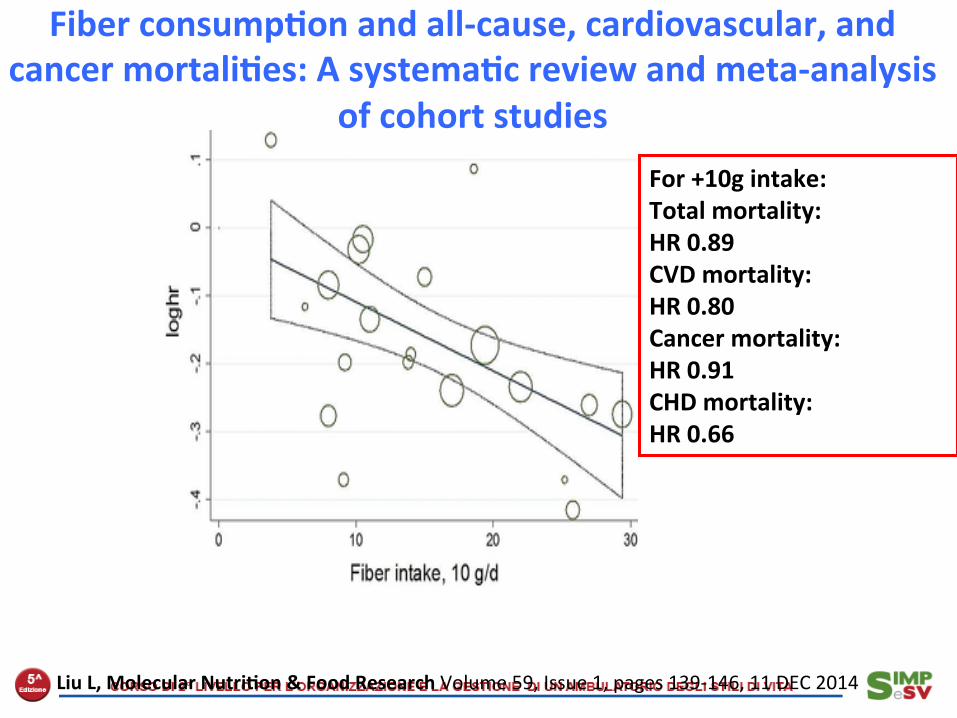
Fiber consump<on and all-‐cause, cardiovascular, and cancer mortali<es: A systema<c review and meta-‐analysis
of cohort studies For +10g intake: Total mortality: HR 0.89 CVD mortality: HR 0.80 Cancer mortality: HR 0.91 CHD mortality: HR 0.66
Liu L, Molecular Nutri<on & Food Research Volume 59, Issue 1, pages 139-‐146, 11 DEC 2014
with the risk of becoming overweight or obese. No associa-tion was observed for dietary fiber intake. Moreover, wefound no significant associations of fruit and dietary fiberintake with weight gain, whereas higher vegetable intakewas associated with greater weight gain during 15.9 y offollow-up.
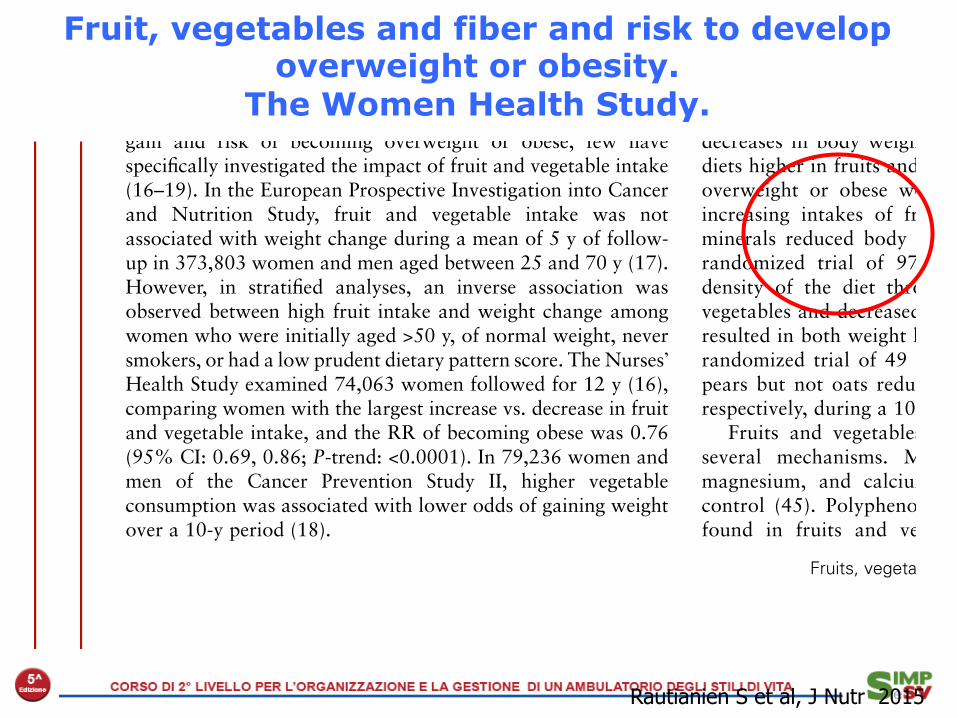
Although several observation studies (38–44) have investi-gated how different food patterns are associated with weightgain and risk of becoming overweight or obese, few havespecifically investigated the impact of fruit and vegetable intake(16–19). In the European Prospective Investigation into Cancerand Nutrition Study, fruit and vegetable intake was notassociated with weight change during a mean of 5 y of follow-up in 373,803 women and men aged between 25 and 70 y (17).However, in stratified analyses, an inverse association wasobserved between high fruit intake and weight change amongwomen who were initially aged >50 y, of normal weight, neversmokers, or had a low prudent dietary pattern score. The Nurses!Health Study examined 74,063 women followed for 12 y (16),comparing women with the largest increase vs. decrease in fruitand vegetable intake, and the RR of becoming obese was 0.76(95% CI: 0.69, 0.86; P-trend: <0.0001). In 79,236 women andmen of the Cancer Prevention Study II, higher vegetableconsumption was associated with lower odds of gaining weightover a 10-y period (18).
Randomized trials testing diets high in fruits and vegeta-bles—typically among overweight or obese individuals—havebeen linked with weight loss in primary and secondary analyses(20–25). Two randomized trials, one including 45 women (21)and the other 90 women and men (20), have investigated theeffect of fruit and vegetable intake on weight loss as theprimary endpoint. In these 2 trials, following the participantsfor a 10-wk and 8-wk period, respectively, nonsignificantdecreases in body weight were reported for the groups withdiets higher in fruits and vegetables (20, 21). In a trial of 658overweight or obese women and men followed for 6 mo,increasing intakes of fruit, vegetables, fiber, vitamins, andminerals reduced body weight by 5.1–6.1 kg (23). Anotherrandomized trial of 97 obese women reduced the energydensity of the diet through increased intake of fruits andvegetables and decreased fat intake, and the diet interventionresulted in both weight loss and maintenance (24). In a smallrandomized trial of 49 women and men, adding apples andpears but not oats reduced weight by 0.93 kg and 0.84 kg,respectively, during a 10-wk period (25).
Fruits and vegetables may prevent weight gain throughseveral mechanisms. Micronutrients, e.g., potassium andmagnesium, and calcium seem to be beneficial in weightcontrol (45). Polyphenols, a group of bioactive compoundsfound in fruits and vegetables, may prevent weight gain
TABLE 3 HRs (95% CIs) of becoming overweight or obese according to quintiles of fruit, vegetable, anddietary fiber intake among middle-aged and older women1
n Cases
Age adjusted Multivariable adjusted
HR (95% CI) HR (95% CI)2 HR (95% CI)2 + BMI
Fruits and vegetables, servings/dQ1: ,3.5 3573 1726 1.00 (ref) 1.00 (ref) 1.00 (ref)Q2: 3.5 to ,4.9 3680 1705 0.96 (0.90, 1.03) 0.99 (0.93, 1.06) 0.88 (0.82, 0.94)Q3: 4.9 to ,6.3 3672 1600 0.91 (0.85, 0.97) 0.95 (0.89, 1.03) 0.92 (0.86, 0.99)Q4: 6.3 to ,8.2 3668 1577 0.91 (0.85, 0.98) 0.98 (0.91, 1.05) 0.93 (0.86, 1.00)Q5: $8.2 3553 1517 0.91 (0.85, 0.97) 1.01 (0.93, 1.10) 0.91 (0.84, 0.99)P-trend 0.003 0.80 0.19
Fruits, servings/dQ1: ,1.0 3604 1781 1.00 (ref) 1.00 (ref) 1.00 (ref)Q2: 1.0 to ,1.7 3644 1694 0.94 (0.88, 1.01) 0.97 (0.91, 1.04) 0.86 (0.80, 0.92)Q3: 1.7 to ,2.3 3654 1648 0.92 (0.86, 0.98) 0.96 (0.89, 1.02) 0.93 (0.87, 1.00)Q4: 2.3 to ,3.1 3677 1586 0.88 (0.82, 0.94) 0.92 (0.86, 0.99) 0.92 (0.85, 0.99)Q5: $3.1 3567 1416 0.81 (0.75, 0.87) 0.86 (0.79, 0.93) 0.87 (0.80, 0.94)P-trend ,0.0001 0.0001 0.01
Vegetables, servings/dQ1: ,2.0 3605 1659 1.00 (ref) 1.00 (ref) 1.00 (ref)Q2: 2.0 to ,3.0 3649 1617 0.95 (0.89, 1.02) 0.98 (0.91, 1.05) 0.86 (0.80, 0.92)Q3: 3.0 to ,3.9 3682 1674 1.01 (0.94, 1.08) 1.07 (1.00, 1.15) 1.05 (0.97, 1.12)Q4: 3.9 to ,5.4 3662 1618 0.98 (0.91, 1.05) 1.06 (0.98, 1.14) 1.00 (0.93, 1.07)Q5: $5.4 3548 1557 0.99 (0.92, 1.06) 1.11 (1.03, 1.20) 0.99 (0.91, 1.07)P-trend 0.94 0.003 0.22
Dietary fiber, mg/dQ1: ,12.4 3630 1727 1.00 (ref) 1.00 (ref) 1.00 (ref)Q2: 12.4 to ,16.1 3615 1660 0.98 (0.91, 1.04) 1.00 (0.93, 1.07) 1.18 (1.10, 1.27)Q3: 16.1 to ,19.7 3642 1627 0.94 (0.88, 1.00) 0.97 (0.90, 1.04) 1.07 (0.99, 1.16)Q4: 19.7 to ,24.7 3629 1587 0.93 (0.87, 1.00) 0.98 (0.90, 1.06) 1.05 (0.96, 1.14)Q5: $24.7 3630 1524 0.90 (0.84, 0.96) 0.96 (0.88, 1.06) 1.00 (0.91, 1.10)P-trend 0.0008 0.40 0.13
1 All statistical tests were conducted with use of Cox proportional hazards regression models. Q, quintile; ref, reference.2 Adjusted for age, randomization treatment assignment, physical activity, history of hypercholesterolemia or hypertension, smoking status,
postmenopausal status, postmenopausal hormone use, alcohol use, multivitamin use, and energy intake.
Fruits, vegetables, and dietary fiber and weight 5 of 9
at UNIV. DEGLI STUDI-M
ILANO FAC. DI M
EDICINA VETERINARIA on February 27, 2015jn.nutrition.org
Downloaded from
Fruit, vegetables and fiber and risk to develop overweight or obesity.
The Women Health Study.
Rautianien S et al, J Nutr 2015
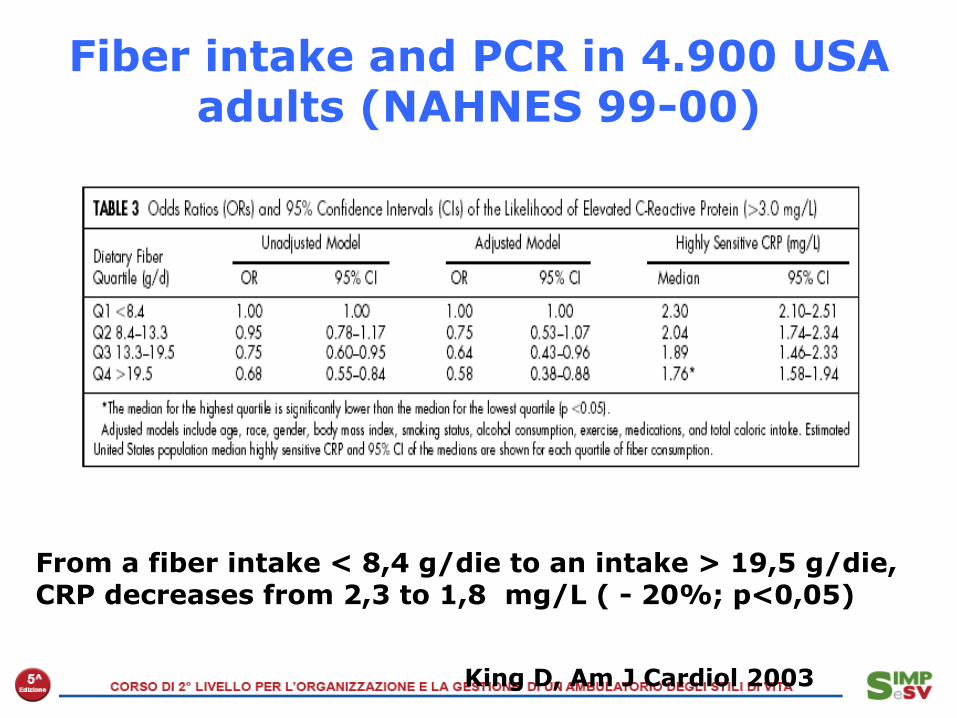
Fiber intake and PCR in 4.900 USA adults (NAHNES 99-00)
From a fiber intake < 8,4 g/die to an intake > 19,5 g/die, CRP decreases from 2,3 to 1,8 mg/L ( - 20%; p<0,05)
King D, Am J Cardiol 2003
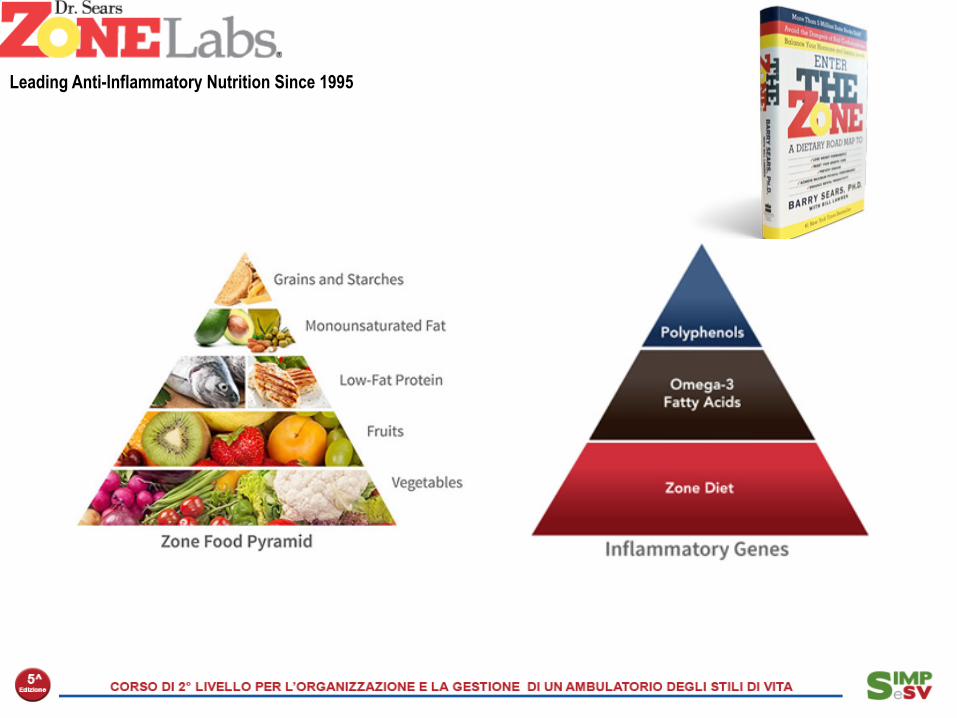
Leading Anti-Inflammatory Nutrition Since 1995

Biomarkers of inflammation and endothelial dysfunction and trans fatty acid intake in the
Nurses’ Health Study (1986-1990)
* P for trend of medians in each quintiles
Lopez-Garcia, J Nutr 2005
Quintile n CRP mg/L IL-6 ng/L E-selectin ng/L
Trans fatty acids
(range; g/d)
Q1 (0.61-1.87) 147 1.1 (0.9, 1.3) 1.8 (1.6, 2.0) 41.8 (39.0, 44.9)
Q2 (1.88-2.26) 145 1.3 (1.1, 1.6) 1.7 (1.5, 2.0) 41.9 (39.0, 45.0)
Q3 (2.27-2.64) 146 1.5 (1.3, 1.8) 1.8 (1.6, 2.0) 41.9 (39.0, 45.0)
Q4 (2.65-3.13) 146 1.7 (1.4, 2.0) 1.9 (1.7, 2.2) 45.1 (42.0, 48.4)
Q5 (3.14-7.58) 146 1.9 (1.6, 2.3) 2.1 (1.8, 2.3) 50.3 (46.8, 54.0)
P for trend* <0.001 0.02 <0.001
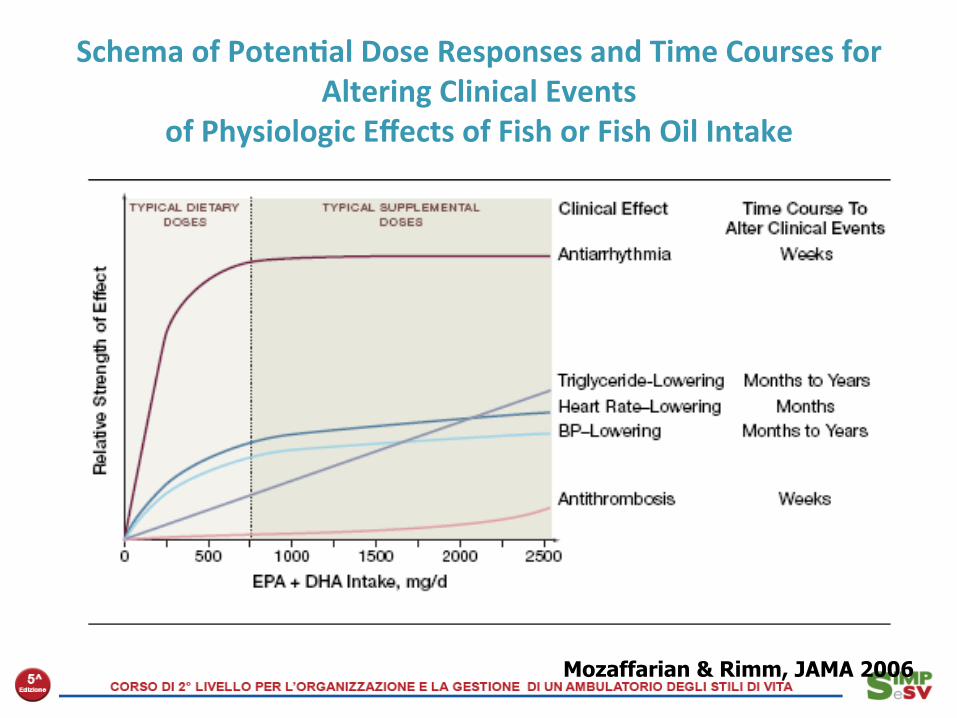
Schema of Poten<al Dose Responses and Time Courses for Altering Clinical Events
of Physiologic Effects of Fish or Fish Oil Intake
Mozaffarian & Rimm, JAMA 2006
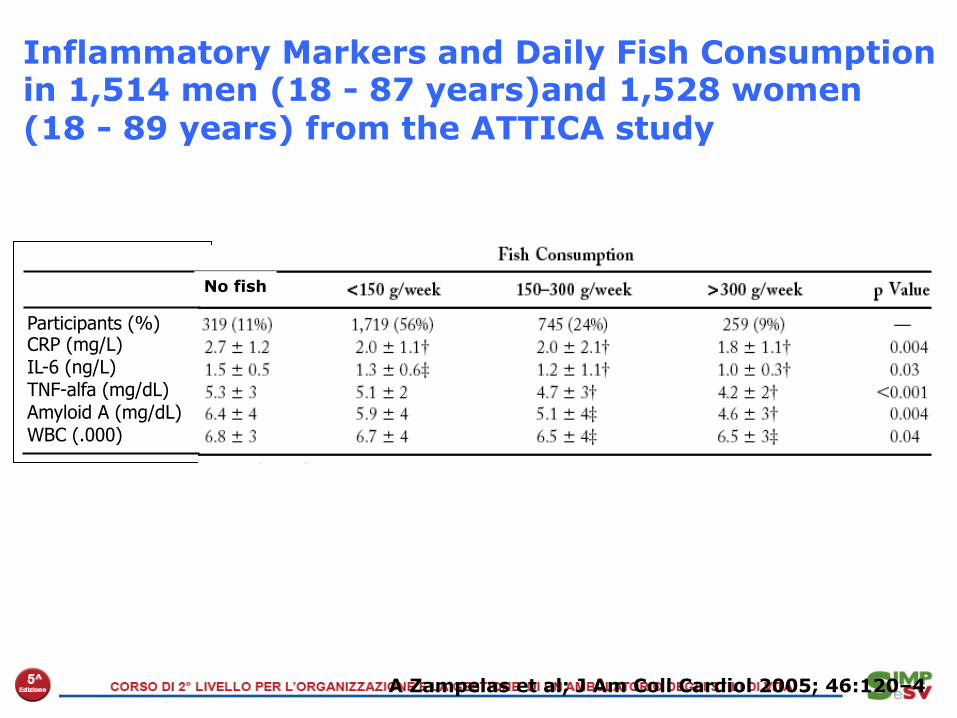
Inflammatory Markers and Daily Fish Consumption in 1,514 men (18 - 87 years)and 1,528 women (18 - 89 years) from the ATTICA study
A Zampelas et al; J Am Coll Cardiol 2005; 46:120–4
Participants (%) CRP (mg/L) IL-6 (ng/L) TNF-alfa (mg/dL) Amyloid A (mg/dL) WBC (.000)
No fish
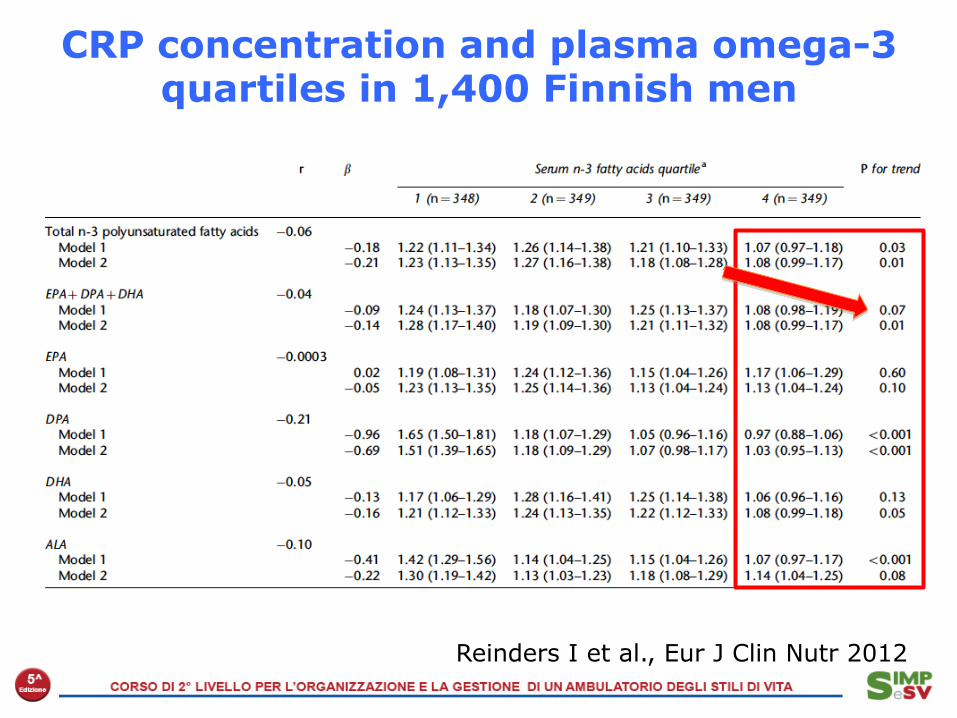
Reinders I et al., Eur J Clin Nutr 2012
CRP concentration and plasma omega-3 quartiles in 1,400 Finnish men
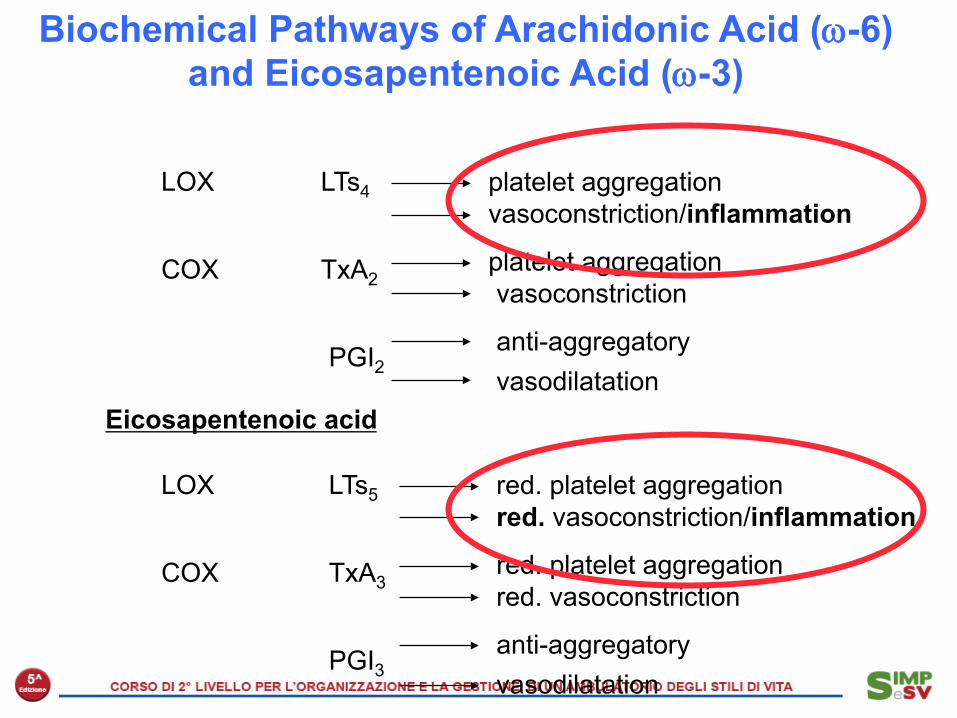
Biochemical Pathways of Arachidonic Acid (ω-6) and Eicosapentenoic Acid (ω-3)
Arachidonic acid
LOX
COX TxA2
LTs4 platelet aggregation vasoconstriction/inflammation
vasoconstriction platelet aggregation
PGI2 vasodilatation anti-aggregatory
Eicosapentenoic acid
LOX
COX TxA3
LTs5 red. platelet aggregation red. vasoconstriction/inflammation
red. vasoconstriction red. platelet aggregation
PGI3 vasodilatation anti-aggregatory
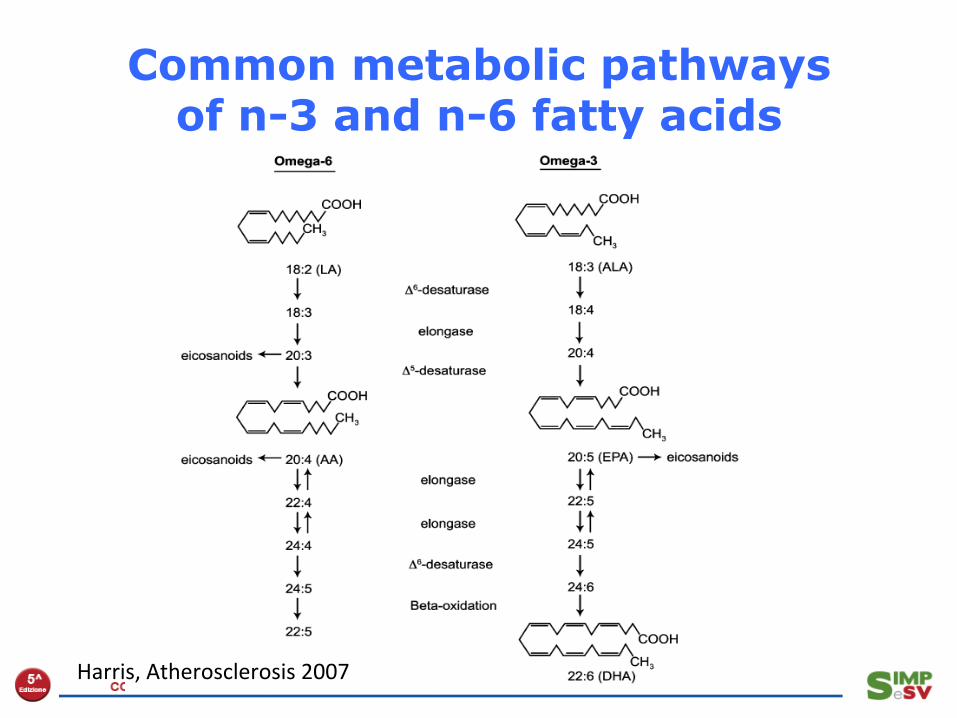
Common metabolic pathways of n-3 and n-6 fatty acids
Harris, Atherosclerosis 2007

Johnson GH et al, J Acad Nutr Diet, 2012
Effect of Dietary Linoleic Acid on Markers ofInflammation in Healthy Persons: A SystematicReview of Randomized Controlled TrialsGuy H. Johnson, PhD; Kevin Fritsche, PhD
THE EFFECTS OF DIETARY LIPIDS ON CARDIOVASCULARdisease (CVD) and other chronic health conditions havelong been an important consideration in thedevelopment of dietary guidelines in the United States
and other countries. The 2010 Dietary Guidelines for Ameri-cans1 recommend that monounsaturated and polyunsatu-rated (PUFA) fats be substituted for saturated fats in diets.There is currently much consistency among recommenda-tions from government and professional organizations thatboth n-6 and n-3 classes of PUFAs are desirable, and that lino-leic acid (LA) as well as !-linolenic acid (ALA) consumptionshould be encouraged as a replacement for SFAs, trans-fattyacids, and (in some cases) refined carbohydrates. For exam-
ple, a recent American Heart Association Science Advisory2
recommended that n-6 PUFAs comprise at least 5% to 10% oftotal energy. The recommended intake for n-6 PUFA (primar-ily LA) in the United States according to the National Heart,Lung, and Blood Institute of the National Institutes of Health3;the Institute of Medicine4; and the 2005 Dietary Guidelinesfor Americans5 ranges from 5% to 10% of energy. Similarly, acurrent Position Statement from the Academy of Nutritionand Dietetics (formerly the American Dietetic Association)and Dietitians of Canada6 noted that intakes for n-6 PUFAshould range from 3% to 10% of energy.Despite the consistency of favorable recommendations re-
garding dietary LA, the possibility that this fatty acid contrib-utes to excess inflammation has received considerable atten-tion. The primary basis of concern is that large amounts of LAwill prompt excessive formation of arachidonic acid (AA) andsubsequent synthesis of pro-inflammatory eicosanoids (eg,prostaglandin E2 [PGE2], leukotriene B4, and thromboxane A2[TXA2]).7-10 Elevated proinflammatory eicosanoid generationcould drive up other biomarkers of inflammation (eg, inter-leukin-6 [IL-6], tumor necrosis factor-! [TNF-!], and C-reac-
ABSTRACTThe majority of evidence suggests that n-6 polyunsaturated fatty acids, including lino-leic acid (LA), reduce the risk of cardiovascular disease as reflected by current dietaryrecommendations. However, concern has been expressed that a high intake of dietaryn-6 polyunsaturated fatty acid contributes to excess chronic inflammation, primarily byprompting the synthesis of proinflammatory eicosanoids derived from arachidonic acidand/or inhibiting the synthesis of anti-inflammatory eicosanoids fromeicosapentaenoicand/or docosahexaenoic acids. A systematic review of randomized controlled trials thatpermitted the assessment of dietary LA on biologic markers of chronic inflammationamong healthy noninfant populations was conducted to examine this concern. A searchof the English- and non–English-language literature usingMEDLINE, the Cochrane Con-trolled Trials Register, and EMBASE was conducted to identify relevant articles. Fifteenstudies (eight parallel and seven crossover) met inclusion criteria. None of the studiesreported significant findings for a wide variety of inflammatory markers, including C-reactive protein, fibrinogen, plasminogen activator inhibitor type 1, cytokines, solublevascular adhesion molecules, or tumor necrosis factor-!. The only significant outcomemeasures reported for higher LA intakes were greater excretion of prostaglandin E2 andlower excretion of 2,3-dinor-thromboxane B2 in one study and higher excretion of tet-ranorprostanedioic acid in another. However, the authors of those studies both observedthat these effects were not an indication of increased inflammation. We conclude thatvirtually no evidence is available from randomized, controlled intervention studiesamonghealthy, noninfant humanbeings to show that addition of LA to the diet increasesthe concentration of inflammatory markers.J Acad Nutr Diet. 2012;112:1029-1041.
ARTICLE INFORMATION
Article history:Accepted 23 March 2012
Keywords:Linoleic acidn-6 fatty acidsInflammationC-reactive protein
Copyright © 2012 by the Academy of Nutritionand Dietetics.2212-2672/$36.00doi: 10.1016/j.jand.2012.03.029
Meets Learning Need Codes 4000, 5000, 5160, 9000, and 9020. To take theContinuing Professional Education quiz for this article, log in towww.eatright.org, click the “MyProfile” link under your name at the top of thehomepage, select “Journal Quiz” from the menu on your myAcademy page,click “Journal Article Quiz” on the next page, and then click the “AdditionalJournal CPE Articles” button to view a list of available quizzes, from whichyou may select the quiz for this article.
RESEARCHReview
© 2012 by the Academy of Nutrition and Dietetics. JOURNAL OF THE ACADEMY OF NUTRITION AND DIETETICS 1029
1394 pubblicazioni ! 15 lavori selezionati

Johnson GH et al, J Acad Nutr Diet, 2012
We conclude that virtually no evidence is available from randomized, controlled intervention studies
among healthy, noninfant human beings to show that addition of LA to the diet
increases the concentration of inflammatory markers.
Effect of Dietary Linoleic Acid on Markers ofInflammation in Healthy Persons: A SystematicReview of Randomized Controlled TrialsGuy H. Johnson, PhD; Kevin Fritsche, PhD
THE EFFECTS OF DIETARY LIPIDS ON CARDIOVASCULARdisease (CVD) and other chronic health conditions havelong been an important consideration in thedevelopment of dietary guidelines in the United States
and other countries. The 2010 Dietary Guidelines for Ameri-cans1 recommend that monounsaturated and polyunsatu-rated (PUFA) fats be substituted for saturated fats in diets.There is currently much consistency among recommenda-tions from government and professional organizations thatboth n-6 and n-3 classes of PUFAs are desirable, and that lino-leic acid (LA) as well as !-linolenic acid (ALA) consumptionshould be encouraged as a replacement for SFAs, trans-fattyacids, and (in some cases) refined carbohydrates. For exam-
ple, a recent American Heart Association Science Advisory2
recommended that n-6 PUFAs comprise at least 5% to 10% oftotal energy. The recommended intake for n-6 PUFA (primar-ily LA) in the United States according to the National Heart,Lung, and Blood Institute of the National Institutes of Health3;the Institute of Medicine4; and the 2005 Dietary Guidelinesfor Americans5 ranges from 5% to 10% of energy. Similarly, acurrent Position Statement from the Academy of Nutritionand Dietetics (formerly the American Dietetic Association)and Dietitians of Canada6 noted that intakes for n-6 PUFAshould range from 3% to 10% of energy.Despite the consistency of favorable recommendations re-
garding dietary LA, the possibility that this fatty acid contrib-utes to excess inflammation has received considerable atten-tion. The primary basis of concern is that large amounts of LAwill prompt excessive formation of arachidonic acid (AA) andsubsequent synthesis of pro-inflammatory eicosanoids (eg,prostaglandin E2 [PGE2], leukotriene B4, and thromboxane A2[TXA2]).7-10 Elevated proinflammatory eicosanoid generationcould drive up other biomarkers of inflammation (eg, inter-leukin-6 [IL-6], tumor necrosis factor-! [TNF-!], and C-reac-
ABSTRACTThe majority of evidence suggests that n-6 polyunsaturated fatty acids, including lino-leic acid (LA), reduce the risk of cardiovascular disease as reflected by current dietaryrecommendations. However, concern has been expressed that a high intake of dietaryn-6 polyunsaturated fatty acid contributes to excess chronic inflammation, primarily byprompting the synthesis of proinflammatory eicosanoids derived from arachidonic acidand/or inhibiting the synthesis of anti-inflammatory eicosanoids fromeicosapentaenoicand/or docosahexaenoic acids. A systematic review of randomized controlled trials thatpermitted the assessment of dietary LA on biologic markers of chronic inflammationamong healthy noninfant populations was conducted to examine this concern. A searchof the English- and non–English-language literature usingMEDLINE, the Cochrane Con-trolled Trials Register, and EMBASE was conducted to identify relevant articles. Fifteenstudies (eight parallel and seven crossover) met inclusion criteria. None of the studiesreported significant findings for a wide variety of inflammatory markers, including C-reactive protein, fibrinogen, plasminogen activator inhibitor type 1, cytokines, solublevascular adhesion molecules, or tumor necrosis factor-!. The only significant outcomemeasures reported for higher LA intakes were greater excretion of prostaglandin E2 andlower excretion of 2,3-dinor-thromboxane B2 in one study and higher excretion of tet-ranorprostanedioic acid in another. However, the authors of those studies both observedthat these effects were not an indication of increased inflammation. We conclude thatvirtually no evidence is available from randomized, controlled intervention studiesamonghealthy, noninfant humanbeings to show that addition of LA to the diet increasesthe concentration of inflammatory markers.J Acad Nutr Diet. 2012;112:1029-1041.
ARTICLE INFORMATION
Article history:Accepted 23 March 2012
Keywords:Linoleic acidn-6 fatty acidsInflammationC-reactive protein
Copyright © 2012 by the Academy of Nutritionand Dietetics.2212-2672/$36.00doi: 10.1016/j.jand.2012.03.029
Meets Learning Need Codes 4000, 5000, 5160, 9000, and 9020. To take theContinuing Professional Education quiz for this article, log in towww.eatright.org, click the “MyProfile” link under your name at the top of thehomepage, select “Journal Quiz” from the menu on your myAcademy page,click “Journal Article Quiz” on the next page, and then click the “AdditionalJournal CPE Articles” button to view a list of available quizzes, from whichyou may select the quiz for this article.
RESEARCHReview
© 2012 by the Academy of Nutrition and Dietetics. JOURNAL OF THE ACADEMY OF NUTRITION AND DIETETICS 1029
1394 pubblicazioni ! 15 lavori selezionati
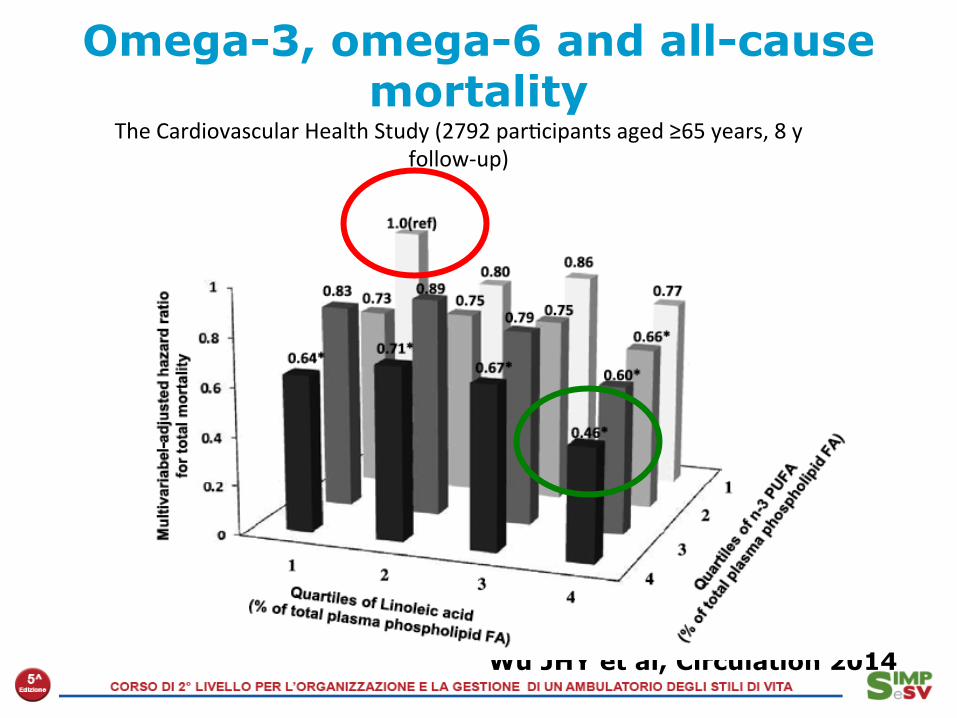
Omega-3, omega-6 and all-cause mortality
Wu JHY et al, Circulation 2014
The Cardiovascular Health Study (2792 par2cipants aged ≥65 years, 8 y follow-‐up)

Ferrucci L et al, J Clin Endocrinol Metab 2006
Plasma Polyunsaturated Fatty Acids and Circulating Inflammatory Markers in 1.123 free living subjects aged 20-98 (InCHIANTI study)
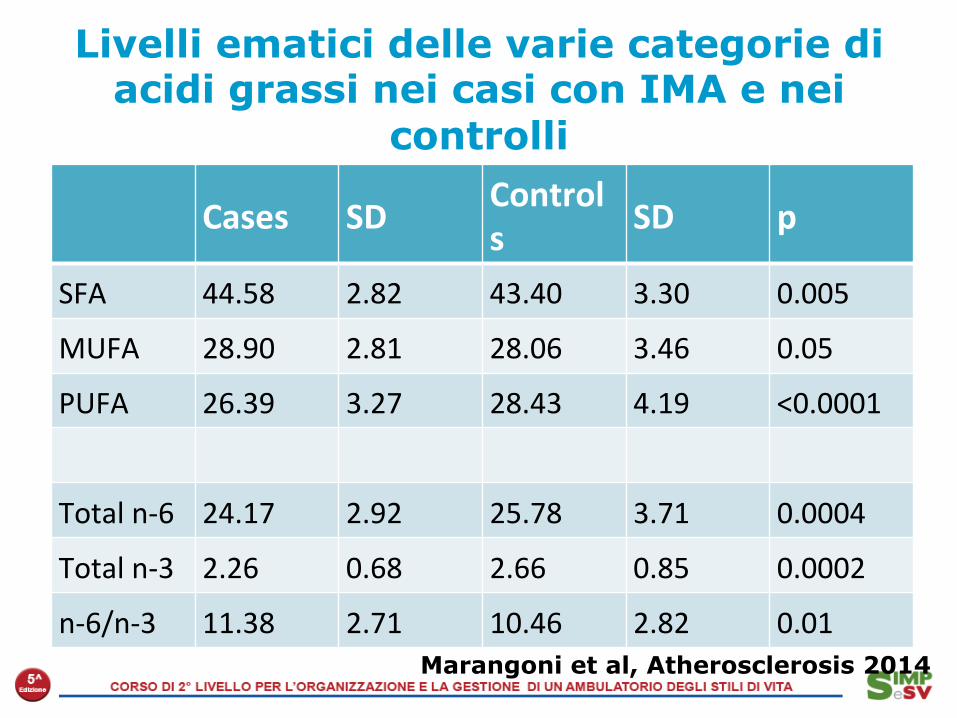
Livelli ematici delle varie categorie di acidi grassi nei casi con IMA e nei
controlli
Cases SD Controls SD p
SFA 44.58 2.82 43.40 3.30 0.005
MUFA 28.90 2.81 28.06 3.46 0.05
PUFA 26.39 3.27 28.43 4.19 <0.0001
Total n-‐6 24.17 2.92 25.78 3.71 0.0004
Total n-‐3 2.26 0.68 2.66 0.85 0.0002
n-‐6/n-‐3 11.38 2.71 10.46 2.82 0.01 Marangoni et al, Atherosclerosis 2014
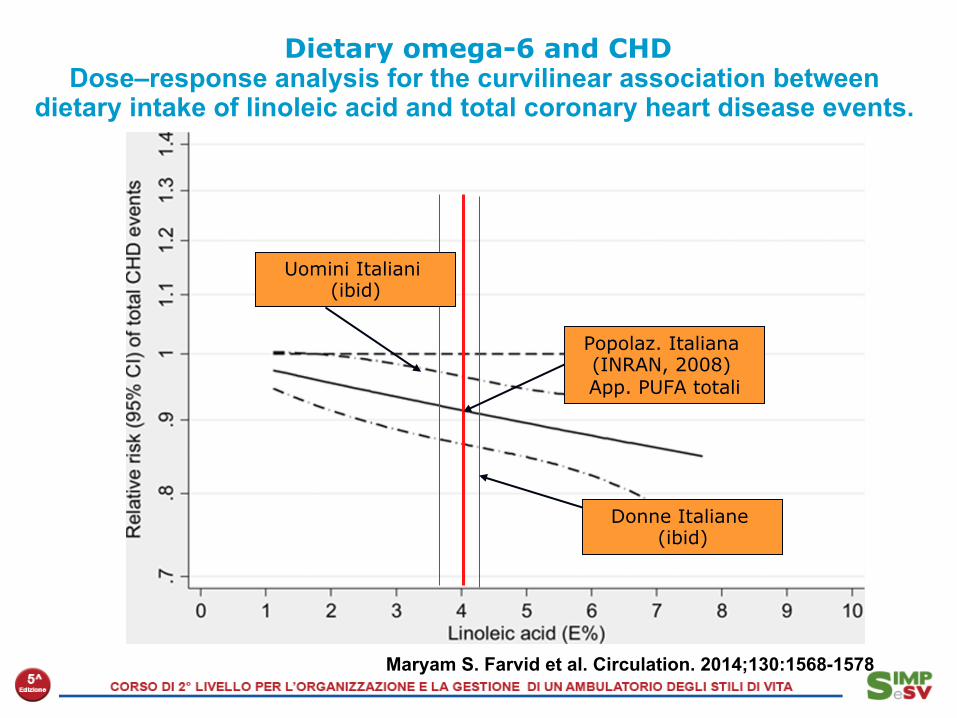
Dietary omega-6 and CHD Dose–response analysis for the curvilinear association between
dietary intake of linoleic acid and total coronary heart disease events.
Maryam S. Farvid et al. Circulation. 2014;130:1568-1578
Popolaz. Italiana (INRAN, 2008) App. PUFA totali
Donne Italiane (ibid)
Uomini Italiani (ibid)

Wu JHY et al, Circulation 2014
Circulating omega-6 polyunsaturated fatty acids and total and cause-specific mortality: the
Cardiovascular Health Study
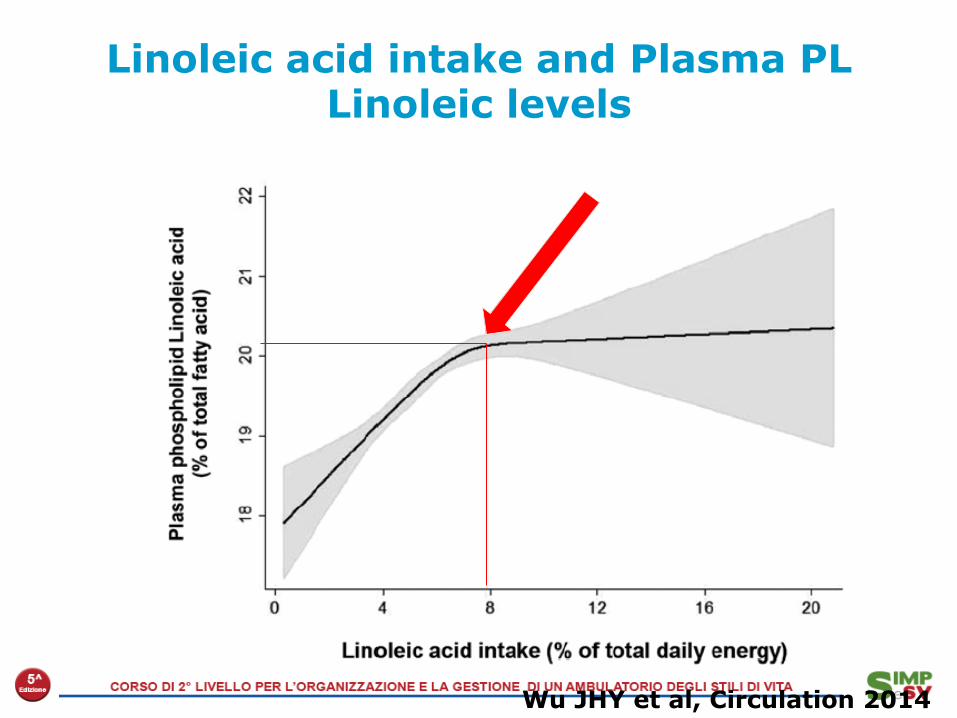
Linoleic acid intake and Plasma PL Linoleic levels
Wu JHY et al, Circulation 2014
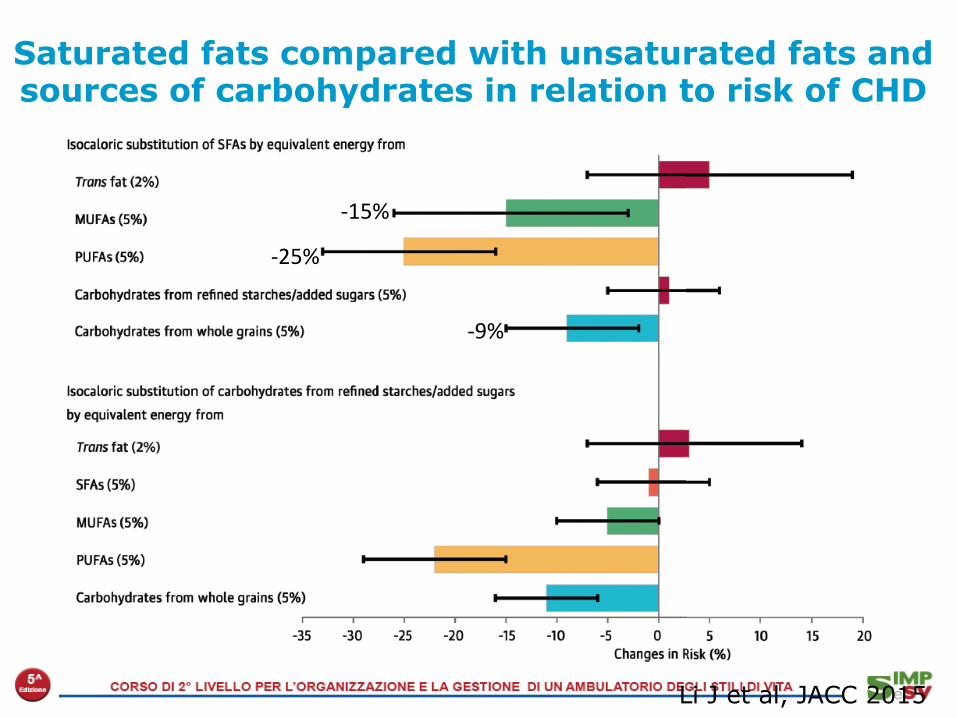
Saturated fats compared with unsaturated fats and sources of carbohydrates in relation to risk of CHD
Li J et al, JACC 2015
-‐25%
-‐15%
-‐9%
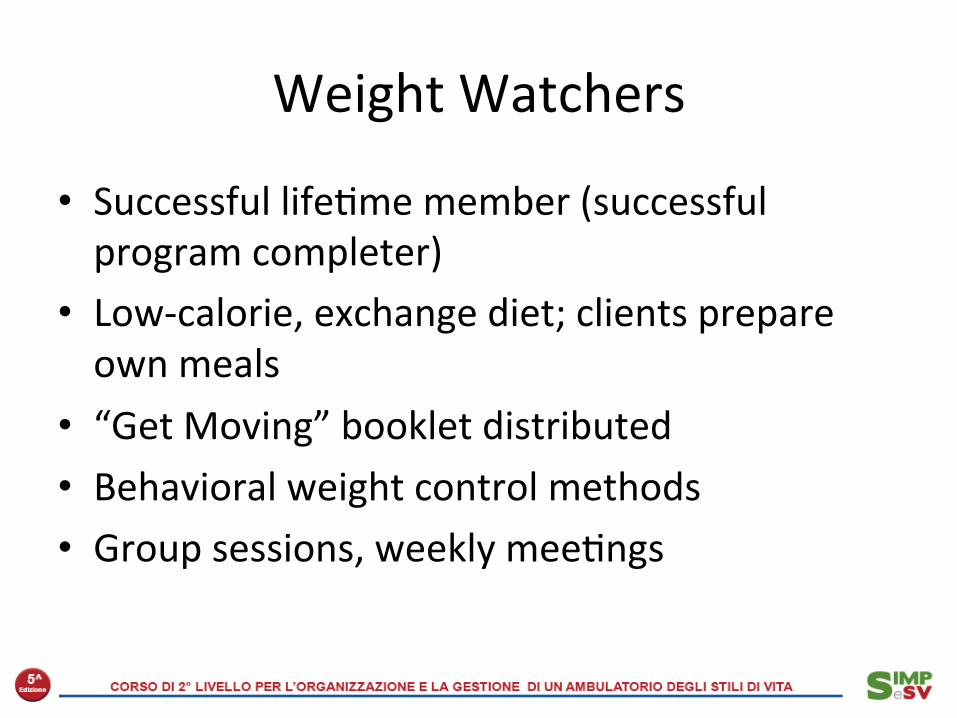
Weight Watchers
• Successful life2me member (successful program completer)
• Low-‐calorie, exchange diet; clients prepare own meals
• “Get Moving” booklet distributed • Behavioral weight control methods • Group sessions, weekly mee2ngs

Method: Data was obtained from the WW NHS Referral Scheme database for 29,326 referral courses started awer 2nd April 2007 and ending before 6th October 2009 [90% female; median age 49 years (IQR 38 -‐ 61 years); median BMI 35.1 kg/m2 (IQR 31.8 -‐ 39.5 kg/m2 . Par2cipants received vouchers (funded by the PCT following referral by a healthcare professional) to ajend 12 WW mee2ngs. Body weight was measured at WW mee2ngs and relayed to the central database. Results: Median weight change for all referrals was -‐2.8 kg [IQR -‐5.9 -‐ -‐0.7 kg] represen2ng -‐3.1% ini2al weight. 33% of all courses resulted in loss of ≥5% ini2al weight. 54% of courses were completed. Median weight change for those comple2ng a first course was -‐5.4 kg [IQR -‐7.8 -‐ -‐3.1 kg] or -‐5.6% of ini2al weight. 57% lost ≥5% ini2al weight. Conclusions: A third of all pa2ents who were referred to WW through the WW NHS Referral Scheme and started a 12 session course achieved ≥5% weight loss, which is usually associated with clinical benefits.
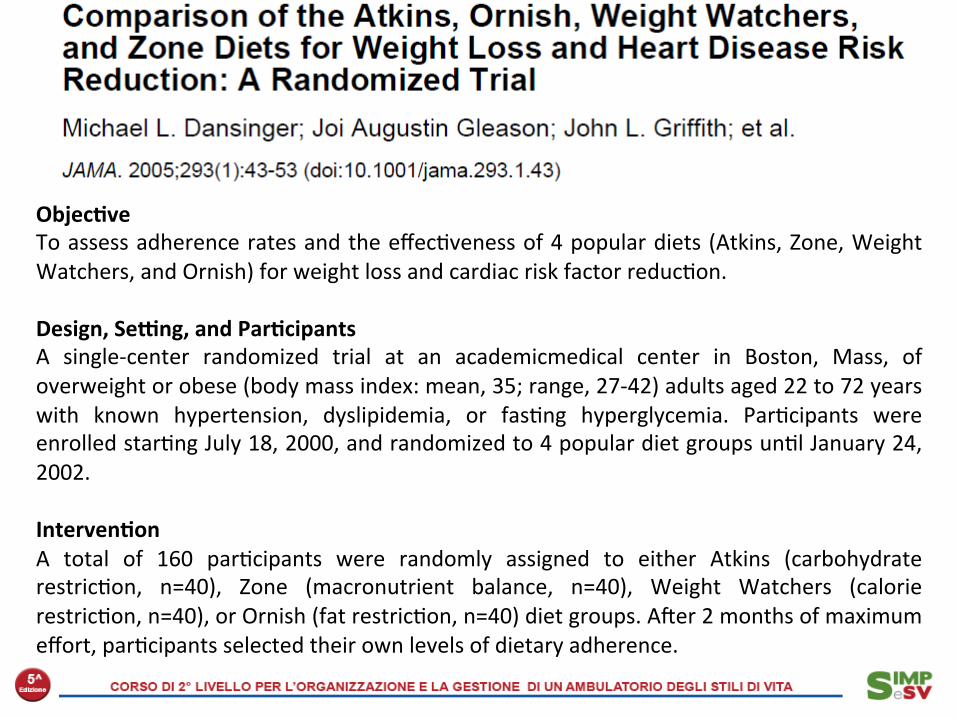
Objec<ve To assess adherence rates and the effec2veness of 4 popular diets (Atkins, Zone, Weight Watchers, and Ornish) for weight loss and cardiac risk factor reduc2on. Design, Sehng, and Par<cipants A single-‐center randomized trial at an academicmedical center in Boston, Mass, of overweight or obese (body mass index: mean, 35; range, 27-‐42) adults aged 22 to 72 years with known hypertension, dyslipidemia, or fas2ng hyperglycemia. Par2cipants were enrolled star2ng July 18, 2000, and randomized to 4 popular diet groups un2l January 24, 2002. Interven<on A total of 160 par2cipants were randomly assigned to either Atkins (carbohydrate restric2on, n=40), Zone (macronutrient balance, n=40), Weight Watchers (calorie restric2on, n=40), or Ornish (fat restric2on, n=40) diet groups. Awer 2 months of maximum effort, par2cipants selected their own levels of dietary adherence.
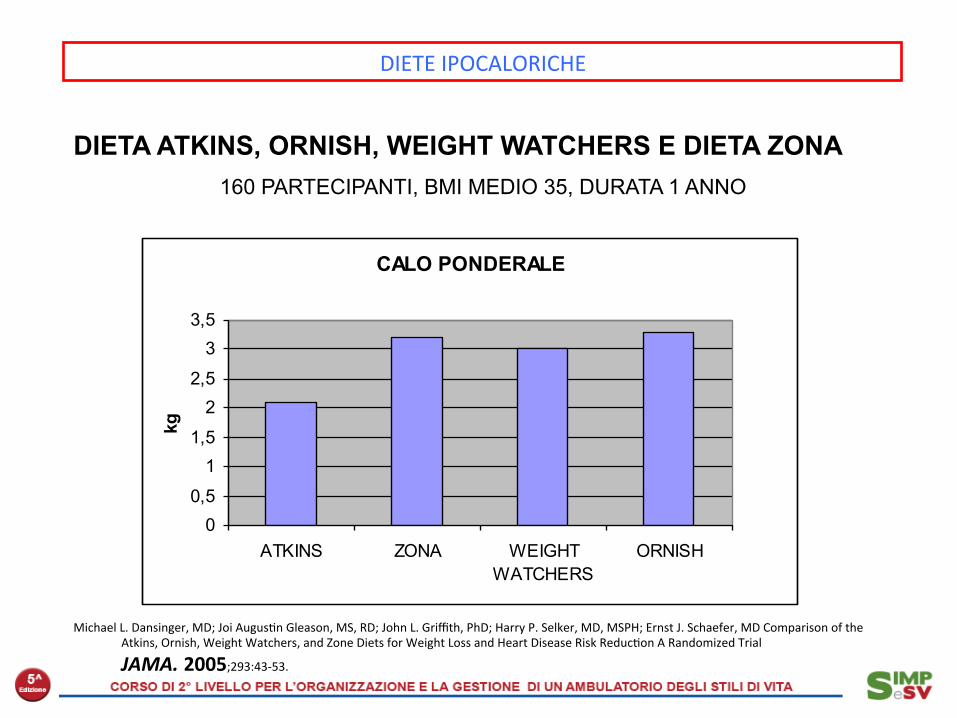
DIETA ATKINS, ORNISH, WEIGHT WATCHERS E DIETA ZONA 160 PARTECIPANTI, BMI MEDIO 35, DURATA 1 ANNO
Michael L. Dansinger, MD; Joi Augus2n Gleason, MS, RD; John L. Griffith, PhD; Harry P. Selker, MD, MSPH; Ernst J. Schaefer, MD Comparison of the Atkins, Ornish, Weight Watchers, and Zone Diets for Weight Loss and Heart Disease Risk Reduc2on A Randomized Trial
JAMA. 2005;293:43-‐53.
DIETE IPOCALORICHE
CALO PONDERALE
00,5
11,5
22,5
33,5
ATKINS ZONA WEIGHTWATCHERS
ORNISH
kg

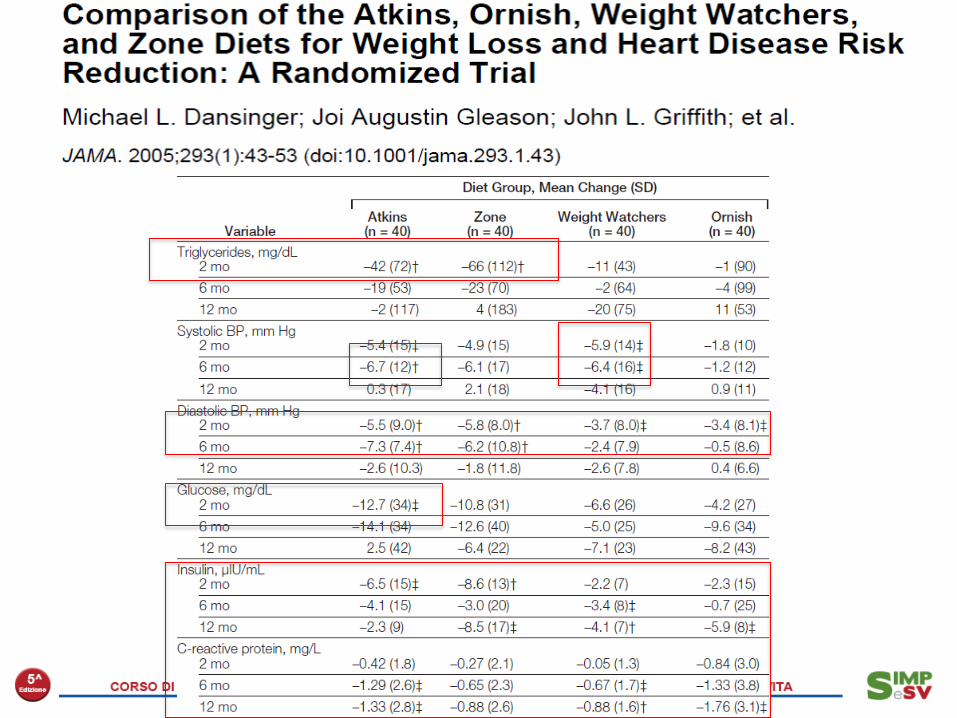
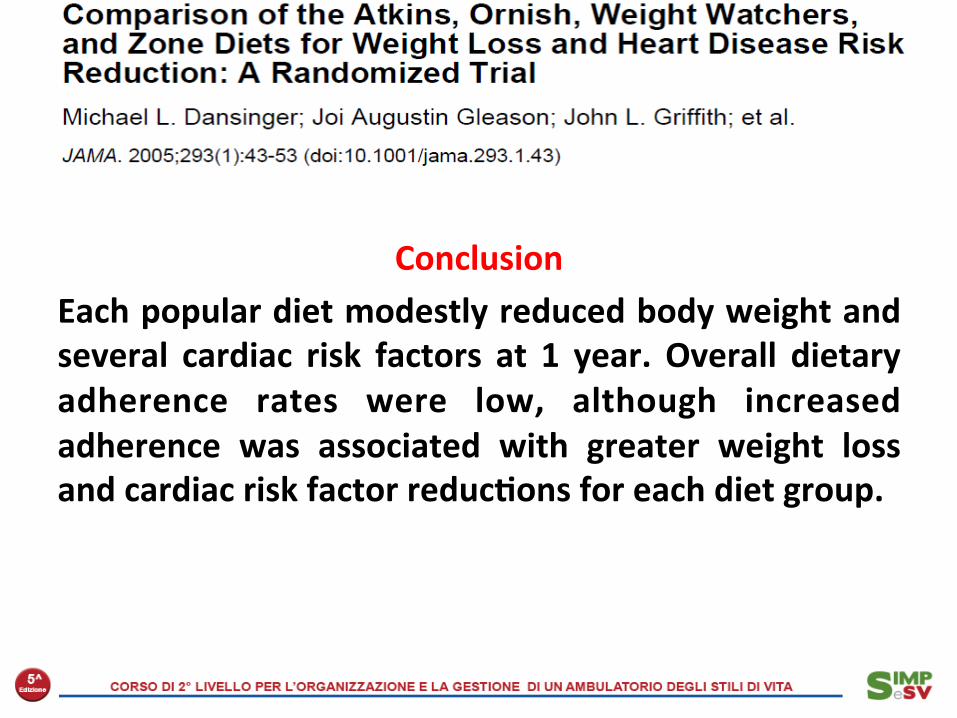
Conclusion Each popular diet modestly reduced body weight and several cardiac risk factors at 1 year. Overall dietary adherence rates were low, although increased adherence was associated with greater weight loss and cardiac risk factor reduc<ons for each diet group.
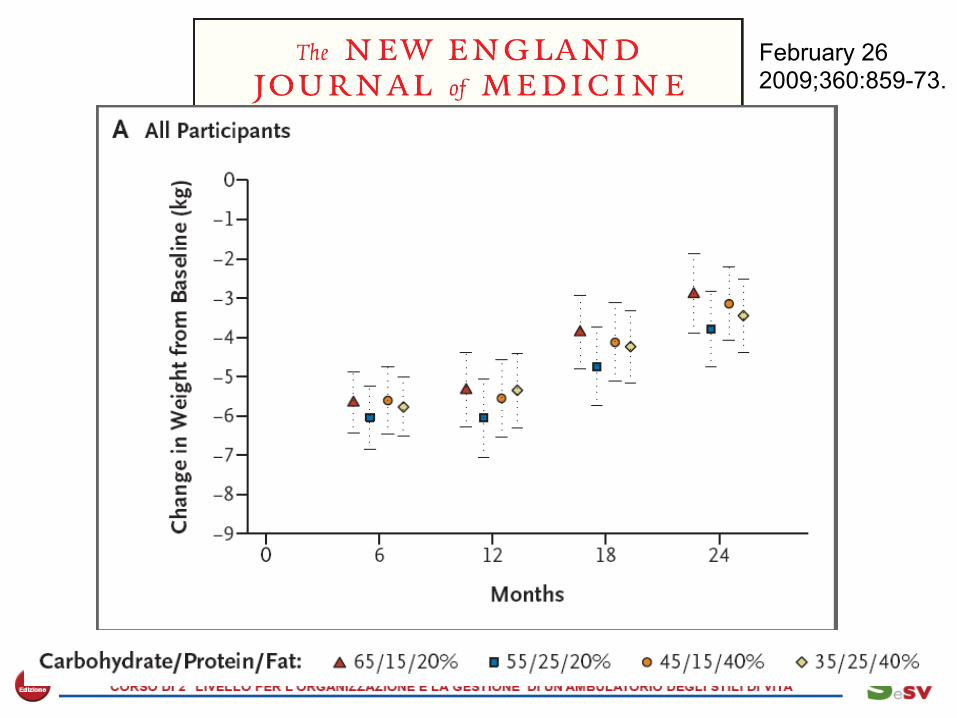
February 26 2009;360:859-73.

AHA Protein Criteria Atkins29 Zone30 Protein Power31 Sugar Busters32 S2llman28 Total protein is not excessive (average 50–100 g/d, propor2onal 15–20% kcal/day to carbohydrates and fat)
No. No. No. No. No.
1st 2 weeks = 125 g/d (36%)
127 g/d (34%) 91 g/d (26%) 71 g/d (27%) 162 g/d (64%)
Ongoing weight loss = 161 g/d (35%) Maintenance = 110 g/d (24%)
Carbohydrates are not omijed or severely restricted. Minimum of 100 g/d
No. Yes. No. Yes. No.
1st 2 weeks = 28 g/d (5%)
135 g/d (36%) 56 g/d (16%) 114 g/d (52%) 7 g/d (3%)
Ongoing weight loss = 33 g/d Maintenance = Yes 128 g/d
Total fat (30%) and saturated fat (10%) are not excessive
No. Yes. No. Yes. No.
1st 2 weeks = 53% fat, 26% saturated fat per day
29% total calories, 4% saturated fat per day
54% total fat, 18% saturated fat per day
21% total calories, 4% saturated fat per day
33% total calories, 13% saturated fat per day
Total diet can be safely implemented over the long term by providing nutrient adequacy and support a healthful ea2ng plan to prevent increases in disease risk
No. No. No. No. No.
Limited food choices. Diet low in fiber, vitamin D, thiamine, pantothenic acid, copper, magnesium, manganese, potassium, calcium.*High in total fat and saturated fat
Food must be eaten in required propor2ons of protein, fat, carbohydrates. Menus not appealing, vegetable por2ons very large. Low in copper*
Not prac2cal for long term. Rigid rules. Diet low in calcium, fiber, pantothenic acid, copper, manganese.*High in total fat and saturated fat
Eliminates many carbohydrate foods. Discourages ea2ng fruit with meals. Low in calcium, vitamin D, vitamin E, pantothenic acid, copper, potassium*
Eliminates many foods. Diet low in fiber, vitamin A, thiamine, vitamin C, vitamin D, folate, pantothenic acid, calcium, copper, magnesium, manganese, potassium*
AHA Science Advisory, Circula2on 2001
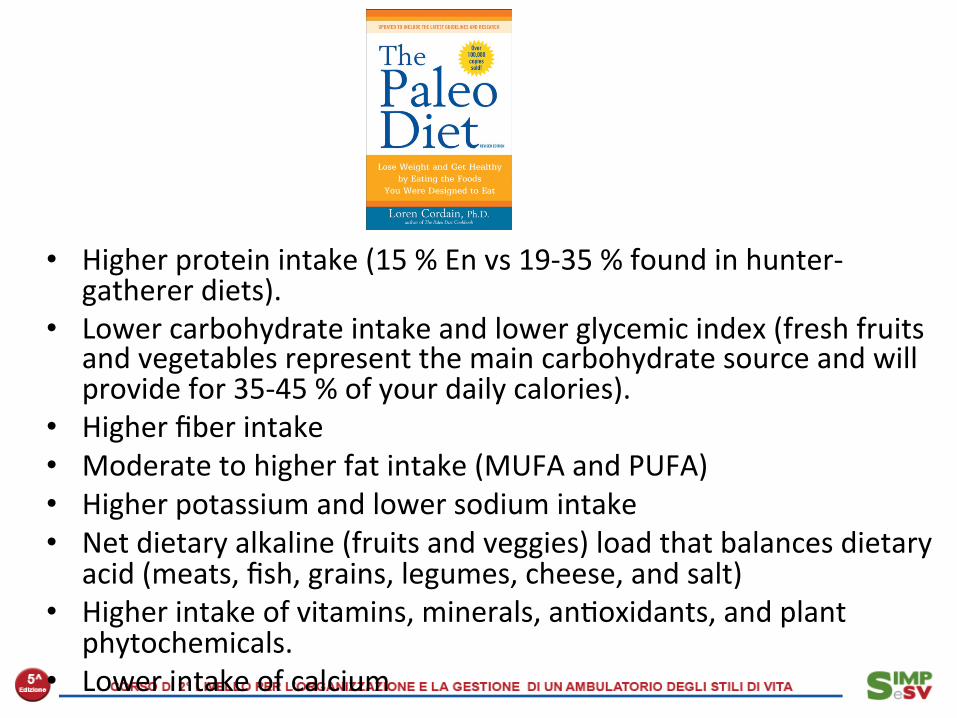
• Higher protein intake (15 % En vs 19-‐35 % found in hunter-‐gatherer diets).
• Lower carbohydrate intake and lower glycemic index (fresh fruits and vegetables represent the main carbohydrate source and will provide for 35-‐45 % of your daily calories).
• Higher fiber intake • Moderate to higher fat intake (MUFA and PUFA) • Higher potassium and lower sodium intake • Net dietary alkaline (fruits and veggies) load that balances dietary
acid (meats, fish, grains, legumes, cheese, and salt) • Higher intake of vitamins, minerals, an2oxidants, and plant
phytochemicals. • Lower intake of calcium
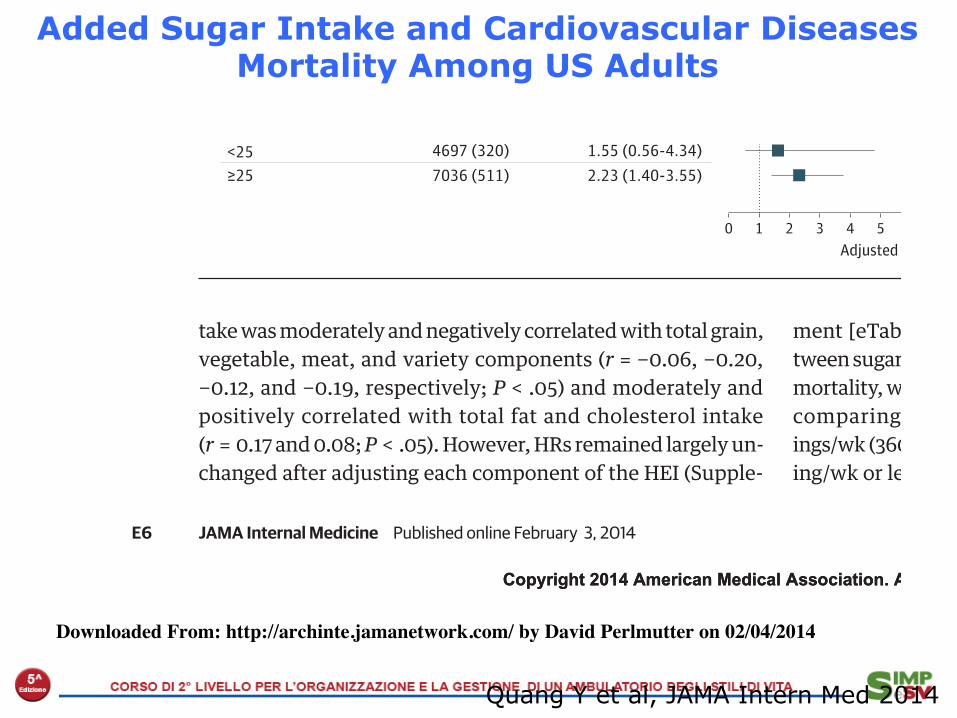
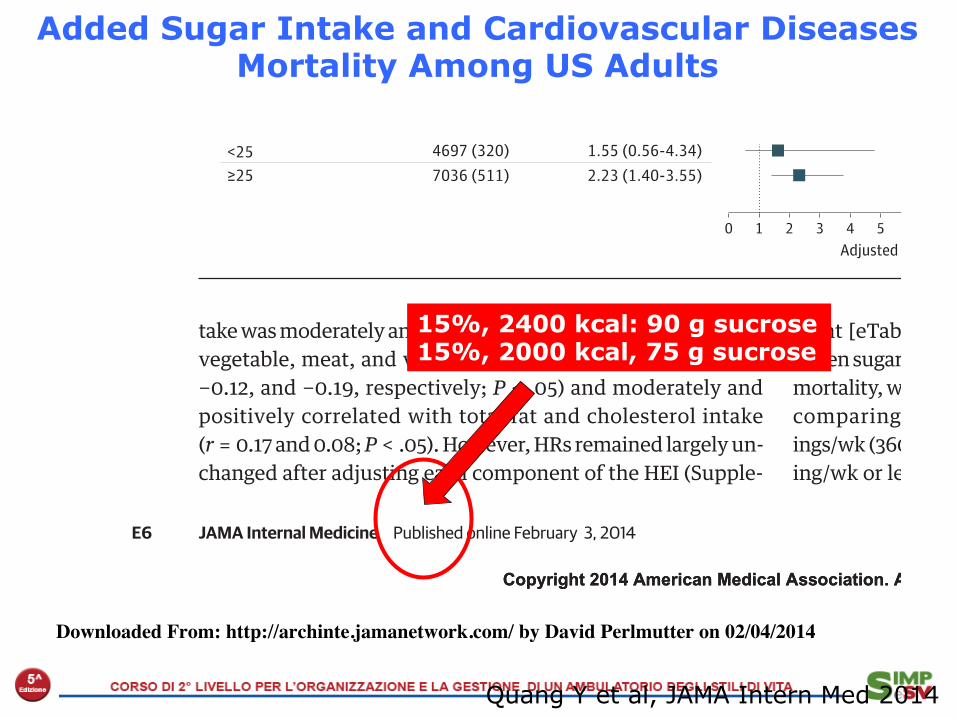
Added Sugar Intake and Cardiovascular Diseases Mortality Among US Adults
Quang Y et al, JAMA Intern Med 2014
Copyright 2014 American Medical Association. All rights reserved.
take was moderately and negatively correlated with total grain,vegetable, meat, and variety components (r = −0.06, −0.20,−0.12, and −0.19, respectively; P < .05) and moderately andpositively correlated with total fat and cholesterol intake(r = 0.17 and 0.08; P < .05). However, HRs remained largely un-changed after adjusting each component of the HEI (Supple-
ment [eTable 6]). We observed a significant association be-tween sugar-sweetened beverage consumption and risk of CVDmortality, with an adjusted HR of 1.29 (95% CI, 1.04-1.60) whencomparing participants who consumed 7 or more serv-ings/wk (360 mL per serving) with those who consumed 1 serv-ing/wk or less (Supplement [eTable 7]).
Figure 1. Adjusted Hazard Ratio (HR) of the Usual Percentage of Calories From Added Sugarfor Cardiovascular Disease Mortality Among US Adults 20 Years or Older: National Health and NutritionExamination Survey Linked Mortality Files, 1988-2006
9
8
5
6
7
4
2
3
1
7
6
5
4
3
2
1
02 3 4 5 6 7 8 9 10 11 12 13 14 15 16 17 18 19 20 21 22 23 24 25 26 27 28 29 30 31 32
0
Usual Percentage of Calories From Added Sugar, %
Perc
enta
ge D
istrib
utio
n, %
Adjusted HR
Histogram of the distribution of usualpercentage of calories from addedsugar in the population. Lines showthe adjusted HRs from Cox models.Midvalue of quintile 1 (7.4%) was thereference standard. The model wasadjusted for age, sex, race/ethnicity,educational attainment, smokingstatus, alcohol consumption, physicalactivity level, family history ofcardiovascular disease,antihypertensive medication use,Healthy Eating Index score, bodymass index, systolic blood pressure,total serum cholesterol, and totalcalories. Solid line indicates pointestimates; dashed lines indicate95% CIs.
Figure 2. Adjusted Hazard Ratio (HR) of Cardiovascular Disease Mortality Comparing Quintile 5 With Quintile 1of Usual Percentage of Calories From Added Sugar by Selected Characteristics Among US Adults 20 Yearsor Older: National Health and Nutrition Examination Survey Linked Mortality Files, 1988-2006
SubgroupNo. of Participants
(Deaths)Adjusted HR
(95% CI)
≥60 2898 (687) 1.83 (1.01-3.31)
Race/ethnicityNon-Hispanic white 4802 (494) 2.67 (1.48-4.80)Non-Hispanic black 3233 (187) 0.71 (0.44-1.15)Mexican American 3217 (134) 1.76 (0.49-6.39)
0 5 103 7Adjusted HR
1 64 8 92
Age, y8835 (144) 1.67 (0.78-3.58)<60
Female 6094 (397) 2.95 (1.48-5.91)
Sex5639 (434) 1.34 (0.60-3.00)Male
≥12 7415 (376) 1.67 (0.67-4.18)
Education, y4318 (455) 2.29 (1.49-3.50)<12
<Top 50% 6060 (374) 1.80 (1.05-3.07)
Healthy Eating Index5673 (457) 2.96 (1.15-7.63)≥Top 50%
Low 7326 (544) 1.54 (0.93-2.53)
Physical activity4407 (287) 2.12 (0.63-7.18)High
≥25 7036 (511) 2.23 (1.40-3.55)
Body mass index4697 (320) 1.55 (0.56-4.34)<25
For the Healthy Eating Index score,the top 50% or higher included theparticipants with a score of 63.5 ormore; high physical activity includedthe participants who had moderateintensity to vigorous activities 5 ormore times per week. Limit linesindicate 95% CI. Body mass index iscalculated as weight in kilogramsdivided by height in meters squared.
Research Original Investigation Sugar Intake and Cardiovascular Diseases Mortality
E6 JAMA Internal Medicine Published online February 3, 2014 jamainternalmedicine.com
Copyright 2014 American Medical Association. All rights reserved.
Downloaded From: http://archinte.jamanetwork.com/ by David Perlmutter on 02/04/2014
15%, 2400 kcal: 90 g sucrose 15%, 2000 kcal, 75 g sucrose

Adul2 am
ericani obe
si
Consum
o giornaliero di zuccheri (g)
Consumo di zuccheri negli Sta< Uni< e prevalenza di obesità (1980-‐2013)
Italia: Studio LIZ 2016** 66 g di zuccheri totali
obesità
zuccheri

Added Sugar Intake and Cardiovascular Diseases Mortality Among US Adults
Quang Y et al, JAMA Intern Med 2014
Copyright 2014 American Medical Association. All rights reserved.
take was moderately and negatively correlated with total grain,vegetable, meat, and variety components (r = −0.06, −0.20,−0.12, and −0.19, respectively; P < .05) and moderately andpositively correlated with total fat and cholesterol intake(r = 0.17 and 0.08; P < .05). However, HRs remained largely un-changed after adjusting each component of the HEI (Supple-
ment [eTable 6]). We observed a significant association be-tween sugar-sweetened beverage consumption and risk of CVDmortality, with an adjusted HR of 1.29 (95% CI, 1.04-1.60) whencomparing participants who consumed 7 or more serv-ings/wk (360 mL per serving) with those who consumed 1 serv-ing/wk or less (Supplement [eTable 7]).
Figure 1. Adjusted Hazard Ratio (HR) of the Usual Percentage of Calories From Added Sugarfor Cardiovascular Disease Mortality Among US Adults 20 Years or Older: National Health and NutritionExamination Survey Linked Mortality Files, 1988-2006
9
8
5
6
7
4
2
3
1
7
6
5
4
3
2
1
02 3 4 5 6 7 8 9 10 11 12 13 14 15 16 17 18 19 20 21 22 23 24 25 26 27 28 29 30 31 32
0
Usual Percentage of Calories From Added Sugar, %
Perc
enta
ge D
istrib
utio
n, %
Adjusted HR
Histogram of the distribution of usualpercentage of calories from addedsugar in the population. Lines showthe adjusted HRs from Cox models.Midvalue of quintile 1 (7.4%) was thereference standard. The model wasadjusted for age, sex, race/ethnicity,educational attainment, smokingstatus, alcohol consumption, physicalactivity level, family history ofcardiovascular disease,antihypertensive medication use,Healthy Eating Index score, bodymass index, systolic blood pressure,total serum cholesterol, and totalcalories. Solid line indicates pointestimates; dashed lines indicate95% CIs.
Figure 2. Adjusted Hazard Ratio (HR) of Cardiovascular Disease Mortality Comparing Quintile 5 With Quintile 1of Usual Percentage of Calories From Added Sugar by Selected Characteristics Among US Adults 20 Yearsor Older: National Health and Nutrition Examination Survey Linked Mortality Files, 1988-2006
SubgroupNo. of Participants
(Deaths)Adjusted HR
(95% CI)
≥60 2898 (687) 1.83 (1.01-3.31)
Race/ethnicityNon-Hispanic white 4802 (494) 2.67 (1.48-4.80)Non-Hispanic black 3233 (187) 0.71 (0.44-1.15)Mexican American 3217 (134) 1.76 (0.49-6.39)
0 5 103 7Adjusted HR
1 64 8 92
Age, y8835 (144) 1.67 (0.78-3.58)<60
Female 6094 (397) 2.95 (1.48-5.91)
Sex5639 (434) 1.34 (0.60-3.00)Male
≥12 7415 (376) 1.67 (0.67-4.18)
Education, y4318 (455) 2.29 (1.49-3.50)<12
<Top 50% 6060 (374) 1.80 (1.05-3.07)
Healthy Eating Index5673 (457) 2.96 (1.15-7.63)≥Top 50%
Low 7326 (544) 1.54 (0.93-2.53)
Physical activity4407 (287) 2.12 (0.63-7.18)High
≥25 7036 (511) 2.23 (1.40-3.55)
Body mass index4697 (320) 1.55 (0.56-4.34)<25
For the Healthy Eating Index score,the top 50% or higher included theparticipants with a score of 63.5 ormore; high physical activity includedthe participants who had moderateintensity to vigorous activities 5 ormore times per week. Limit linesindicate 95% CI. Body mass index iscalculated as weight in kilogramsdivided by height in meters squared.
Research Original Investigation Sugar Intake and Cardiovascular Diseases Mortality
E6 JAMA Internal Medicine Published online February 3, 2014 jamainternalmedicine.com
Copyright 2014 American Medical Association. All rights reserved.
Downloaded From: http://archinte.jamanetwork.com/ by David Perlmutter on 02/04/2014
6/7%, 35/40 g sucrose


La dieta senza glu2ne • Unica terapia ad oggi della celiachia, è stata adojata anche
da chi vuole perdere peso • Non vi sono evidenze a supporto di tale effejo • Pro
– Limita l’assunzione di carboidra2 e incoraggia il consumo di fruja e verdura
• Contro – Si associa a possibili carenze (fibra, ferro, fola2) – E’ difficile da seguire nel tempo – Prevede l’uso di alimen2 equivalen2 dal punto di vista energe2co a quelli tradizionali ma più costosi
– La diffusione di questo regime alimentare potrebbe contribuire a mascherare diagnosi di celiachia
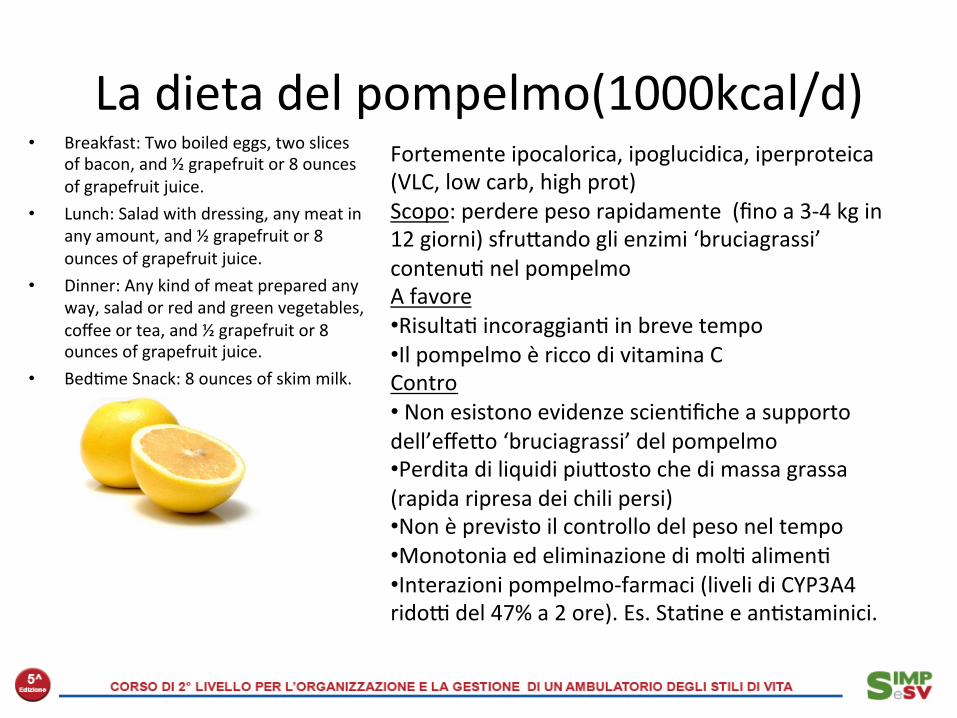
La dieta del pompelmo(1000kcal/d) • Breakfast: Two boiled eggs, two slices
of bacon, and ½ grapefruit or 8 ounces of grapefruit juice.
• Lunch: Salad with dressing, any meat in any amount, and ½ grapefruit or 8 ounces of grapefruit juice.
• Dinner: Any kind of meat prepared any way, salad or red and green vegetables, coffee or tea, and ½ grapefruit or 8 ounces of grapefruit juice.
• Bed2me Snack: 8 ounces of skim milk.
Fortemente ipocalorica, ipoglucidica, iperproteica (VLC, low carb, high prot) Scopo: perdere peso rapidamente (fino a 3-‐4 kg in 12 giorni) sfrujando gli enzimi ‘bruciagrassi’ contenu2 nel pompelmo A favore • Risulta2 incoraggian2 in breve tempo • Il pompelmo è ricco di vitamina C Contro • Non esistono evidenze scien2fiche a supporto dell’effejo ‘bruciagrassi’ del pompelmo • Perdita di liquidi piujosto che di massa grassa (rapida ripresa dei chili persi) • Non è previsto il controllo del peso nel tempo • Monotonia ed eliminazione di mol2 alimen2 • Interazioni pompelmo-‐farmaci (liveli di CYP3A4 rido] del 47% a 2 ore). Es. Sta2ne e an2staminici.
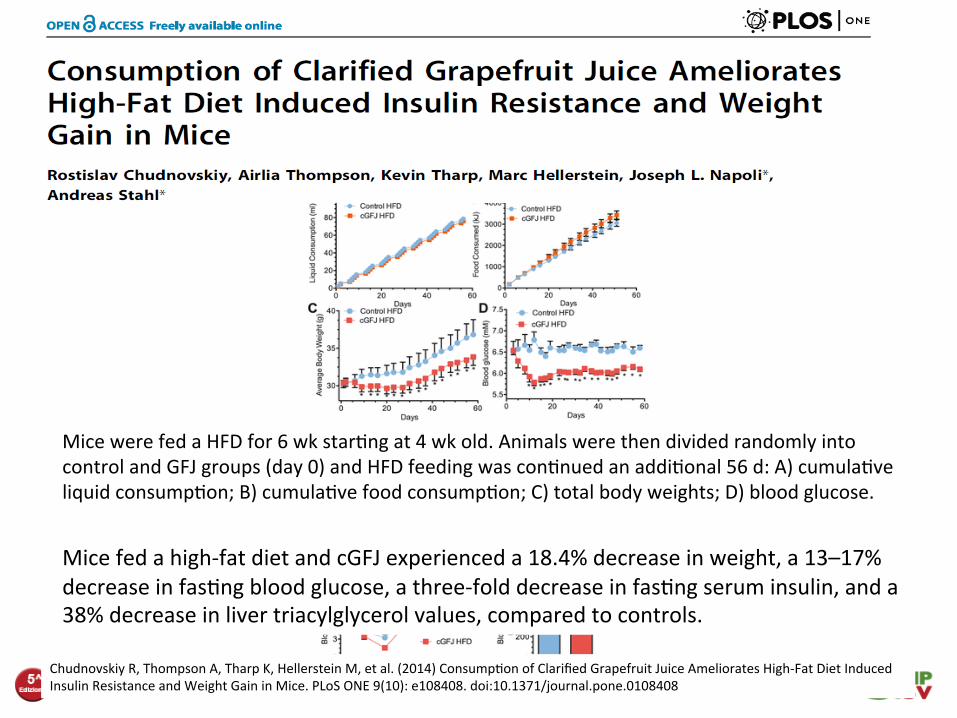
Chudnovskiy R, Thompson A, Tharp K, Hellerstein M, et al. (2014) Consump2on of Clarified Grapefruit Juice Ameliorates High-‐Fat Diet Induced Insulin Resistance and Weight Gain in Mice. PLoS ONE 9(10): e108408. doi:10.1371/journal.pone.0108408
Mice were fed a HFD for 6 wk star2ng at 4 wk old. Animals were then divided randomly into control and GFJ groups (day 0) and HFD feeding was con2nued an addi2onal 56 d: A) cumula2ve liquid consump2on; B) cumula2ve food consump2on; C) total body weights; D) blood glucose.
Mice fed a high-‐fat diet and cGFJ experienced a 18.4% decrease in weight, a 13–17% decrease in fas2ng blood glucose, a three-‐fold decrease in fas2ng serum insulin, and a 38% decrease in liver triacylglycerol values, compared to controls.
Detox diets • Detox diets are marke2ng myth rather than nutri2onal reality. They sound like a great concept and it would be fabulous if they really delivered all that they promised! Unfortunately, many of the claims made by detox diet promoters are exaggerated, not based on robust science and any benefit short lived.
• While they may encourage some posi2ve habits like ea2ng more fruit and vegetables, it’s best to enjoy a healthy, varied diet and ac2ve lifestyle rather than following a detox diet.
© BDA May 2014. Review date May 2016. Version 4.
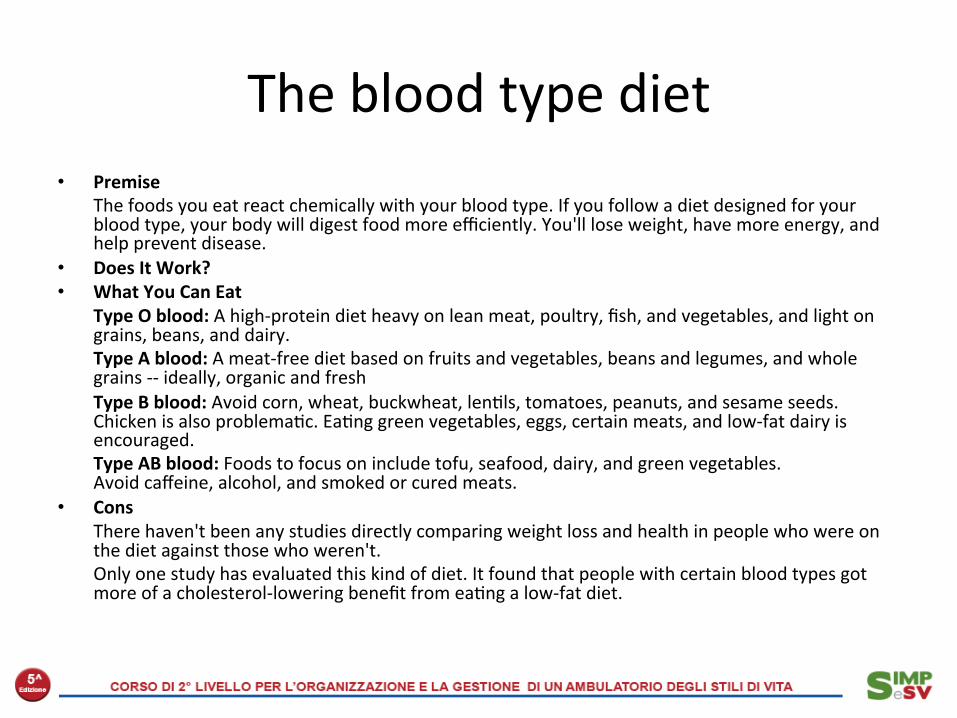
The blood type diet • Premise
The foods you eat react chemically with your blood type. If you follow a diet designed for your blood type, your body will digest food more efficiently. You'll lose weight, have more energy, and help prevent disease.
• Does It Work? • What You Can Eat
Type O blood: A high-‐protein diet heavy on lean meat, poultry, fish, and vegetables, and light on grains, beans, and dairy. Type A blood: A meat-‐free diet based on fruits and vegetables, beans and legumes, and whole grains -‐-‐ ideally, organic and fresh Type B blood: Avoid corn, wheat, buckwheat, len2ls, tomatoes, peanuts, and sesame seeds. Chicken is also problema2c. Ea2ng green vegetables, eggs, certain meats, and low-‐fat dairy is encouraged. Type AB blood: Foods to focus on include tofu, seafood, dairy, and green vegetables. Avoid caffeine, alcohol, and smoked or cured meats.
• Cons There haven't been any studies directly comparing weight loss and health in people who were on the diet against those who weren't. Only one study has evaluated this kind of diet. It found that people with certain blood types got more of a cholesterol-‐lowering benefit from ea2ng a low-‐fat diet.

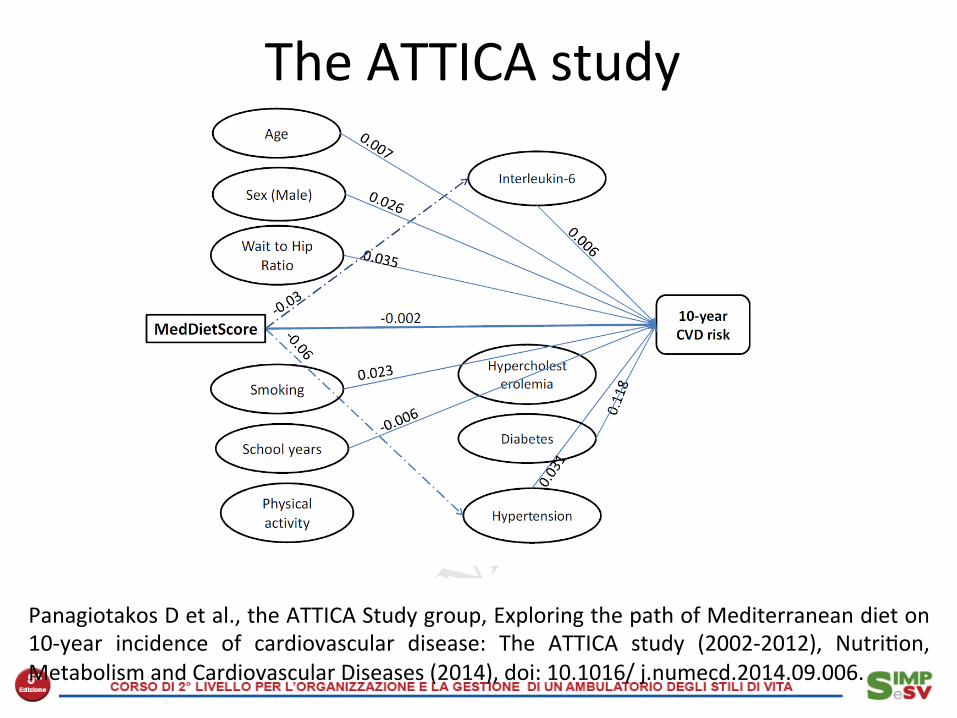
The ATTICA study
• Mediterranean diet decreased 10-‐year CVD risk in the en2re cohort, as well among smokers, sedentary and obese subjects
• Mediterranean diet decreased CRP and IL-‐6 levels, but s2ll had a direct effect on CVD risk
• The level of adherence to the Mediterranean diet was modest
Panagiotakos D et al., the ATTICA Study group, Exploring the path of Mediterranean diet on 10-‐year incidence of cardiovascular disease: The ATTICA study (2002-‐2012), Nutri2on, Metabolism and Cardiovascular Diseases (2014), doi: 10.1016/ j.numecd.2014.09.006.
The ATTICA study
Panagiotakos D et al., the ATTICA Study group, Exploring the path of Mediterranean diet on 10-‐year incidence of cardiovascular disease: The ATTICA study (2002-‐2012), Nutri2on, Metabolism and Cardiovascular Diseases (2014), doi: 10.1016/ j.numecd.2014.09.006.
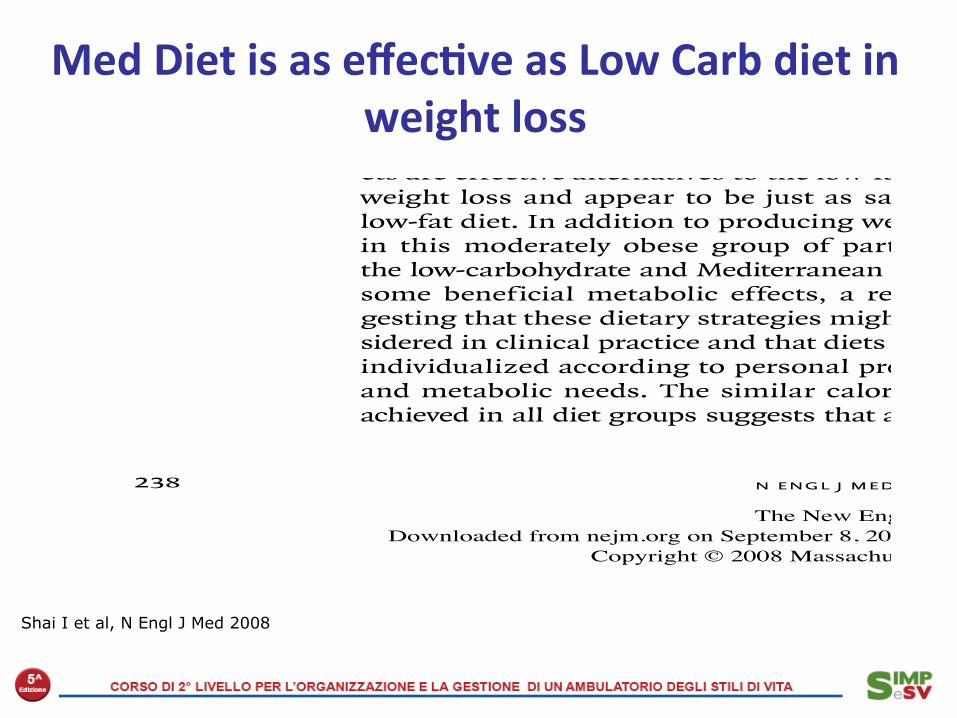
Med Diet is as effec<ve as Low Carb diet in weight loss
T h e n e w e ngl a nd j o u r na l o f m e dic i n e
n engl j med 359;3 www.nejm.org july 17, 2008238
cant (P<0.05) only in the low-carbohydrate group (P = 0.45 for the comparison among groups).
Liver-Function TestsChanges in bilirubin, alkaline phosphatase, and alanine aminotransferase levels were similar among the diet groups. Alanine aminotransferase levels were significantly reduced from baseline to 24 months in the Mediterranean-diet and the low-carbohydrate groups (reductions of 3.4±11.0 and 2.6±8.6 units per liter, respectively; P<0.05 for the comparison with baseline in both groups).
Discussion
In this 2-year dietary-intervention study, we found that the Mediterranean and low-carbohydrate di-ets are effective alternatives to the low-fat diet for weight loss and appear to be just as safe as the low-fat diet. In addition to producing weight loss in this moderately obese group of participants, the low-carbohydrate and Mediterranean diets had some beneficial metabolic effects, a result sug-gesting that these dietary strategies might be con-sidered in clinical practice and that diets might be individualized according to personal preferences and metabolic needs. The similar caloric deficit achieved in all diet groups suggests that a low-car-
bohydrate, non–restricted-calorie diet may be opti-mal for those who will not follow a restricted-cal-orie dietary regimen. The increasing improvement in levels of some biomarkers over time up to the 24-month point, despite the achievement of maxi-mum weight loss by 6 months, suggests that a diet with a healthful composition has benefits be-yond weight reduction.
The present study has several limitations. We enrolled few women; however, we observed a sig-nificant interaction between the effects of diet group and sex on weight loss (women tended to lose more weight on the Mediterranean diet), and this difference between men and women was also reflected in the changes in leptin levels. This pos-sible sex-specific difference should be explored in further studies. The data from the few partici-pants with diabetes are of interest, but we recog-nize that measurement of HOMA-IR is not an op-timal method to assess insulin resistance among persons with diabetes. We relied on self-reported dietary intake, but we validated the dietary assess-ment in two different dietary-assessment tools and used electronic questionnaires to minimize the amount of missing data. Finally, one might argue that the unique nature of the workplace in this study, which permitted a closely monitored di-etary intervention for a period of 2 years, makes it difficult to generalize the results to other free-living populations. However, we believe that simi-lar strategies to maintain adherence could be ap-plied elsewhere.
The strengths of the study include the one-phase design, in which all participants started simultaneously; the relatively long duration of the study; the large study-group size; and the high rate of adherence. The monthly measurements of weight permitted a better understanding of the weight-loss trajectory than was the case in previ-ous studies.
We observed two phases of weight change: initial weight loss and weight maintenance. The maximum weight reduction was achieved during the first 6 months; this period was followed by the maintenance phase of partial rebound and a plateau. Among all diet groups, weight loss was greater for those who completed the 24-month study than for those who did not. Even moderate weight loss has health benefits, and our find-ings suggest benefits of behavioral approaches that yield weight losses similar to those obtained with pharmacotherapy.29
22p3
0
−2
−1
−3
−4
−6
−7
−5
−80 1 2 3 4 5 6 7 8 9 10 11 12 13 14 15 16 17 18 19 20 21 22 23 24
Mediterranean dietLow-fat diet
Low-carbohydrate diet
AUTHOR:
FIGURE:
JOB:
4-CH/T
RETAKEICM
CASE
EMail LineH/TCombo
Revised
REG F
Enon
1st2nd3rd
Shai
2 of 4
07-17-08
ARTIST: ts
35903 ISSUE:
P<0.001 for both comparisons with the low-fat diet
Figure 2. Weight Changes during 2 Years According to Diet Group.
Vertical bars indicate standard errors. To statistically evaluate the changes in weight measurements over time, generalized estimating equations were used, with the low-fat group as the reference group. The explanatory vari-ables were age, sex, time point, and diet group.
The New England Journal of Medicine Downloaded from nejm.org on September 8, 2014. For personal use only. No other uses without permission.
Copyright © 2008 Massachusetts Medical Society. All rights reserved.
Shai I et al, N Engl J Med 2008

2014 overall evidence: Low carb diets may increase cardiovascular diseases
Low carb-‐high protein diets can have unfavourable health effects
In contrast, at least 3 randomized trials and more than 20 epidemiological studies have all shown striking health benefits of the Med diets: fewer CV diseases, cancers, diabetes, and neurodegenera2ve diseases, … and longer life expectancy!
Interes<ngly, inves2gators experienced some forms of modernized Med; clearly an<cipa<ng that adop2on of the Med diet by contemporary consumers needs some “adapta2on” to be well accepted
Low carbohydrate-‐high protein diets, used on a regular basis and without considera<on of the nature of carbohydrates or the source of proteins, are associated with increased risk of cardiovascular disease.