Embed Size (px)
Citation preview

-1-
Modelled Soil Temperature Sensitivity to Variable Snow and Vegetation Conditions in Low-Relief Coastal Mountains, Nunatsiavut and NunatuKavut,
Labrador
Rosamond Tutton, B.Eng.,1 Robert G. Way, Ph.D.,2 Ryley Beddoe, Ph.D.,3 Yu Zhang, Ph.D.,4 and Andrew Trant, Ph.D.5
1Northern Environmental Geoscience Laboratory, Dept. of Geography and Planning, Queen’s Univ., 99 University Avenue, Kingston, ON (corresponding author). ORCHID: https://orcid.org/0000-0002-4843-0451. Email: [email protected]; [email protected] 2Northern Environmental Geoscience Laboratory, Dept. of Geography and Planning, Queen’s Univ. Email: [email protected] 3Dept. of Civil Engineering, Royal Military College of Canada. Email: [email protected] 4Canada Centre for Remote Sensing, Canada Centre for Mapping and Earth Observation, Natural Resources Canada. Email: [email protected] 5Ecological Legacy Lab, School of Environment, Resources and Sustainability, Univ. Waterloo. Email: [email protected] Disclaimer: The following manuscript has been accepted for publication in the conference proceedings of the American Society of Civil Engineers, 2021 Regional Conference on Permafrost and 19th International Conference on Cold Regions Engineering. The manuscript has undergone peer-review and will be published in the Fall 2021 proceedings. Please contact the corresponding author for questions and/or feedback.
-2-
ABSTRACT
Understanding permafrost vulnerability and resilience to climate warming is critical for predicting impacts on northern communities and ecosystems. The thermal characteristics of near-surface permafrost are influenced by effects from overlying vegetation and snow cover, both of which are changing in northern environments. The association between vegetation and snow is important in the coastal mountains of Labrador, northeast Canada, because of high annual snowfall totals and greening tundra biomes. In this study, we present a series of one-dimensional simulations using the Northern Ecosystem Soil Temperature (NEST) model to characterize ground thermal conditions at two field sites (Nain, Nunatsiavut & Pinware, NunatuKavut) along the Labrador coast. NEST simulations covering 1979-2019 were run using ERA5 atmospheric reanalysis for three ecotypes (tundra, shrub, treed) with three different snow accumulation regimes (snow drifting away from site, no snow drift, snow drifting to site). At Nain, perennially frozen ground was present for all three ecotypes when snow cover was kept thin (drifting away) but was largely absent for the ecotypes when snow accumulation was higher. At Pinware, frozen ground was mostly absent except where snow cover was shallow (wind drifting away). For low-snow simulations, frozen bodies (< 20 m) persisted in all ecotypes during cold periods but only remained intact following warmer years for treed ecotypes. These results highlight the importance of spatial and temporal variability in snow cover on ground thermal regimes in coastal Labrador. INTRODUCTION Widespread permafrost thaw is projected to occur by the end of this century throughout much of the discontinuous permafrost in Canada (Derksen et al. 2012). Changes to regional permafrost distribution will impact traditional activities (Anderson et al. 2018) and habitat suitability for keystone species (Berteaux et al. 2016). Concurrently, rapid environmental change is expected to alter the distribution of northern vegetation with implications for permafrost and snow cover (Sturm et al. 2001). Sturm et al (2005) found that increased shrub growth led to the accumulation of a thicker, less dense snowpack which better insulates the soil and favours further shrub growth. Variability in snow distribution due to wind redistribution, topography and vegetation interception has also been shown to be a critical factor contributing to permafrost thaw (Wilcox et al. 2019).
Despite its importance to local ecosystems and people, interactions between terrestrial cryosphere components and vegetation are understudied in coastal mountains of the eastern Canadian Subarctic (Way et al. 2018). A series of recent studies (e.g. Way and Lewkowicz 2016, 2018) have highlighted the importance of late-winter snow thickness for modelling permafrost distribution and vulnerability to thaw in coastal Labrador. An enhanced understanding of permafrost-snow-vegetation interactions will support evidence-based infrastructure and development planning in the region.
This study considers two research basins established by an ArcticNet supported initiative in coastal Labrador. Due to the general lack of permafrost information or long-term ground temperature records near these basins, we use ground thermal modelling to provide a first estimate of ground freezing characteristics and to explore variability in ground thermal conditions expected
-3-
in the region. In this study, we use the Northern Ecosystem Soil Temperature (NEST) model (Zhang et al. 2003) to simulate ground temperatures across ecotypes and snow cover scenarios to evaluate ground thermal dynamics at both snow-permafrost-vegetation research basins. STUDY AREA The two study sites (Pinware River Hills [PRH] and Nain Bay Hills [NBH]) were established in 2019 following discussion with the NunatuKavut Community Council and Nunatsiavut Government. Research basins are situated in forest-tundra transitions within the coastal barrens ecozones of Nunatsiavut and NunatuKavut (Roberts et al. 2006), at southern (PRH) and northern (NBH) ends of the discontinuous permafrost zone (Way and Lewkowicz 2016) (Figure 1 B). Regional permafrost modelling suggests that NBH is in the sporadic discontinuous permafrost zone while permafrost near PRH is restricted to isolated patches (Way and Lewkowicz 2016).
The regional climate at both sites is influenced by their coastal proximity with cooler, wetter summers and milder winters than areas farther inland (Way et al. 2017). The mean annual air temperatures (MAAT) (1979-2019) are approximately 0.1 °C at PRH (51.7°N, -56.6°E, ~214 m a.s.l.) and -3.0 °C NBH (56.6°N, -62.0°E, ~125 m a.s.l.). The seasonal temperature range at PRH is smaller than at NBH due to colder winters in the Nain area caused by seasonal sea ice cover (winter-spring) in the region (Way et al. 2017). Both study areas are situated on hilltop plateaus in low-relief coastal mountains positioned above the marine limit. Preliminary site evaluations included investigations of near-surface soil freezing (summer 2019) and snow cover (winter 2020). Soil profiles and subsurface conditions were inferred from regional geomorphology, site photos and field studies conducted in coastal Labrador (Majorowicz and Minea 2015; Mmanus et al. 2012; Way et al. 2018). Depth to bedrock varied but average conditions were inferred from soil probing (maximum of 120 cm) and site photos.
PRH is located between the NunatuKavut Community Council’s communities of Red Bay and Pinware along the Trans-Labrador Highway (Route 510). Black spruce (Picea mariana) and white spruce (Picea glauca) krummholz are found in wind sheltered, moist sites while Sphagnum mosses, sedges, cotton grasses (Eriophorum spp.), and other wetland species occupy poorly drained depressions and bogs on lower slopes (Roberts et al. 2006) (Figure 1 D). Bedrock in the region is composed of old and deformed granites (Majorowicz and Minea 2015). NBH is approximately 22 km from the Nunatsiavut community of Nain. Vegetation consists mostly of dense white spruce krummholz, willows (Salix spp.) and other shrubs (Figure 1 C). Elevated headlands have alpine tundra and dwarf and prostrate shrubs, forbs, sedges, grasses and mosses (Roberts et al. 2006, Larking et al. 2021). Bedrock in the region has been mapped as predominantly gabbro (Geological Survey 2015).
-4-
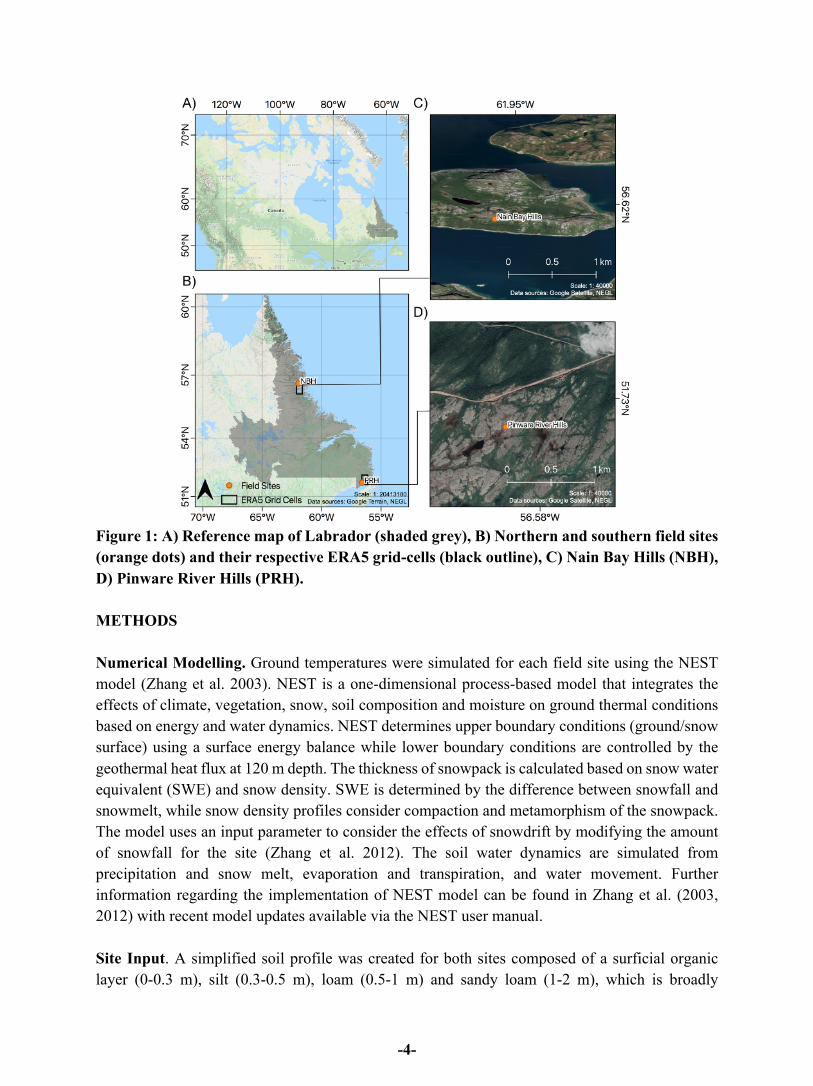
Figure 1: A) Reference map of Labrador (shaded grey), B) Northern and southern field sites (orange dots) and their respective ERA5 grid-cells (black outline), C) Nain Bay Hills (NBH), D) Pinware River Hills (PRH). METHODS Numerical Modelling. Ground temperatures were simulated for each field site using the NEST model (Zhang et al. 2003). NEST is a one-dimensional process-based model that integrates the effects of climate, vegetation, snow, soil composition and moisture on ground thermal conditions based on energy and water dynamics. NEST determines upper boundary conditions (ground/snow surface) using a surface energy balance while lower boundary conditions are controlled by the geothermal heat flux at 120 m depth. The thickness of snowpack is calculated based on snow water equivalent (SWE) and snow density. SWE is determined by the difference between snowfall and snowmelt, while snow density profiles consider compaction and metamorphism of the snowpack. The model uses an input parameter to consider the effects of snowdrift by modifying the amount of snowfall for the site (Zhang et al. 2012). The soil water dynamics are simulated from precipitation and snow melt, evaporation and transpiration, and water movement. Further information regarding the implementation of NEST model can be found in Zhang et al. (2003, 2012) with recent model updates available via the NEST user manual. Site Input. A simplified soil profile was created for both sites composed of a surficial organic layer (0-0.3 m), silt (0.3-0.5 m), loam (0.5-1 m) and sandy loam (1-2 m), which is broadly

-5-
consistent with local land cover and soil probing at PRH and NBH non-bedrock locations and with similar sites in the region (Way et al. 2018). The percentage of organic matter decreases from 99% to 20% at 0.2 m with an increasing degree of decomposition (fibric to hemic). Bedrock is presumed 2 m below the ground surface based on local site visits and soil probing. All model runs assumed a flat slope with no topographic shading and no surface water inflow. Ground water inflow and outflow were set at minimum depths of 20 cm and 10 cm respectively. This parameterization is generally representative of the upland plateau tundra-shrub-tree transitions at the field sites but less so for the small wetlands present in portions of the sites. Geothermal heat flux was set as 0.029 W/m2 and 0.054 W/m2 for NBH and PRH, respectively, based on Majorowicz and Minea (2015) and previous modelling in the region (Way et al. 2018; Wang 2020). Fraction of quartz in soil was set as 0.1 and 0.0 for PRH and NRH, respectively, following estimates by Way et al. (2018). Climate Data. Input climate data (daily temperature [minimum, mean and maximum] [°C], precipitation [mm/day], total horizontal solar radiation [MJ/m2/day]), daily mean wind speed [m/s] and daily total downward longwave radiation [MJ/m2/day]) required for modelling was derived from ERA5 atmospheric reanalysis (Hersbach et al. 2020) for the period of 1979-01-01 to 2020-01-01. Snow fraction was assumed to be 1 when the daily mean air temperature was less than 0°C. Vapour pressure was calculated based on daily minimum air temperature (Tm) using the August-Roche-Magnus equation (Alduchov and Eskridge 1996):
𝑉"#$ = 6.11𝑒[+,.-,.$.$/-0,.0],
where 𝑉"#$ is the saturated water vapour pressure (mbar) at 𝑇3 (daily min air temperature (°C)). Although ERA5 data has a coarse spatial resolution of 0.5°, the mean elevation for the grid
cell overlapping with our sites (Figure 1 B) is similar to that of our field sites (mean absolute error [MAE] of 23 m and 83 m for PRH and NBH, respectively). Although prior generations of some atmospheric reanalysis products showed biases in the eastern Subarctic region (Rapaić et al. 2015), ERA5 trends were similar to studies conducted on the broader region (Barrette et al. 2020). ERA5 air temperature data were verified against shorter, discontinuous records collected from nearby Country Cat Pond and Nain Airport. This comparison between ERA5 and station data showed a daily MAE of 2.09 ± 1.89°C at PRH and 1.39 ± 1.19°C at NBH. The MAAT bias of the climate station data was 0.41 °C (PRH) and -0.32 °C (NBH) relative to the ERA5 reanalysis data. According to ERA5, regional air temperatures have warmed over the past 40 years (0.32 °C/decade [PRH], 0.44 °C/decade [NBH]) but with significant interannual variability (standard deviation of 1.05 °C [PRH] and 1.30 °C [NBH]). Extreme years were observed at both sites in 1992 and 2010 with the former being 1.9 (2.5) °C below the long-term normal at PRH (NBH) and the latter being 2.7 (4.0) °C above the long-term normal at PRH (NBH). Regionally, there are no statistically significant trends in precipitation over the past 40 years in agreement with Rapaić et al (2015). Modelling Scenarios. Nine different modelling scenarios were generated for each site to simulate combinations of three different ecotypes (tundra, shrub and treed) and three different snow redistribution schemes (snow drifting away from site, no snow drifting and snow drifting to site). Vegetation height was set at 0 m for tundra, 0.3 m for shrub and 1.5 m for treed while summer leaf
-6-
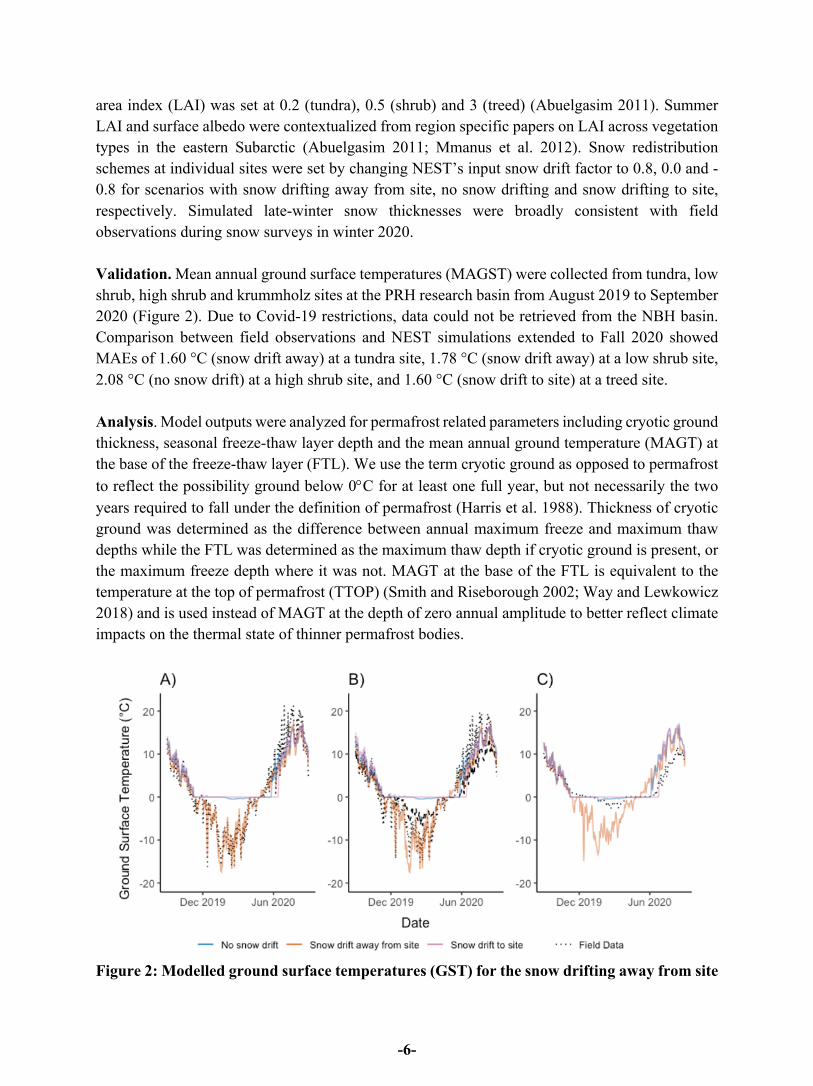
area index (LAI) was set at 0.2 (tundra), 0.5 (shrub) and 3 (treed) (Abuelgasim 2011). Summer LAI and surface albedo were contextualized from region specific papers on LAI across vegetation types in the eastern Subarctic (Abuelgasim 2011; Mmanus et al. 2012). Snow redistribution schemes at individual sites were set by changing NEST’s input snow drift factor to 0.8, 0.0 and -0.8 for scenarios with snow drifting away from site, no snow drifting and snow drifting to site, respectively. Simulated late-winter snow thicknesses were broadly consistent with field observations during snow surveys in winter 2020. Validation. Mean annual ground surface temperatures (MAGST) were collected from tundra, low shrub, high shrub and krummholz sites at the PRH research basin from August 2019 to September 2020 (Figure 2). Due to Covid-19 restrictions, data could not be retrieved from the NBH basin. Comparison between field observations and NEST simulations extended to Fall 2020 showed MAEs of 1.60 °C (snow drift away) at a tundra site, 1.78 °C (snow drift away) at a low shrub site, 2.08 °C (no snow drift) at a high shrub site, and 1.60 °C (snow drift to site) at a treed site. Analysis. Model outputs were analyzed for permafrost related parameters including cryotic ground thickness, seasonal freeze-thaw layer depth and the mean annual ground temperature (MAGT) at the base of the freeze-thaw layer (FTL). We use the term cryotic ground as opposed to permafrost to reflect the possibility ground below 0°C for at least one full year, but not necessarily the two years required to fall under the definition of permafrost (Harris et al. 1988). Thickness of cryotic ground was determined as the difference between annual maximum freeze and maximum thaw depths while the FTL was determined as the maximum thaw depth if cryotic ground is present, or the maximum freeze depth where it was not. MAGT at the base of the FTL is equivalent to the temperature at the top of permafrost (TTOP) (Smith and Riseborough 2002; Way and Lewkowicz 2018) and is used instead of MAGT at the depth of zero annual amplitude to better reflect climate impacts on the thermal state of thinner permafrost bodies.
Figure 2: Modelled ground surface temperatures (GST) for the snow drifting away from site
-7-
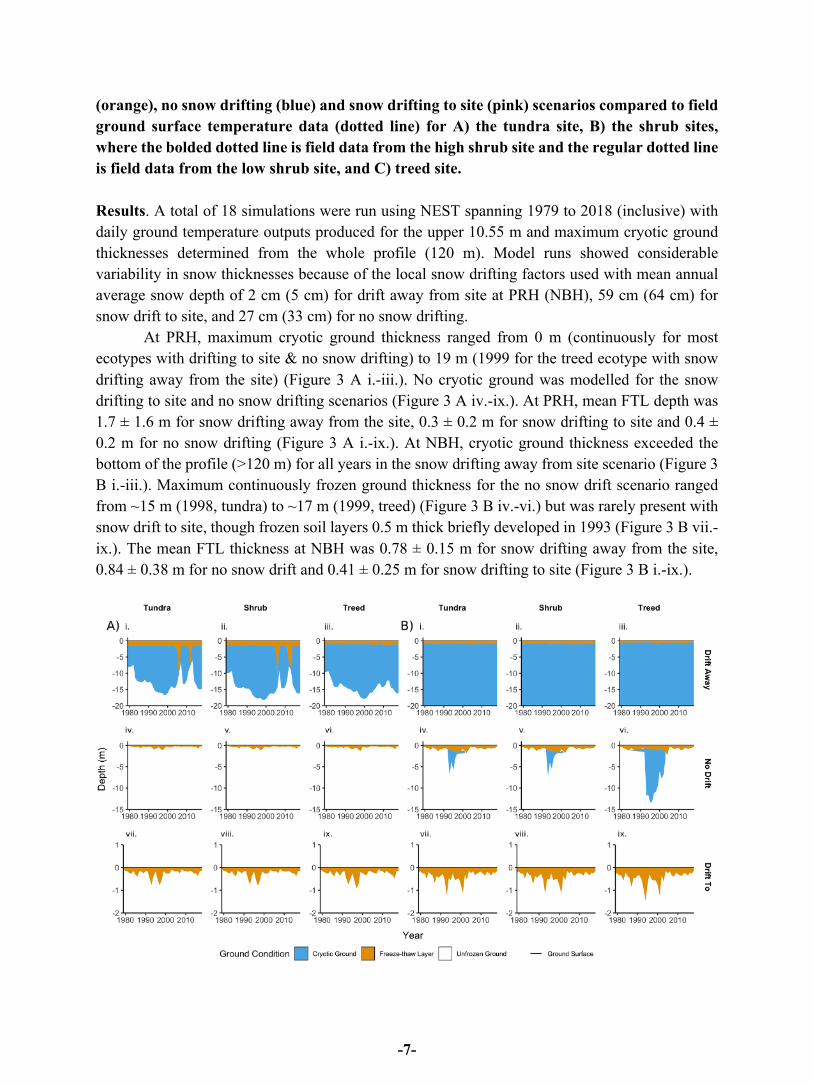
(orange), no snow drifting (blue) and snow drifting to site (pink) scenarios compared to field ground surface temperature data (dotted line) for A) the tundra site, B) the shrub sites, where the bolded dotted line is field data from the high shrub site and the regular dotted line is field data from the low shrub site, and C) treed site. Results. A total of 18 simulations were run using NEST spanning 1979 to 2018 (inclusive) with daily ground temperature outputs produced for the upper 10.55 m and maximum cryotic ground thicknesses determined from the whole profile (120 m). Model runs showed considerable variability in snow thicknesses because of the local snow drifting factors used with mean annual average snow depth of 2 cm (5 cm) for drift away from site at PRH (NBH), 59 cm (64 cm) for snow drift to site, and 27 cm (33 cm) for no snow drifting. At PRH, maximum cryotic ground thickness ranged from 0 m (continuously for most ecotypes with drifting to site & no snow drifting) to 19 m (1999 for the treed ecotype with snow drifting away from the site) (Figure 3 A i.-iii.). No cryotic ground was modelled for the snow drifting to site and no snow drifting scenarios (Figure 3 A iv.-ix.). At PRH, mean FTL depth was 1.7 ± 1.6 m for snow drifting away from the site, 0.3 ± 0.2 m for snow drifting to site and 0.4 ± 0.2 m for no snow drifting (Figure 3 A i.-ix.). At NBH, cryotic ground thickness exceeded the bottom of the profile (>120 m) for all years in the snow drifting away from site scenario (Figure 3 B i.-iii.). Maximum continuously frozen ground thickness for the no snow drift scenario ranged from ~15 m (1998, tundra) to ~17 m (1999, treed) (Figure 3 B iv.-vi.) but was rarely present with snow drift to site, though frozen soil layers 0.5 m thick briefly developed in 1993 (Figure 3 B vii.-ix.). The mean FTL thickness at NBH was 0.78 ± 0.15 m for snow drifting away from the site, 0.84 ± 0.38 m for no snow drift and 0.41 ± 0.25 m for snow drifting to site (Figure 3 B i.-ix.).
-8-
Figure 3: Cryotic ground (blue), unfrozen ground (blank) and freeze-thaw layers (orange) for 1979-2018 for Pinware River Hills (PRH) (A i.-ix.) and Nain Bay Hills (NBH) (B i.-ix.) The average MAGT at TTOP across all scenarios was 1.7 ± 2.0 °C at PRH and -0.5 ± 2.7°C at NBH. MAGT for PRH ranged from -2.3°C (1993, shrub, snow drifting away from site) to 4.6°C (2006, tundra, no snow drifting). Only the snow drifting away scenario resulted in MAGTs favorable to permafrost at this site (Figure 4). At NBH, MAGT ranged from -6.5°C (1993, shrub, snow drifting away from site) to 2.9°C (2006, tundra, snow drifting to site). The standard deviation between ecotypes was 0.6°C, 0.8°C, and 0.7°C for PRH and 1.1°C, 0.9°C, and 0.6°C for NBH (snow drift away from site, no snow drift, and snow drift to site respectively). MAGT was more variable when comparing between snow redistributions, with standard deviations ranging from 1.8°C (treed) to 2.1°C (shrub) at PRH and 2.4°C (treed) to 2.9°C (tundra) at NBH.
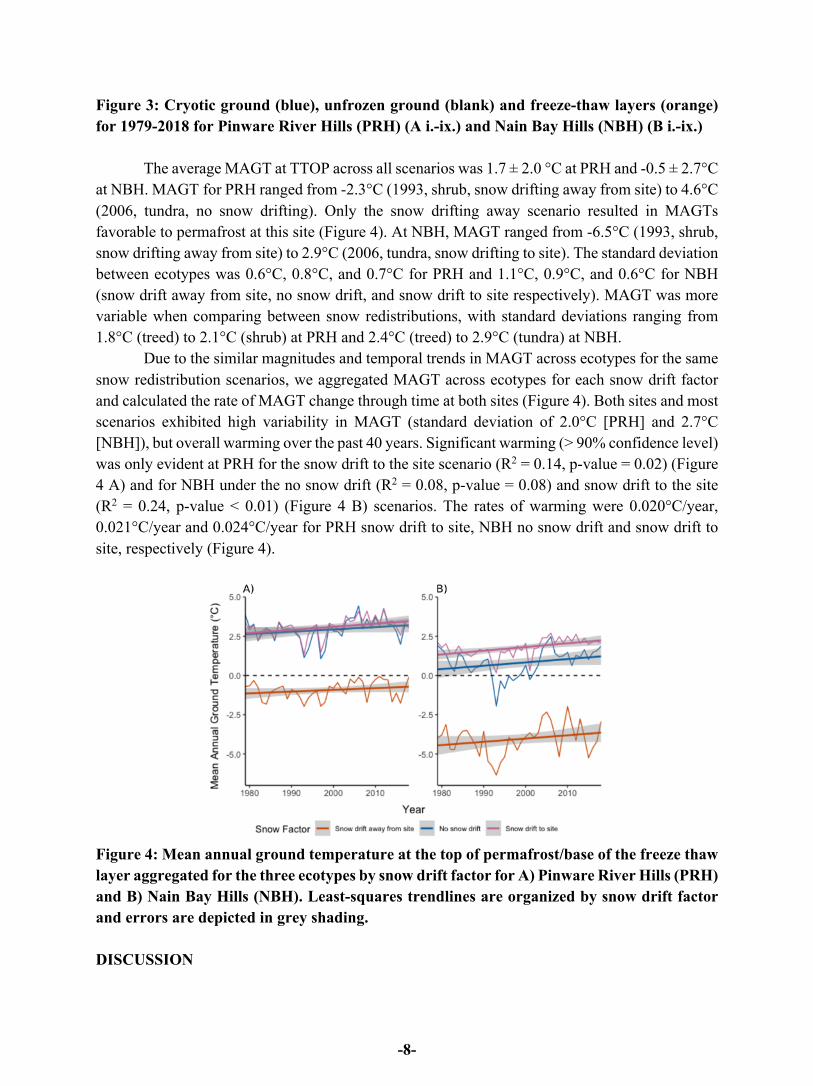
Due to the similar magnitudes and temporal trends in MAGT across ecotypes for the same snow redistribution scenarios, we aggregated MAGT across ecotypes for each snow drift factor and calculated the rate of MAGT change through time at both sites (Figure 4). Both sites and most scenarios exhibited high variability in MAGT (standard deviation of 2.0°C [PRH] and 2.7°C [NBH]), but overall warming over the past 40 years. Significant warming (> 90% confidence level) was only evident at PRH for the snow drift to the site scenario (R2 = 0.14, p-value = 0.02) (Figure 4 A) and for NBH under the no snow drift (R2 = 0.08, p-value = 0.08) and snow drift to the site (R2 = 0.24, p-value < 0.01) (Figure 4 B) scenarios. The rates of warming were 0.020°C/year, 0.021°C/year and 0.024°C/year for PRH snow drift to site, NBH no snow drift and snow drift to site, respectively (Figure 4).
Figure 4: Mean annual ground temperature at the top of permafrost/base of the freeze thaw layer aggregated for the three ecotypes by snow drift factor for A) Pinware River Hills (PRH) and B) Nain Bay Hills (NBH). Least-squares trendlines are organized by snow drift factor and errors are depicted in grey shading. DISCUSSION

-9-
Implications for Permafrost in Coastal Labrador. During preliminary field investigations at Pinware River Hills (PRH), late-lying frozen ground was detected to depths of 59 cm and 61 cm at several locations (typically exposed tundra and peat covered mounds) but was generally absent from the upper 120 cm. At Nain Bay Hills (NBH), frozen ground was detected via probing regularly at depths of 50 cm to 92 cm although more widespread near-surface bedrock made probing difficult to interpret where deeper thaw had occurred. Cryotic ground was simulated for both PRH and NBH with minimal snow cover; however, simulations suggested contemporary near surface cryotic ground would be non-existent at PRH and rarely present at NBH with higher snow accumulation. MAGTs and cryotic ground thicknesses did not vary greatly across ecotypes at PRH nor NBH but during extreme warm years greater thaw was inferred for tundra and low shrub ecotypes compared to treed ecotypes at both sites. Cooler air temperatures in the early 1990s also led to deeper freezing at NBH for the treed ecotype relative to the tundra and shrub ecotypes. These results align with those of Jorgenson et al. (2010) showing that forest cover can elicit strong negative feedbacks which enhance permafrost resilience to climate warming and disturbance. The presence and persistence of cryotic ground at the southern site (PRH) is more dependent on thin snow cover than MAAT, similar to results from peatland permafrost in southeast Labrador (Way et al. 2018; Way and Lewkowicz 2018). The correlation between annual thawing degree days (TDDA) and MAGT at TTOP varied with snow drift scenarios, showing a strong association for the snow drift to site (r = 0.75) but a weak association (r = 0.27) for the snow drifting away scenario. The magnitude of change across sites linked to snow redistribution suggests that changes in vegetation and associated snow distribution may be more impactful than atmospheric climate warming on MAGT in this region. Zhang et al. (2008) found that a thinning snowpack and shorter snow duration (as a product of climate warming) is anticipated to reduce the rate of permafrost degradation due to climate warming. This decoupling of ground and air temperature could impact permafrost thaw rates in the eastern Subarctic (Zhang et al. 2005, 2008).
Both PRH and NBH showed rapid freeze/thaw transitions and minimal buffering of the climate response due to coarse soils overtop of shallow bedrock (at a depth of 2 m) (Throop et al. 2012). The generalized soil profile (composed of an organic layer, silt, loam and sandy loam) resulted in a relatively high thermal conductivity and low specific heat capacity (Wang et al. 2019). The model assumption of pure, pore free bedrock likely contributed to the volatility of the MAGT. This could be adjusted by altering ground thermal conditions such as the lateral water flow; however, we chose to use observed conditions to maintain consistency and focus on the sensitivity of the sites to snow and vegetation. All modelled scenarios experienced drops in MAGT between 1989 and 1995; however, for the no snow drift scenario continuously frozen ground developed at NBH while at PRH ground remained unfrozen despite the cooler climate conditions. Together these results lead us to suggest that climate-driven, ecosystem-protected permafrost can exist at PRH and climate-driven permafrost can exist at NBH (Shur and Jorgenson 2007). Although climate warming has occurred in coastal Labrador, trends in MAGT were rarely statistically significant due to large inter-annual fluctuation. For decades, experimental studies have demonstrated the importance of snow cover for permafrost formation and thaw processes (Nicholson 1979; O’Neill and Burn 2017), particularly in discontinuous permafrost and ecologically sensitive environments (Way et al. 2018). At PRH and NBH, scenarios with deeper
-10-
snow (drift to the site) experienced significant warming of ~0.02 °C/year and MAGT varied by up to 4 °C at PRH and by 6 °C at NBH (Figure 4). These results support studies implicating snow accumulation as a driver of permafrost thaw (Grünberg et al. 2020; Jafarov et al. 2018; O’Neill and Burn 2017) and demonstrates the sensitivity of ground temperatures to snow thickness modifications in coastal Subarctic mountains. Model limitations. Owing to a lack of detailed field data from the two research basins the model results rely on assumptions that may not universally apply to real-world conditions. For example, soil profile characteristics are kept constant across ecotypes, but this is based on geomorphological interpretation rather than soil profile analysis. Additional simulations with different soil profiles, surface covers and alternative depths to bedrock would reveal broader differences in ground thermal characteristics. As NEST is a one-dimensional model, it only considers vertical heat fluxes and thus does not consider adjacent unfrozen terrain which may affect lateral heat transfer (Wang, 2020). The model configuration used in this study also did not directly associate snow redistribution to specific ecotypes. Prior research in Labrador (Way and Lewkowicz, 2018) has shown that treed ecotypes rarely have a thin snow cover thus some simulations (e.g. snow redistribution away from site at treed ecotype) are considered a sensitivity analysis. Despite regional greening, LAI, snow redistribution factors and site characteristics were kept constant through time, which may not be representative in a changing environment (Mmanus et al. 2012). Further field investigations and model calibration will be required to assess the impacts of variable topography and land cover conditions on permafrost at these two research basins. CONCLUSION In this study, we examined snow-vegetation-permafrost interactions in coastal mountains of the eastern Canadian Subarctic. Both sites lie within the discontinuous permafrost zone (Riseborough and Smith 1998), a region susceptible to permafrost thaw in response to a changing climate (Barrette et al. 2020; Throop et al. 2012; Way and Lewkowicz 2016). The model results do not show significant overall warming trends in ground temperature; however, they support previous findings showing that wind scouring of sites may preserve permafrost even at the southern end of the discontinuous permafrost zone (Way et al. 2018).
Permafrost and ground freezing characteristics were not interpreted as being strongly influenced by vegetation types for either site except for the Pinware treed site with minimal snow accumulation scenario which protected permafrost from warm years while other ecotypes did not (tundra, shrub). Cryotic ground at both sites responded rapidly to regional cooling and warming suggesting climate driven permafrost, particularly at NBH. However, muted response to warm years under the no snow drift treed scenario demonstrates climate driven – ecosystem protected permafrost at PRH (Shur and Jorgenson 2007). The results presented in this study demonstrate the sensitivity of cryotic ground thickness and temperature to snow accumulation throughout coastal tundra and forest ecotones. Variability in cryotic conditions across the scenarios we present highlight the need to integrate geomorphological analysis, ecosystem science and snow science

-11-
together in permafrost vulnerability assessments. This region continues to be largely unexamined and requires further fieldwork to support the modelled results presented in this study. REFERENCES Abuelgasim, A., and Leblanc, S. (2011). “Leaf area index mapping in northern Canada.” Int. J.
Remote Sens., 32, 5059–5076. Alduchov, O. A., and Eskridge, R. E. (1996). “Improved magnus form approximation of
saturation vapor pressure.” J. Appl. Meteorol. (1988-2005), 35(4), 601–609. Anderson, D., Ford, J. D., and Way, R. G. (2018). “The impacts of climate and social changes on
cloudberry (bakeapple) picking: A case study from southeastern Labrador.” Hum. Ecol. Interdiscip. J., 46(6), 849–863.
Barrette, C., Brown, R., Way, R., Mailhot, A., Diaconescu, É. P., Grenier, P., Chaumont, D., Dumon, D., Sévigny, C., Howell, S., and Senneville, S. (2020). “Nunavik and Nunatsiavut regional climate information update.” Chapter 2 in Nunavik and Nunatsiavut: From science to policy, an Integrated Regional Impact Study (IRIS) of climate change and modernization, second iteration, P. Ropars, M. Allard and M. Lemay, eds. ArcticNet Inc.
Berteaux, D., Gauthier, G., Domine, F., Ims, R. A., Lamoureux, S., Levesque, E., and Yoccoz, N. (2016). “Effects of changing permafrost and snow conditions on tundra wildlife: Critical places and times.” Arct. Sci., 3(2), 2016–0023.
Derksen, C., Smith, S. L., Sharp, M., Brown, L., Howell, S., Copland, L., Mueller, D. R., Gauthier, Y., Fletcher, C. G., Tivy, A., Bernier, M., Bourgeois, J., Brown, R., Burn, C. R., Duguay, C., Kushner, P., Langlois, A., Lewkowicz, A. G., Royer, A., and Walker, A. (2012). “Variability and change in the Canadian cryosphere.” Clim. Change, 115(1), 59–88.
Geological Survey, Department of Natural Resources, Government of Newfoundland and Labrador. (2015). Geological map of the Nain area (NTS 14C/12): A colourized and revised version of Map 2001-10. gov.nl.
Grünberg, I., Wilcox, E. J., Zwieback, S., Marsh, P., and Boike, J. (2020). “Linking tundra vegetation, snow, soil temperature, and permafrost.” preprint, Biogeophysics: Physical - Biological Coupling.
Harris, E. (1988). Glossary of permafrost and related ground-ice terms. National Research Council of Canada.
Hersbach et al. (2020). “The ERA5 global reanalysis.” Q. J. R. Meteorolog. Soc., 146(730), 1999–2049.
Jafarov, E. E., Coon, E. T., Harp, D. R., Wilson, C. J., Painter, S. L., Atchley, A. L., and Romanovsky, V. E. (2018). “Modeling the role of preferential snow accumulation in through talik development and hillslope groundwater flow in a transitional permafrost landscape.” Environ. Res. Lett., 13(10), 105006.

-12-
Jorgenson, M. T., Romanovsky, V., Harden, J., Shur, Y., O’Donnell, J., Schuur, E. A. G., Kanevskiy, M., and Marchenko, S. (2010). “Resilience and vulnerability of permafrost to climate change.” Can. J. For. Res., 40(7), 1219–1236.
Larking, T., Davis, E., Way, R. G., Hermanutz, L., and Trant, A. (2021). “Recent greening driven by species-specific shrub growth characteristics in Nunatsiavut, Labrador, Canada.” Arct. Sci., 1-29.
Mmanus, K. M., Morton, D. C., Masek, J. G., Wang, D., Sexton, J. O., Nagol, J. R., Ropars, P., and Boudreau, S. (2012). “Satellite‐based evidence for shrub and graminoid tundra expansion in northern Quebec from 1986 to 2010.” Global Change Biol., 18(7), 2313–2323.
Nicholson, F. H. (1979). “Permafrost spatial and temporal variations near Schefferville, Nouveau-Québec.” Géographie physique et Quaternaire, 33(3–4), 265–277.
O’Neill, H. B., and Burn, C. R. (2017). “Impacts of variations in snow cover on permafrost stability, including simulated snow management, Dempster Highway, Peel Plateau, Northwest Territories.” Arct. Sci., NRC Research Press, 3(2), 150–178.
Rapaić, M., Brown, R., Markovic, M., and Chaumont, D. (2015). “An evaluation of temperature and precipitation surface-based and reanalysis datasets for the Canadian Arctic, 1950–2010.” Atmos. Ocean, 53(3), 283–303.
Riseborough, D., Shiklomanov, N., Etzelmüller, B., Gruber, S., and Marchenko, S. (2008). “Recent advances in permafrost modelling.” Permafr. Periglac. Process., 19(2), 137–156.
Riseborough, D. W., and Smith, M. W. (1998). “Exploring the limits of permafrost.” In Proc. 7th Int. Conf. on Permafrost, 55, 935–941, Yellowknife, Canada: Nordicana.
Roberts, B. A., Simon, N. P. P., and Deering, K. W. (2006). “The forests and woodlands of Labrador, Canada: Ecology, distribution and future management.” Ecol. Res., 21(6), 868–880.
Shur, Y. L., and Jorgenson, M. T. (2007). “Patterns of permafrost formation and degradation in relation to climate and ecosystems.” Permafr. Periglac. Process., (1), 7–19.
Sturm, M., Holmgren, J., McFadden, J. P., Liston, G. E., III, F. S. C., and Racine, C. H. (2001). “Snow–shrub interactions in Arctic tundra: A hypothesis with climatic implications.” J. Clim., 14(3), 336–344.
Sturm, M., Schimel, J., Michaelson, G., Welker, J. M., Oberbauer, S. F., Liston, G. E., Fahnestock, J., and Romanovsky, V. E. (2005). “Winter biological processes could help convert Arctic tundra to shrubland.” BioScience, 55(1), 17–26.
Throop, J., Lewkowicz, A. G., and Smith, S. L. (2012). “Climate and ground temperature relations at sites across the continuous and discontinuous permafrost zones, northern Canada.” Can. J. Earth Sci., Canadian Science Publishing, 49(8), 865–876.
Wang, Y. (2020). “Fire-associated change in surface and frozen ground conditions in Nunatsiavut, Labrador.” University of Ottawa/Université d’Ottawa, Ottawa, CA.
Wang, Y., Lu, Y., Horton, R., and Ren, T. (2019). “Specific heat capacity of soil solids: Influences of clay content, organic matter, and tightly bound water.” Soil Sci. Soc. Am. J., 83(4), 1062–1066.
-13-
Way, R. G., and Lewkowicz, A. G. (2016). “Modelling the spatial distribution of permafrost in Labrador–Ungava using the temperature at the top of permafrost.” Can. J. Earth Sci, 53(10), 1010–1028.
Way, R. G., Lewkowicz, A. G., and Bonnaventure, P. P. (2017). “Development of moderate-resolution gridded monthly air temperature and degree-day maps for the Labrador-Ungava region of northern Canada,” Int. J. Climatol., 37(1), 493–508.
Way, R. G., and Lewkowicz, A. G. (2018). “Environmental controls on ground temperature and permafrost in Labrador, northeast Canada.” Permafr. Periglac. Process., 29(2), 73–85.
Way, R. G., Lewkowicz, A. G., and Zhang, Y. (2018). “Characteristics and fate of isolated permafrost patches in coastal Labrador, Canada.” The Cryosphere, 12(8), 2667–2688.
Wilcox, E. J., Keim, D., de Jong, T., Walker, B., Sonnentag, O., Sniderhan, A. E., Mann, P., and Marsh, P. (2019). “Tundra shrub expansion may amplify permafrost thaw by advancing snowmelt timing.” Arct. Sci., 5(4), 202–217.
Zhang, Y., Chen, W., and Cihlar, J. (2003). “A process‐based model for quantifying the impact of climate change on permafrost thermal regimes.” J. Geophys. Res. D: Atmos., 108(D22).
Zhang, Y., Chen, W., and Riseborough, D. W. (2008). “Modeling long-term dynamics of snow and their impacts on permafrost in Canada.” In Proc., 9th Int. Conf. on Permafrost, 2055–2060. Fairbanks, United States of America.
Zhang, Y., Chen, W., Smith, S. L., Riseborough, D. W., and Cihlar, J. (2005). “Soil temperature in Canada during the twentieth century: Complex responses to atmospheric climate change.” J. Geophys. Res. D: Atmos., 110(D3).
Zhang, Y., J. Li, X. Wang, W. Chen, W. Sladen, L. Dyke, L. Dredge, J. Poitevin, D. McLennan, H. Stewart, S. Kowalchuk, W. Wu, G. P. Kershaw, and R. K. Brook (2012). “Modelling and mapping permafrost at high spatial resolution in Wapusk National Park, Hudson Bay Lowlands.” Can. J. Earth Sci., 49, 925-937.


![Sensitivity of soil moisture to terrain and snow cover at watershed to plot scales in the Rocky Mountain Front Range, Colorado, USA [Stephanie Kampf]](https://img.dokumen.tips/doc/110x75/554db399b4c905ff7a8b5442/sensitivity-of-soil-moisture-to-terrain-and-snow-cover-at-watershed-to-plot-scales-in-the-rocky-mountain-front-range-colorado-usa-stephanie-kampf.jpg)
![Sensitivity of atmospheric response to modeled snow ......[1] The presence of snow over broad land surface regions has been shown to not only suppress local surface temperatures, but](https://img.dokumen.tips/doc/110x75/5f815f31c902153eb6643a76/sensitivity-of-atmospheric-response-to-modeled-snow-1-the-presence-of.jpg)