Embed Size (px)
Citation preview

ARTICLE IN PRESS
0022-5193/$ - se
doi:10.1016/j.jtb
�CorrespondE-mail addr
1Work is par2Work is par
and ASU MGI
Journal of Theoretical Biology 242 (2006) 722–735
www.elsevier.com/locate/yjtbi
Modeling the glucose–insulin regulatory system and ultradianinsulin secretory oscillations with two explicit time delays
Jiaxu Li�,1, Yang Kuang2, Clinton C. Mason
Department of Mathematics and Statistics, Arizona State University, Tempe, AZ 85287-1804, USA
Received 4 January 2006; received in revised form 9 March 2006; accepted 3 April 2006
Available online 18 May 2006
Abstract
In the glucose–insulin regulatory system, ultradian insulin secretory oscillations are observed to have a period of 50–150min. After
pioneering work traced back to the 1960s, several mathematical models have been proposed during the last decade to model these
ultradian oscillations as well as the metabolic system producing them. These currently existing models still lack some of the key
physiological aspects of the glucose–insulin system. Applying the mass conservation law, we introduce two explicit time delays and
propose a more robust alternative model for better understanding the glucose–insulin endocrine metabolic regulatory system and the
ultradian insulin secretory oscillations for the cases of continuous enteral nutrition and constant glucose infusion. We compare the
simulation profiles obtained from this two time delay model with those from the other existing models. As a result, we notice many
unique features of this two delay model. Based on our intensive simulations, we suspect that one of the possibly many causes of ultradian
insulin secretion oscillations is the time delay of the insulin secretion stimulated by the elevated glucose concentration.
r 2006 Elsevier Ltd. All rights reserved.
Keywords: Glucose–insulin regulatory system; Insulin secretion; Ultradian oscillation; Time delay; Delay differential equation model
1. Introduction
It is well known that the human body needs to maintainits glucose concentration level within a narrow rangefollowing an overnight fast (70–109mg/dl). In the gluco-se–insulin regulatory system, elevated glucose concentra-tion level incites the b-cells in the pancreas to secreteinsulin, helping to return the glucose concentration tonormal levels. As the glucose concentration level decreases,the secretion stops gradually. For a normal subject, afteran overnight fast, the basal plasma insulin is in the range of5–10mU=ml (Ahren and Taborsky, 2002). It can be as wideas 10–40mU=ml during continuous enteral nutrition(Simon and Brandenberger, 2002, Fig. 2) and as large as30–150mU=ml during meal consumption while the glucose
e front matter r 2006 Elsevier Ltd. All rights reserved.
i.2006.04.002
ing author. Tel./fax: +1 480 704 7611.
esses: [email protected], [email protected] (J. Li).
tially supported by ASU MGIA-2006-08.
tially supported by DMS-0077790, DMS/NIGMS-0342388
A-2006-08.
concentration level is high (Ahren and Taborsky, 2002). Ifthe human pancreas does not release sufficient insulin orthe insulin does not trigger cells to utilize the glucose in theplasma and inhibit hepatic glucose production, diabetesmellitus is likely to develop (Bergman et al., 2002).Diabetes mellitus is a disease with considerable compli-
cations which include retinopathy, nephropathy, peripheralneuropathy and blindness (Derouich and Boutayeb, 2002).Also noteworthy is the growing size of the affectedpopulation, with extreme incidence rates occurring amongNative Americans (http://diabetes.niddk.nih.gov/dm/pubs/americanindian). Ever increasing high health-related ex-penses also highlight the seriousness of the condition(http://www.diabetes.org). Due to these factors, manyresearchers have been motivated to study the glucose–in-sulin endocrine metabolic regulatory system with hopes tobetter understand the mechanistic functions and causes ofmetabolic system dysfunctions, improvement of earlydetection of the onset of either type of diabetes includingthe newly classified pre-diabetic condition, and eventuallyprovide more reasonable, effective, efficient and economic

ARTICLE IN PRESSJ. Li et al. / Journal of Theoretical Biology 242 (2006) 722–735 723
treatments to diabetic patients (Bergman et al., 2002;Bergman, 2002; Mari, 2002; Makroglou et al., 2006 and thereferences therein).
The secretion of insulin in the glucose–insulin endocrinemetabolic system occurs in an oscillatory manner over arange of 50–150min and is usually referred to as ultradianoscillations (Simon and Brandenberger, 2002). Two notice-able time delays exist in this system. One is due to theelectric action inside of b-cells upon glucose stimulation torelease insulin, and physiological action that the glucoseutilization correlates the so-called ‘‘remote insulin’’ whichrequires certain time for the newly synthesized insulin tocross the endothelial barrier (Ahren and Taborsky, 2002;Sturis et al., 1991; Tolic et al., 2000; Cherrington et al.,2002). The other represents the delayed effect of insulin onhepatic glucose production (Sturis et al., 1991; Tolic et al.,2000). Although ‘‘insulin regulates the liver in a directfashion’’, however, ‘‘its effect occurs within severalminutes’’ (Cherrington et al., 2002). Pioneering work onmodeling the glucose–insulin regulatory system and theultradian insulin secretory oscillations can be traced backto Bolie (1961), in which the linearized system of theglucose–insulin regulation in terms of the differentialequations of feedback was analysed with the so-calledcritical damping criteria of servomechanism theory. In thepast few decades, several mathematical models havebeen proposed to model this system (Sturis et al., 1991;Tolic et al., 2000; Engelborghs et al., 2001; Bennett andGourley, 2004).
In this paper, we propose a DDE (delay differentialequation) model by introducing two explicit time delaysand model the glucose–insulin endocrine metabolic reg-ulatory system. With the same set of experimental dataused in the existing models such as those in Sturis et al.(1991), and Tolic et al. (2000), the two time delay modelnot only confirms most of existing observations ofexperiments and models, but also demonstrates robustness,and produces simulation profiles in better agreement withphysiological data. As a result, we suspect that one of thepossibly many causes of ultradian insulin secretion oscilla-tions is the time delay of the insulin secretion stimulated bythe elevated glucose concentration.
To detect the onset of diabetes or the potential todevelop diabetes, a series of glucose tolerance tests havebeen developed over the years and applied in clinics andexperiments (Bergman et al., 1985), for examples, OralGlucose Tolerance Test (OGTT), Fasting Glucose Toler-ance Test (FGTT), Intra Venous Glucose Tolerance Test(IVGTT) and frequently sampled Intra Venous GlucoseTolerance Test (fsIVGTT). The subjects are given a largebolus of glucose and the glucose concentration is sampledin those glucose tolerance tests. Due to the initial largeamount of glucose is infused, the kinetics of the gluco-se–insulin system does not, and should not, behave thesame way as the dynamics of glucose–insulin system innormal situation. The model proposed in this paper doesnot target the situation of glucose tolerance tests.
We organize this paper as follows. In Section 2, wedescribe the glucose–insulin endocrine metabolic regula-tory system and present the two time delay model. InSection 3, we discuss the simulation profiles obtained fromthe two time delay model as well as those obtained fromthese previously existing models. In Section 4, we presentnumerical simulations of the two time delay model usingthe same experimental data used by the previous models intheir simulations. In Section 5, we discuss observationsfrom the two time delay model.
2. Modeling the glucose–insulin regulatory system and
ultradian insulin secretory oscillations
In the glucose–insulin endocrine metabolic regulatorysystem, the two pancreatic endocrine hormones, insulinand glucagon, are the primary regulatory factors. Numer-ous in vivo and in vitro experiments have revealed thatinsulin secretion consists of two oscillations occurring withdifferent time scales: rapid oscillations having a period of5–15min (Pørksen et al., 2002) and ultradian oscillationsoccurring in the period of every 50–150min (Sturis et al.,1991; Tolic et al., 2000; Simon and Brandenberger, 2002).The mechanisms underlying both types of oscillations arestill not fully understood. The rapid oscillations may arisefrom an intra-pancreatic pacemaker mechanism causing acoordination of periodic secretory bursting of insulin frompancreatic b-cells contained in the millions of Langerhansislets (Sturis et al., 1991; Tolic et al., 2000). These bursts arethe dominant mechanism of insulin release at the basallevel (Pørksen et al., 2002). This rapid oscillation is usuallysuperimposed on the slow (ultradian) oscillation (Sturiset al., 1991).The ultradian oscillations of insulin secretion are
assumed to result from an instability in the glucose–insulinendocrine metabolic regulatory system (Sturis et al., 1991;Tolic et al., 2000; Simon and Brandenberger, 2002; Mari,2002), although the precise mechanisms are still not fullyunderstood (Simon and Brandenberger, 2002). Theseultradian oscillations are best seen after meal ingestion,oral glucose intake, continuous enteral nutrition orintravenous glucose infusion (Fig. 1). In addition, muscles,the brain, nerves and other tissues continuously utilize theplasma glucose completing the regulatory system feedbackloop (Sturis et al., 1991 and its Fig. 2, Tolic et al., 2000).The hypothesis that the ultradian insulin secretion is an
instability in the glucose–insulin endocrine metabolicregulatory system has been the subject of a number ofstudies, including some which have developed a mathema-tical model of the insulin–glucose feedback system (Sturiset al., 1991; Keener and Sneyd, 1998; Tolic et al., 2000;Engelborghs et al., 2001; Bennett and Gourley, 2004).Glucose–insulin feedback loop was the major considera-tion when the six-equation ODE model was proposed bySturis et al. (1991) and simplified by Tolic et al. (2000).However, the feedback system has not been rigorously

ARTICLE IN PRESS
Glu
cose
(gm
/dl)
Insu
lin (
µU/m
l)In
sulin
(µU
/ml)
80
100
120
140
240 480 720 960 1200 1440
30
1020
40
0
50
60
100120
160
60 120 160 240
140
80
0
4060
10080
20
Glu
cose
(gm
/dl)
Glu
cose
(gm
/dl)
Insu
lin (
µU/m
l)In
sulin
(µU
/ml)
Glu
cose
(gm
/dl)
30
1020
40
0
50
100
120
140
180
160
10
20
30
40
40
80100
140120
60
min.
240 480 720 960 1200 1440
min.
240 480 720 960 1200min.
min.(A) (B)
(C) (D)
Fig. 1. Ultradian insulin secretory oscillations. Profiles for glucose and insulin for various glucose infusion rates: (A) meal ingestion; (B) oral glucose
intake; (C) continuous enteral nutrition; (D) constant glucose infusion. These figures are adapted from Sturis et al. (1991).
J. Li et al. / Journal of Theoretical Biology 242 (2006) 722–735724
proven to be the mechanism of the ultradian oscillations ofinsulin secretion.
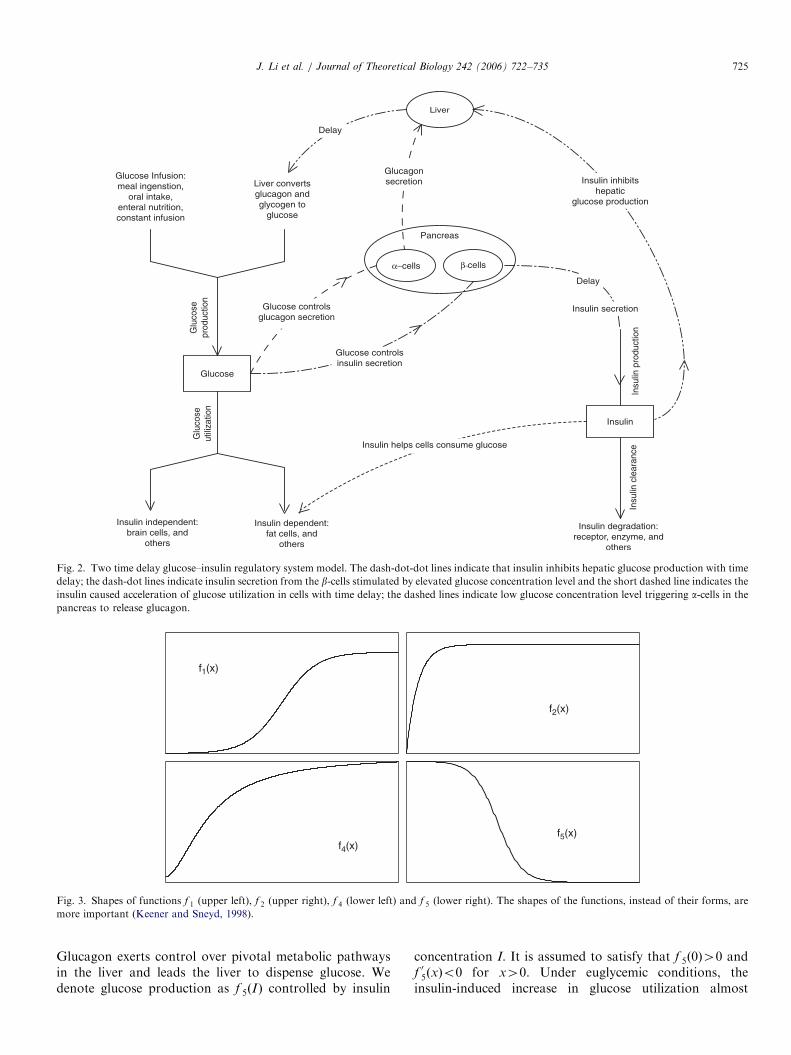
Applying the mass conservation law, similar to theapproach of Topp et al. (2000), we attempt to model theglucose–insulin endocrine metabolic regulatory systemillustrated in Fig. 2. The two major factors in theregulatory system model are glucose and insulin. Let GðtÞ
and IðtÞ be the glucose and insulin concentration at timetX0, respectively, we obtain
dGðtÞ=dt ¼ glucose production� glucose utilization,
dIðtÞ=dt ¼ insulin production� insulin clearance.
Insulin production: Insulin can only be produced from b-cell secretion, mainly in response to the elevated glucoseconcentration. Although there are other secretagogues, e.g.free fatty acid and most amino acids, glucose is the mostcritical stimulus for insulin release (Ahren and Taborsky,2002). A series of complex electric processes occur inside ofeach islet. This process includes: the entering of glucosemolecules into the islets through a glucose transporterGLUT2, the elevation of ATP:ADP, the subsequentclosing of the Kþ channels, the opening of the Ca2þ
channels and eventually the insulin exocytosis from b-cellgranules caused by the influx of Ca2þ ions (Gilon et al.,2002). We use f 1ðGÞ to stand for the insulin productionstimulated by glucose concentration G. We assume f 1ðGÞ isbounded, of sigmoidal shape, f 1ð0Þ40, f 1ðxÞ40, andf 01ðxÞ40 for x40 (refer to Fig. 3 for the shape offunction f 1).
Insulin degradation and clearance: Insulin is cleared by allinsulin sensitive tissues. Insulin degradation is mediatedprimarily by the insulin receptor with a smaller contribu-tion from non-specific processes. The liver and kidney arethe primary sites of portal insulin degradation andperipheral insulin clearance, respectively. Insulin notcleared by liver and kidney is ultimately removed by othertissues, for examples, muscle and adipose cells. The insulindegradation is a regulated process involving insulin bindingto its receptor, internalization, and degradation as in othertissues. The function of insulin clearance and degradationis to remove and inactivate circulating insulin in order tocontrol insulin action (refer to Duckworth et al., 1998).Experiments have shown that the relationship of insulindegradation is proportional to insulin concentration (Toppet al., 2000). Thus, as in Topp et al. (2000), we assume theclearance rate is a positive constant di40.
Glucose production: There are two sources for glucoseproduction. Glucose is liberated from dietary carbohy-drates such as starch or sucrose by hydrolysis within thesmall intestine, subsequently being absorbed into theblood. The most common ways of glucose infusion arethrough meal ingestion, oral glucose intake, continuousenteral nutrition, and constant glucose infusion (Sturis etal., 1991; Tolic et al., 2000) (refer to Fig. 1). We assume theinfusion rate is a constant, denoted by GinX0. The othersource of glucose production is the liver. When the plasmaglucose concentration level drops, the b-cells stop releasinginsulin, but a-cells, also located in the Langerhans islets inthe pancreas, start to release another hormone, glucagon.
ARTICLE IN PRESS
Fig. 2. Two time delay glucose–insulin regulatory system model. The dash-dot-dot lines indicate that insulin inhibits hepatic glucose production with time
delay; the dash-dot lines indicate insulin secretion from the b-cells stimulated by elevated glucose concentration level and the short dashed line indicates the
insulin caused acceleration of glucose utilization in cells with time delay; the dashed lines indicate low glucose concentration level triggering a-cells in the
pancreas to release glucagon.
f1(x)
f4(x)
f2(x)
f5(x)
Fig. 3. Shapes of functions f 1 (upper left), f 2 (upper right), f 4 (lower left) and f 5 (lower right). The shapes of the functions, instead of their forms, are
more important (Keener and Sneyd, 1998).
J. Li et al. / Journal of Theoretical Biology 242 (2006) 722–735 725
Glucagon exerts control over pivotal metabolic pathwaysin the liver and leads the liver to dispense glucose. Wedenote glucose production as f 5ðIÞ controlled by insulin
concentration I. It is assumed to satisfy that f 5ð0Þ40 andf 05ðxÞo0 for x40. Under euglycemic conditions, theinsulin-induced increase in glucose utilization almost

ARTICLE IN PRESSJ. Li et al. / Journal of Theoretical Biology 242 (2006) 722–735726
exclusively reflects the action of the hormone on muscle(Cherrington et al., 2002) instead of storing glucose asglycogen. Hence, we assume that f 5ðxÞ40 for x40. Whenthe insulin concentration level is three-fold above its basallevel, glucose production by the liver can quickly be halted(Cherrington et al., 2002, Fig. 1(B)). Therefore, we assumethat the functions f 5ðxÞ and jf
05ðxÞj are bounded above for
x40, and f 5ðxÞ rapidly decreases to zero as x increases(refer to Fig. 3 for the shape of function f 5).
Glucose utilization: Glucose utilization also consists oftwo parts, namely, insulin-independent utilization andinsulin-dependent utilization. The insulin-independent glu-cose consumers are mainly the brain and nerve cells. Wedenote this type of utilization by f 2ðGÞ indicating itsdependency on the glucose concentration level alone.Further, we assume that f 2ðxÞ40 is in sigmoidal shapewith f 2ð0Þ ¼ 0, and f 02ðxÞ40 is bounded for x40. Theinsulin-dependent glucose uptake is mostly due to muscle,fat cells and other tissues. Insulin receptors activate thesignaling cascade for GLUT4 translocation. GLUT4transporters lead glucose molecules into muscle. The cellsthen consume the glucose and convert it into energy. Wedenote the insulin-dependent glucose uptake by f 3ðGÞf 4ðIÞ.This insulin-dependent glucose utilization is accomplishedby the so-called ‘‘remote insulin’’. We may reasonablyassume that f 3ð0Þ ¼ 0, 0of 3ðxÞpk3x and f 03ðxÞ40 forx40, where k340 is a constant. Also, f 4ð0Þ40, f 4ðxÞ40and f 04ðxÞ40 are bounded above for x40. We againrequire that f 4ðxÞ has a sigmoidal shape as in Sturis et al.(1991) (refer to Fig. 3 for the shape of function f 2, and f 4).
Time delays in the system: Insulin secretion from b-cellsinvolve a series of complex electric processes occurringinside of each islet. These processes primarily includefollowing steps: the entering of glucose molecules into theislets through a glucose transporter GLUT2, the elevationof ATP:ADP, the subsequent closing of the Kþ channels,the opening of the Ca2þ channels and eventually the insulinexocytosis from b-cell granules caused by the influx of Ca2þ
ions (Gilon et al., 2002). Due to this chain of events, a timedelay in responding to the stimulation of elevated glucoseconcentration exists. Insulin release has effects on bothhepatic glucose production and insulin-dependent glucoseutilization (Cherrington et al., 2002). It takes certain timefor the newly synthesized insulin to cross the endothelialbarrier and eventually become the so-called ‘‘remote
insulin’’, then help to uptake glucose. This total delay timeis approximately over the range of 5–15min (Sturis et al.,1991; Tolic et al., 2000; Cherrington et al., 2002). We use t1to denote this total time delay from the time that theglucose concentration level is elevated to the moment thatthe insulin has been transported to interstitial space andbecomes ‘‘remote insulin’’. Thus, insulin secretion can beapproximated by f 1ðGðt� t1ÞÞ with time delay t140.
Another time lag in the system is the delay of the effectof hepatic glucose production. In healthy people, thepancreas continually measures blood glucose levels andresponds by secreting just the right amount of insulin to
adjust blood glucose levels. Insulin has both inhibitoryeffect on hepatic glucose production via insulin secretion,and recovery effect of hepatic glucose production frominsulin suppression. Although ‘‘insulin regulates the liver ina direct fashion’’, however, its effect takes several minutesto occur (Cherrington et al., 2002). This suggests a time lagfor insulin effect on liver exists. However, both length ofthe delay and its pathway remain unknown. According tothe in vivo experiments performed by Prager et al. (1986),under different insulin infusion rate, the time to reach thehalf-maximal suppression is between 11 and 22min, whilethe time to reach the half-maximal recovery is in the rangefrom 54 to 119min (Prager et al., 1986, p. 477, Table III). Itwas also observed that it took 15min for glucoseproduction rate to peak after the portal insulin was madedeficient in an in vivo experiment using overnight fastedconscious dogs (Cherrington et al., 2002). Based on thedata in Prager et al. (1986), we can state that the length ofthis delay varies significantly in different subjects, from justa few minutes to a much longer time. So, most likely, thelength of this delay is longer than the delay that t1represents. We use t2 to represent the time taken fornoticeable insulin effect on liver to occur. This is measuredfrom the time that insulin has become ‘‘remote insulin’’ tothe moment that a significant (e.g. half-maximal) change ofhepatic glucose production takes place. Thus, functionf 5ðIðt� t2ÞÞ represents the delayed hepatic glucose produc-tion, indicating that the production is controlled by insulinwith time delay t240.
Two time delay model: By introducing two explicit timedelays t1 and t2 in the system, with the above notations, themodel we propose here takes the form of
G0ðtÞ ¼ Gin � f 2ðGðtÞÞ � f 3ðGðtÞÞf 4ðIðtÞÞ þ f 5ðIðt� t2ÞÞ;
I 0ðtÞ ¼ f 1ðGðt� t1ÞÞ � diIðtÞ;
(
(1)
with the initial conditions Ið0Þ ¼ I040, Gð0Þ ¼G040;GðtÞ � G0 for t 2 ½�t1; 0� and IðtÞ � I0 fort 2 ½�t2; 0�, t1; t240.We take the functions, f i; i ¼ 1; 2; 3; 4; 5; used in Sturis et
al. (1991), Tolic et al. (2000) and Bennett and Gourley(2004) for numerical analysis. These functions take thefollowing forms with experimentally determined para-meters given in Table 1 (Sturis et al., 1991; Tolic et al.,2000). The shapes of the functions, instead of their forms,are more important (Keener and Sneyd, 1998)
f 1ðGÞ ¼ Rm=ð1þ expððC1 � G=VgÞ=a1ÞÞ, (2)
f 2ðGÞ ¼ Ubð1� expð�G=ðC2V gÞÞÞ, (3)
f 3ðGÞ ¼ G=ðC3V gÞ, (4)
f 4ðIÞ ¼ U0 þ ðUm �U0Þ=
ð1þ expð�b lnðI=C4ð1=V i þ 1=ðEtiÞÞÞÞÞ, ð5Þ
f 5ðIÞ ¼ Rg=ð1þ expðaðI=Vp � C5ÞÞÞ. (6)

ARTICLE IN PRESS
Table 1
Parameters of the functions in (2)–(6)
Parameters Units Values
Vg l 10
Rm mUmin�1 210
a1 mg l�1 300
C1 mg l�1 2000
Ub mgmin�1 72
C2 mg l�1 144
C3 mg l�1 1000
Vp l 3
Vi l 11
E l min�1 0.2
U0 mgmin�1 40
Um mgmin�1 940
b 1.77
C4 mU l�1 80
Rg mgmin�1 180
a l mU�1 0.29
C5 mU l�1 26
tp min 6
ti min 100
td min 36
J. Li et al. / Journal of Theoretical Biology 242 (2006) 722–735 727
Notice that the units of G and I are mg and mU,respectively, in the functions (2)–(6). These are convertedto mg/dl and mU=ml when plotting the figures in allsimulations excluding those which include plots of theperiods.
Fig. 4 exhibits the profiles obtained from the two timedelay model (1) with different parameter values. Thesimulations in Fig. 4 exhibit that the oscillations of theglucose–insulin regulatory system model (1) are self-sustained. It also exhibits that the two time delay modelis robust as the wide range selections of the parameters, forexample, t2 can be as small as 4.5min and it can be as largeas 36min. While Sturis et al. (1991) and Tolic et al. (2000)chose to estimate this delay by the amount of 36min, it islikely (as seen by data in Prager et al., 1986) that therecould be a great deal of variation from this level, bothbetween various individuals and differing insulin infusionrates. However, for the model in Sturis et al. (1991), self-sustained oscillations occurred only if the hepatic glucoseproduction delay is within 25–50min. Hence, a model thatis robust to a wide range of values for t2 is highly desirable.
Fig. 5 demonstrates the time course of glucoseconcentration, insulin concentration, insulin secretionrate (ISR), insulin-dependent glucose clearance rate, andhepatic glucose production rate as simulated by the twodelay model when t1 ¼ 7 min, t2 ¼ 12 min, Gin ¼
1:08mg=dl min and di ¼ 0:06min�1. The self-sustainedoscillation is clearly shown with period � 110 min. Sinceour goal of this paper is to model the self-sustainedoscillatory behavior of the system and ultradian insulinsecretion, the time course shown in Fig. 5 starts from thesecond cycle so that the noise caused by the artifact initial
conditions of (1) can be filtered out. The simulationdemonstrates that increasing glucose concentrationcauses IRS to increase (A is precedent of B) and theincrease is slightly ahead of insulin concentration increases(B is in front of D). When IRS increases, the liver issignaled and stops its glucose production quickly (areapointed by E). Insulin-dependent glucose clearance isalmost in synch with ISR and insulin concentration (C isbetween B and D).As compared with the models in Sturis et al. (1991),
Tolic et al. (2000), Engelborghs et al. (2001) and Bennettand Gourley (2004), we have removed the insulincompartment split effort in which Sturis et al. (1991),Tolic et al. (2000) and Bennett and Gourley (2004)mimic the delayed insulin-dependent glucose uptake byapplying so-called first-order kinetics. Also, we havekept the time delay t2 of insulin effect on liver in Bennettand Gourley (2004) and Engelborghs et al. (2001) whichreplaces the third-order kinetics (represented by a chain ofthree intermediate variables linking plasma insulin toglucose production) used in Sturis et al. (1991) and Tolicet al. (2000). Slightly differently, we measure t2 from thetime that insulin has become ‘‘remote insulin’’ to themoment that hepatic glucose production takes significanteffect.The two delay model (1) is suitable to simulate the case
of continuous enteral nutrition and constant glucoseinfusion. The infusion rate in such cases can be consideredas a constant.When testing for insulin sensitivity during an IVGTT, a
subject is infused with a large bolus of glucose (0.3 g/kg)following an overnight fast (Bergman et al., 1985). A largebolus of glucose stimulus initiates a biphasic release ofinsulin. The first phase consists of a rapid (within 2min)but short-lasting secretion of insulin, followed (after5–10min) by a larger and up to 4 h secretion of insulin(Bergman et al., 1985; Cherrington et al., 2002; Ahrenand Taborsky, 2002). While it is physiologically importantin testing insulin sensitivity, the two distinct phases ofinsulin secretion are less apparent under non-abruptglucose changes. For situations where the glucose entersthe bloodstream more slowly, such as during the con-sumption of a carbohydrate meal, continuous glucoseinfusion and enteral nutrition uptake, the absorptionof glucose into the circulation is not fast enough todistinguish the initial phase of insulin secretion (Ahrenand Taborsky, 2002). As in the other aforementionedmodels, we do not include this biphasic insulin releasein our two time delay model as we are attempting tomodel the glucose–insulin metabolic system underconditions of continuous enteral nutrition and constantglucose infusion. The most widely used mathematicalmodel for the biphasic kinetics is the so-called ‘‘Minimal
Model’’ (Bergman et al., 1985; Bergman, 2002). Severalother models were proposed recently (DeGaetanoand Arino, 2000; Li et al., 2001; Mukhopadhyay et al.,2004).

ARTICLE IN PRESS
Fig. 4. Profiles of two delay model (1) with different parameters. Self-sustained oscillations by model (1) when t1 ¼ 5; t2 ¼ 4:5;Gin ¼ 0:54; di ¼ 0:06 (left)
and t1 ¼ 6; t2 ¼ 36;Gin ¼ 1:35; di ¼ 0:06 (right).
A
D
B
C
E
Fig. 5. Time course of glucose concentration, insulin concentration,
insulin secretion rate (ISR), hepatic glucose production and insulin-
dependent glucose clearance when t1 ¼ 7 min, t2 ¼ 12 min, Gin ¼
1:08mg=dl min and di ¼ 0:06min�1.
J. Li et al. / Journal of Theoretical Biology 242 (2006) 722–735728
3. Comparison of the two time delay model with existing
models
This section discusses the currently existing models: anODE (ordinary differential equation) model proposed bySturis et al. (1991) and simplified by Tolic et al. (2000), asingle explicit time delay DDE model proposed byEngelborghs et al. (2001) without an insulin compartmentsplit, another single explicit time delay DDE modelproposed by Bennett and Gourley (2004) containing aninsulin compartment split, and two alternative DDEmodels with explicit time delay(s). We then comparethe simulation profiles obtained from all these modelswith that from the two time delay model (1) proposed inSection 2.
3.1. Negative feedback ODE models
To determine whether the ultradian oscillations couldresult from the interaction between insulin and glucose, anODE model consisting of six equations including the majormechanisms involved in glucose regulation was developedby Sturis et al. (1991) and recently simplified by Tolic et al.(2000). The purpose of these two models was to investigatea possible mechanism for the origin of the ultradian insulinsecretion sustained oscillations. Included in this model isthe feedback loop (refer to Fig. 2 in Sturis et al., 1991):glucose stimulates pancreatic insulin secretion, insulinstimulates glucose uptake and inhibits hepatic glucoseproduction, and glucose enhances its own uptake. Themodel takes the following form:
G0ðtÞ ¼ Gin � f 2ðGðtÞÞ � f 3ðGðtÞÞf 4ðI iðtÞÞ þ f 5ðx3Þ;
I 0pðtÞ ¼ f 1ðGðtÞÞ � EðIpðtÞ=V p � I iðtÞ=ViÞ � IpðtÞ=tp;
I 0iðtÞ ¼ EðIpðtÞ=Vp � I iðtÞ=V iÞ � I iðtÞ=ti;
x01ðtÞ ¼ 3ðIp � x1Þ=td ;
x02ðtÞ ¼ 3ðx1 � x2Þ=td ;
x03ðtÞ ¼ 3ðx2 � x3Þ=td ;
8>>>>>>>>><>>>>>>>>>:
(7)
where GðtÞ is the amount of glucose, IpðtÞ and I iðtÞ are theamount of insulin in the plasma and the intercellular space,respectively, Vp is the plasma insulin distribution volume,Vi is the effective volume of the intercellular space, E is thediffusion transfer rate, tp and ti are the insulin degradationtime constants in the plasma and intercellular space,respectively, Gin indicates the (exogenous) glucose supplyrate to the plasma, and x1ðtÞ; x2ðtÞ and x3ðtÞ are threeauxiliary variables associated with certain delays of theinsulin effect on the hepatic glucose production havingtotal time td .
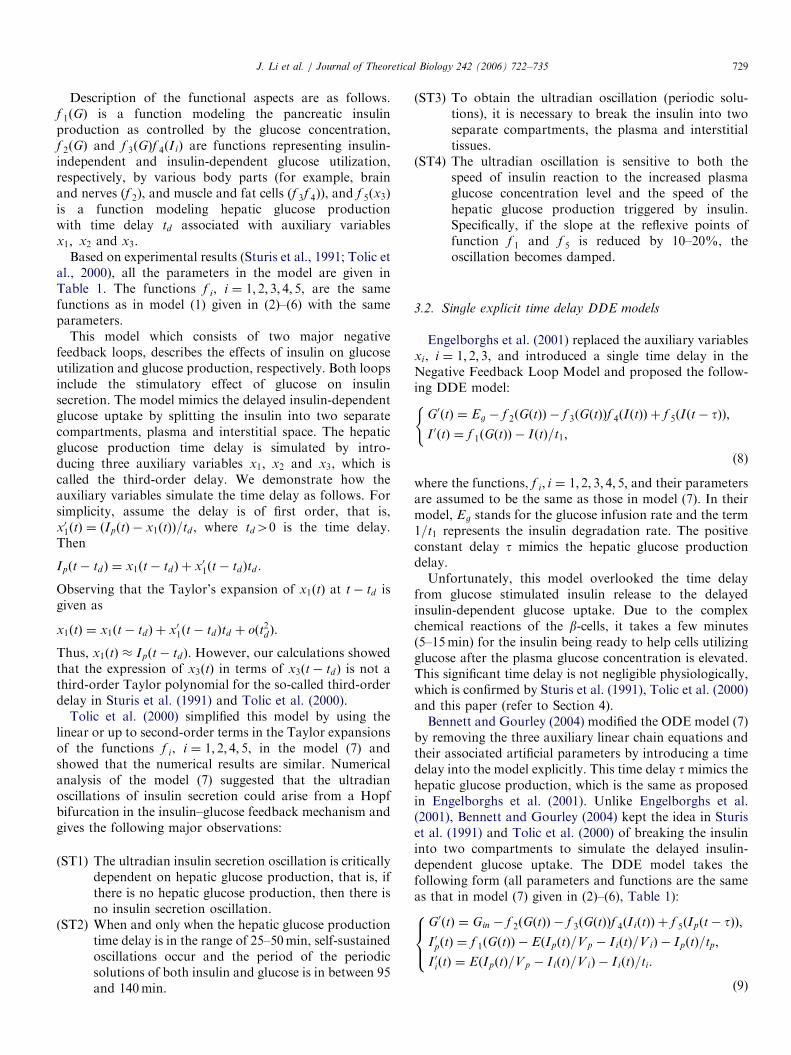
ARTICLE IN PRESSJ. Li et al. / Journal of Theoretical Biology 242 (2006) 722–735 729
Description of the functional aspects are as follows.f 1ðGÞ is a function modeling the pancreatic insulinproduction as controlled by the glucose concentration,f 2ðGÞ and f 3ðGÞf 4ðI iÞ are functions representing insulin-independent and insulin-dependent glucose utilization,respectively, by various body parts (for example, brainand nerves (f 2), and muscle and fat cells (f 3f 4)), and f 5ðx3Þ
is a function modeling hepatic glucose productionwith time delay td associated with auxiliary variablesx1; x2 and x3.
Based on experimental results (Sturis et al., 1991; Tolic etal., 2000), all the parameters in the model are given inTable 1. The functions f i, i ¼ 1; 2; 3; 4; 5, are the samefunctions as in model (1) given in (2)–(6) with the sameparameters.
This model which consists of two major negativefeedback loops, describes the effects of insulin on glucoseutilization and glucose production, respectively. Both loopsinclude the stimulatory effect of glucose on insulinsecretion. The model mimics the delayed insulin-dependentglucose uptake by splitting the insulin into two separatecompartments, plasma and interstitial space. The hepaticglucose production time delay is simulated by intro-ducing three auxiliary variables x1; x2 and x3, which iscalled the third-order delay. We demonstrate how theauxiliary variables simulate the time delay as follows. Forsimplicity, assume the delay is of first order, that is,x01ðtÞ ¼ ðIpðtÞ � x1ðtÞÞ=td , where td40 is the time delay.Then
Ipðt� td Þ ¼ x1ðt� tdÞ þ x01ðt� tdÞtd .
Observing that the Taylor’s expansion of x1ðtÞ at t� td isgiven as
x1ðtÞ ¼ x1ðt� tdÞ þ x01ðt� tdÞtd þ oðt2dÞ.
Thus, x1ðtÞ � Ipðt� tdÞ. However, our calculations showedthat the expression of x3ðtÞ in terms of x3ðt� tdÞ is not athird-order Taylor polynomial for the so-called third-orderdelay in Sturis et al. (1991) and Tolic et al. (2000).
Tolic et al. (2000) simplified this model by using thelinear or up to second-order terms in the Taylor expansionsof the functions f i, i ¼ 1; 2; 4; 5, in the model (7) andshowed that the numerical results are similar. Numericalanalysis of the model (7) suggested that the ultradianoscillations of insulin secretion could arise from a Hopfbifurcation in the insulin–glucose feedback mechanism andgives the following major observations:
(ST1)
The ultradian insulin secretion oscillation is criticallydependent on hepatic glucose production, that is, ifthere is no hepatic glucose production, then there isno insulin secretion oscillation.(ST2)
When and only when the hepatic glucose productiontime delay is in the range of 25–50min, self-sustainedoscillations occur and the period of the periodicsolutions of both insulin and glucose is in between 95and 140min.(ST3)
To obtain the ultradian oscillation (periodic solu-tions), it is necessary to break the insulin into twoseparate compartments, the plasma and interstitialtissues.(ST4)
The ultradian oscillation is sensitive to both thespeed of insulin reaction to the increased plasmaglucose concentration level and the speed of thehepatic glucose production triggered by insulin.Specifically, if the slope at the reflexive points offunction f 1 and f 5 is reduced by 10–20%, theoscillation becomes damped.3.2. Single explicit time delay DDE models
Engelborghs et al. (2001) replaced the auxiliary variablesxi, i ¼ 1; 2; 3, and introduced a single time delay in theNegative Feedback Loop Model and proposed the follow-ing DDE model:
G0ðtÞ ¼ Eg � f 2ðGðtÞÞ � f 3ðGðtÞÞf 4ðIðtÞÞ þ f 5ðIðt� tÞÞ;
I 0ðtÞ ¼ f 1ðGðtÞÞ � IðtÞ=t1;
(
(8)
where the functions, f i; i ¼ 1; 2; 3; 4; 5; and their parametersare assumed to be the same as those in model (7). In theirmodel, Eg stands for the glucose infusion rate and the term1=t1 represents the insulin degradation rate. The positiveconstant delay t mimics the hepatic glucose productiondelay.Unfortunately, this model overlooked the time delay
from glucose stimulated insulin release to the delayedinsulin-dependent glucose uptake. Due to the complexchemical reactions of the b-cells, it takes a few minutes(5–15min) for the insulin being ready to help cells utilizingglucose after the plasma glucose concentration is elevated.This significant time delay is not negligible physiologically,which is confirmed by Sturis et al. (1991), Tolic et al. (2000)and this paper (refer to Section 4).Bennett and Gourley (2004) modified the ODE model (7)
by removing the three auxiliary linear chain equations andtheir associated artificial parameters by introducing a timedelay into the model explicitly. This time delay tmimics thehepatic glucose production, which is the same as proposedin Engelborghs et al. (2001). Unlike Engelborghs et al.(2001), Bennett and Gourley (2004) kept the idea in Sturiset al. (1991) and Tolic et al. (2000) of breaking the insulininto two compartments to simulate the delayed insulin-dependent glucose uptake. The DDE model takes thefollowing form (all parameters and functions are the sameas that in model (7) given in (2)–(6), Table 1):
G0ðtÞ ¼ Gin � f 2ðGðtÞÞ � f 3ðGðtÞÞf 4ðI iðtÞÞ þ f 5ðIpðt� tÞÞ;
I 0pðtÞ ¼ f 1ðGðtÞÞ � EðIpðtÞ=V p � I iðtÞ=ViÞ � IpðtÞ=tp;
I 0iðtÞ ¼ EðIpðtÞ=Vp � I iðtÞ=V iÞ � I iðtÞ=ti:
8><>:
(9)
ARTICLE IN PRESSJ. Li et al. / Journal of Theoretical Biology 242 (2006) 722–735730
The major analytical results of this model were asufficient condition for global asymptotical stabilityinduced by a Liapunov function for the case that thehepatic glucose production time delay satisfied t ¼ 0 andfor the case of t40. This analytical result shows that:
(BG1)
If the hepatic glucose production time delay t andthe insulin transfer time between the plasma andinterstitial compartments ti and tp are sufficientlysmall, then solutions converge globally to the steadystate or the basal levels of glucose and insulin. Inother words, there are no sustained oscillations. Forlarger delay, whose range is not given, sustainedoscillatory solutions become possible and underthese circumstances it seems that likely candidatesfor having sustainable oscillatory insulin andglucose levels are those subjects with slower transferrates of the two insulin compartments.(BG2)
The oscillation could not be sustained if the hepaticglucose production rate Rg is too small.3.3. Alternative explicit time delay DDE models
We also discuss in this paper two alternative approachesin modeling the glucose–insulin regulatory system. In firstalternative approach, we keep one explicit time delay t1 asthat in the two time delay model (1), but mimic the hepaticglucose production time delay by variable chain as inmodel (7) (Sturis et al., 1991; Tolic et al., 2000). Thealternative model with single explicit delay is given as
G0ðtÞ ¼ Gin � f 2ðGðtÞÞ � f 3ðGðtÞÞf 4ðIðtÞÞ þ f 5ðx3Þ;
I 0ðtÞ ¼ f 1ðGðt� t1ÞÞ � diIðtÞ;
x01ðtÞ ¼ 3ðI � x1Þ=td ;
x02ðtÞ ¼ 3ðx1 � x2Þ=td ;
x03ðtÞ ¼ 3ðx2 � x3Þ=td :
8>>>>>><>>>>>>:
(10)
In another alternative approach, we model the effect oftime delay t1 in glucose utilization by f 3ðGðtÞÞf 4ðIðt� t1ÞÞ.This results in the following alternative model with twoexplicit delays:
G0ðtÞ ¼ Gin � f 2ðGðtÞÞ � f 3ðGðtÞÞf 4ðIðt� t1ÞÞ
þf 5ðIðt� t2ÞÞ;
I 0ðtÞ ¼ f 1ðGðtÞÞ � diIðtÞ:
8><>: (11)
The notations in the model (10) and (11) have the samemeanings as those in the models discussed in previoussections. The simulations in the next subsection will showthat the profiles produced from these models are not as wellfit to experiment observations as the profile created by thetwo time delay model (1).
3.4. Comparison
In this subsection, we compare the temporal profiles ofthe two time delay model (1) with the profiles produced by
the ODE model (7) as well as models (9)–(11). Glucoseconcentration level can range from 40 to 180mg/dl innormal individuals following meal consumption while thenormal insulin concentration level can vary from 5 to50mU=ml. However, normal values of plasma glucoseconcentration levels for a normal subject are between 70and 109mg/dl before a meal, or below 120mg/dl 2 h aftereating a meal.Using the same experimental data from Table 1 used in
Sturis et al. (1991) and Tolic et al. (2000), we performedsimulations on the above models with Matlab 6.5 (exclud-ing model (8) due to its lack of physiological applicability).With two different sets of parameters, Figs. 6 and 7 showthe simulation profiles of glucose and insulin concentrationproduced by the two time delay model (1) (thick solidcurve), ODE model (7) (dotted-dashed curve), singleexplicit time delay model (9) (dotted curve), the twoalternative model (10) (dashed curve) and (11) (thin solidcurve).It is clearly shown in Fig. 6 that the profile from two time
delay model (1) shows self-sustained oscillation. The profileproduced by the alternative model (10) with single explicitdelay is almost as good as the profile produced by two timedelay model (1). All other models apparently do notproduce self-sustained oscillations. Notice that the explicitdelay t1 in model (10) presents the same time lag as that inmodel (1), while t1 in model (11) represents glucoseutilization delay only. This suggests that the time delayfrom insulin secretion stimulated by glucose to the insulinbecoming ‘‘remote insulin’’ is not negligible, especially, thedelay of insulin secretion triggered by elevated glucoseplays a key role. Therefore, we suspect that one of thepossibly many causes of ultradian insulin secretion oscilla-tions is the time delay of the insulin secretion stimulated bythe elevated glucose concentration.In Fig. 7, the profiles from all models demonstrate self-
sustained oscillations. However, normally, the glucoseconcentration of normal subjects is within the range from70 to 109mg/dl except some abundant glucose infusion,e.g. meal ingestion. At such constant infusion, the profileobtained from two time delay model (1) is withinphysiological reasonable range. The profiles produced bythe ODE model (7) and single delay model (9) are slightlyout of physiological reasonable range. Apparently, thesetwo figures indicate that the two time delay model is morerobust and possibly more accurate.
4. Numerical simulations of two time delay model
We used DDE23 in Matlab 6.5 (Shampine andThompson , 2001) to perform the simulations for the twotime delay model (1). The results of our intensivesimulations reveal profiles in good agreement with physio-logical findings, confirm most of the observations by Sturiset al. (1991), Tolic et al. (2000) and Bennett and Gourley(2004) and provide additional observable insights. Thesimulations focus on detecting bifurcation points on a

ARTICLE IN PRESS
Fig. 7. Glucose (left) and insulin (right) concentration solution curves produced by the five models when t1 ¼ 7 min, t2 ¼ 36 min, Gin ¼ 1:35mg=ðdl minÞ
and di ¼ 0:06min�1. In model (7), td ¼ t2 ¼ 12. In model (9), t ¼ t2 ¼ 12.
Fig. 6. Glucose (left) and insulin (right) concentration solution curves produced by the five models when t1 ¼ 7 min, t2 ¼ 12 min, Gin ¼ 1:08mg=ðdl minÞ
and di ¼ 0:06min�1. In model (7), td ¼ t2 ¼ 12. In model (9), t ¼ t2 ¼ 12.
J. Li et al. / Journal of Theoretical Biology 242 (2006) 722–735 731
single parameter of the four parameters: delay parametert2 ðminÞ, t1 ðminÞ, constant glucose infusion rate Gin (mg/dl/min) and insulin degradation rate di ðmin�1Þ. Unless aparameter is taken as the bifurcation parameter, theparameter values are assumed as t2 ¼ 12 min, t1 ¼7 min, Gin ¼ 1:08mg=dl min and di ¼ 0:06min�1.
4.1. Delay parameter t2
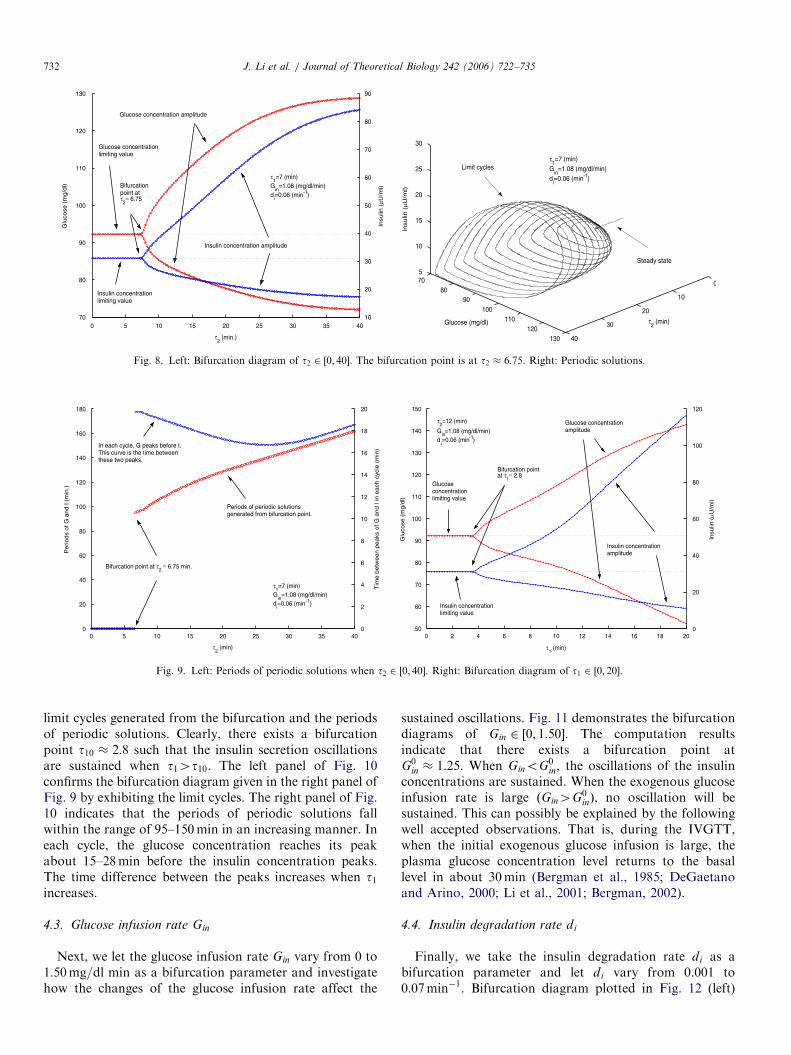
We first take the delay t2 as the bifurcation parameter.The simulation results are shown in Figs. 8 and 9 (left).According to Fig. 8, while t2 changes from 0 to 40, abifurcation point is detected at t2 � 6:75. It is clearlydemonstrated that the oscillation is sustained whent2 2 ð6:75; 40�. Furthermore, the amplitudes of glucoseconcentration are within the range of euglycemia. Fig. 9
(left) shows that in each cycle of the oscillation, the glucoseconcentration peaks before the insulin concentrationapproximately 17–20min. All of the above simulatedfindings are in good agreement with the experimental data(Sturis et al., 1991; Tolic et al., 2000; Simon andBrandenberger, 2002). In the same figure, the periods ofthe periodic solutions generated from the bifurcation are inthe interval of [95, 155] when t2 2 ð6:75; 40Þ and the periodincreases when t2 increases. This confirms observation(ST2) in Sturis et al. (1991) and Tolic et al. (2000).
4.2. Insulin secretion and glucose utilization time delay t1
We take delay parameter t1 as a bifurcation parameter.We let t1 change in [0, 20]. The right panel of Fig. 9 is thebifurcation diagram of t1 and Fig. 10 demonstrates the
ARTICLE IN PRESS
Fig. 8. Left: Bifurcation diagram of t2 2 ½0; 40�. The bifurcation point is at t2 � 6:75. Right: Periodic solutions.
Fig. 9. Left: Periods of periodic solutions when t2 2 ½0; 40�. Right: Bifurcation diagram of t1 2 ½0; 20�.
J. Li et al. / Journal of Theoretical Biology 242 (2006) 722–735732
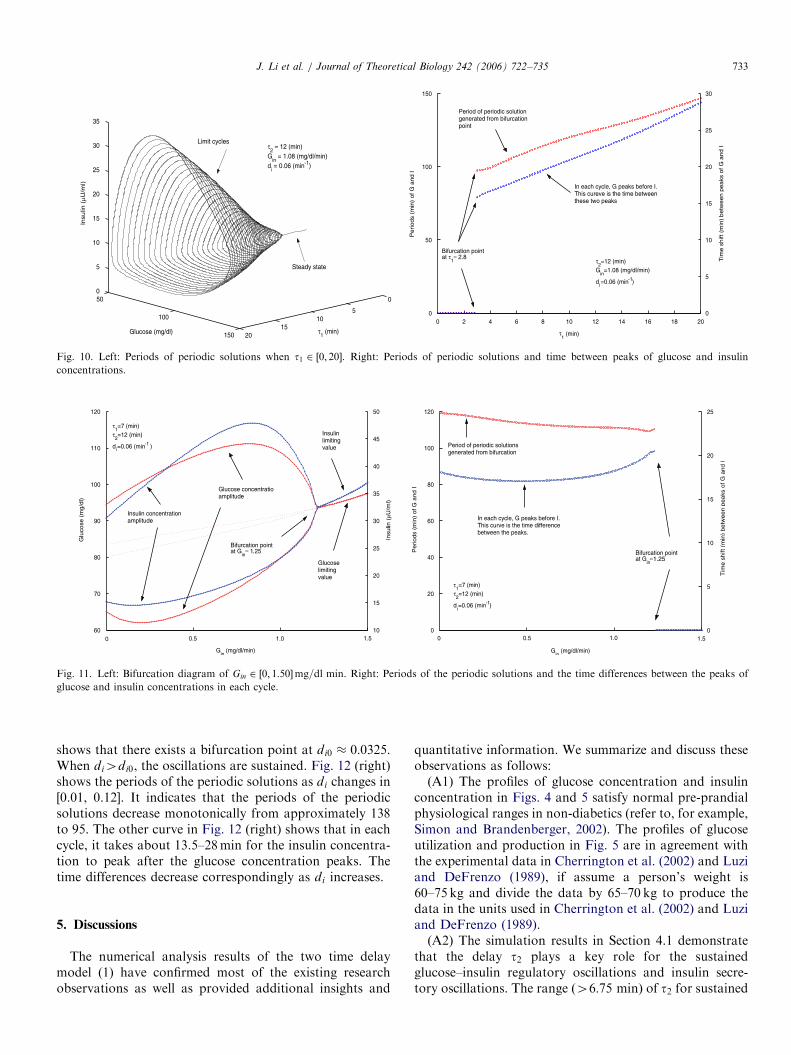
limit cycles generated from the bifurcation and the periodsof periodic solutions. Clearly, there exists a bifurcationpoint t10 � 2:8 such that the insulin secretion oscillationsare sustained when t14t10. The left panel of Fig. 10confirms the bifurcation diagram given in the right panel ofFig. 9 by exhibiting the limit cycles. The right panel of Fig.10 indicates that the periods of periodic solutions fallwithin the range of 95–150min in an increasing manner. Ineach cycle, the glucose concentration reaches its peakabout 15–28min before the insulin concentration peaks.The time difference between the peaks increases when t1increases.
4.3. Glucose infusion rate Gin
Next, we let the glucose infusion rate Gin vary from 0 to1:50mg=dl min as a bifurcation parameter and investigatehow the changes of the glucose infusion rate affect the
sustained oscillations. Fig. 11 demonstrates the bifurcationdiagrams of Gin 2 ½0; 1:50�. The computation resultsindicate that there exists a bifurcation point atG0
in � 1:25. When GinoG0in, the oscillations of the insulin
concentrations are sustained. When the exogenous glucoseinfusion rate is large ðGin4G0
inÞ, no oscillation will besustained. This can possibly be explained by the followingwell accepted observations. That is, during the IVGTT,when the initial exogenous glucose infusion is large, theplasma glucose concentration level returns to the basallevel in about 30min (Bergman et al., 1985; DeGaetanoand Arino, 2000; Li et al., 2001; Bergman, 2002).
4.4. Insulin degradation rate di
Finally, we take the insulin degradation rate di as abifurcation parameter and let di vary from 0.001 to0:07min�1. Bifurcation diagram plotted in Fig. 12 (left)
ARTICLE IN PRESS
Fig. 10. Left: Periods of periodic solutions when t1 2 ½0; 20�. Right: Periods of periodic solutions and time between peaks of glucose and insulin
concentrations.
Fig. 11. Left: Bifurcation diagram of Gin 2 ½0; 1:50�mg=dl min. Right: Periods of the periodic solutions and the time differences between the peaks of
glucose and insulin concentrations in each cycle.
J. Li et al. / Journal of Theoretical Biology 242 (2006) 722–735 733
shows that there exists a bifurcation point at di0 � 0:0325.When di4di0, the oscillations are sustained. Fig. 12 (right)shows the periods of the periodic solutions as di changes in[0.01, 0.12]. It indicates that the periods of the periodicsolutions decrease monotonically from approximately 138to 95. The other curve in Fig. 12 (right) shows that in eachcycle, it takes about 13.5–28min for the insulin concentra-tion to peak after the glucose concentration peaks. Thetime differences decrease correspondingly as di increases.
5. Discussions
The numerical analysis results of the two time delaymodel (1) have confirmed most of the existing researchobservations as well as provided additional insights and
quantitative information. We summarize and discuss theseobservations as follows:(A1) The profiles of glucose concentration and insulin
concentration in Figs. 4 and 5 satisfy normal pre-prandialphysiological ranges in non-diabetics (refer to, for example,Simon and Brandenberger, 2002). The profiles of glucoseutilization and production in Fig. 5 are in agreement withthe experimental data in Cherrington et al. (2002) and Luziand DeFrenzo (1989), if assume a person’s weight is60–75 kg and divide the data by 65–70 kg to produce thedata in the units used in Cherrington et al. (2002) and Luziand DeFrenzo (1989).(A2) The simulation results in Section 4.1 demonstrate
that the delay t2 plays a key role for the sustainedglucose–insulin regulatory oscillations and insulin secre-tory oscillations. The range ð46:75 minÞ of t2 for sustained

ARTICLE IN PRESS
Fig. 12. Left: Bifurcation diagram of di 2 ½0:01; 0:12�min�1. Right: Periods of the periodic solutions and the time differences between the peaks of glucose
and insulin concentrations in each cycle.
J. Li et al. / Journal of Theoretical Biology 242 (2006) 722–735734
oscillation and the periods (95–155min) of periodicsolutions are in agreement with observed experimentaldata (Sturis et al., 1991; Tolic et al., 2000). Simulations alsoshow that in each cycle the time between the glucoseconcentration peak and insulin concentration peak is in therange of 17–20min. This quantifies the statement ‘‘slightadvance of the glucose oscillation compared with theinsulin oscillation’’ in Sturis et al. (1991).
(A3) The simulations in Section 4.2 indicate that the timedelay t1, as well as the time delay t2, play a key role in theoscillatory regulation of the glucose–insulin metabolicsystem. When t1 is between 5 and 15min, the amplitudeis between 65 and 125mg/dl. These simulations are inagreement with previous experiments (Sturis et al., 1991;Simon and Brandenberger, 2002 and references therein).
(A4) According to the numerical simulations using theconstant glucose infusion rate Gin as a parameter in Section4.3, for low infusion rates, the amplitude of glucoseconcentration can be as low as that of the hypoglycemicrange. When the infusion rate is larger, the steady statebecomes stable.
(A5) The simulations of Section 4.4 (right) show thatlarge insulin degradation rates correspond to quickerinsulin concentration peaks following the peaks of glucoseconcentration. Fig. 12 (left) shows that glucose concentra-tion is at higher levels when the insulin degradation ratebecomes larger.
(A6) It is clear that during one cycle of the insulin andglucose concentration oscillations, the insulin concentra-tion level peaks subsequent to the glucose concentrationlevel. This reflects the physiological fact that glucosestimulates insulin secretion. On the other hand, the glucoseconcentration level decays before the insulin concentrationlevel does. This reflects the phenomena that higher insulinconcentration increases glucose uptake by the cells. Oursimulations quantify the time of the two peaks in each cycleas approximately 20min.
(A7) The statement ‘‘ti and tp are small’’ in (BG1) impliesthat the insulin degradation rate di in the two time delaymodel (1) is large. Our simulation (Fig. 12) reveals that, ifdi4di0 � 0:0325, then the model (1) can have a sustainedperiodic solution. This observation is in agreement with(BG1).(A8) When we let t1 ¼ 0 or t2 ¼ 0, our simulations show
that the system does not have sustained oscillations whenthe other delay parameter is not large (t2446 or t1418).This confirms observations (ST1) and (ST3) in Sturis et al.(1991) and Tolic et al. (2000). Hence, the extra effort ofsplitting insulin into two compartments is reduced byintroducing the time delay explicitly.(A9) According to the profiles in Figs. 6 and 7, and our
intensive simulations, the ODE model (7) and the singledelay model (9) behave very similarly. The alternative twodelay model (11) is somewhat more robust. The alternativesingle delay model (10) is even more robust and is almost asgood as the two delay model (1). With wide delayparameter ranges, the two delay model (1) produces bestdynamics in more reasonable physiological range that arein agreement with experimental data. Notice that theposition of the delay parameter t1 in these models, if thereis any, it suggests that the time delay from insulin secretionstimulated by glucose to the insulin becoming ‘‘remote
insulin’’ plays a key role for self-sustained oscillation in theglucose–insulin regulatory system. Thus it is not onlysignificant, but also has to be in the term reflecting theinsulin secretion triggered by glucose concentration. Thus,we suspect that one of the possibly many causes ofultradian insulin secretion oscillations is due to the timedelay of the insulin secretion stimulated by the elevatedglucose concentration.Observable delay effects are often gradual (distributed)
and smooth in most physiological systems, it is thus naturalto utilize distributed delay parameters rather than discretedelays when modeling these systems. In other words,

ARTICLE IN PRESSJ. Li et al. / Journal of Theoretical Biology 242 (2006) 722–735 735
discrete delay is often a simplification of the complicatedphysiology process that is almost always best representedby smooth (continuous and distributed) delay. However,mathematically, a single discrete delay alone can oftengenerate rich dynamics that enable and facilitate non-trivial and interesting biological observations as evidencedby this work. Nevertheless, we plan to pursue additionalstudies on the glucose–insulin regulatory system and theultradian insulin secretory oscillations through models withdistributed time delays.
Acknowledgments
The authors deeply thank the anonymous refereesfor their valuable suggestions. The first author thanksDr. Shenshen Kong, Dr. Yankai Jia and Dr. Guoya Li fordiscussions in physiology.
References
Ahren, B., Taborsky Jr., G.J., 2002. B-cell function and insulin secretion.
In: Porte, D., Sherwin, R.S., Baron, A. (Eds.), Ellenberg and Rifkin’s
Diabetes Mellitus, sixth ed. McGraw-Hill Professional, New York,
pp. 43–65 (Chapter 4).
Bennett, D.L., Gourley, S.A., 2004. Asymptotic properties of a delay
differential equation model for the interaction of glucose with the
plasma and interstitial insulin. Appl. Math. Comput. 151, 189–207.
Bergman, R.N., 2002. Pathogenesis and prediction of diabetes mellitus:
lessons from integrative physiology. Irving L. Schwartz Lecture,
Mount Sinai J. Med. 60, 280–290.
Bergman, R.N., Finegood, D.T., Ader, M., 1985. Assessment of insulin
sensitivity in vivo. Endocr. Rev. 6, 45–86.
Bergman, R.N., Finegood, D.T., Kahn, S.E., 2002. The evolution of beta-
cell dysfunction and insulin resistance in type 2 diabetes. Eur. J. Clin.
Invest. 32 (Suppl. 3), 35–45.
Bolie, V.W., 1961. Coefficients of normal blood glucose regulation. J.
Appl. Physiol. 16, 783–788.
Cherrington, A.D., Sindelar, D., Edgerton, D., Steiner, K., McGuinness,
O.P., 2002. Physiological consequences of phasic insulin release in the
normal animal. Diabetes 51 (Suppl. 1), S103–S108.
DeGaetano, A., Arino, O., 2000. Mathematical modeling of the
intravenous glucose tolerance test. J. Math. Biol. 40, 136–168.
Derouich, M., Boutayeb, A., 2002. The effect of physical exercise on the
dynamics of glucose and insulin. J. Biomechanics 35, 911–917.
Duckworth, W.C., Bennett, R.G., Hamel, F.G., 1998. Insulin degrada-
tion: progress and potential. Endocr. Rev. 19, 608–624.
Engelborghs, K., Lemaire, V., Belair, J., Roose, D., 2001. Numerical
bifurcation analysis of delay differential equations arising from
physiological modeling. J. Math. Biol. 42, 361–385.
Gilon, P., Ravier, M.A., Jonas, J.C., Henquin, J.C., 2002. Control
mechanisms of the oscillations of insulin secretion in vitro and in vivo.
Diabetes 51 (Suppl. 1), S144–S151.
Keener, J., Sneyd, J., 1998. Mathematical Physiology. Springer, New
York.
Luzi, L., DeFrenzo, R.A., 1989. Effect of loss of first-phase insulin
secretion on hepatic glucose production and tissue glucose disposal in
humans. Am. J. Physiol. 257, E241–E246.
Li, J., Kuang, Y., Li, B., 2001. Analysis of IVGTT glucose–insulin
interaction models with time delay. Discrete Contin. Dyn. Syst. Ser. B
1 (1), 103–124.
Makroglou, A., Li, J., Kuang, Y., 2006. Mathematical models and
software tools for the glucose–insulin regulatory system and diabetes:
an overview. Appl. Numer. Math. 56, 559–573.
Mari, A., 2002. Mathematical modeling in glucose metabolism and insulin
secretion. Curr. Opin. Clin. Nutr. Metab. Care 5, 495–501.
Mukhopadhyay, A., DeGaetano, A., Arino, O., 2004. Modeling the
intra-venous glucose tolerance test: a global study for a single-
distributed-delay model. Discrete Contin. Dyn. Syst. Ser. B 4 (2),
407–417.
Pørksen, N., Hollingdal, M., Juhl, C., Butler, P., Veldhuis, J.D., Schmitz,
O., 2002. Pulsatile insulin secretion: detection, regulation, and role in
diabetes. Diabetes 51 (Suppl. 1), S245–S254.
Prager, R., Wallace, P., Olefsky, J.M., 1986. In vivo kinetics of insulin
action on peripheral glucose disposal and hepatic glucose output in
normal and obese subjects. J. Clin. Invest. 78, 472–481.
Shampine, L.F., Thompson, S., 2001. Solving DDEs in MATLAB. Appl.
Numer. Math. 37, 441–458 hhttp://www.radford.edu/�thompsoni.
Simon, C., Brandenberger, G., 2002. Ultradian oscillations of insulin
secretion in humans. Diabetes 51 (Suppl. 1), S258–S261.
Sturis, J., Polonsky, K.S., Mosekilde, E., Van Cauter, E., 1991. Computer
model for mechanisms underlying ultradian oscillations of insulin and
glucose. Am. J. Physiol. 260, E801–E809.
Tolic, I.M., Mosekilde, E., Sturis, J., 2000. Modeling the insulin–glucose
feedback system: the significance of pulsatile insulin secretion.
J. Theor. Biol. 207, 361–375.
Topp, B., Promislow, K., De Vries, G., Miura, R.M, Finegood, D.T.,
2000. A model of b-cell mass, insulin, and glucose kinetics: pathways
to diabetes. J. Theor. Biol. 206, 605–619.