Embed Size (px)
Citation preview

MA03CH04-Hofmann ARI 17 November 2010 6:45
Modeling the Dynamics ofContinental Shelf CarbonEileen E. Hofmann,1 Bronwyn Cahill,2 Katja Fennel,3
Marjorie A.M. Friedrichs,4 Kimberly Hyde,5
Cindy Lee,6 Antonio Mannino,7 Raymond G. Najjar,8
John E. O’Reilly,5 John Wilkin,2 and Jianhong Xue4,9
1Center for Coastal Physical Oceanography, Old Dominion University, Norfolk,Virginia 23508; email: [email protected] of Marine and Coastal Sciences, Rutgers University, New Brunswick,New Jersey 08901-8521; email: [email protected], [email protected] of Oceanography, Dalhousie University, Halifax, Nova Scotia B3H4J1, Canada;email: [email protected] Institute of Marine Science, College of William & Mary, Gloucester Point,Virginia 23062; email: [email protected]/NMFS Narragansett Laboratory, Narragansett, Rhode Island 02882;email: [email protected], [email protected] Sciences Research Center, Stony Brook University, Stony Brook,New York 11794-5000; email: [email protected] Goddard Space Flight Center, Greenbelt, Maryland 20771;email: [email protected] of Meteorology, The Pennsylvania State University, University Park,Pennsylvania 16802; email: [email protected] Science Institute, The University of Texas at Austin, Port Aransas, Texas 78373;email: [email protected]
Annu. Rev. Mar. Sci. 2011. 3:93–122
First published online as a Review in Advance onNovember 12, 2010
The Annual Review of Marine Science is online atmarine.annualreviews.org
This article’s doi:10.1146/annurev-marine-120709-142740
Copyright c© 2011 by Annual Reviews.All rights reserved
1941-1405/11/0115-0093$20.00
Keywords
carbon cycling, continental shelf, coupled circulation-biogeochemicalmodels, model-data comparisons, data assimilation, biogeochemical modelinitialization
Abstract
Continental margin systems are important contributors to global nutrientand carbon budgets. Effort is needed to quantify this contribution and howit will be modified under changing patterns of climate and land use. Coupledmodels will be used to provide projections of future states of continental mar-gin systems. Thus, it is appropriate to consider the limitations that impedethe development of realistic models. Here, we provide an overview of thecurrent state of modeling carbon cycling on continental margins as well asthe processes and issues that provide the next challenges to such models. Ouroverview is done within the context of a coupled circulation-biogeochemicalmodel developed for the northeastern North American continental shelf re-gion. Particular choices of forcing and initial fields and process parameteriza-tions are used to illustrate the consequences for simulated distributions, as re-vealed by comparisons to observations using quantitative statistical metrics.
93
Ann
u. R
ev. M
arin
e. S
ci. 2
011.
3:93
-122
. Dow
nloa
ded
from
ww
w.a
nnua
lrev
iew
s.or
gby
Dr
Cin
dy L
ee o
n 12
/16/
10. F
or p
erso
nal u
se o
nly.

MA03CH04-Hofmann ARI 17 November 2010 6:45
INTRODUCTION
Continental margin systems make up only approximately 8% of the world oceans but contributean estimated 19–28% of total global primary production (Longhurst 1995). These productiveregions (Figure 1) support a variety of marine ecosystems that are characterized by food websand biogeochemical cycling with varying levels of connectivity and linkages (see Liu et al. 2010for a review). The carbon and nutrient fluxes and dynamics resulting from these internal foodweb and biogeochemical transformations are diverse and are further modified by sediment-waterinteractions, air-sea fluxes, and land-ocean inputs that affect all continental margin systems. Thesesystems have been recognized as being potentially important contributors to global nutrient andcarbon budgets (e.g., Walsh et al. 1981, Muller-Karger et al. 2005, Seitzinger et al. 2006). However,the limited number of multidisciplinary studies conducted in only a few of these diverse systemshas not allowed reliable quantitative estimates of the overall importance of continental marginsystems to these global budgets.
An example of the diversity of opinions concerning the role of continental margin systemsin global carbon budgets is the ongoing debate about the importance of these systems as sinksfor atmospheric carbon dioxide (CO2; e.g., Tsunogai et al. 1999, Frankignoulle & Borges 2001,DeGrandpre et al. 2002, Thomas et al. 2004). Recent compilations of observational estimatesdocument that variability in coastal air-sea CO2 fluxes is large but suggest that mid- and high-latitude systems generally act as sinks of atmospheric CO2, whereas subtropical and tropical regionsgenerally act as sources (Cai et al. 2006, 2011; Borges et al. 2005). In addition, two recent attemptsto budget continental shelf CO2 uptake (Borges et al. 2005, Cai et al. 2006) arrived at differentglobal estimates of uptake (0.45 Pg C y−1 versus 0.22 Pg C y−1, respectively), which illustrates
10 30 100Primary production (gC m–2 y–1)
300 1,000 3,000
Figure 1Annual mean global primary production distribution estimated from ocean color measurements obtainedfrom the Sea-viewing Wide Field-of-view Sensor (SeaWiFS) using the Ocean Productivity from Absorptionof Light (OPAL) model (Marra et al. 2007). The 200-m isobath (thin black line) denotes the continental shelfedge.
94 Hofmann et al.
Ann
u. R
ev. M
arin
e. S
ci. 2
011.
3:93
-122
. Dow
nloa
ded
from
ww
w.a
nnua
lrev
iew
s.or
gby
Dr
Cin
dy L
ee o
n 12
/16/
10. F
or p
erso
nal u
se o
nly.
MA03CH04-Hofmann ARI 17 November 2010 6:45
Table 1 Selection of food web–mass balance models constructed for an annual time scale
Study region
Carbon burialand/or export(g C m−2 y−1)
Carbon yield tobenthos
(g C m−2 y−1)
Carbon yield totop predators(g C m−2 y−1)
Carbon yield tohumans
(g C m−2 y−1) ReferenceTexas-Louisianacontinental shelf
56 NCa 0.35 0.34 Walsh et al. 1981
New York continental shelf 180 245.2 2.7 0.63 Walsh et al. 1981Peru continental shelf 82–591 25–116.5 67.1–600.5 6.7–60.05 Walsh et al. 1981Florida-Georgiacontinental shelf
NC 90 3.2 0.5 Pace et al. 1984
Southeastern Bering Seaouter shelf
28–79 43–162 8.3–29.2 0.64–0.67 Walsh & McRoy1986
aNC, quantity not calculated.
the large uncertainty in extrapolations from local to global estimates. Even within the same shelfsystem, there is debate as to whether there is a source or sink of atmospheric CO2. Cai et al.(2003) and Wang et al. (2005) concluded that the U.S. South Atlantic Bight (SAB) operates as asource of CO2 to the atmosphere. This is in contrast to a more recent study ( Jiang et al. 2008),which found that although the inner shelf acts as a net source of CO2 to the atmosphere, the mid-and outer shelf regions, as well as the SAB as a whole, are a net CO2 sink on an annual basis.The debate over the source/sink status of continental margin systems is critically important giventhe potentially large magnitude of CO2 fluxes in these systems relative to the total CO2 uptake bythe world ocean (at present, approximately 2 Pg C y−1).
The divergent results described above arise largely from the difficulty in extrapolating fromdata collected on individual cruises, conducted with limited spatial and temporal coverage, tofluxes representative of an entire continental shelf that allow for the large spatial and temporalvariability inherent in these systems. Coupled-modeling frameworks provide an approach forextending beyond the confines of limited measurements to quantify carbon and nutrient fluxesin continental margins (reviewed in Moisan 2010) (Tables 1 and 2). These models allow self-consistent estimates of nutrient and carbon fluxes and thus provide a common basis for makingcomparisons between model-based carbon estimates from different regions.
Models integrate theoretical knowledge and laboratory measurements and complement field-based approaches. At the most basic level, all models routinely require mass to be conserved, andthree-dimensional (3D) circulation models generally have the additional constraints of momentumand energy conservation. As models become more complex, knowledge from experimental studies,such as relationships between light and primary production, and from field studies, with measuredconcentrations and rates, are used to place further constraints. Ideally, a blending of approachesbased on models, theory, and observations (satellite, field and laboratory) are used to address issuesin environmental science, including the carbon cycle of continental shelves.
Models are useful tools for evaluating hypotheses and climate effects, past and present. Forexample, Previdi et al. (2009) analyzed the sensitivity of air-sea CO2 fluxes to atmospheric forcingby contrasting simulations of a model for the U.S. eastern continental shelf for opposite phasesof the North Atlantic Oscillation (the dominant mode of atmospheric variability in the NorthAtlantic). In this case, it was possible to quantify the relative importance of different factors (e.g.,changes in primary production, wind forcing) to changes in the air-sea flux of CO2. Climate changeand variability have already affected coastal systems (Cook et al. 1998, Hagy et al. 2004, Diaz &
www.annualreviews.org • Modeling Continental Shelf Carbon 95
Ann
u. R
ev. M
arin
e. S
ci. 2
011.
3:93
-122
. Dow
nloa
ded
from
ww
w.a
nnua
lrev
iew
s.or
gby
Dr
Cin
dy L
ee o
n 12
/16/
10. F
or p
erso
nal u
se o
nly.

MA03CH04-Hofmann ARI 17 November 2010 6:45
Table 2 Selection of coupled circulation–lower trophic level models developed for continental shelf systems that provideestimates of annual primary production, air-sea CO2 flux, and sediment denitrification
Studyregion Model type
Primary carbonand flux controls
Modelapplication Simulation diagnostic Reference
CentralNorth Sea
1D, mixed- layer,with observedmeteorologicalforcing, lowertrophic levels
Atmosphericforcing,zooplanktongrazing
Annual cycles ofenvironment andphytoplankton
PP: 43–64 g C m−2 y−1 Radach & Moll1993
Bering-Chukchiseas
3D, barotrophiccirculation, lowertrophic levels
Advection, benthicrespiration andregeneration
Fate and export ofcarbon
PP: 360 g C m−2 y−1 Shuert & Walsh1993
SoutheasternBering Sea
2D, mixed-layer,complexbiogeochemicalprocesses
Vertical mixing,benthic processes,internalbiologicaltransformations
Seasonal cycles,annualdistributions
PP: 140 g C m−2 y−1
ASF: 30 g C m−2 y−1Walsh &Dieterle 1994
North Sea 3D, coupledcirculation,nutrient,phytoplankton
River inputs,radiation, internalbiologicaltransformations
Annual primaryproduction andregionalvariability
PP: 145 g C m−2 y−1 Moll 1998
NorthwestEuropeancontinentalshelf
3D, coupledcirculation, lowertrophic levels,benthic suspendedsediment
Circulation,radiance
Seasonal nutrientandphytoplanktoncycles
Nutrient andphytoplankton patterns
Allen et al. 2001
West coastVancouverIsland,BritishColumbia
2D, upwellingcirculation, POC,DIC, DOC
Light, relativestrength ofupwelling todownwellingcirculation
Annual primaryproduction,air-sea flux,export flux ofDOC and importflux of DIC
PP: 410 g C m−2 y−1
ASF: 6 g C m−2 y−1Ianson & Allen2002
CaliforniaCurrentSystem
3D, coupledcirculation, lowertrophic levels
Advection, internalbiologicaltransformations
Seasonal cycles,annualdistributions
PP: 27,002 × 103 t C y−1
ASF: 733 × 103 t C y−1Gruber et al.2006 (asrecalculated andgiven in Moisan2010)
MiddleAtlanticBight
NENAmodel
3D, coupledcirculation,nutrient, lowertrophic levels,benthiccomponent
River inputs,radiation, oceaninputs, air-seafluxes, internalbiologicaltransformations
Annual mid-shelfair-sea flux
PP: 245 g C m−2 y−1
ASF: 14.2 g C m−2 y−1
SDN: 0.33 mol N m−2 y−1
Fennel et al. 2008
Ross Seacontinentalshelf
3D, coupledcirculation,nutrient, lowertrophic levels
Radiation, air-seafluxes, sea icecover, wind,internalbiologicaltransformations
Annual primaryproduction,air-sea flux,sinking
NPP: 0.055 Pg C y−1
ASF: 20–50 g C m−2 y−1Arrigo et al. 2008
(Continued )
96 Hofmann et al.
Ann
u. R
ev. M
arin
e. S
ci. 2
011.
3:93
-122
. Dow
nloa
ded
from
ww
w.a
nnua
lrev
iew
s.or
gby
Dr
Cin
dy L
ee o
n 12
/16/
10. F
or p
erso
nal u
se o
nly.
MA03CH04-Hofmann ARI 17 November 2010 6:45
Table 2 (Continued )
Study region Model typePrimary carbonand flux controls
Modelapplication Simulation diagnostic Reference
South ChinaSea
3D, coupledcirculation, lowertrophic levels
Air-sea fluxes,internal biologicaltransformations
Seasonal andinterannualvariability inprimaryproduction
PP: 72 g C m−2 y−1 Liu & Chai 2009
South ChinaSea
3D, coupledcirculation, lowertrophic levels
SST, TCO2,biologicaltransformations
Seasonal andannual sea-airCO2 flux
ASF: 4 g CO2 m−2 y−1 Chai et al. 2009
MiddleAtlanticBightNENAmodel
3D, coupledcirculation,nutrient, carbon,lower trophiclevels
River inputs,radiation, oceaninputs, air-seafluxes, internalbiologicaltransformations
Annual carbonexport from shelf
50 × 106 mol C y−1 perkilometer of along-shelfdistance
Fennel & Wilkin2009
MiddleAtlanticBightNENAmodel
3D, coupledcirculation,nutrient, lowertrophic levels,benthiccomponent,DOM
River inputs,radiation, oceaninputs, air-seafluxes, internalbiologicaltransformations,DOM cycling
Seasonal andannual DOCexport from fromshelf
1–2 mol C m−2 y−1 Druon et al. 2010
Abbreviations: ASF, air-sea CO2 flux; DIC, dissolved inorganic carbon; DOC, dissolved organic carbon; DOM, dissolved organic matter;NENA, northeastern North American; NPP, net primary production; POC, particulate organic carbon; PP, annual primary production;SDN, sediment denitrification; SST, sea surface temperature.
Rosenberg 2008, Najjar et al. 2010), and thus it is likely that future human-induced changes ingreenhouse gases, with their associated impacts on temperature, sea level, streamflow, acidity, andocean circulation, will have dramatic impacts on coastal systems. As human population density ishigh in coastal areas and is predicted to continue to increase, the associated impacts of changinghydrology, nutrient fluxes, and sediment fluxes (to name a few) are expected to be substantial, atleast in the near-shore zone. In addition, both climate and land use have the potential of alteringthe air-sea partitioning of CO2, which may then feed back on climate.
Coastal carbon modeling systems range from box models (e.g., Walsh 1988) (Table 1) to3D, coupled circulation-biogeochemical models (e.g., Moll 1998, Fennel et al. 2006, Arrigoet al. 2008, Liu & Chai 2009, Druon et al. 2010) (Table 2). Similarly, representation of thebiogeochemical processes ranges from nutrient-phytoplankton-zooplankton aggregate formu-lations to multifunctional group representations of the ecosystem (e.g., Le Quere et al. 2005,Hood et al. 2006, Lehmann et al. 2009). As emphasis is placed on understanding the roleof continental shelf systems in carbon budgets under changing patterns of climate and landuse, coupled-model systems will be used more often to provide projections of future statesresulting from these changes. However, the choice of a model and its formulations are de-pendent on the problem that is being addressed, which places important constraints on themodel results. Thus, it is appropriate to consider the limitations in understanding of carboncycling in continental margin systems that impede the development of realistic models of thisprocess.
www.annualreviews.org • Modeling Continental Shelf Carbon 97
Ann
u. R
ev. M
arin
e. S
ci. 2
011.
3:93
-122
. Dow
nloa
ded
from
ww
w.a
nnua
lrev
iew
s.or
gby
Dr
Cin
dy L
ee o
n 12
/16/
10. F
or p
erso
nal u
se o
nly.

MA03CH04-Hofmann ARI 17 November 2010 6:45
SS
GOM
NESMAB
GS
SAB
SAR
80°W25°N
30°N
35°N
40°N
45°N
75°W 70°W 65°W 60°W
1 10 100Depth (m)
1,000 10,000
a b
Figure 2(a) Bathymetry map for the U.S. eastcoast region included in the northeastern North American (NENA)model domain. The 200-m isobath (gray line) denotes the continental shelf edge. (b) Subareas of the NENAmodel domain used for analysis of model results. Abbreviations: GOM, Gulf of Maine; GS, Gulf Stream;MAB, Middle Atlantic Bight; NES, Northeast Slope; SAB, South Atlantic Bight; SAR, Sargasso Sea;SS, Scotian Shelf.
The objective of this paper is to provide an overview of the current state of carbon-cyclingmodeling for continental margin systems and the processes and issues that potentially providethe next challenges to such models. This is done within the context of a model developed forthe northeastern North American (NENA) shelf region (Figure 2), which is perhaps one of thebest-studied continental shelf regions. The NENA model includes a high-resolution circulationmodel and a detailed biogeochemical model of coastal carbon and nutrient cycling (Figure 3).This coupled-modeling framework has been used to investigate the role of sediment denitrifi-cation as a nutrient sink (Fennel et al. 2006) and the controls on air-sea carbon fluxes on theNENA continental shelf (Fennel et al. 2008). Additional studies with the NENA model have pro-vided estimates of cross-shelf export of particulate organic carbon (Fennel & Wilkin 2009) andan evaluation of the role of dissolved organic matter (DOM) dynamics in coastal ocean biogeo-chemical cycling (Druon et al. 2010). Results from these studies are described more fully in a latersection.
The controls on carbon cycling on continental shelves are next discussed as a basis for describingthe approaches used to represent these in the NENA model. Sample simulations from the NENAmodel are then used to illustrate the consequences of particular choices of forcing and initialfields. Quantitative statistical metrics are used to highlight differences in simulated and observeddistributions of sea surface temperature and chlorophyll. Limitations of the data sets used toevaluate coupled models are described and results from simulations that used different forcingsand parameterizations are compared to illustrate model sesnsitivity. The final section provides adiscussion of the challenges that limit the ability to simulate carbon cycling on continental shelvesas a basis for directing future research programs.
98 Hofmann et al.
Ann
u. R
ev. M
arin
e. S
ci. 2
011.
3:93
-122
. Dow
nloa
ded
from
ww
w.a
nnua
lrev
iew
s.or
gby
Dr
Cin
dy L
ee o
n 12
/16/
10. F
or p
erso
nal u
se o
nly.
MA03CH04-Hofmann ARI 17 November 2010 6:45
Water column
Sediment
Carbon cycle
ZooplanktonC:N = 6.6
pCO2atm
SemilabileDOC
Small Cdetritus
Large Cdetritus
DIC
Smallphytoplankton
C:N = 6.6
Largephytoplankton
C:N = 6.6
Alkalinity
RefractoryDOC
POCBurialBurial
SolubilizationSolubilization
ExudationExudation
Nutrient-basedNutrient-baseduptake and exudationuptake and exudation
C excess-basedC excess-basedexudationexudation
RemineralizationRemineralization
DenitrificationDenitrification
ResuspensionResuspension
Burial
Solubilization
Exudation
Nutrient-baseduptake and exudation
C excess-basedexudation
Remineralization
Denitrification
Resuspension
NO3NH4
SemilabileDON
Small Ndetritus
Nitrogen cycle
Smallphytoplankton
Largephytoplankton
RefractoryDON
PON
Large Ndetritus
N2
DenitrificationDenitrificationBurialBurial
ResuspensionResuspension
SolubilizationSolubilization
Sloppyfeeding
UptakeUptake Uptake andUptake andexudationexudation
RemineralizationRemineralization
AggregationAggregation
DenitrificationBurial
Resuspension
Uptake and exudationUptake and exudationUptake and exudation
Solubilization
Sloppyfeeding
Uptake Uptake andexudation
Nitrification
Remineralization
Aggregation
Sinking
SinkingSinking
Sinking
Zooplankton
ExcretionExcretionand sloppyand sloppy
feedingfeeding
Excretionand sloppy
feeding
ExcretionExcretionand sloppyand sloppy
feedingfeeding
Excretionand sloppy
feeding
Figure 3Schematic of the internal and boundary processes included in the biogeochemical component of the northeastern North American(NENA) model. Details of the biogeochemical model are derived from Fennel et al. (2006, 2008) and Druon et al. (2010).Abbreviations: DIC, dissolved inorganic carbon; DOC, dissolved organic carbon; DON, dissolved organic nitrogen; POC, particulateorganic carbon; PON, particulate organic nitrogen.
CONTROLS ON SHELF CARBON CYCLING
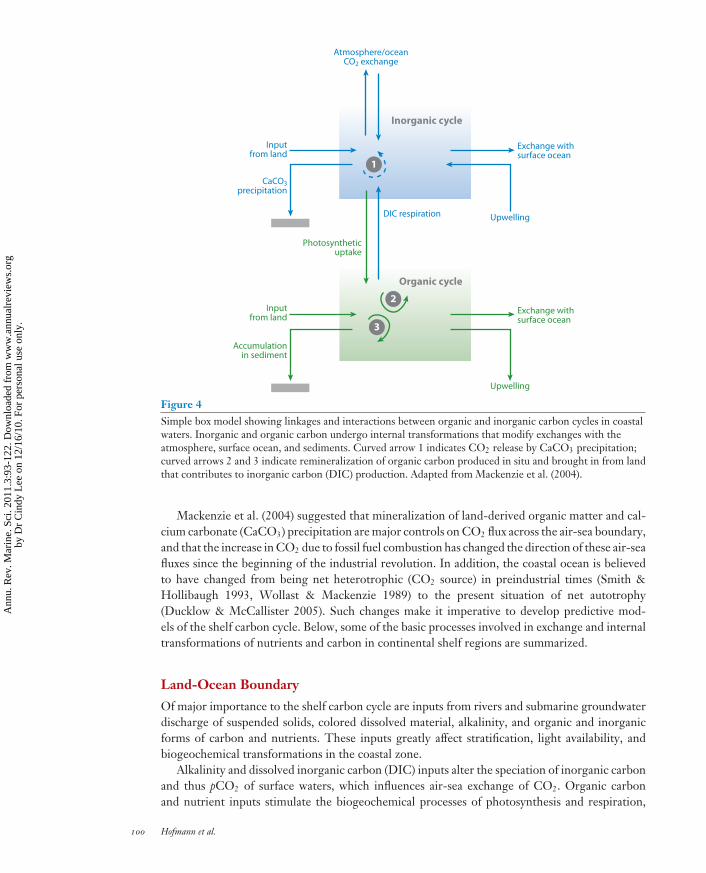
Modeling shelf carbon cycles requires knowledge of the many processes that control the flow oforganic and inorganic carbon in and out of the shelf system; these include exchanges with theopen ocean, land, air, and sediment. Understanding mechanisms of internal cycling on the conti-nental shelf is also needed to predict how exchange processes will vary over time. Moreover, keyto development of a useful model is the ability to determine the rates and processes that have thelargest impact on the relevant carbon pools and their flows. For example, studies of the impactof synoptic weather events and coastal bathymetry on primary production and air-sea CO2 fluxin upwelling systems likely require 2D or 3D models that include nutrients, phytoplankton, andcarbonate chemistry. A sedimentary component for such a model may not be needed. However, ifthe research questions focus on controls on the carbon budget of continental shelves from decadesto millennia, then sediment interactions play a critical role and must be included, probably atthe expense of spatial resolution and ecosystem complexity. The choices to be made in model-ing carbon cycling on continental shelves require at least a preliminary evaluation of inputs ofsediment, nutrients, fresh water, carbon from land, elemental fluxes between the sediments andthe water column, air-sea fluxes of gases and nutrients, internal cycling in the water column (e.g.,primary production and respiration), and cross-shelf exchange. The strong linkages between andamong these key processes that control organic and inorganic carbon cycles in the coastal ocean(Figure 4) underscore the importance of correctly representing these in models.
www.annualreviews.org • Modeling Continental Shelf Carbon 99
Ann
u. R
ev. M
arin
e. S
ci. 2
011.
3:93
-122
. Dow
nloa
ded
from
ww
w.a
nnua
lrev
iew
s.or
gby
Dr
Cin
dy L
ee o
n 12
/16/
10. F
or p
erso
nal u
se o
nly.
MA03CH04-Hofmann ARI 17 November 2010 6:45
1
2
3
Atmosphere/oceanCO2 exchange
Upwelling
CaCO3precipitation
Inputfrom land
Accumulationin sediment
Inputfrom land
Exchange withsurface ocean
Upwelling
Exchange withsurface ocean
DIC respiration
Photosyntheticuptake
Inorganic cycle
Organic cycle
Figure 4Simple box model showing linkages and interactions between organic and inorganic carbon cycles in coastalwaters. Inorganic and organic carbon undergo internal transformations that modify exchanges with theatmosphere, surface ocean, and sediments. Curved arrow 1 indicates CO2 release by CaCO3 precipitation;curved arrows 2 and 3 indicate remineralization of organic carbon produced in situ and brought in from landthat contributes to inorganic carbon (DIC) production. Adapted from Mackenzie et al. (2004).
Mackenzie et al. (2004) suggested that mineralization of land-derived organic matter and cal-cium carbonate (CaCO3) precipitation are major controls on CO2 flux across the air-sea boundary,and that the increase in CO2 due to fossil fuel combustion has changed the direction of these air-seafluxes since the beginning of the industrial revolution. In addition, the coastal ocean is believedto have changed from being net heterotrophic (CO2 source) in preindustrial times (Smith &Hollibaugh 1993, Wollast & Mackenzie 1989) to the present situation of net autotrophy(Ducklow & McCallister 2005). Such changes make it imperative to develop predictive mod-els of the shelf carbon cycle. Below, some of the basic processes involved in exchange and internaltransformations of nutrients and carbon in continental shelf regions are summarized.
Land-Ocean Boundary
Of major importance to the shelf carbon cycle are inputs from rivers and submarine groundwaterdischarge of suspended solids, colored dissolved material, alkalinity, and organic and inorganicforms of carbon and nutrients. These inputs greatly affect stratification, light availability, andbiogeochemical transformations in the coastal zone.
Alkalinity and dissolved inorganic carbon (DIC) inputs alter the speciation of inorganic carbonand thus pCO2 of surface waters, which influences air-sea exchange of CO2. Organic carbonand nutrient inputs stimulate the biogeochemical processes of photosynthesis and respiration,
100 Hofmann et al.
Ann
u. R
ev. M
arin
e. S
ci. 2
011.
3:93
-122
. Dow
nloa
ded
from
ww
w.a
nnua
lrev
iew
s.or
gby
Dr
Cin
dy L
ee o
n 12
/16/
10. F
or p
erso
nal u
se o
nly.

MA03CH04-Hofmann ARI 17 November 2010 6:45
which lead to additional impacts on exchange of CO2 with the atmosphere and alters the oxygendistribution and denitrification (Sarmiento & Gruber 2006, p. 102). The quality of organic materialdelivered from land is of utmost importance, as it determines the time scale for remineralization ofthis material. Of particular relevance is the ratio of the remineralization time scale to the residencetime of water on the continental shelf, as this will determine the fraction of riverine material thatis ultimately exported to the open ocean.
Watershed geomorphology, climate, and land use result in large spatial and temporal variationsin riverine flows and concentrations of river-borne material, leading to large uncertainties inestimates of loading to coastal regions in all but the most extensively monitored watersheds.Even more challenging is the quantification of submarine groundwater discharge, which includesfreshwater and seawater that has circulated through the sediments and requires estimates of thevolume flux and groundwater constituent concentrations (Moore 2010). Radioisotope analysis(Moore et al. 2008) estimated that submarine groundwater discharge is comparable to riverinedischarge for the Atlantic Ocean, implying that this is an important source that needs to be includedin coastal carbon models.
Air-Sea Boundary
The air-sea boundary has two important effects on coastal carbon cycling through mediation ofthe exchange of important gases, including CO2 and oxygen, and deposition of nitrogen, which isoften the limiting nutrient in coastal systems. Carbon dioxide and oxygen cross the air-sea interfacemainly by diffusion, which is controlled by the air-sea gradient in the gas partial pressure, the gassolubility (which depends on temperature and salinity), and near-surface turbulence (Sarmiento &Gruber 2006, p. 82). Atmospheric pCO2 varies on synoptic, seasonal, and interannual time scales,mainly as a result of weather systems, fossil fuel burning, and large-scale exchanges with the ter-restrial biosphere and ocean; in contrast, atmospheric oxygen is essentially constant. Surface oceanpCO2 is governed by the concentrations of DIC and alkalinity, which themselves are influencedby riverine input, circulation, and internal cycling (e.g., photosynthesis, respiration, calcification,and CaCO3 dissolution). Near-surface turbulence that reduces the resistance to gas exchange isgenerated by winds and waves but inhibited by surfactants and viscosity. The production of bub-bles by breaking waves and their subsequent injection and collapse in the surface-ocean mixedlayer is an additional mechanism by which CO2, and especially oxygen, may be exchanged withthe atmosphere.
Enrichment of the sea surface microlayer with dissolved organic carbon (DOC) and particulateorganic carbon (POC), as well as living organisms (plankton, bacteria, viruses), affects physicaland chemical properties at the air-sea interface and thus influences exchange processes across theair-sea boundary (Liss & Duce 1997, Frew et al. 2002). Microlayer enrichment results from acombination of processes, such as input from bubble scavenging and biological production; lossfrom diffusion, aerosol production, and biological degradation; stabilization by surface tension; andexchanges between dissolved and particulate pools (Liss & Duce 1997). Water and air temperaturesinfluence the rates of many biological processes as well as the intensity of evaporation at the air-water interface. Wind mixes the microlayer with seawater in the upper mixed layer, thus reducingenrichment. Ultraviolet radiation can alter the composition of dissolved organic matter by breakingdown refractory compounds and producing smaller, more labile ones (Mopper & Kieber 2000).The sea surface microlayer is thus a complex interface that plays an important role in air-seaexchange.
Atmospheric deposition is increasingly recognized as a significant source of nitrogen thatinfluences marine productivity and other biogeochemical processes, particularly in coastal areas.
www.annualreviews.org • Modeling Continental Shelf Carbon 101
Ann
u. R
ev. M
arin
e. S
ci. 2
011.
3:93
-122
. Dow
nloa
ded
from
ww
w.a
nnua
lrev
iew
s.or
gby
Dr
Cin
dy L
ee o
n 12
/16/
10. F
or p
erso
nal u
se o
nly.

MA03CH04-Hofmann ARI 17 November 2010 6:45
Atmospheric nitrogen reaches the ocean through precipitation (wet deposition) and through directcontact of air with the surface (dry deposition) (Spokes et al. 2000). Wet deposition is mainly inthe form of nitrate (NO3
−), ammonium (NH4+), and organic nitrogen and usually exceeds dry
deposition (mainly as NO, NO2, HNO3, and NH3) over long time periods. The sources of reactivenitrogen deposited to the ocean are largely anthropogenic, resulting ultimately from emission ofNO (leading to nitrate deposition), which is mainly from the burning of fossil fuels and biomass,and NH3 (leading to NH4
+ deposition), which is mainly from animal husbandry, soils, and biomassburning. Atmospheric organic nitrogen cycling is poorly understood, and there may be substantialartifacts in measuring rainwater-dissolved organic nitrogen (DON; Keene et al. 2002), but currentestimates suggest that roughly 30% of the reactive nitrogen deposition to the ocean is organic(Cornell et al. 2003, Jickells 2006). Using atmospheric models, Duce et al. (2008) estimated reactivenitrogen deposition to the ocean in 2000 to be more than three times the deposition in 1860, withchanges being greatest in the coastal waters that receive most of the anthropogenic nitrogendeposited on the ocean.
The contribution of atmospheric deposition to coastal nitrogen budgets is substantial. Forexample, modeling and observational studies estimate that atmospheric nitrogen deposition is10–50% of upwelled nitrogen or new production over large areas downwind of populated regions(Duce et al. 2008, Guerzoni et al. 1999, Krishnamurthy et al. 2007, Onitsuka et al. 2009). Regionalbudget approaches for many coastal seas ( Jickells 2006, Loye-Pilot et al. 1990, Paerl et al. 2002)show that atmospheric deposition of nitrogen is comparable and can often exceed riverine inputs.
More subtle effects of atmospheric deposition on marine biogeochemical processes may alsooccur. For example, the N:P deposition ratio differs substantially from the Redfield ratio, oftengreatly exceeding it, mainly because the atmospheric cycle of phosphorus has been much lessperturbed than that of nitrogen ( Jickells 2006). Furthermore, atmospheric deposition of nitrogenand sulfur may contribute substantially to the acidification of coastal waters (Doney et al. 2007).
Sediment-Water Boundary
Adequate representation of fluxes across the sediment-water interface is crucial for shelf appli-cations, where a significant fraction of organic matter remineralization and oxygen consumptionoccurs in the sediment. Remineralization pathways are qualitatively different in the sedimentcompared with the water column. For example, anaerobic processes of denitrification, sulfatereduction, and anammox (ANaerobic AMMonium OXidation, i.e., the bacterial conversion ofnitrate and ammonium into N2 gas; see Kuypers et al. 2005) occur in anoxic waters and sedimentlayers and have different stoichiometries relative to aerobic remineralization in oxic waters andsediment. Also, the sediment can act as a permanent repository of carbon through burial of organicmatter and CaCO3, and a loss of nitrogen through denitrification and anammox. Both processesrepresent potential major sinks for fixed nitrogen and thus limit oceanic primary productivity inwaters with strong oxygen minima and strongly reducing sediments. However, the extent andimportance of anammox relative to denitrification remains uncertain (Ward et al. 2009).
Organic matter mineralization and nutrient cycling in sediments are controlled primarily bymicrobial processes, but benthic macrofauna can greatly affect the rates of these processes byaltering the physical, chemical, and biological properties of the sediment (e.g., Rhoads 1974, Aller1988). Bioturbation can mix particles by the building of tubes and burrows, and bioirrigation canincrease flow through the sediment, both of which affect redox conditions and exchange of materialacross the sediment-water boundary (Aller 1994, Kristensen 2000). Macrobenthos may also play asignificant role in filtering particles from the overlying water column, although the extent of this iscontroversial (Pomeroy et al. 2006). Much of the research on sediment biogeochemistry has been
102 Hofmann et al.
Ann
u. R
ev. M
arin
e. S
ci. 2
011.
3:93
-122
. Dow
nloa
ded
from
ww
w.a
nnua
lrev
iew
s.or
gby
Dr
Cin
dy L
ee o
n 12
/16/
10. F
or p
erso
nal u
se o
nly.

MA03CH04-Hofmann ARI 17 November 2010 6:45
carried out in muddy, cohesive sediments, but the continental shelf includes large areas of sandy,noncohesive sediments with different exchange processes and rates (Huettel et al. 1996, 1998). Itis now clear that pore-water advection is an important influence on biogeochemical processes inpermeable sediments (Reimers et al. 2004).
Sedimentation rates, which can be high in shelf regions, can greatly impact organic carbonremineralization rates as high sedimentation rates reduce the length of time that organic matter isexposed to oxygen and bioturbation, thus increasing the efficiency of organic carbon preservation(Henrichs & Reeburgh 1987, Hartnett et al. 1998, Kristensen 2000). High sedimentation ratesalso often result from high inputs of terrestrial material with refractory organic matter that ispreferentially buried.
Internal Carbon Cycling
Many biogeochemical transformations that affect the carbon cycle occur within the shelf watercolumn, particularly with regard to production and transformation among pools of DOC, DIC,POC, and particulate inorganic carbon (PIC). Metabolism of organic matter is particularly highin the coastal ocean due to the large inputs of both land-derived organic matter and primaryproduction, which promote microbial and higher trophic level remineralization of organic carbonto DIC (Smith & Hollibaugh 1993, Gattuso et al. 1998). High levels of suspended sedimentsfrom riverine contributions and resuspension of bottom sediments enhance sorption/desorptionprocesses between organic matter and mineral matrices (Keil et al. 1997, Komada & Reimers2001, Komada et al. 2002). Nutrient uptake and recycling is enhanced in coastal waters due tothe shallow water column and storm events that redistribute recycled nutrients at depth to theeuphotic zone (Dagg et al. 2004). Zooplankton grazing can accelerate the vertical flux of POC tothe sediment (Honjo et al. 2008) and recycling of carbon and nutrients within the water column(Calbet & Landry 2004, Dagg et al. 2004). However, vertical flux of POC is difficult to measurein the energetic waters of the coastal zone and has not been well characterized in these regions.
Net ecosystem production (NEP) of DOC contributes approximately 20% of total primaryproduction (e.g., Hansell & Carlson 1998, Alvarez-Salgado et al. 2001) and 20–50% of the DOCin the coastal ocean. Primary production and NEP of DOC are not widely measured in continentalmargins, which contributes to underestimation of total primary production and NEP in the coastalocean. The DOM concentrations on continental shelves are elevated and contain a higher labilefraction than DOM in deep-slope waters, where carbon is more refractory and is enriched relativeto Redfield ratios of nitrogen and phosphorus (Hopkinson et al. 2002). Although the half-lives ofthe labile DOM pool are on the order of shelf-water residence time, a substantial pool of DOMthat is depleted in nitrogen and phosphorus relative to carbon remains in the shelf water andcould be exported by advective and eddy diffusive processes (Hopkinson et al. 2002). Almost halfof the global biological-pump transfer of organic carbon to the deep ocean occurs on continentalmargins ( Jahnke 2010). Over 40% of the marine PIC production in the form of calcium carbonateoccurs in the coastal ocean, including coral reefs and carbonate shelves (Milliman 1993, Gattusoet al. 1998). Ocean acidification will likely reduce PIC production and accelerate the dissolutionof carbonate substrates within coastal waters.
THE NORTHEASTERN NORTH AMERICAN MODEL
The NENA model was developed to investigate the transport and cycling of carbon and nitrogento and within the U.S. east coast coastal ocean margin and the impact of climate variability,climate change, and land-cover/land-use change on these fluxes (Hofmann et al. 2008). NENA is
www.annualreviews.org • Modeling Continental Shelf Carbon 103
Ann
u. R
ev. M
arin
e. S
ci. 2
011.
3:93
-122
. Dow
nloa
ded
from
ww
w.a
nnua
lrev
iew
s.or
gby
Dr
Cin
dy L
ee o
n 12
/16/
10. F
or p
erso
nal u
se o
nly.

MA03CH04-Hofmann ARI 17 November 2010 6:45
based on the Regional Ocean Modeling System (ROMS) and its biogeochemical module. ROMSis widely used for shelf circulation and coupled physical-biological applications (e.g., Dinnimanet al. 2003; Lutjeharms et al. 2003; Marchesiello et al. 2003; Peliz et al. 2003; Fennel et al. 2006,2008; Wilkin 2006). The ROMS computational kernel (Shchepetkin & McWilliams 1998, 2003,2005) produces accurate evolution of tracer fields, which is a particularly attractive feature forbiogeochemical modeling because it facilitates accurate interaction among tracers and accountingof total nutrient and carbon budgets.
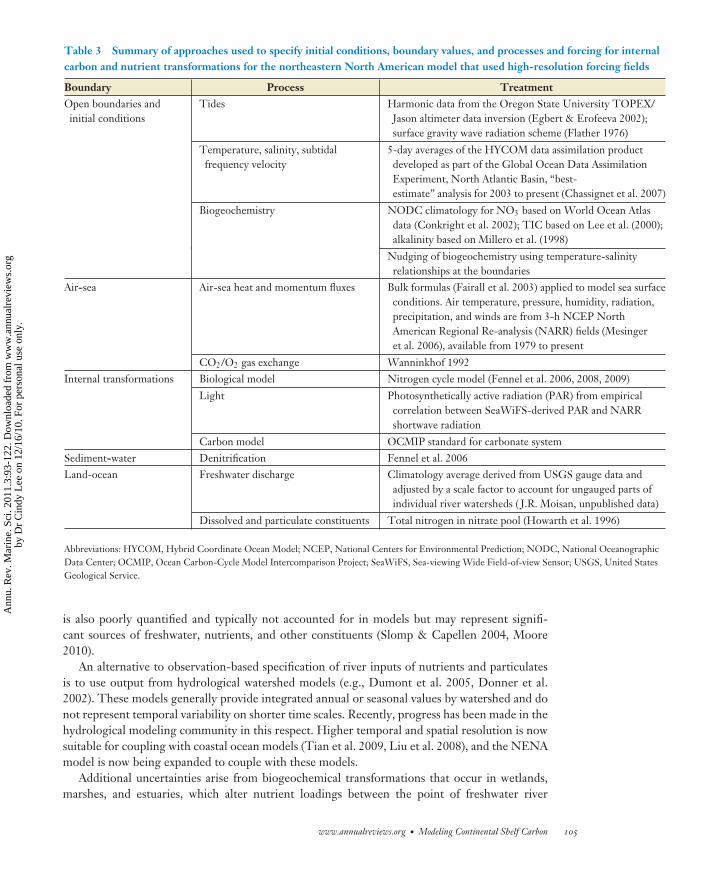
The NENA model domain (Figure 2) encompasses the entire U.S east coast continental shelf,which presents a number of challenges in terms of model complexity, boundaries, and resolution.There are 31 rivers represented along the land-ocean boundary, complex open boundaries thatinclude subtropical and subpolar regions of the Atlantic Ocean and a significant shelf area wheresediment-water interactions play an important role (e.g., Fennel et al. 2006). The configurationof the NENA model for this region uses a 10-km horizontal resolution and 30 terrain-followingvertical levels stretched to give high resolution in surface and bottom boundary layers. Thisis sufficient to capture the dominant dynamics governing shelf-wide circulation. Open boundarytemperature, salinity, and subtidal frequency velocity are taken from 5-day averages of the HYbridCoordinate Ocean Model (HYCOM) data assimilation product developed as part of the GlobalOcean Data Assimilation Experiment North Atlantic Basin “best-estimate” analysis for 2003 tothe present (Chassignet et al. 2007). Tides are introduced at the boundary using harmonic datafrom the Oregon State University Topex/Jason altimeter data inversion (Egbert & Erofeeva 2002)and a surface gravity wave radiation scheme (Flather 1976). Air-sea heat and momentum fluxesare computed using bulk formulae (Fairall et al. 2003) applied to model sea surface conditions. Airtemperature, pressure, humidity, radiation, precipitation, and winds are from 3-hour averages ofNational Center for Environmental Prediction North American Regional Re-analysis availablefrom 1979 to the present. Vertical turbulent mixing closure uses the parameterization of Mellor &Yamada (1982) and Warner et al. (2005). A summary of the choices made in configuring the NENAmodel is given in Table 3. The following sections provide more details on the biogeochemicalconfiguration choices and discussions and examples of the relative merits and limitations of someof these choices.
Land-Ocean Boundary
Coastal oceans and marginal seas receive inputs of freshwater, suspended mineral particles (ter-rigenous sediment), organic matter, and inorganic solutes (nutrients, dissolved carbon) from riversand groundwater discharge. In numerical models, these inputs can be represented as point or linesources, but obtaining accurate time-series estimates of these inputs in order to force simulationmodels is difficult. Deriving accurate freshwater discharges at river mouths from measurementsat upstream gauges is challenging because adjustments specific to each watershed are required toaccount for ungauged flow. In the NENA model, a climatology based on United States GeologicalSurvey gauging data (see Table 3 for details) is used to specify freshwater inputs.
In addition to freshwater discharges, the concentrations of dissolved and particulate con-stituents in these waters have to be specified, e.g., nitrate, ammonium, DOC, POC, particulateorganic nitrogen (PON), and others. Some variables, such as nutrients, are measured regularly atgauging stations, and sufficient measurements exist to construct a climatology. Other variables,however, are rarely or never measured, and thus it is simply assumed, as in the NENA model,that river concentrations are time-invariant. This precludes inclusion of temporal variations inconcentration, such as those that occur after heavy rain events. The effects of such events likelydepend on the type of watershed, e.g., urban versus agricultural areas. Groundwater discharge
104 Hofmann et al.
Ann
u. R
ev. M
arin
e. S
ci. 2
011.
3:93
-122
. Dow
nloa
ded
from
ww
w.a
nnua
lrev
iew
s.or
gby
Dr
Cin
dy L
ee o
n 12
/16/
10. F
or p
erso
nal u
se o
nly.
MA03CH04-Hofmann ARI 17 November 2010 6:45
Table 3 Summary of approaches used to specify initial conditions, boundary values, and processes and forcing for internalcarbon and nutrient transformations for the northeastern North American model that used high-resolution forcing fields
Boundary Process TreatmentOpen boundaries andinitial conditions
Tides Harmonic data from the Oregon State University TOPEX/Jason altimeter data inversion (Egbert & Erofeeva 2002);surface gravity wave radiation scheme (Flather 1976)
Temperature, salinity, subtidalfrequency velocity
5-day averages of the HYCOM data assimilation productdeveloped as part of the Global Ocean Data AssimilationExperiment, North Atlantic Basin, “best-estimate” analysis for 2003 to present (Chassignet et al. 2007)
Biogeochemistry NODC climatology for NO3 based on World Ocean Atlasdata (Conkright et al. 2002); TIC based on Lee et al. (2000);alkalinity based on Millero et al. (1998)
Nudging of biogeochemistry using temperature-salinityrelationships at the boundaries
Air-sea Air-sea heat and momentum fluxes Bulk formulas (Fairall et al. 2003) applied to model sea surfaceconditions. Air temperature, pressure, humidity, radiation,precipitation, and winds are from 3-h NCEP NorthAmerican Regional Re-analysis (NARR) fields (Mesingeret al. 2006), available from 1979 to present
CO2/O2 gas exchange Wanninkhof 1992Internal transformations Biological model Nitrogen cycle model (Fennel et al. 2006, 2008, 2009)
Light Photosynthetically active radiation (PAR) from empiricalcorrelation between SeaWiFS-derived PAR and NARRshortwave radiation
Carbon model OCMIP standard for carbonate systemSediment-water Denitrification Fennel et al. 2006Land-ocean Freshwater discharge Climatology average derived from USGS gauge data and
adjusted by a scale factor to account for ungauged parts ofindividual river watersheds ( J.R. Moisan, unpublished data)
Dissolved and particulate constituents Total nitrogen in nitrate pool (Howarth et al. 1996)
Abbreviations: HYCOM, Hybrid Coordinate Ocean Model; NCEP, National Centers for Environmental Prediction; NODC, National OceanographicData Center; OCMIP, Ocean Carbon-Cycle Model Intercomparison Project; SeaWiFS, Sea-viewing Wide Field-of-view Sensor; USGS, United StatesGeological Service.
is also poorly quantified and typically not accounted for in models but may represent signifi-cant sources of freshwater, nutrients, and other constituents (Slomp & Capellen 2004, Moore2010).
An alternative to observation-based specification of river inputs of nutrients and particulatesis to use output from hydrological watershed models (e.g., Dumont et al. 2005, Donner et al.2002). These models generally provide integrated annual or seasonal values by watershed and donot represent temporal variability on shorter time scales. Recently, progress has been made in thehydrological modeling community in this respect. Higher temporal and spatial resolution is nowsuitable for coupling with coastal ocean models (Tian et al. 2009, Liu et al. 2008), and the NENAmodel is now being expanded to couple with these models.
Additional uncertainties arise from biogeochemical transformations that occur in wetlands,marshes, and estuaries, which alter nutrient loadings between the point of freshwater river
www.annualreviews.org • Modeling Continental Shelf Carbon 105
Ann
u. R
ev. M
arin
e. S
ci. 2
011.
3:93
-122
. Dow
nloa
ded
from
ww
w.a
nnua
lrev
iew
s.or
gby
Dr
Cin
dy L
ee o
n 12
/16/
10. F
or p
erso
nal u
se o
nly.

MA03CH04-Hofmann ARI 17 November 2010 6:45
discharge and the coastal ocean. Although estuaries may be included in the model domain, e.g.,Chesapeake Bay in the NENA model, estuarine transformation processes may not be fully ac-counted for if the model resolution is insufficient to represent vertical mixing or estuarine cir-culation dynamics that affect residence time. Furthermore, benthic processes that are of lesserimportance in the open coastal seas, yet might be significant in enclosed estuarine waters, arecommonly omitted from biogeochemical models tailored to the shelf sea ecosystem.
Some river constituents (state variables) and biogeochemical processes may not be consideredin the shelf models at all, yet may have important roles. For example, high loads of terrigenoussediment in river plumes can increase light attenuation, thus trapping heat at the surface andlimiting photosynthetic production of organic matter. Within the NENA domain, it has beenshown (Cahill et al. 2008) that realistic modeling estimates of the amount and fate of POC, whichresults from high Hudson River discharge events onto the Middle Atlantic Bight (MAB) shelf,require variable light-attenuation as well as feedbacks from biological production to the heat fluxesin the upper water column.
Air-Sea Boundaries
Standard parameterizations for air-sea gas exchange of CO2 and oxygen (e.g., Wanninkhof 1992,Nightingale et al. 2000) are typically used in models to specify this flux, but uncertainties abouttheir general applicability remain, and some processes are not well represented, e.g., supersat-uration of oxygen by bubbles (D’Asaro & McNeil 2007). The NENA model uses the standardparameterization given in Wanninkhof (1992) (Table 3). Although nitrogen deposition may bean important process in the region (see discussion above), rates are not yet well enough known toinclude in the NENA model.
Sediment-Water Boundary
Sediment denitrification (i.e., the removal of fixed nitrogen parameterized as described above) hasimportant consequences for the internal transformations of shelf systems, e.g., primary produc-tion, and leads to a counterintuitive interaction between nitrogen and carbon cycling processes onthe shelf. Denitrification lowers the availability of fixed nitrogen, which in turn reduces the pho-tosynthetic fixation of inorganic carbon into organic matter, which should decrease the oceanicuptake of CO2. However, sediment denitrification produces alkalinity, which will promote uptakeof atmospheric CO2. The generation of alkalinity is typically associated with the dissolution ofcalcium carbonate, which mostly occurs below the lysocline in the deep ocean; however, sev-eral anaerobic remineralization processes that occur in sediments on continental shelves generatealkalinity as well (Chen 2002).
The highest level of benthic-pelagic interaction in a biogeochemical model is a two-way, cou-pled water column–sediment model (Soetaert et al. 2000), but few biogeochemical models includethis two-way coupling. Models for shelf seas typically parameterize benthic-pelagic coupling insimple ways. In the NENA model, on the basis of observations by Seitzinger & Giblin (1996), den-itrification is assumed to be proportional to the sediment oxygen demand required to oxidize themodeled flux of particulate matter to the seabed. An alternative is to derive parameterizations bymeans of meta-analyses of diagenetic models as described in Middelburg et al. (1996) and Soetaertet al. (2000). Comparison of the meta-model parameterization in Middelburg et al. (1996) againsta large coastal data set of nitrogen fluxes across the sediment-water interface showed large dis-crepancies, indicating that the meta-analyses of diagenetic models should be validated regionallywith available observations (Fennel et al. 2009).
106 Hofmann et al.
Ann
u. R
ev. M
arin
e. S
ci. 2
011.
3:93
-122
. Dow
nloa
ded
from
ww
w.a
nnua
lrev
iew
s.or
gby
Dr
Cin
dy L
ee o
n 12
/16/
10. F
or p
erso
nal u
se o
nly.

MA03CH04-Hofmann ARI 17 November 2010 6:45
Internal Transformations
The present configuration of the NENA model contains one phytoplankton component and sodoes not allow simulation of seasonally dependent effects in phytoplankton production arisingfrom changing community composition. Also, simulation of the timing and magnitude of bloomsis limited by inclusion of a single phytoplankton component. For these reasons, the NENA modelis being reconfigured to include more than one phytoplankton component (Figure 3).
Similarly, the ability to explicitly simulate changes in the semilabile DOM pool is critical tounderstanding the internal cycling of carbon and nutrients on the shelf. This capability is nowincluded in the NENA model (Druon et al. 2010) (Figure 3).
In the NENA model, alkalinity is initialized as a function of salinity because its distribution fol-lows that of salinity to first order (Millero et al. 1998). However, in coastal regions, humic materials(Cai et al. 1998), dissolved organic matter (Hernandez-Ayon et al. 2007), and microorganisms (Kimet al. 2006) can become significant contributors to measured alkalinity. Where humic substancesand organic bases produced by phytoplankton are important but not recognized, calculation ofpCO2 and the resulting CO2 flux estimates will be in error. The current configuration used for theNENA model is based on point-source, monthly climatological estimates for river outflow, whichdoes not include these effects and, as a result, potentially introduces a bias in CO2 flux estimates.Efforts are under way to incorporate high temporal and spatial resolution output as it becomesavailable from hydrological watershed models suited to coupling with coastal ocean models.
Seasonal relationships between total inorganic carbon (TIC) and sea surface temperature(SST) were developed for regions around the world (Lee et al. 2000) using measurements madeduring the late 1980s and early 1990s as part of the Joint Global Ocean Flux Study. However,these data sets are now 20 years old and do not reflect recent changes in riverine freshwater inputs,changes resulting from ice melt at high latitudes, and changes in ocean acidification. Data sets andapproaches for the development of new parameterizations that include these effects are neededto undertake simulations of the effects of climate variability on carbon cycling in continental shelfwaters.
Initial Fields and Boundary Conditions
Continental shelf models are regional in scope and therefore include open boundaries, which de-mands that oceanic conditions beyond the model domain be prescribed from data and/or resultsfrom a larger-scale model. Where large-scale biogeochemical models are available, this can be donefor biological variables as well, or it may be necessary or preferable to prescribe open-boundarybiological variables based on climatological data. Our experience with NENA simulations showsthat nutrients, oxygen, TIC, and alkalinity are the critical variables in determining simulationresults and hence require the most care in specification of initial and boundary values. Phyto-plankton and zooplankton biomass and detritus are less critical because the adjustment scales forthese variables in the NENA model (and others) are relatively short (∼5–10 days).
Boundary estimates for nitrate, TIC, alkalinity, and oxygen are important to the accuracy androbustness of the simulation results, and these vary both regionally and, in the upper mixed layer,seasonally. Some of this variability is captured by using the property-property relationships thatexist between nitrate, TIC, and alkalinity and physical variables such as temperature and salinity.However, these relationships are region-specific (Lee et al. 2000, Millero et al. 1998, Koeve 2001)and do not necessarily apply over the entirety of the model domain. The nitrate-temperaturerelationships used in the NENA model were derived from World Ocean Atlas data (Conkrightet al. 2002) and account for regional differences in the subpolar and subtropical regions but do
www.annualreviews.org • Modeling Continental Shelf Carbon 107
Ann
u. R
ev. M
arin
e. S
ci. 2
011.
3:93
-122
. Dow
nloa
ded
from
ww
w.a
nnua
lrev
iew
s.or
gby
Dr
Cin
dy L
ee o
n 12
/16/
10. F
or p
erso
nal u
se o
nly.
MA03CH04-Hofmann ARI 17 November 2010 6:45
not necessarily describe nutrient distributions adequately on the continental shelf. Attempts toresolve along- and across-shelf gradients are under way, and some improvement in biological stateestimates has been realized by accounting for these gradients.
At the open boundaries of the NENA domain (Figure 2), the biogeochemical variables areconstrained by nudging within a buffer zone. Nudging refers to the relaxation of model estimates topredetermined values. For the NENA model simulations, conditions along the open boundarieswere specified using temperature and salinity values obtained from the HYCOM (Chassignetet al. 2007), with nitrate, TIC, alkalinity, and oxygen fields derived from the property-propertyrelationships described above (Table 3). All other biogeochemical variables are nudged to smallconstant values.
Effect of Initial and Forcing Fields
Significant advances have been made in the last 10 years on the availability of reliable estimates ofphysical variables from basin-scale forecast models. Using higher spatial and temporal resolutionproducts to initialize and force the model can considerably improve ocean state estimates. Forexample, comparisons of satellite-derived SST distributions from 2004 (Figure 5a) with simu-lated SST from two NENA simulations, which were initialized and forced differently (Figure 5b, f
reflects lower-resolution forcing and earlier versions of initial condition fields; Figure 5d,g reflectshigher-resolution forcing and conditions shown in Table 3), show improvement, as measured bystatistical comparisons, that can be attributed to better resolution in the initial and forcing fields.The improved resolution of the forcing fields (Figure 5d ) resulted in many cases in substantiallybetter comparisons with satellite-derived SST than those obtained for the lower-resolution simu-lation (Figure 5b). The scatter in the SST frequency distribution was reduced, and differences insimulated and observed SST were confined mostly to the region influenced by variability in theGulf Stream location.
These changes in initial and forcing fields also had a small but significant effect on the abilityof the model to reproduce the annual SST cycle. Target diagrams ( Joliff et al. 2009) providea quantitative means for assessing the effect of changes in initial and forcing fields on the SSTsimulation. These diagrams were constructed for each of the seven subregions (Figure 2) to assessspatial dependency of the model SST skill. Within the Northeast Slope region, there was verylittle change between the two simulations; however, in the SAB, SST was underestimated usingthe original forcing fields (Figure 6a) and overestimated using the updated fields (Figure 6b).Similarly, for the Scotian shelf, seasonal variability was underestimated in the original simulationbut overestimated in the updated simulation. The general pattern emerging from the target dia-grams is that the new forcing fields resulted in a slightly more positive bias in the simulated SSTfor the primary continental shelf region (MAB, SAB, and Gulf of Maine), which is of similar signin each of these subregions.
These changes in forcing fields had a relatively small effect on surface chlorophyll concentra-tions. Simulated surface-chlorophyll concentrations were instead more sensitive to the choice ofinitial nitrate conditions used in the simulation. The original nitrate initial conditions used didnot include sufficiently large cross-shelf concentration gradients. When these initial conditionswere made more realistic, the improvement in model-data fit in terms of surface chlorophyll wassignificant throughout the entire simulation and throughout the entire model domain (Figure 7).This illustrates the importance of generating appropriate initial nutrient fields in coastal carboncycling models.
108 Hofmann et al.
Ann
u. R
ev. M
arin
e. S
ci. 2
011.
3:93
-122
. Dow
nloa
ded
from
ww
w.a
nnua
lrev
iew
s.or
gby
Dr
Cin
dy L
ee o
n 12
/16/
10. F
or p
erso
nal u
se o
nly.

MA03CH04-Hofmann ARI 17 November 2010 6:45
0 10 20 30 40Satellite SST (°C)
NEN
A v
1 SS
T (°
C)
0
10
20
30
40Frequency
1
10
100
Satellite SST (°C)
NEN
A v
4 SS
T (°
C)
0
10
20
30
40Frequency
1
10
100
0 10 20 30 40
50 10 15 20NENA v1 SST (°C)
25 30 35 –10–15 –5 0 5NENA v1 - satellite difference (°C)
10 15
50 10 15 20Satellite SST (°C)
25 30 3550 10 15 20
NENA v4 SST (°C)25 30 35 –10–15 –5 0 5
NENA v4 - satellite difference (°C)10 15
a b c
d e
f g
Intercept: 3.084Slope: 0.902R2: 0.931RMSD: 2.364
Intercept: 2.733Slope: 0.929R2: 0.942RMSD: 2.296
Figure 5Comparison of monthly averaged satellite-derived sea surface temperature (SST) from June 2004 (a) with SST obtained from forcingwith low-resolution fields (NENA v1; panel b) and higher-resolution fields (NENA v4; panel d ). Monthly mean satellite SST data werederived from merged SST data from the AVHRR Pathfinder and MODIS (Terra and Aqua) sensors. Anomalies (c, e) are represented asthe difference between the modeled and satellite data, and the scatter plots are a joint probability distribution of the model results overthe 40,013 satellite SST measurements. The region encompassed in the NENA model domain (b–e) is the same region used for theJune 2004 SST observations (a). Abbreviations: AVHRR, Advanced Very High Resolution Radiometer; MODIS, Moderate ResolutionImaging Spectroradiometer; NENA, northeastern North American model; RMSD, root mean squared difference.
www.annualreviews.org • Modeling Continental Shelf Carbon 109
Ann
u. R
ev. M
arin
e. S
ci. 2
011.
3:93
-122
. Dow
nloa
ded
from
ww
w.a
nnua
lrev
iew
s.or
gby
Dr
Cin
dy L
ee o
n 12
/16/
10. F
or p
erso
nal u
se o
nly.

MA03CH04-Hofmann ARI 17 November 2010 6:45
0.5
–0.5
nBias
nRMSDCP nRMSDCP
–0.5
0.5
–0.5
nBias
0.5
–0.5
SSGOMMABNES
SABGSSARData
0.00.00.00.0–1.0–1.0 0.50.5 1.01.0
–1.0–1.0
1.01.0
0.00.00.00.0–1.0–1.0 1.01.0
–1.0–1.0
1.01.0
0.00.0–1.0 0.5 1.0
–1.0
1.0
0.00.0–1.0 1.0
–1.0
1.0a b
Figure 6Target diagrams for time-series of monthly averaged modeled SST compared with satellite-derived SST forthe simulation using (a) low-resolution forcing fields and that using (b) higher-resolution forcing fields. Thediagrams illustrate the normalized bias (nBias; y axis), centered-pattern root mean squared difference(nRMSDCP; x axis) and total RMSD (distance from the origin to each symbol). These statistics arenormalized by the standard deviation of the observations and are shown for seven subregions of the modeldomain (defined in Figure 2): GOM, Gulf of Maine; GS, Gulf Stream; MAB, Middle Atlantic Bight;NES, Northeast Slope; SAB, South Atlantic Bight; SAR, Sargasso Sea; SS, Scotian Shelf.
DATA RELIABILITY FOR MODEL EVALUATION
Monthly, seasonal, and annually averaged vertical distributions of quantities, such as nutrients andchlorophyll, can be constructed from data archives, such as the World Ocean Atlas Data, but theseare limited in spatial extent and represent climatological distributions, which provide guidanceonly on general structures and magnitudes.
Chlorophyll distributions derived from satellite ocean-color measurements are routinely usedto evaluate the accuracy and skill of simulated chlorophyll fields. In most of these comparisons,the satellite-derived distributions are assumed to represent the truth, and statistical measuresof the correspondences between the two fields are calculated to provide a quantitative measureof performance. Evaluation of the NENA model output has relied extensively on ocean colormeasurements (e.g., Figure 7a) and on quantities derived from these, such as primary productionand POC. The satellite-derived data sets provide the best comparisons for the model-deriveddistributions because these data are on space and time scales that are compatible with those of theNENA model.
The Sea-viewing Wide Field-of-view Sensor (SeaWiFS) global algorithm used to constructchlorophyll distributions assumes the same characteristics for coastal, regional, open ocean, andbasin scale environments. However, algorithms vary at regional scales and differ for coastal andopen ocean environments (e.g., O’Reilly et al. 1998, Kahru & Mitchell 2001, Stramska et al. 2003,Gregg & Casey 2004, Darecki & Stramski 2004, Stramska & Stramski 2005). For example, thechlorophyll concentrations estimated for MAB coastal waters using the SeaWiFS algorithm arenearly a factor of two higher than those derived using an algorithm developed for this region (Panet al. 2010) (Figure 8). Thus, model-data comparisons for the MAB shelf region that are basedon SeaWiFS chlorophyll derived from the global algorithm may already have a bias that resultsfrom the way the data are analyzed.
In model-data evaluation exercises, it cannot be assumed a priori that the data represent thetrue state of the system. For data such as ocean color, construction of climatologies will allow
110 Hofmann et al.
Ann
u. R
ev. M
arin
e. S
ci. 2
011.
3:93
-122
. Dow
nloa
ded
from
ww
w.a
nnua
lrev
iew
s.or
gby
Dr
Cin
dy L
ee o
n 12
/16/
10. F
or p
erso
nal u
se o
nly.

MA03CH04-Hofmann ARI 17 November 2010 6:45
0.10.03 0.3 1 3NENA NO3 v2
chlorophyll a (mg m–3)
10 30 0.1 0.33 1 3NENA NO3 v2:Satellite
chlorophyll a (ratio)
10 33
0.01 0.1 1 10 100Satellite chlorophyll a (mg m–3)
NEN
A N
O3 v
2ch
loro
phyl
l a (m
g m
–3)
0.01
0.1
1
10
100Frequency
1
10
100
g
0.10.03 0.3 1 3
NENA NO3 v1chlorophyll a (mg m–3)
10 30 0.1 0.33 1 3
NENA NO3 v1:Satellitechlorophyll a (ratio)
10 33
0.10.03 0.3 1 3Satellite chlorophyll a (mg m–3)
10 30
a b c
d e
0.01 0.1 1 10 100Satellite chlorophyll a (mg m–3)
NEN
A N
O3 v
1ch
loro
phyl
l a (m
g m
–3)
0.01
0.1
1
10
100Frequency
1
10
100
f
Intercept: 0.491Slope: 0.865R2: 0.436RMSD: 0.692
Intercept: 0.240Slope: 1.121R2: 0.651RMSD: 0.370
Figure 7Comparison of monthly averaged chlorophyll values derived from Sea-Viewing Wide Field-of-view Sensor (SeaWiFS) ocean colormeasurements from October 2004 (a) with simulated values obtained using original nitrate initial conditions (NENA v1; panel b) andupdated nitrate initial conditions that include a better representation of along- and across-shelf gradients (NENA v2; panel d ).Anomalies (c, e) are represented as ratios (model:satellite) because chlorophyll a concentration is log-normally distributed. The scatterplots ( f, g) represent a joint probability distribution of the model results compared with the 36,800 satellite chlorophyll a data points.Abbreviations: NENA, northeastern North American model; RMSD, root mean squared difference.
www.annualreviews.org • Modeling Continental Shelf Carbon 111
Ann
u. R
ev. M
arin
e. S
ci. 2
011.
3:93
-122
. Dow
nloa
ded
from
ww
w.a
nnua
lrev
iew
s.or
gby
Dr
Cin
dy L
ee o
n 12
/16/
10. F
or p
erso
nal u
se o
nly.

MA03CH04-Hofmann ARI 17 November 2010 6:45
0.10.03 0.3 1 3Global chlorophyll a (mg m–3)
10 30 0.10.03 0.3 1 3Regional chlorophyll a (mg m–3)
10 30 0.50.25 1 2Global:Regional chlorophyll a (ratio)
4
a b c
Figure 8Comparison of chlorophyll concentrations and distributions obtained using (a) the standard Sea-Viewing Wide Field-of-view Sensor(SeaWiFS) global chlorophyll algorithm OC4 and (b) a regional chlorophyll algorithm developed from measurements made in MiddleAtlantic Bight coastal waters (Pan et al. 2010). (c) The ratio of the chlorophyll concentrations estimated by the two algorithms indicatesthat the global algorithm overestimates chlorophyll in coastal waters. These comparisons use 2004 annual mean SeaWiFS-derivedchlorophyll distributions.
comparison of patterns, and the trends and relative changes obtained from these are likely correct.However, comparisons of absolute amplitudes and concentrations are not necessarily good metricsfor evaluation of model accuracy and skill, because these depend on the level of uncertainty ofsatellite global ocean algorithms as applied to specific regions of interest. Where uncertainty levelsexceed an acceptable threshold, other alternatives should be considered. For example, ocean colormeasurements that can be used for evaluation of continental-shelf carbon models may be possiblewith development of regional algorithms that are then blended between regions and the openocean.
NENA MODEL RESULTS
The NENA model described in the previous sections has been used to address questions aboutbiogeochemical processes on continental shelves and how these influence carbon budgets. A firstapplication of the model focused on understanding sediment denitrification as a nutrient sink onthe MAB continental shelf (Fennel et al. 2006). This modeling study was motivated by observations(Nixon et al. 1976, Aller 1980) that showed that only a fraction of the nitrogen associated withorganic matter reaching the bottom in shelf environments was returned to the water column,whereas a significant fraction is denitrified in the sediments and thus lost from the system asnitrogen gas. Benthic mineralization processes are represented in the NENA model through abottom boundary condition that balances the flux of organic matter sinking to the seafloor withan influx of inorganic nutrients at the sediment-water interface (Figure 3). The mean annualdenitrification flux for the MAB calculated from the NENA simulations was 1.1 mmol N m−2 d−1,which compared well with the fluxes estimated from observations (1.4 mmol N m−2 d−1) for theeastern U.S. continental shelf region between Nova Scotia and Cape Hatteras (Seitzinger & Giblin1996) and with direct measurements of sediment denitrification (1.7 ± 0.6 mmol N m−2 d−1)
112 Hofmann et al.
Ann
u. R
ev. M
arin
e. S
ci. 2
011.
3:93
-122
. Dow
nloa
ded
from
ww
w.a
nnua
lrev
iew
s.or
gby
Dr
Cin
dy L
ee o
n 12
/16/
10. F
or p
erso
nal u
se o
nly.

MA03CH04-Hofmann ARI 17 November 2010 6:45
at a site on the inner MAB shelf (Laursen & Seitzinger 2002). A strength of the NENA modelis that it allows development of synthesis products such as budgets; this approach was used toshow the importance of sediment denitrification on the MAB (see Figure 8 in Fennel et al.2006). Sediment denitrification was found to remove 90% of all of the nitrogen entering the MABand is therefore an important process in determining the availability of fixed nitrogen and theprimary production on the shelf. Extension of the MAB nitrogen flux estimated to the NorthAtlantic basin suggested that shelf denitrification could result in an annual removal of 2.3 ×10¹² mol N, which is an order of magnitude greater than removal estimates by nitrogen fixation.A nitrogen sink on the continental shelf has direct implications for carbon cycling because the twoare linked (Figures 2, 4). It was hypothesized that a denitrification flux should result in outgassingof CO2.
In a follow-up study, Fennel et al. (2008) illustrated the importance of linkages and feedbacksin nitrogen and carbon cycling dynamics using model-based studies of the effects of changes innutrient availability and alkalinity due to sediment denitrification on the air-sea flux of CO2 inthe MAB. This study combined the biological model used by Fennel et al. (2006) with a modelthat provided explicit representation of the inorganic carbon chemistry dynamics and air-seagas exchange of CO2, which allowed testing of their 2006 hypothesis that nutrient removal bysediment denitrification will reduce the air-sea flux of CO2. The model was also used to dosensitivity studies designed to identify the controlling process for linking sediment denitrificationand air-sea CO2 exchange. The simulations showed that decreased availability of fixed nitrogendue to denitrification reduces primary production and incorporation of inorganic carbon intoorganic matter. This produces an increase in seawater pCO2 and increases alkalinity, which inturn provides an opposing decrease in seawater pCO2. The air-sea CO2 flux estimated for theMAB from the NENA simulations is at the low end of those made for other continental shelfregions from modeling studies (Table 2).
Once CO2 is taken up from the atmosphere by the coastal oceans, its ultimate fate is determinedby the magnitude of the processes that constitute the biological continental shelf carbon pump.Modeling studies have been used to estimate the amount of this carbon that is buried and/orexported from the continental shelf (Tables 1 and 2). The NENA model was used to estimatethe portion of atmospheric CO2 taken up through biological processes on the MAB continentalshelf and the portion that is exported from the shelf to the open ocean—quantities that are verydifficult to obtain from direct measurements. The NENA simulations suggest that the annual area-normalized uptake of atmospheric CO2 over the MAB (Table 2) was not consistently larger thanthat in the adjacent deep ocean (Fennel & Wilkin 2009). The horizontal export of carbon fromthe shelf was not sufficient to produce a significant continental shelf carbon pump for the NorthAmerican eastern margin. Simulated CO2 uptake was maximal on the shelf during winter andspring, but simulated outgassing was maximal in summer and fall, which resulted in net annualfluxes that were similar to the adjacent open ocean region (Fennel & Wilkin 2009). However,analysis of the simulations showed that the processes that produce the carbon export differ for theshelf and open ocean.
Inclusion of DOM dynamics in the NENA model (Druon et al. 2010) allowed further refine-ment of the carbon export processes from the MAB (Table 2). These simulations showed theimportance of the large organic carbon pool represented by DOM in regulating MAB primaryproduction. DOM also partially decouples the carbon and nitrogen cycles through its effects oncarbon excess uptake, POM solubilization, and DOM mineralization. The inclusion of DOM in-creased the simulated primary production of the MAB by 60–180 g C m−2 y−1 through increasedammonium release from DON mineralization in the upper water column and by excess production
www.annualreviews.org • Modeling Continental Shelf Carbon 113
Ann
u. R
ev. M
arin
e. S
ci. 2
011.
3:93
-122
. Dow
nloa
ded
from
ww
w.a
nnua
lrev
iew
s.or
gby
Dr
Cin
dy L
ee o
n 12
/16/
10. F
or p
erso
nal u
se o
nly.

MA03CH04-Hofmann ARI 17 November 2010 6:45
Table 4 Major carbon fluxes calculated from the northeastern North American simulations used in Fennel et al. (2008)a
Region
DIC + POCfrom rivers
(1012 g C y−1)PP
(1012 g C y−1)
Total air-sea CO2
flux(1012 g C y−1)
Horizontaldivergence of POC
(1012 g C y−1)
Horizontal divergenceof DIC
(1012 g C y−1)Scotian Shelf 0 13.8 (0.0) 3.8 (−0.7) 0.8 (0.0) −1.1 (+2.3)Gulf of Maine 0.6 36.0 (−7.0) 3.6 (+1.8) 1.1 (−0.4) 14.1 (−8.0)Middle AtlanticBight
1.6 21.8 (−3.4) 0.9 (+0.5) 0.5 (+0.1) 4.4 (−3.5)
South AtlanticBight
0.8 7.5 (+11.9) −0.3 (+1.0) 0.5 (+2.6) 6.7 (−1.2)
aThe difference between these fluxes and those obtained from the NENAv4 simulations is shown in parentheses (NENAv4; Fennel et al. 2008). The fluxdifferences illustrate the effect of changing a suite of factors (e.g., light parameterization, meteorological forcing, and new nitrate initial conditions) oncarbon flux estimates. The fluxes were calculated for the model regions shown in Figure 2.Abbreviations: DIC, dissolved inorganic carbon; POC, particulate organic carbon; PP, primary production.
of carbohydrates. Thus, addition of explicit DOM allowed a more complete description of carbonand nitrogen cycling on the MAB.
However, as discussed previously, fluxes estimated from the NENA model simulations (or anymodel) are dependent on choices made for initial conditions, parameterization of processes, andmodel dynamics (Figures 5–8). As an illustration of the effects of these choices, primary carbonfluxes were calculated from the NENA model used in Fennel et al. (2008) and a version thatused higher-resolution forcing fields, revised initial nutrient conditions, and a different parame-terization for light (NENAv4) (Figures 5, 7) but kept the circulation model resolution and thefundamental biogeochemical model unchanged. Any differences therefore stem from justifiablechoices in the respective configurations and represent one realization of the uncertainty in themodeled flux estimates. Comparison of the differences in the estimated fluxes (Table 4) showschanges that are generally less than 20%, except in the SAB where differences were much larger.
Model-derived carbon flux estimates, such as those provided in Table 4, and results fromfocused model-based research applications (Table 2) allow quantification of processes that controlcarbon cycling on continental shelves. Models are likely to be the only viable approach for inferringthe many fluxes that control carbon cycling on continental shelves (Figure 4) in a consistentmanner. However, the fluxes derived from models have an associated uncertainty that is based inchoices made in model development and implementation.
CHALLENGES AND THE FUTURE
The scale of application of a model places important limitations that have implications for themodel results. Models for continental shelf systems are perhaps the most difficult to developbecause global, estuarine, and regional scales come together at the scale of continental shelf sys-tems. The previous sections clearly show that model solutions are dependent on choices madefor implementation approaches and parameterizations that arise because of the scales that areaddressed by the model. Boundary conditions, initial conditions, and forcing fields provide in-formation at scales larger than those resolved by the model, and how these are prescribed hassignificant effects on the skill of the model simulations. For the NENA model, the high-resolutionforcing fields used for air temperature and downwelling radiation improved simulation of SST,and changing the initial condition formulation for nitrate improved the simulation of surfacechlorophyll. However, improvement in one model component may remove problems that mask
114 Hofmann et al.
Ann
u. R
ev. M
arin
e. S
ci. 2
011.
3:93
-122
. Dow
nloa
ded
from
ww
w.a
nnua
lrev
iew
s.or
gby
Dr
Cin
dy L
ee o
n 12
/16/
10. F
or p
erso
nal u
se o
nly.

MA03CH04-Hofmann ARI 17 November 2010 6:45
incorrect dynamics in other components that were not apparent in the solutions. Incrementalchanges in model structure and reevaluation of model skill is an ongoing, iterative process thatis critical to the development of carbon cycle models. Hindcasts with accompanying rigorousanalysis of model solutions provide a powerful approach for model improvement.
The NENA model is one of several developed for continental shelf systems (Table 2). Themodels vary in their dynamics, but all provide estimates of primary production, which allows across-system comparisons. Analysis of differences in these estimates provides a basis for understandingwhat drives carbon cycling in a wide range of systems. The earlier versions of the NENA modelincluded less complex biological dynamics than other models, but they allowed for coupling atall the land, ocean, and atmosphere boundaries as well as explicit representation of carbon andnutrient cycling.
For the NENA model and other coastal carbon models, benthic-pelagic coupling is importantfor internal carbon and nutrient transformations. The current configuration of NENA param-eterizes benthic-pelagic coupling in terms of a bottom boundary flux (Figure 3). However, theapparent importance of sediment denitrification processes in continental shelf systems (Fennelet al. 2009), for example, underscores the need for explicit representation of these processes incontinental-shelf carbon models.
Improvement in simulation of phytoplankton distribution and production will require inclusionof more than one phytoplankton functional group. The single component used in Fennel et al.(2006, 2008) and Druon et al. (2010) is adequate for simulation of general patterns and trends.However, matching simulated and observed distributions and projecting future changes requiresmore flexibility in the trophic level that is controlling primary production. Expansion of theprimary production component of the NENA model may also require better representations ofcoastal optics and aggregation and sedimentation effects. These processes are now in the NENAmodel but are parameterized using general formulations based on measurements from a range ofenvironments. The regional specificity of these processes is unknown and thus represents an areawhere research can inform and improve continental-shelf carbon models.
Specification of boundary conditions for regional continental shelf models requires details forthe land-ocean, ocean-atmosphere, and sediment-water boundaries. The NENA model uses arange of approaches, models, and data sets to specify inputs at these boundaries. The choicesused for specifying the boundaries are determined by what is available rather than by what isneeded. Throughout development of the NENA model, much effort has gone into representingprocesses on boundaries because these have proved to have important effects on the model-deriveddistributions. A lesson learned from the NENA model is that linking of different models (e.g.,HYCOM) is not straightforward, because biases and trends in the solutions of one model aretransferred to the other model. The resultant mismatch in model dynamics can overwhelm thesimulations of the regional model. The ability to link different models is nevertheless critical,especially as emphasis is placed on long-term projection of future states.
The solutions obtained with the current configuration of the NENA model represent only asingle realization of possible outcomes. Ensembles of solutions provide more robust estimates ofcarbon cycling on continental shelf systems because ensembles allow for the inclusion of uncer-tainty in model processes, and also in initial and boundary conditions. However, using an ensembleapproach requires information to specify ranges for processes, which in turn requires more exten-sive data sets that describe processes of carbon and nitrogen cycling. This approach also places agreater demand on computing resources.
Quantitative evaluation of simulations is a critical and required component of any model appli-cation (e.g., Hofmann et al. 2008). However, the quality and uncertainty of the data sets used forthis evaluation need to be assessed. The comparison between chlorophyll fields obtained with the
www.annualreviews.org • Modeling Continental Shelf Carbon 115
Ann
u. R
ev. M
arin
e. S
ci. 2
011.
3:93
-122
. Dow
nloa
ded
from
ww
w.a
nnua
lrev
iew
s.or
gby
Dr
Cin
dy L
ee o
n 12
/16/
10. F
or p
erso
nal u
se o
nly.

MA03CH04-Hofmann ARI 17 November 2010 6:45
SeaWiFS global and regional algorithms underscores the problems with comparisons against adata set that is considered the standard for model evaluations. Similar issues arise when comparingmodel solutions obtained using forcing conditions for a particular time and/or location againstdata climatologies. Much still needs to be done to determine the best approaches for model-data comparisons that will reveal fundamental issues with models that are not the result of datastructure.
Equally important are analyses of model structure, model complexity, and model uncertainty.Such analyses are needed to determine both the benefits accrued by including additional com-ponents versus using a more accurate representation of rates and processes and the implicationsof these for reducing model uncertainty. Variational data assimilation techniques provide an ap-proach for evaluating these issues (Friedrichs et al. 2006, 2007). Improved projections of carboncycling on continental shelf systems may be best obtained via data assimilation techniques com-bined with mechanistic approaches. However, there are trade-offs in this approach that comefrom the amount and type of data that are needed and the computational resources needed forparameter estimation.
Removal of biomass via fisheries, changes in freshwater inputs and wind patterns due to climatechange, and increasing coastal hypoxia are just a few examples of effects that will potentially altercarbon and nitrogen cycling on continental shelves. As these natural and human-induced changescontinue, more emphasis will be placed on models to project the consequences of these actionsfor continental shelf systems. Models, such as the NENA model, can be used to address theseissues. These models will continue to undergo development, and it is important to ensure that theproducts from these models, e.g., simulations of acidification and primary production trends, areavailable in a form that can be used by policy and management communities.
DISCLOSURE STATEMENT
The authors are not aware of any affiliations, memberships, funding, or financial holdings thatmight be perceived as affecting the objectivity of this review.
ACKNOWLEDGMENTS
The U.S. Eastern Continental Shelf project is supported by the National Aeronautics andSpace Administration (NASA) Interdisciplinary Science Program (NASA Award NNG04GL68G)and by the NASA Carbon Cycle Science through the Ocean Biology and BiogeochemistryProgram (NASA award NNX08AO25G). The SeaWiFS and MODIS ocean color data wereobtained from the NASA Ocean Biology Processing Group (http://oceancolor.gsfc.nasa.gov).The sea surface temperature data were derived from nighttime scenes composited from theAVHRR Pathfinder sensor on the National Oceanic and Atmospheric Administration’s polar-orbiting satellites (http://podaac.jpl.nasa.gov) and from NASA’s MODIS Terra and Aqua sen-sors (http://oceancolor.gsfc.nasa.gov).
LITERATURE CITED
Allen JI, Blackford J, Holt J, Proctor R, Ashworth M, Siddom J. 2001. A highly spatially resolved ecosystemmodel for the North West European Continental Shelf. Sarsia 86:423–40
Aller RC. 1980. Diagenetic processes near the sediment-water interface of Long Island Sound. I. Decompos-itoin and nutrient element chemistry (S, N, P). Adv. Geophys. 22:238–50
116 Hofmann et al.
Ann
u. R
ev. M
arin
e. S
ci. 2
011.
3:93
-122
. Dow
nloa
ded
from
ww
w.a
nnua
lrev
iew
s.or
gby
Dr
Cin
dy L
ee o
n 12
/16/
10. F
or p
erso
nal u
se o
nly.
MA03CH04-Hofmann ARI 17 November 2010 6:45
Aller RC. 1988. Benthic fauna and biogeochemical processes in marine sediments: the role of burrow struc-tures. In Nitrogen Cycling in Coastal Marine Environments, ed. THS Blackburn, J Sorensen, pp. 301–38.Chichester, UK: Wiley
Aller RC. 1994. Bioturbation and remineralization of sedimentary organic matter: effects of redox oscillation.Chem. Geol. 114:331–45
Alvarez-Salgado XA, Gago J, Mıguez BM, Perez FF. 2001. Net ecosystem production of dissolved organiccarbon in a coastal upwelling system: the Rıa de Vigo, Iberian margin of the North Atlantic. Limnol.Oceanogr. 46:135–47
Arrigo KR, van Dijken G, Long M. 2008. Coastal Southern Ocean: a strong anthropogenic CO2 sink. Geophys.Res. Lett. 35:L21602
Borges AV, Delille B, Frankignoulle M. 2005. Budgeting sinks and sources of CO2 in the coastal ocean:diversity of ecosystems counts. Geophys. Res. Lett. 32:L14601
Cahill B, Schofield O, Chant R, Wilkin J, Hunter E, et al. 2008. Dynamics of turbid buoyant plumes and thefeedbacks on near-shore biogeochemistry and physics. Geophys. Res. Lett. 35:L10605
Cai W-J. 2011. CO2 flux and net heterotrophy in coastal waters. Annu. Rev. Mar. Sci. 3: In pressCai W-J, Dai M, Wang Y. 2006. Air-sea exchange of carbon dioxide in ocean margins: a province-based
sysnthesis. Geophys. Res. Lett. 33:L12603Cai W-J, Wang Y, Hodson RE. 1998. Acid-base properties of dissolved organic matter in the estuarine waters
of Georgia, US. Geochim. Cosmochim. Acta 62:473–83Cai W-J, Wang Z, Wang Y. 2003. The role of marsh-dominated heterotrophic continental margins in trans-
port of CO2 between the atmosphere, the land-sea interface and the ocean. Geophys. Res. Lett. 30:1849Calbet A, Landry MR. 2004. Phytoplankton growth, microzooplankton grazing, and carbon cycling in marine
systems. Limnol. Oceanogr. 49:51–57Chai F, Liu G, Xue H, Shi L, Chao Y, et al. 2009. Seasonal and interannual variability of carbon cycle in South
China Sea: a three-dimensional physical-biogeochemical modeling study. J. Oceanogr. 65:703–20Chassignet EP, Hurlbert HE, Smedstad OM, Halliwell GR, Hogan PJ, et al. 2007. The HYCOM (HYbrid
Coordinate Ocean Model) data assimilative system. J. Mar. Sys. 65:60–83Chen CTA. 2002. Shelf-vs. dissolution-generated alkalinity above the chemical lysocline. Deep-Sea Res. II.
49:5365–375Conkright ME, Locarnini RA, Garcia HE, O’Brien TD, Boyer TP, et al. 2002. World Ocean Atlas 2001:
objective analyses, data statistics and figures CD-ROM documentation. National Oceanographic DataCenter Internal Report, 17. US Dept. Commer.: Silver Spring, MD. 17 pp.
Cook T, Folli M, Klinck J, Ford S, Miller J. 1998. The relationship between increasing sea-surface temperatureand the northward spread of Perkinsus marinus (Dermo) disease epizootics in oysters. Estuar. Coast. ShelfSci. 46:587–97
Cornell SE, Jickells TD, Cape JN, Rowland AP, Duce RA. 2003. Organic nitrogen deposition on land andcoastal environments: a review of methods and data. Atmos. Environ. 37:2173–91
Dagg M, Benner R, Lohrenz S, Lawrence D. 2004. Transformation of dissolved and particulate materials oncontinental shelves influenced by large rivers: plume processes. Cont. Shelf Res. 24:833–58
Darecki M, Stramski D. 2004. An evaluation of MODIS and SeaWiFS bio-optical algorithms in the BalticSea. Remote Sens. Environ. 89:326–350
D’Asaro E, McNeil C. 2007. Air-sea gas exchange at extreme wind speeds measured by autonomous oceano-graphic floats. J. Mar. Sys. 66:92–109
DeGrandpre MD, Olbu GJ, Beatty CM, et al. 2002. Air-sea CO2 fluxes on the US Middle Atlantic Bight.Deep-Sea Res. II 49:4355–67
Diaz RJ, Rosenberg R. 2008. Spreading dead zones and consequences for marine ecosystems. Science 321:926–29
Dinniman MS, Klinck JM, Smith WO Jr. 2003. Cross-shelf exchange in a model of the Ross Sea circulationand biogeochemisty. Deep-Sea Res. II 50:3103–120
Doney SC, Mahowald N, Lima I, Feely RA, Mackenzie FT, et al. 2007. Impact of anthropogenic atmosphericnitrogen and sulfur deposition on ocean acidification and the inorganic carbon system. Proc. Natl. Acad.Sci. USA 104:14580
www.annualreviews.org • Modeling Continental Shelf Carbon 117
Ann
u. R
ev. M
arin
e. S
ci. 2
011.
3:93
-122
. Dow
nloa
ded
from
ww
w.a
nnua
lrev
iew
s.or
gby
Dr
Cin
dy L
ee o
n 12
/16/
10. F
or p
erso
nal u
se o
nly.

MA03CH04-Hofmann ARI 17 November 2010 6:45
Donner SD, Coe M, Lenters JD, Twine TE, Foley JA. 2002. Modeling the impact of hydrologicalchanges on nitrate transport in the Mississippi River Basin from 1955 to 1994. Glob. Biogeochem. Cycles16:GB001396
Druon J, Mannino A, Signorini S, McClain M, Friedrichs M, Wilkin J, et al. 2010. Modeling the dynamicsand export of dissolved organic matter in the Northeastern U.S. continental shelf. Estuar. Coast. Shelf Sci.88:488–507
Duce RA, LaRoche J, Altieri K, Arrigo KR, Baker AR, et al. 2008. Impacts of atmospheric anthropogenicnitrogen on the open ocean. Science 320:893–97
Ducklow HW, McAllister SL. 2005. The biogeochemistry of carbon dioxide in the coastal oceans. In The Sea,ed. AR Robinson, KH Brink, vol. 13, pp. 269–315. Cambridge, MA: Harvard Univ. Press
Dumont E, Harrison J, Kroeze C, Bakker E, Seitzinger S. 2005. Global distribution and sources of dis-solved inorganic nitrogen export to the coastal zone: results from a spatially explicit, global model. Glob.Biogeochem. Cycles 19:GB4S02.
Egbert GD, Erofeeva SY. 2002. Efficient inverse modeling of barotropic ocean tides. J. Atmos. Ocean. Tech.19:183–204
Fairall CW, Bradley EF, Hare JE, Grachev AA, Edson J. 2003. Bulk parameterization of air-sea fluxes: updatesand verification for the COARE algorithm. J. Clim. 16:571–91
Fennel K, Brady D, DiToro D, Fulweiler R, Gardner WS, et al. 2009. Modelling denitrification in aquaticsediments. Biogeochemistry 93:159–78
Fennel K, Wilkin J. 2009. Quantifying biological carbon export for the northwest North Atlantic continentalshelves. Geophys. Res. Lett. 36:L18605
Fennel K, Wilkin J, Levin J, Moisan J, O’Reilly J, et al. 2006. Nitrogen cycling in the middle atlantic bight:results from a three-dimensional model and implications for the North Atlantic nitrogen budget. Glob.Biogeochem. Cycles 20:GB3007
Fennel K, Wilkin J, Previdi M, Najjar R. 2008. Denitrification effects on air-sea CO2 flux in the coastal ocean:Simulations for the northwest North Atlantic. Geophys. Res. Lett. 35:L24608
Flather RA. 1976. A tidal model of the northwest European continental shelf. Memoirs Societe Royale SciencesLiege Series 6:141–64
Frankignoulle M, Borges AV. 2001. European continental shelf as a significant sink for atmospheric carbondioxide. Glob. Biogeochem. Cycles 15:569–76
Frew NM, Nelson RK, Mcgillis WR, Edson JB, Bock EJ, Hara T. 2002. Spatial variations in surface microlayersurfactants and their role in modulating air-sea exchange, pp. 153–159. In Gas Transfer at Water Surfaces,Geophys. Monogr. Ser. 127, ed. MA Donelan, WM Drennan, ES Saltzman, R Wanninkhof. Washington,DC: Am. Geophys. Union
Friedrichs MAM, Dusenberry J, Anderson L, Armstrong R, Chai F, Christian J, et al. 2007. Assessment ofskill and portability in regional marine biogeochemical models: role of multiple phytoplankton groups.J. Geophys. Res. 112:CO8001
Friedrichs MAM, Hood RR, Wiggert JD. 2006. Ecosystem model complexity versus physical forcing: quan-tification of their relative impact with assimilated Arabian Sea data. Deep-Sea Res. II 53:576–600
Gattuso J-P, Frankignoulle M, Wollast R. 1998. Carbon and carbonate metabolism in coastal aquatic ecosys-tems. Annu. Rev. Ecol. Syst. 29:405–34
Gregg WG, Casey NW. 2004. Global and regional evaluation of the SeaWiFS chlorphyll data set. RemoteSens. Environ. 93:463–79
Gruber N, Frenzel H, Doney SC, Marchesiello P, McWilliams JC, et al. 2006. Eddy-resolving simulation ofplankton ecosystem dynamics in the California Current system. Deep-Sea Res. II 53:1483–516
Guerzoni S, Chester R, Dulac F, Herut B, Loye-Pilot MD, et al. 1999. The role of atmospheric depositionin the biogeochemistry of the Mediterranean Sea. Prog. Oceanogr. 44:147–90
Hagy JD, Boynton WR, Keefe CW, Wood KV. 2004. Hypoxia in Chesapeake Bay, 1950–2001: long-termchange in relation to nutrient loading and river flow. Estuar. Coasts 27: doi:10.1007/BF02907650
Hansell DA, Carlson CA. 1998. Net community production of dissolved organic carbon. Glob. Biogeochem.Cycles 12:443–53
Hartnett HE, Keil RG, Hedges JI, Devol AH. 1998. Influence of oxygen exposure time on organic carbonpreservation in continental margin sediments. Nature 391:572–74
118 Hofmann et al.
Ann
u. R
ev. M
arin
e. S
ci. 2
011.
3:93
-122
. Dow
nloa
ded
from
ww
w.a
nnua
lrev
iew
s.or
gby
Dr
Cin
dy L
ee o
n 12
/16/
10. F
or p
erso
nal u
se o
nly.

MA03CH04-Hofmann ARI 17 November 2010 6:45
Henrichs S, Reeburgh W. 1987. Anaerobic mineralization of marine sediment organic matter: rates and therole of anaerobic processes in the oceanic carbon economy. Geomicrobiol. J. 5:l–237
Hernandez-Ayon JM, Zirino A, Dickson AG, Camiro-Vargas T, Valenzuela E. 2007. Estimating the contri-bution of organic bases from microalgae to the titration alkalinity in coastal seawaters. Limnol. Oceanogr.Methods 5:225–32
Hofmann E, Druon J-N, Fennel K, Friedrichs M, Haidvoge D, et al. 2008. Eastern US continental shelfcarbon budget: integrating models, data assimilation and analysis. Oceanography 21:32–40
Honjo S, Manganini SJ, Krishfield RA, Francois R. 2008. Particulate organic carbon fluxes to the oceaninterior and factors controlling the biological pump: a synthesis of global sediment trap programs since1983. Prog. Oceanogr. 76:217–85
Hood RR, Laws EA, Armstrong RA, Bates RR, Brown CW, Carlson CC, et al. 2006. Pelagic functional groupmodeling: progress, challenges and prospects. Deep-Sea Res. II 53:459–512
Hopkinson CS Jr, Vallino JJ, Nolin A. 2002. Decomposition of dissolved organic matter from the continentalmargin. Deep-Sea Res. II 49:4461–78
Howarth RW, Billen G, Swaney D, Townsend A, Jaworski N, et al. 1996. Regional nitrogen budgets andriverine N and P fluxes for the drainages to the North Atlantic Ocean: natural and human influences.Biogeochemistry 35:75–139
Huettel M, Ziebis W, Forster S. 1996. Flow-induced uptake of particulate matter in permeable sediments.Limnol. Oceanogr. 41:309–22
Huettel M, Ziebis W, Forster S, Luther GW. 1998. Advective transport affecting metal and nutrient distri-butions and interfacial fluxes in permeable sediments. Geochim. Cosmochim. Acta 62:613–31
Ianson D, Allen SE. 2002. A two-dimensional nitrogen and carbon flux model in a coastal upwelling region.Glob. Biogeochem. Cycles 16: doi:10.1029/2001GB001451
Jahnke RA. 2010. Global synthesis. See Liu K-K, Atkinson L, Quinones R, Talaue-NcManus L, 2010, pp. 597–615
Jiang L-Q, Cai W-J, Wanninkhof R, Wang Y, Luger H. 2008. Air-sea CO2 fluxes on the U.S. South AtlanticBight: spatial and seasonal variability. J. Geophys. Res. 113:C07019
Jickells T. 2006. The role of air-sea exchange in the marine nitrogen cycle. Biogeosci. Disc. 3:183–210Joliff J, Kindle JC, Shulman I, Penta B, Friedrichs MAM, Helber R, et al. 2009. Summary diagrams for coupled
hydrodynamic-ecosystem model skill assessment. J. Mar. Syst. 76:64–82Kahru M, Mitchell BG. 2001. Seasonal and nonseasonal variaiblity of satellite-derived chlorophyll and colored
dissolved organic matter concentration in the Califronia Current. J. Geophys. Res. 106:2517–529Keene WC, Montag JA, Maben JR, Southwell M, Leonard J, Church TM, et al. 2000. Organic nitrogen in
precipitation over Eastern North America. Atmos. Environ. 36:4529–540Keil RG, Mayer LM, Quay PD, Richey JE, Hedges JI. 1997. Loss of organic matter from riverine particles in
deltas. Geochim. Cosmochim. Acta 61:1507–11Kim HC, Lee K, Choi W. 2006. Contribution of phytoplankton and bacterial cells to the measured alkalinity
of seawater. Limnol. Oceanogr. 51:331–38Koeve W. 2001. Wintertime nutrients in the North Atlantic—new approaches and implications for new
production estimates. Mar. Chem. 74:245–60Komada T, Reimers CE. 2001. Resuspension-induced partitioning of organic carbon between solid and solu-
tion phases from a river–ocean transition. Mar. Chem. 176:155–74Komada T, Schofield OME, Reimers CE. 2002. Fluorescence characteristics of organic matter released from
coastal sediments during resuspension. Mar. Chem. 79:81–97Krishnamurthy A, Moore JK, Zender CS, Chao L. 2007. Effects of atmospheric inorganic nitrogen deposition
on ocean biogeochemistry. J. Geophys. Res. 112:G02019Kristensen E. 2000. Organic matter diagenesis at the oxic/anoxic interface in coastal marine sediments, with
emphasis on the role of burrowing animals. Hydrobiologia 426:1–24Kuypers MMM, Lavik G, Woebken D, Schmid M, Fuchs BM, et al. 2005. Massive nitrogen loss from the
Benguela upwelling system through anaerobic ammonium oxidation. Proc. Natl. Acad. Sci. USA 102:6478–83
Laursen AE, Seitzinger SP. 2002. The role of denitrification in nitrogen removal and carbon mineralizationin the Mid-Atlantic Bight sediments. Cont. Shelf Res. 22:1397–1416
www.annualreviews.org • Modeling Continental Shelf Carbon 119
Ann
u. R
ev. M
arin
e. S
ci. 2
011.
3:93
-122
. Dow
nloa
ded
from
ww
w.a
nnua
lrev
iew
s.or
gby
Dr
Cin
dy L
ee o
n 12
/16/
10. F
or p
erso
nal u
se o
nly.

MA03CH04-Hofmann ARI 17 November 2010 6:45
Lee K, Wanninkhof R, Feely RA, Millero FJ, Peng TH. 2000. Global relationships of total inorganic carbonwith temperature and nitrate in surface seawater. Glob. Biogeochem. Cycles 14:979–94
Lehmann MK, Fennel K, He R. 2009. Statistical validation of a 3-D bio-physical model of the western NorthAtlantic. Biogeosciences 6:1–14
Le Quere C, Harrison SP, Prentice IC, Buitenhuis ET, Aumont O, Bopp L, et al. 2005. Ecosystem dynamicsbased on plankton functional types for global ocean biogeochemistry models. Glob. Change Biol. 11:2016–40
Liss PS, Duce RA. 1997. The Sea Surface and Global Change. Cambridge, UK: Cambridge Univ. Press. 535 pp.Liu G, Chai F. 2009. Seasonal and interannual variability of primary and export production in the South China
Sea: a three-dimensional physical-biogeochemical model study. ICES J. Mar. Sci. 66:420–31Liu K-K, Atkinson L, Quinones R, Talaue-NcManus L. 2010. Carbon and Nutrient Fluxes in Continental
Margins: A Global Synthesis. Berlin: Springer. 741 pp.Liu M, Tian H, Chen G, Ren W, Zhang C, et al. 2008. Effects of land use and land cover change on
evapotranspiration and water yield in China during the twentieth century. J. Am. Water Res. Assoc.44:1193–207
Longhurst A. 1995. Seasonal cycles of pelagic production and consumption. Prog. Oceanogr. 36:77–167Loye-Pilot MD, Martin JM, Morelli J. 1990. Atmospheric input of inorganic nitrogen to the western Mediter-
ranean. Biogeochemistry 9:117–34Lutjeharms JRE, Penven P, Roy C. 2003. Modelling the shear edge eddies of the southern Agulhas Current.
Cont. Shelf Res. 23:1099–115Mackenzie FT, Lerman A, Andersson AJ. 2004. Past and present of sediment and carbon biogeochemical
cycling models. Biogeosciences 1:11–32Marchesiello P, McWilliams JC, Shchepetkin AF. 2003. Equilibrium structure and dynamics of the California
Current system. J. Phys. Oceanogr. 33:753–83Marra J, Trees CC, O’Reilly JE. 2007. Phytoplankton pigment absorption: a strong predictor of primary
productivity in the surface ocean. Deep-Sea Res. I 54:155–63Mellor GL, Yamada T. 1982. Development of a turbulence closure model for geophysical fluid problems.
Rev. Geophys. Space Phys. 20:851–75Mesinger F, DiMego G, Kalnay E, Mitchell K, Shafran W, et al. 2006. North American regional reanalysis.
Bull. Am. Meteorol. Soc. 87:343–60Middelburg JJ, Soetaert K, Herman PMJ, Heip C. 1996. Denitrification in marine sediments: a model study.
Glob. Biogeochem. Cycles 10:661–73Millero FJ, Lee K, Roche M. 1998. Distribution of alkalinity in the surface waters of the major oceans. Mar.
Chem. 60:111–30Milliman J. 1993. Production and accumulation of calcium carbonate in the ocean: Budget of a nonsteady
state. Glob. Biogeochem. Cycles 7:927–57Moisan JR. 2010. Coupled circulation/biogeochemical models to estimate carbon flux. See K-K Liu,
L Atkinson, R Quinones, L Talaue-McManus, 2010, pp. 539–58Moll A. 1998. Regional distribution of primary production in the North Sea simulated by a three-dimensional
model. J. Mar. Sys. 16:151–70Moore WS. 2010. The effect of submarine groundwater discharge on the ocean. Annu. Rev. Mar. Sci. 2:59–88Moore WS, Sarmiento JS, Key RM. 2008. Submarine groundwater discharge revealed by 228Ra distribution
in the upper Atlantic Ocean. Nat. Geosci. 1:309–11Mopper K, Kieber DJ. 2000. Marine photochemistry and its impact on carbon cycling. In The Effects of UV
Radiation in the Marine Environment, ed. S De Mora, S Demer, M Vernet, pp. 101–129. Cambridge, UK:Cambridge Univ. Press
Muller-Karger FE, Varela R, Thunell R, Luerssen R. 2005. The importance of continental margins in theglobal carbon cycle. Geophys. Res. Lett. 32:L01602
Najjar RG, Pyke CR, Adams MB, Breitburg D, Hershner C, Kemp M, et al. 2010. Potential climate-changeimpacts on the Chesapeake Bay. Estuar. Coast. Shelf Sci. 86:1–20
Nightingale PD, Malin G, Law CS, Watson AJ, Liss PS, et al. 2000. In situ evaluation of air-sea gas exchangeparameterizations using novel conservative and volatile tracers. Glob. Biogeochem. Cycles 14:373–87
120 Hofmann et al.
Ann
u. R
ev. M
arin
e. S
ci. 2
011.
3:93
-122
. Dow
nloa
ded
from
ww
w.a
nnua
lrev
iew
s.or
gby
Dr
Cin
dy L
ee o
n 12
/16/
10. F
or p
erso
nal u
se o
nly.

MA03CH04-Hofmann ARI 17 November 2010 6:45
Nixon SW, Oviatt CA, Hale SS. 1976. Nitrogen regeneration and the metabolism of coastal marinebottom communities. In The Role of Terrestrial and Aquatic Organism Decomposition Processes, ed.JM Anderson, A Macfadyen, pp. 269–83. Malden, MA: Blackwell
Onitsuka G, Uno I, Yanagi T, Yoon JH. 2009. Modeling the effects of atmospheric nitrogen input on biologicalproduction in the Japan Sea. J. Oceanogr. 65:433–38
O’Reilly JE, Maritorena S, Mitchell BG, Siegel DA, Carder KL, Garver SA, et al. 1998. Ocean color chloro-phyll algorithms for SeaWiFS. J. Geophys. Res. 103:24937–53
Pace ML, Glasser JE, Pomeroy LR. 1984. A simulation analysis of continental shelf food webs. Mar. Biol.82:47–63
Paerl HW, Dennis RL, Whitall DR. 2002. Atmospheric deposition of nitrogen: implications for nutrientoverenrichment of coastal waters. Estuar. Coasts 25:677–93
Pan X, Mannino A, Russ ME, Hooker SB, Harding LW Jr. 2010. Remote sensing of phytoplankton pigmentdistribution in the United States Northeast coast. Remote Sens. Environ. 114:2403–16
Peliz A, Dubert J, Haidvogel DB. 2003. Subinertial response of a density-driven eastern boundary currentpoleward current to wind forcing. J. Phys. Oceanogr. 33:1633–1650
Pomeroy LR, D’Elia CF, Schaffner LC. 2006. Limits to top-down control of phytoplankton by oysters inChesapeake Bay. Mar. Ecol. Prog. Ser. 325:301–9
Previdi M, Fennel K, Wilkin J, Haidvogel DB. 2009. Interannual variability in atmospheric CO2 uptake onthe northeast U.S. continental shelf. J. Geophy. Res. 114:G04003
Radach G, Moll A. 1993. Estimation of the variability of production by simulating annual cycles of phyto-plankton in the central North Sea. Prog. Oceanogr. 31:339–419
Reimers CE, Stecher HA, Taghon GL, Fuller CM, Huettel M, et al. 2004. In situ measurements of advectivesolute transport in permeable shelf sands. Cont. Shelf Res. 24:183–201
Rhoads DC. 1974. Organism-sediment relations on the muddy sea floor. Oceanogr. Mar. Biol. Ann. Rev.12:263–300
Sarmiento JL, Gruber N. 2006. Ocean Biogeochemical Dynamics. Princeton, NJ: Princeton Univ. Press. 503 pp.Seitzinger SP, Giblin AE. 1996. Estimating denitrification in North Atlantic continental shelf sediments.
Biogeochemistry 35:235–60Seitzinger SP, Harrison JA, Bohlke JK, Bouwman AF, Lowrance R, et al. 2006. Denitrification across land-
scapes and waterscapes: a synthesis. Ecol. Appl. 16:2064–90Shchepetkin AF, McWilliams JC. 1998. Quasi-monotone advection schemes based on explicit locally adaptive
dissipation. Mon. Weather Rev. 126:1541–80Shchepetkin AF, McWilliams JC. 2003. A method for computing horizontal pressure-gradient force in an
oceanic model with a non-aligned vertical coordinate. J. Geophys. Res. 108:C33090Shchepetkin AF, McWilliams JC. 2005. The regional ocean modeling system (ROMS): a split-explicit, free-
surface, topography-following-coordinate ocean model. Ocean Model. 9:347–404Shuert PG, Walsh JJ. 1993. A coupled physical-biological model of the Bering-Chukchi seas. Cont. Shelf Res.
13:543–73Slomp CP, Van Cappellen P. 2004. Nutrient inputs to the coastal ocean through submarine groundwater
discharge: controls and potential impact. J. Hydro. 295:64–86Smith SV, Hollibaugh JT. 1993. Coastal metabolism and the oceanic organic carbon balance. Rev. Geophys.
31:75–89Soetaert K, Middelburg JJ, Herman PMJ, Buis K. 2000. On the coupling of benthic and pelagic biogeochemical
models. Earth-Sci. Rev. 51:173–201Spokes LJ, Yeatman SG, Cornell SE, Jickells TD. 2000. Nitrogen deposition to the eastern Atlantic Ocean.
The importance of southeasterly flow. Tellus B 52:37–49Stramska M, Stramski D, Hapter R, Kaczmarck S, Ston J. 2003. Bio-optical relationships and ocean color
algorithms for the north polar region of the Atlantic. J. Geophys. Res. 108:C53143Stramska M, Stramski D. 2005. Variability of particulate organic carbon concentration in the north polar
Atlantic based on ocean color observations with Sea-viewing Wide Field-of-view Sensor (SeaWiFS).J. Geophys. Res. 110:C10018
Thomas H, Bozec Y, Elkalay K, de Barr HJW 2004. Enhanced open ocean storage of CO2 from shelf seapumping. Science 304:1005–8
www.annualreviews.org • Modeling Continental Shelf Carbon 121
Ann
u. R
ev. M
arin
e. S
ci. 2
011.
3:93
-122
. Dow
nloa
ded
from
ww
w.a
nnua
lrev
iew
s.or
gby
Dr
Cin
dy L
ee o
n 12
/16/
10. F
or p
erso
nal u
se o
nly.

MA03CH04-Hofmann ARI 17 November 2010 6:45
Tian HQ, Xu X, Zhang C, Ren W, Chen G, et al. 2009. Forecasting and assessing the large-scale andlong-term impacts of global environmental change on terrestrial ecosystems in the United States andChina. In Real World Ecology: Large-scale and Long-term Case Studies and Methods, ed. S Miao, S Carstenn,M Nungesser, pp. 235–66. New York: Springer
Tsunogai S, Watanabe S, Sato T. 1999. Is there a “continental shelf pump” for the absorption of atmosphericCO2? Tellus B 51:701–12
Walsh JJ. 1988. On the Nature of Continental Shelves. New York: Academic. 520 pp.Walsh JJ, Dieterle DA. 1994. CO2 cycling in the coastal ocean. I. A numerical analysis of the southeastern
Bering Sea with applications to the Chukchi Sea and the northern Gulf of Mexico. Prog. Oceanogr. 34:335–92
Walsh JJ, McRoy CP. 1986. Ecosystem analysis in the southeastern Bering Sea. Cont. Shelf Res. 5:259–88Walsh JJ, Rowe GT, Iverson RL, McRoy CP. 1981. Biological export of shelf carbon is a neglected sink of
the global CO2 cycle. Nature 291:196–201Wang ZA, Cai W-J, Wang Y, Ji H. 2005. The southeastern continental shelf of the United States as an
atmospheric CO2 source and an exporter of inorganic carbon to the ocean. Cont. Shelf Res. 25:1917–41Wanninkhof R. 1992. Relationship between gas exchange and wind speed over the ocean. J. Geophys. Res.
97:7373–81Ward BB, Devol AH, Rich JJ, Chang BX, Bulow SE, et al. 2009. Denitrification as the dominant nitrogen
loss process in the Arabian Sea. Nature 461:78–81Warner JC, Sherwood CR, Arango HG, Signell RC. 2005. Performance of four turbulence closure models
implemented using a generic length scale method. Ocean Model. 8:81–113Wilkin J. 2006. The summertime heat budget and circulation of southeast New England shelf waters. J. Phys.
Oceanogr. 36:1997–2011Wollast R, Mackenzie FT. 1989. Global biogeochemical cycles and climate. In Climate and Geo-Sciences, ed.
A Berger, S Schneider, JC Duplessy, pp. 453–73. Dordrecht, Neth.: Kluwer
122 Hofmann et al.
Ann
u. R
ev. M
arin
e. S
ci. 2
011.
3:93
-122
. Dow
nloa
ded
from
ww
w.a
nnua
lrev
iew
s.or
gby
Dr
Cin
dy L
ee o
n 12
/16/
10. F
or p
erso
nal u
se o
nly.

MA03-FrontMatter ARI 17 November 2010 7:6
Annual Review ofMarine Science
Volume 3, 2011
Contents
Geologist at Sea: Aspects of Ocean HistoryWolfgang H. Berger � � � � � � � � � � � � � � � � � � � � � � � � � � � � � � � � � � � � � � � � � � � � � � � � � � � � � � � � � � � � � � � � � � � � � � � � � � � 1
Submarine Paleoseismology Based on Turbidite RecordsChris Goldfinger � � � � � � � � � � � � � � � � � � � � � � � � � � � � � � � � � � � � � � � � � � � � � � � � � � � � � � � � � � � � � � � � � � � � � � � � � � � � � �35
Natural Processes in Delta Restoration: Application to theMississippi DeltaChris Paola, Robert R. Twilley, Douglas A. Edmonds, Wonsuck Kim,
David Mohrig, Gary Parker, Enrica Viparelli, and Vaughan R. Voller � � � � � � � � � � � � � � � �67
Modeling the Dynamics of Continental Shelf CarbonEileen E. Hofmann, Bronwyn Cahill, Katja Fennel, Marjorie A.M. Friedrichs,
Kimberly Hyde, Cindy Lee, Antonio Mannino, Raymond G. Najjar,John E. O’Reilly, John Wilkin, and Jianhong Xue � � � � � � � � � � � � � � � � � � � � � � � � � � � � � � � � � � � � � �93
Estuarine and Coastal Ocean Carbon Paradox: CO2 Sinks or Sitesof Terrestrial Carbon Incineration?Wei-Jun Cai � � � � � � � � � � � � � � � � � � � � � � � � � � � � � � � � � � � � � � � � � � � � � � � � � � � � � � � � � � � � � � � � � � � � � � � � � � � � � � � � 123
Emerging Topics in Marine Methane BiogeochemistryDavid L. Valentine � � � � � � � � � � � � � � � � � � � � � � � � � � � � � � � � � � � � � � � � � � � � � � � � � � � � � � � � � � � � � � � � � � � � � � � � � 147
Observations of CFCs and SF6 as Ocean TracersRana A. Fine � � � � � � � � � � � � � � � � � � � � � � � � � � � � � � � � � � � � � � � � � � � � � � � � � � � � � � � � � � � � � � � � � � � � � � � � � � � � � � � � 173
Nitrogen Cycle of the Open Ocean: From Genes to EcosystemsJonathan P. Zehr and Raphael M. Kudela � � � � � � � � � � � � � � � � � � � � � � � � � � � � � � � � � � � � � � � � � � � � � � � � 197
Marine Primary Production in Relation to Climate Variabilityand ChangeFrancisco P. Chavez, Monique Messie, and J. Timothy Pennington � � � � � � � � � � � � � � � � � � � � � 227
Beyond the Calvin Cycle: Autotrophic Carbon Fixation in the OceanMichael Hugler and Stefan M. Sievert � � � � � � � � � � � � � � � � � � � � � � � � � � � � � � � � � � � � � � � � � � � � � � � � � � � � 261
Carbon Concentrating Mechanisms in EukaryoticMarine PhytoplanktonJohn R. Reinfelder � � � � � � � � � � � � � � � � � � � � � � � � � � � � � � � � � � � � � � � � � � � � � � � � � � � � � � � � � � � � � � � � � � � � � � � � � � 291
vi
Ann
u. R
ev. M
arin
e. S
ci. 2
011.
3:93
-122
. Dow
nloa
ded
from
ww
w.a
nnua
lrev
iew
s.or
gby
Dr
Cin
dy L
ee o
n 12
/16/
10. F
or p
erso
nal u
se o
nly.

MA03-FrontMatter ARI 17 November 2010 7:6
Microbial Nitrogen Cycling Processes in Oxygen Minimum ZonesPhyllis Lam and Marcel M.M. Kuypers � � � � � � � � � � � � � � � � � � � � � � � � � � � � � � � � � � � � � � � � � � � � � � � � � � � 317
Microbial Metagenomics: Beyond the GenomeJack A. Gilbert and Christopher L. Dupont � � � � � � � � � � � � � � � � � � � � � � � � � � � � � � � � � � � � � � � � � � � � � � � 347
Environmental Proteomics: Changes in the Proteome of MarineOrganisms in Response to Environmental Stress, Pollutants,Infection, Symbiosis, and DevelopmentLars Tomanek � � � � � � � � � � � � � � � � � � � � � � � � � � � � � � � � � � � � � � � � � � � � � � � � � � � � � � � � � � � � � � � � � � � � � � � � � � � � � � � 373
Microbial Extracellular Enzymes and the Marine Carbon CycleCarol Arnosti � � � � � � � � � � � � � � � � � � � � � � � � � � � � � � � � � � � � � � � � � � � � � � � � � � � � � � � � � � � � � � � � � � � � � � � � � � � � � � � � 401
Modeling Diverse Communities of Marine MicrobesMichael J. Follows and Stephanie Dutkiewicz � � � � � � � � � � � � � � � � � � � � � � � � � � � � � � � � � � � � � � � � � � � � 427
Biofilms and Marine Invertebrate Larvae: What Bacteria Produce ThatLarvae Use to Choose Settlement SitesMichael G. Hadfield � � � � � � � � � � � � � � � � � � � � � � � � � � � � � � � � � � � � � � � � � � � � � � � � � � � � � � � � � � � � � � � � � � � � � � � � 453
DNA Barcoding of Marine MetazoaAnn Bucklin, Dirk Steinke, and Leocadio Blanco-Bercial � � � � � � � � � � � � � � � � � � � � � � � � � � � � � � � � 471
Local Adaptation in Marine InvertebratesEric Sanford and Morgan W. Kelly � � � � � � � � � � � � � � � � � � � � � � � � � � � � � � � � � � � � � � � � � � � � � � � � � � � � � � � 509
Use of Flow Cytometry to Measure Biogeochemical Rates andProcesses in the OceanMichael W. Lomas, Deborah A. Bronk, and Ger van den Engh � � � � � � � � � � � � � � � � � � � � � � � � � 537
The Impact of Microbial Metabolism on Marine DissolvedOrganic MatterElizabeth B. Kujawinski � � � � � � � � � � � � � � � � � � � � � � � � � � � � � � � � � � � � � � � � � � � � � � � � � � � � � � � � � � � � � � � � � � � � 567
Errata
An online log of corrections to Annual Review of Marine Science articles may be found athttp://marine.annualreviews.org/errata.shtml
Contents vii
Ann
u. R
ev. M
arin
e. S
ci. 2
011.
3:93
-122
. Dow
nloa
ded
from
ww
w.a
nnua
lrev
iew
s.or
gby
Dr
Cin
dy L
ee o
n 12
/16/
10. F
or p
erso
nal u
se o
nly.