Embed Size (px)
Citation preview

HAL Id: insu-01415340https://hal-insu.archives-ouvertes.fr/insu-01415340
Submitted on 13 Dec 2016
HAL is a multi-disciplinary open accessarchive for the deposit and dissemination of sci-entific research documents, whether they are pub-lished or not. The documents may come fromteaching and research institutions in France orabroad, or from public or private research centers.
L’archive ouverte pluridisciplinaire HAL, estdestinée au dépôt et à la diffusion de documentsscientifiques de niveau recherche, publiés ou non,émanant des établissements d’enseignement et derecherche français ou étrangers, des laboratoirespublics ou privés.
Distributed under a Creative Commons Attribution - NonCommercial - NoDerivatives| 4.0International License
Modeling the Acid-Base Properties of MontmorilloniteEdge Surfaces
Christophe Tournassat, James Davis, Christophe Chiaberge, SylvainGrangeon, Ian C. Bourg
To cite this version:Christophe Tournassat, James Davis, Christophe Chiaberge, Sylvain Grangeon, Ian C. Bourg. Mod-eling the Acid-Base Properties of Montmorillonite Edge Surfaces. Environmental Science and Tech-nology, American Chemical Society, 2016, 50 (24), pp.13436-13445. �10.1021/acs.est.6b04677�. �insu-01415340�

1
Modeling the acid-base properties of montmorillonite edge surfaces 1
Christophe Tournassata,b,c*, James A. Davisb, Christophe Chiabergec, Sylvain Grangeonc, Ian C. 2
Bourgd 3
4
a Université d'Orléans - CNRS/INSU - BRGM, UMR 7327 Institut des Sciences de la Terre 5
d'Orléans, 45071 Orléans, France 6
b Earth and Environmental Sciences Division, Lawrence Berkeley National Laboratory, Berkeley, 7
USA 8
c BRGM, French geological Survey, Orléans, France 9
d Department of Civil and Environmental Engineering and Princeton Environmental Institute, 10
Princeton, USA 11
* corresponding author: [email protected] 12
13
Page 1 of 37
ACS Paragon Plus Environment
Environmental Science & Technology

2
Abstract 14
The surface reactivity of clay minerals remains challenging to characterize because of a duality of 15
adsorption surfaces and mechanisms that does not exist in the case of simple oxide surfaces: clay 16
minerals edge surfaces have a variable proton surface charge arising from hydroxyl functional 17
groups, whereas basal surfaces have a permanent negative charge arising from isomorphic 18
substitutions. Hence, the relationship between surface charge and surface potential on edge 19
surfaces cannot be described using the Gouy-Chapman relation, because of a spillover of 20
negative electrostatic potential from the basal surface onto the edge surface. While surface 21
complexation models can be modified to account for these features, a predictive fit of 22
experimental data was not possible until recently, because of uncertainty regarding the densities 23
and intrinsic pKa values of edge functional groups. Here, we reexamine this problem in light of 24
new knowledge on intrinsic pKa values obtained over the last decade using ab initio molecular 25
dynamics simulations, and we propose a new formalism to describe edge functional groups. Our 26
simulation results yield good predictions of the best available experimental acid-base titration 27
data. 28
1. Introduction 29
Clay minerals are natural fine-grained particles, ubiquitous in terrestrial weathering 30
environments, that strongly influence the permeability, mechanics, and pore water chemistry of 31
soils, sediments, and rocks in which they are found 1,2. In particular, these minerals control the 32
performance of natural and engineered clay barriers used in the isolation of landfills and 33
contaminated sites and proposed for use in the geological storage of high-level radioactive waste 34
3,4. A widely examined feature of clay minerals that influences the performance of these barriers 35
Page 2 of 37
ACS Paragon Plus Environment
Environmental Science & Technology

3
is their cation-exchange capacity, the result of isomorphic substitutions in the structure 5. In 36
addition to this cation-exchange capacity, clay minerals, including montmorillonite (the most 37
studied swelling clay mineral) carry oxide-type functional groups on their edge surfaces. These 38
oxide-type functional groups, though present in much smaller quantity than the cation exchange 39
sites, dominate the adsorption of trace metals, oxyanions, and organic molecules 6–9, the 40
dissolution and growth kinetics of clay minerals 10,11, and the colloidal mechanics of clay 41
particles 12, at least in some conditions. 42
In the case of simple oxide minerals, surface reactivity is strongly influenced by their net proton 43
surface charge, which varies with pH through reactions of the following type, where >SOHn is a 44
generic surface site 13: 45
> SOH� ⇄> SOH�� +H� (1)
The reaction described by Eq. (1) gives rise to a variable net proton surface charge density (σH) 46
that depends on pH and ionic strength (I, dimensionless14). In the case of simple oxide minerals, 47
the last few decades have seen steady advances in the characterization of their proton surface 48
chemistry through a combination of experiments (in particular, acid-base titration and 49
electrophoretic mobility measurements), surface complexation model (SCM) calculations, and 50
bond-valence theory predictions of the intrinsic acidity constants of surface functional groups 15–51
19. In the case of the oxide-type functional groups on the montmorillonite edge surfaces, however, 52
σH remains poorly understood, as shown by the wide range of reported values of the point of zero 53
net proton charge (p.z.n.p.c., the pH value where σH = 0) and by the variety of models that have 54
been used to describe σH 9,20. As described below, the difficulty in characterizing σH on 55
montmorillonite relates to the high permanent structural charge of the solid (σ0 ≈ -1 mmolc⋅g-1) 56
Page 3 of 37
ACS Paragon Plus Environment
Environmental Science & Technology

4
and to the presence of two different surfaces (edge and basal surfaces) with very different 57
properties. These properties have no equivalent in simple oxide minerals, but are widespread 58
features of lamellar structures including vernadite, a phyllomanganate that controls the fate of 59
trace metals in certain oxidized soils and sediments 21,22, green rust, a layered double hydroxide 60
that influences the mobility of iron and anions in reduced soils 23, and synthetic phases widely 61
used in materials chemistry, such as synthetic layered double hydroxides 24. 62
The challenges associated with characterizing the proton surface reactivity of montmorillonite 63
were summarized a decade ago by Bourg et al. 20. A first challenge is that montmorillonite 64
particles undergo significant dissolution during acid-base titration measurements. This can be 65
rendered near-negligible in the pH range from about 4.5 to 9.5 through a careful choice of clay 66
pretreatment, storage, and titration procedures25–29 (see below). Unfortunately, most 67
montmorillonite acid-base titration datasets do not fit the best practices established by Duc et al. 68
25–28. A second challenge is that acid-base titration measurements do not directly measure the net 69
proton surface charge density σH but rather δσH, the change in net proton surface charge density 70
relative to its initial value σH,init ( �H = �H − �H,init). Conversion of �H to σH values requires 71
knowledge of σH,init or of the p.z.n.p.c. at the conditions of interest 30. For simple oxide surfaces, 72
this is achieved by measuring the sum of the adsorbed ion charge densities qi of all species except 73
H+ and OH- (∆q) and applying the charge balance relation 30: 74
�0 + �H + Δ� = 0
(2)
For montmorillonite, experimental uncertainties make it impossible to accurately determine �H 75
using Eq. (2), because �H is small compared to �0 and Δ� 20,29. Alternatively, the p.z.n.p.c. of 76
oxide surfaces is sometimes determined by assuming that it coincides with the point of zero salt 77
Page 4 of 37
ACS Paragon Plus Environment
Environmental Science & Technology

5
effect (p.z.s.e., the pH value at which acid-base titration curves carried out at different ionic 78
strengths intersect) or with the isoelectric point (i.e.p., the pH value where the electrophoretic 79
mobility equals zero) 31. These alternative methods, however, are neither strictly rigorous 20,30 nor 80
applicable to montmorillonite, for which a p.z.s.e. or i.e.p. are not observed 26,32–34. Finally, the 81
p.z.n.p.c. of montmorillonite is sometimes assumed to correspond to the pH value obtained by 82
adding incremental amounts of dry solid to a solution 35, but this so-called “mass titration” 83
technique, just like a standard acid-base titration, is sensitive to the initial protonation state of the 84
solid 36. 85
A third challenge arises when attempting to develop a SCM for montmorillonite. An important 86
assumption of SCMs is that the ratio of activity coefficients of different surface species is a 87
function of the surface electrostatic potential �. For the reaction described by Eq. (1), the 88
relationship is almost always expressed with a quasi-thermodynamic equilibrium equation of the 89
form: 90
�� = �> SOH����H���> SOH�� exp "−#�
$% & (3)
where Ka is an intrinsic equilibrium constant, (H+) is the thermodynamic activity of H+, square 91
brackets denote mole fractions, � is the surface electrostatic potential, F is the Faraday constant 92
(96 485 Cmol-1�, R is the ideal gas constant (8.314 Jmol-1K-1), and T is temperature (in K). 93
Closure of any SCM requires a model of � as a function of surface charge, ionic strength, and 94
other conditions. For this, most studies rely on the Gouy-Chapman relation, a mean-field theory 95
prediction based on the Poisson-Boltzmann equation (PBE) of the relationship between surface 96
charge density and surface potential on an infinite planar surface in contact with an ideal 97
electrolyte solution 31,37. Montmorillonite consists of flake-shaped, 1-nm-thick layers such that 98
Page 5 of 37
ACS Paragon Plus Environment
Environmental Science & Technology

6
the narrow edge surface cannot be a priori treated as an infinite planar surface 9,20. Solutions to 99
the Poisson-Boltzmann equation for various possible arrangements of the montmorillonite layers 100
indicate that the value of � at montmorillonite edges (ψedge) is influenced by the charge density 101
of both edge and basal surfaces in a manner that depends on ionic strength and on the stacking 102
arrangement of montmorillonite layers 9,20,38. Finally, a fourth challenge is that montmorillonite 103
edge surfaces carry a variety of functional groups associated with tetrahedral Si and octahedral Al 104
atoms (>SiOH, >AlOH, >Al2OH, >AlSiOH) as well as additional groups that arise from 105
isomorphic substitutions of Si by Al and of Al by Mg, FeII, or FeIII. In the absence of independent 106
predictions of the densities and intrinsic acidity constants of each surface functional group, model 107
fits to experimental acid-base titration data are necessarily non-unique 20. 108
Bourg et al. 20 showed that the first three challenges outlined above could be resolved using 109
information available a decade ago. The second challenge was resolved by using an SCM to 110
predict both σH,init (from reported conditions of clay pre-treatment) and σH. The first challenge 111
required identifying experimental datasets that followed that best practices established by Duc et 112
al. 26–28 and that used montmorillonite samples pre-treated by repeated washing in a solution of 113
well-known pH and ionic strength (as required to predict σH,init); the available database included 114
only two datasets, those of Baeyens and Bradbury 39 and Duc et al. 27. The third challenge was 115
resolved by solving a two-dimensional version of the PBE near the edge surface of an isolated 116
montmorillonite particle. The fourth challenge, however, could not be satisfactorily resolved, 117
because of large disagreements between different bond-valence model predictions of the intrinsic 118
pKa values of edge surface sites 40,41 and, also, because of insufficient knowledge of the densities 119
of different edge surface sites 41. Eventually, Bourg et al. 20 concluded that experimental data on 120
Page 6 of 37
ACS Paragon Plus Environment
Environmental Science & Technology

7
the acid-base chemistry of montmorillonite edge surfaces could not be predicted from first 121
principles using existing knowledge. 122
The last decade has seen a significant number of new studies of the acid-base surface chemistry 123
of montmorillonite. Several new potentiometric titration studies have been carried out 42–47 as 124
well as one study that attempted to determine the i.e.p. of montmorillonite edge surfaces 48. 125
Several studies have provided new estimates of the edge specific surface area of montmorillonite 126
particles 10,49. Models of ψedge have been refined using new Poisson-Boltzmann calculations 9 and 127
Grand Canonical Monte Carlo (GCMC) simulations 50. Finally, ab initio MD simulations have 128
been used to predict the intrinsic pKa values of montmorillonite edge surface sites 51–57. Here, we 129
revisit the conclusions of Bourg et al. 20 in light of these advances. First, we show that new 130
knowledge obtained during the last decade provides a more coherent picture of the proton surface 131
chemistry of montmorillonite. Then, we develop a state-of-the-art SCM for montmorillonite edge 132
surfaces, and we note possibilities for future improvements. This new SCM is mainly based on a 133
combination of the existing 2D Poisson-Boltzmann calculations, which are representative of clay 134
edges geometry, with the development of a revised thermodynamic concept for the description of 135
the edge sites, and with the use of pKa values that have been obtained from ab initio MD 136
simulations. 137
2. Constraints on the proton surface chemistry of montmorillonite edges 138
2.1. Montmorillonite edge structure 139
Current knowledge of the densities of different types of montmorillonite edge functional groups 140
remains limited by uncertainty regarding edge crystallographic orientations. Crystal growth 141
theory calculations, surface Coulomb energy considerations, atomistic simulations, and in situ 142
Page 7 of 37
ACS Paragon Plus Environment
Environmental Science & Technology

8
observation of dissolution kinetics using atomic force microscopy suggest the that most stable 143
edge surfaces are perpendicular to [010] and [110] (or, equivalently, [1'10�) 58–63, where the Miller 144
indices are assigned according to Churakov 60 (Figure 1). The two edge surfaces are sometimes 145
referred to as the B and AC edges, respectively, following the seminal study by White and 146
Zelazny 63. Recent molecular dynamics (MD) and ab initio MD simulations of hydrated clay 147
edges suggest that the surface normal to [110] may be significantly more stable than the surface 148
normal to [010] in the presence of liquid water 61,62,64. 149
Montmorillonite edge surfaces are routinely assumed to have the same stoichiometry and 150
structure as the bulk crystal, with minor bond-length relaxation to accommodate over- or under-151
coordinated surface O atoms 40. Recent MD and ab initio MD simulation results reveal a more 152
complex picture, the most well-established finding being that cations in the octahedral layer can 153
adopt a five-fold coordination 55,61,65,66. 154
Page 8 of 37
ACS Paragon Plus Environment
Environmental Science & Technology

9
155
Figure 1. Edge surface sites of a model montmorillonite particle. Inserts with red and green 156
borders describe sites on the B edge. The insert with a blue border describes sites on the AC 157
edge. The clay mineral structure was taken from Viani et al. 67 and is representative of the 158
structures considered in bond valence calculations and ab initio MD simulations. Grey octahedra: 159
Al or Fe(III); orange octahedra: Mg or Fe(II); green tetrahedra: Si; red tetrahedra: Al. Isomorphic 160
substitutions are only shown if they occur at the edge surface. The stoichoimetries of the 161
deprotonated sites are written on the figure along with numbers corresponding to the log K values 162
Page 9 of 37
ACS Paragon Plus Environment
Environmental Science & Technology

10
of the associated protonation reactions predicted by ab initio MD calculations (see Section 2.4; an 163
absence of value means that the site does not protonate/deprotonate in the pH range 1 to 14). 164
165
2.2. Edge specific surface area 166
An important parameter in studies of montmorillonite edge reactivity is the edge specific surface 167
area, as,edge. Unfortunately, the N2 gas adsorption method with the Brunauer-Emmett-Teller 168
technique (N2-BET) quantifies only the external surface area of crystals (stacks of 169
montmorillonite layers) after drying, which provides no information on as,edge 68. The ethylene 170
glycol monoethyl ether (EGME) adsorption method quantifies the total specific surface area of 171
montmorillonite layers, as, dominated by the basal surfaces 69. In principle, as,edge equals the 172
difference between the measured as value and the theoretical basal specific surface area as,basal [≈ 173
750 to 780 m2 g-1 70]. Unfortunately, EGME-derived as values show a significant dependence on 174
experimental conditions 68 that precludes a precise calculation of as,edge. 175
Direct measurements of as,edge for montmorillonite have been achieved using two approaches. 176
The first consists in evaluating edge specific surface area by statistical analysis of particle 177
morphology from atomic force microscopy (AFM) or transmission electron microscopy (TEM) 178
images 71–73. Alternatively, the derivative isotherms summation (DIS) method distinguishes 179
different clay surfaces in a single gas adsorption measurement based on differences in adsorption 180
energy 68. Comparison of microscopic imaging and DIS results yields satisfactory agreement 181
(Table S-1), with a possible slight overestimation of edge surface area by the DIS method 74. 182
Page 10 of 37
ACS Paragon Plus Environment
Environmental Science & Technology
11
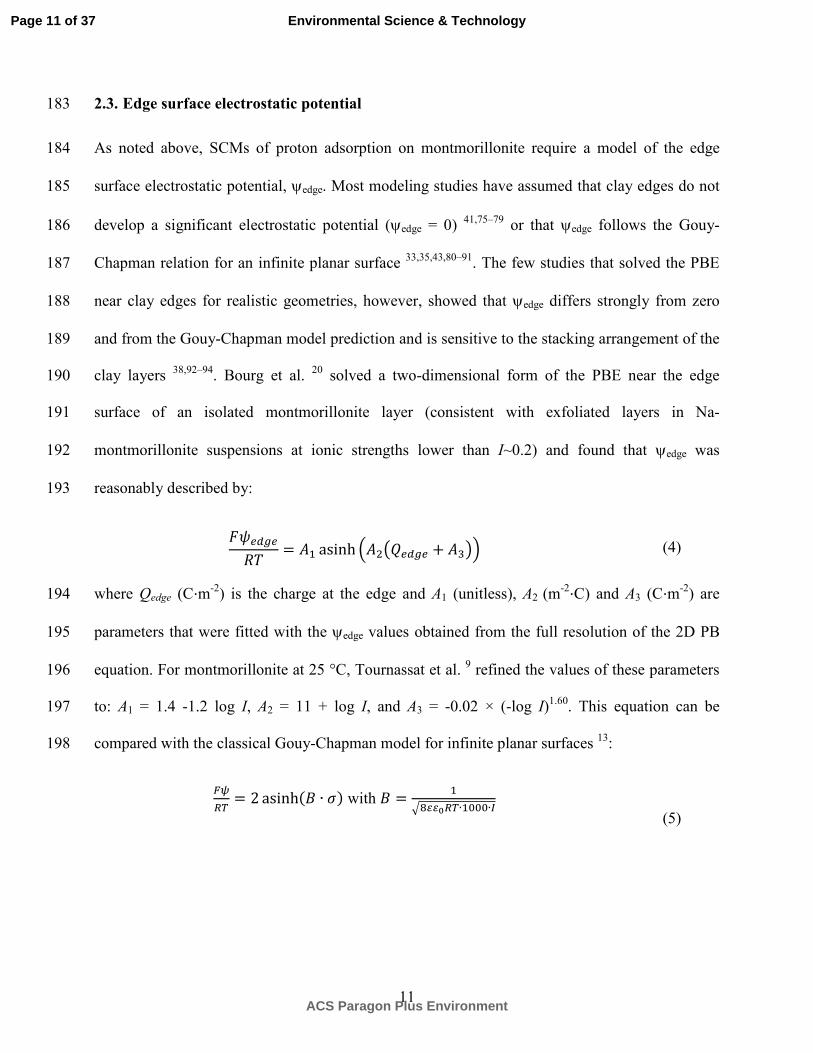
2.3. Edge surface electrostatic potential 183
As noted above, SCMs of proton adsorption on montmorillonite require a model of the edge 184
surface electrostatic potential, ψedge. Most modeling studies have assumed that clay edges do not 185
develop a significant electrostatic potential (ψedge = 0) 41,75–79 or that ψedge follows the Gouy-186
Chapman relation for an infinite planar surface 33,35,43,80–91. The few studies that solved the PBE 187
near clay edges for realistic geometries, however, showed that ψedge differs strongly from zero 188
and from the Gouy-Chapman model prediction and is sensitive to the stacking arrangement of the 189
clay layers 38,92–94. Bourg et al. 20 solved a two-dimensional form of the PBE near the edge 190
surface of an isolated montmorillonite layer (consistent with exfoliated layers in Na-191
montmorillonite suspensions at ionic strengths lower than I~0.2) and found that ψedge was 192
reasonably described by: 193
#�()*($% = + asinh /+012()*( + +345 (4)
where Qedge (C⋅m-2) is the charge at the edge and A1 (unitless), A2 (m-2⋅C) and A3 (C⋅m-2) are 194
parameters that were fitted with the ψedge values obtained from the full resolution of the 2D PB 195
equation. For montmorillonite at 25 °C, Tournassat et al. 9 refined the values of these parameters 196
to: A1 = 1.4 -1.2 log I, A2 = 11 + log I, and A3 = -0.02 × (-log I)1.60. This equation can be 197
compared with the classical Gouy-Chapman model for infinite planar surfaces 13: 198
6789 = 2asinh�; ∙ �� with ; =
=>??@89∙AAA∙B
(5)
Page 11 of 37
ACS Paragon Plus Environment
Environmental Science & Technology

12
where σ is the surface charge density (in m-2). A key prediction of Eq. 4 is that ψedge is negative 199
when the edge surface charge is zero (Figure 2) because of a spillover of negative electrostatic 200
potential from the basal surfaces 92,94. 201
202
Figure 2. Comparison of the relationships between surface charge (horizontal axis) and surface 203
electrostatical potential (vertical axis) predicted by the classical Gouy-Chapman model for a flat 204
oxide surface (top) and by the PBE calculations of Bourg et al. 20 for the edge surface of an 205
isolated montmorillonite layer (bottom) at three ionic strengths. The circles mark the condition of 206
zero charge and zero potential on each graph. 207
A potential limitation to the accuracy of the PBE is that it uses the mean-field theory 208
approximation, i.e., it neglects specific ion-ion and ion-surface site interactions. On infinite flat 209
Page 12 of 37
ACS Paragon Plus Environment
Environmental Science & Technology

13
surfaces, the PBE is nevertheless known to adequately predict the structure of the electrical 210
double layer except at high salinities or in the presence of multivalent counterions 37,95,96. In the 211
case of montmorillonite, an opportunity to verify the validity of Eq. (4) is provided by GCMC 212
simulations of the acid-base chemistry of individual clay particles where water was treated as a 213
uniform dielectric continuum 50. To this end, we implemented Eq. (4) in PHREEQC 97 (the 214
modification of the source code is made available in the supporting information file; a executable 215
file can be sent upon request) and predicted the protonation of surface sites using the same site 216
densities and pKa values as Delhorme et al. 50 (PHREEQC scripts and database are available in 217
the supporting information file). An excellent agreement was found between the two predictions 218
(Figure 3), suggesting that Eq. (4) is valid over the entire range of experimental conditions where 219
montmorillonite particles are made of single layers. This condition is met in experiments carried 220
out with montmorillonite particles dispersed in a NaCl or NaClO4 background electrolyte at ionic 221
strengths lower than I~0.2 98–101. 222
Page 13 of 37
ACS Paragon Plus Environment
Environmental Science & Technology

14
223
Figure 3. Comparison of the GCMC simulations of Delhorme et al. 50 (circles and squares) with 224
an SCM that used Eq. (4) (solid lines) at three different ionic strengths in NaCl salt background. 225
Both models used the same site densities and intrinsic pKa values. Activity coefficients of solute 226
species in the SCM were modeled using the extended Debye-Hückel formalism. Blue symbols 227
and lines refer to aluminol sites having a pKa of 3.75 and a site density of 4.5 nm-2; red symbols 228
and lines refer to silanol sites having a pKa of 8.0 and a site density of 5.2 nm-2. Shaded areas 229
correspond to conditions that cannot exist, i.e., domains where the specified ionic strength is 230
exceeded because of high H+ or OH- concentrations. 231
Page 14 of 37
ACS Paragon Plus Environment
Environmental Science & Technology

15
2.4. Intrinsic pKa values of edge surface sites 232
Until recently, theoretical estimates of the intrinsic pKa values of edge surface sites were based on 233
bond-valence theories. The resulting predicted pKa values were highly sensitive to model 234
assumptions 40,41 and did not provide accurate predictions of experimental montmorillonite 235
titration data 20. In the last decade, ab initio MD simulations have proved capable of accurately 236
predicting the intrinsic pKa values of simple oxide surface functional groups 102–104, including 237
oxide-type functional groups on montmorillonite edge surfaces 51–57. In particular, a series of 238
papers by Liu et al. 51–55 explored the influence of edge crystallographic orientation and the 239
presence of octahedral and tetrahedral substitutions on the intrinsic pKa values of edge surface 240
groups. Their predictions are summarized in Figure 1. It is noteworthy that similar sites on the 241
surfaces perpendicular to the [010] and [110] crystallographic directions have different reactivity 242
according to the ab initio MD calculations. For example, silanol sites (>SiOH) have pKa values of 243
7.0 on the [010] edge vs. 8.3 on the [110] edge when no octahedral substitution is present. These 244
values are significantly different from the values predicted by bond valence methods 40,41 and 245
used by Bourg et al. 20 (Table S-2). 246
2.5. Experimental data 247
Duc et al. 26–28 carried out a comprehensive examination of montmorillonite acid-base titration 248
methodologies and identified a series of best practices. These included careful montmorillonite 249
pre-treatment and storage procedures (use of a series of acid washes at pH ≈ 4, exchangeable 250
cation homogenization at ionic strength I ≈ 1, and rinsing steps; storage in liquid water at low 251
temperature for relatively short durations, or storage of freeze-dried samples as an acceptable 252
alternative). For the titration experiments themselves, they noted the importance of using an inert 253
atmosphere and limiting the experiments to the pH range ≈ 4.5-9.5. They found that a continuous 254
Page 15 of 37
ACS Paragon Plus Environment
Environmental Science & Technology

16
titration method was acceptable if equilibration times between additions of acid or base were 255
short (< 10 min) and if hysteresis was quantified; alternatively, a discontinuous batch titration 256
method was acceptable if the atoms released by clay dissolution (Si, Al, Mg, Fe) were analyzed 257
(both in solution and on the clay cation-exchange sites) to account for pH buffering by side 258
reactions. In the alkaline domain, however, correction of the raw batch titration data for measured 259
side reactions failed to reproduce the continuous titration curves. The authors concluded on the 260
superiority of fast, continuous methods for quantifying the dissociable surface charge of clays. 261
Among the many reported studies of montmorillonite titration 12,27–29,33–35,39,80,84,86,88–90,105, Bourg 262
et al. 20 determined that only three studies 27,28,39 followed this set of best practices. One of these 263
studies used the batch titration technique 39, and its results at alkaline pH values are therefore of 264
unclear reliability. Of the acid-base titration studies published over the last decade 42–47, none 265
followed the entire established set of best practices while also reporting the pH and ionic strength 266
of the solutions used during clay pre-treatment. The present study, therefore, focuses on the 267
dataset from Duc et al. 27 as the best available set of montmorillonite acid-base titration results. 268
An interesting indirect quantification of edge surface charge was pursued by Pecini and Avena 48, 269
who measured the i.e.p. of montmorillonite loaded with cationic dyes with a strong affinity for 270
the basal surface. Under the assumption that the dyes completely screen the basal surface charge 271
but do not interact with the edge surfaces (such that the measured i.e.p. reflects edge surface 272
properties) and within the well-established theoretical limitations associated with relating an i.e.p. 273
to a point of zero charge 30, the results of Pecini and Avena 48 suggest that the point of zero 274
charge of clay edge surfaces (the pH value where σ0,edge + σH = 0, where σ0,edge corresponds to the 275
permanent structural charge density “expressed” on the edge surface) is in the pH range 3.8–5.5, 276
in qualitative agreement with a previous measurement of the i.e.p. of thermally treated Cu-277
Page 16 of 37
ACS Paragon Plus Environment
Environmental Science & Technology

17
montmorillonite for which the structural layer charge was reduced to almost zero, whereby the 278
authors estimated that the edge surfaces are negatively charged at pH > 3.5 106. 279
3. Towards a predictive SCM for montmorillonite edge surfaces 280
3.1. Reactivity of edge surface functional groups 281
To determine whether the new knowledge summarized above allows a predictive simulation of 282
the acid-base chemistry of montmorillonite, we developed a generic SCM for the [010] and [110] 283
edge surfaces in our modified version of PHREEQC that applies Eq. (4) for the calculation of 284
ψedge. Edge surface functional groups were modeled as groups of one octahedral and two 285
tetrahedral cations together with their associated OH groups. The overall charge of a group was 286
calculated from bond valence principle applied to the terminal oxygen atoms of the edge sites. 287
For example, a fully-deprotonated functional group with no isomorphic substitution on the [010] 288
edge corresponds to the grouping of two Si-O- sites and one Al-(OH)2- site and is denoted >Si-Al-289
SiO4-3 (leaving the unreactive H out of the formula). It can be protonated four times with intrinsic 290
pKa values of 8.3, 7, 7, and 3.1 as predicted by ab initio MD simulation (section 2.4 and Figure 291
1). This representation deviates from the classical description used in SCMs, where each surface 292
hydroxyl is modeled as a distinct functional group with a single pKa value 107. The advantages of 293
the present representation are that the calculation of the number of sites affected by neighboring 294
substitutions is straightforward and that future implementation of metal adsorption through the 295
formation of multi-dentate surface complexes is made easier with regards to the calculation of 296
surface site activities 9,108. Simple cases were used to verify that the grouping of surface sites had 297
little effect on model predictions (Fig. SI-1 in supporting information; PHREEQC script files are 298
also available in order to test further the effect of grouping sites). The fractions of edge functional 299
Page 17 of 37
ACS Paragon Plus Environment
Environmental Science & Technology

18
groups that include octahedral or tetrahedral substitutions were calculated from the structural 300
formula of montmorillonite with the assumption that edge chemistry reflects that of the bulk 301
mineral. Because of the absence of ab initio MD simulation predictions of the reactivity of Fe-302
substituted sites on the [110] edge surface, sites with Fe(III) for Al substitutions on this surface 303
were assigned the same properties as sites without substitutions, while sites with Fe(II) for Al 304
substitutions were assigned the same properties as sites with Mg for Al substitutions. Surface site 305
densities were estimated from crystallographic considerations and from reported clay unit cell 306
formulae: each site group, SiAlSi, AlAlSi, SiMgSi, SiFeIIISi, and SiFeIISi had a density of 2.06 × 307
xi nm-2, where CDEF�GH�EF = / GHIJ�GH�KLMM�KLMMM5NOP, CDEF�KLMMM�EF = / KLMMM
IJ�GH�KLMM�KLMMM5NOP 308
,CDEF�KLMM�EF = / KLMMIJ�GH�KLMM�KLMMM5NOP , CDIJ�IJ�EF = 2 × / IJ
EF�IJ5PLP, and CDEF�IJ�EF = 1 −309
CDEF�GH�EF − CDIJ�IJ�EF − CDEF�KLMMM�EF − CDEF�KLMM�EF. This calculation implicitly neglects the 310
possible existence of edge sites with both octahedral and tetrahedral substitutions or with two 311
tetrahedral substitutions, for which predicted pKa values are not available. 312
3.2. Impact of clay permanent structural charge 313
Proton adsorption by Na-H cation exchange on basal surfaces was taken into account by using a 314
constant selectivity coefficient of 3.2 (log K = 0.5) in near agreement with previously published 315
values 41,109. The permanent structural charge was set to 0.9 molc·kg-1, yielding an overall charge 316
density of σ0 = -0.12 C·m-2 for the clay layers. As noted above, the edge surface charge equals 317
σ0,edge + σH = 0, where σ0,edge is the edge surface charge density resulting from nearby isomorphic 318
substitutions. Bourg et al. 20 assumed that σ0,edge = σ0 for simplicity. Here, we modeled edge 319
surface charge arising from near-edge isomorphic substitutions in an even simpler way: we added 320
-1 to the valence of edge functional groups that include an isomorphic substitution of Al for Si or 321
Page 18 of 37
ACS Paragon Plus Environment
Environmental Science & Technology

19
of Mg or Fe(II) for Al. For example, a fully-deprotonated edge functional group with no 322
isomorphic substitutions (>Si-Al-SiO4-3), upon substitution of Mg for Al, becomes (>Si-Mg-SiO4
-323
4). 324
3.3. Predicted acid-base properties of edge surfaces 325
According to the predictive model described above, montmorillonite edge surface charge has 326
little dependence on the type and extent of layer structural substitutions, but it depends 327
significantly on crystallographic orientation between the [010] and [110] edge surfaces (Figure 4, 328
top). In the presence of 0.1 mol⋅L-1 NaCl, the [010] surface is positively charged at pH < 5, 329
whereas the [110] surface is positively charged only at pH < 3.5, consistent with the experimental 330
findings of Thomas et al. 106 and Pecini and Avena 48. The relative proportion of [010] and [110] 331
edge surface orientations on montmorillonite is unfortunately unknown, which leaves one 332
unavoidable free parameter in the presently developed SCM. 333
Changes in ionic strength are predicted to have a marked effect on surface charge but not on the 334
shape of the charge vs. pH curves, especially for the surface perpendicular to [110] (Figure 4, 335
bottom). A decrease in ionic strength results primarily in a translation of the surface charge curve 336
towards higher pH values, in agreement with experimental results. 337
Page 19 of 37
ACS Paragon Plus Environment
Environmental Science & Technology

20
338
Figure 4. Top: Predicted edge surface charge as a function of pH for montmorillonite particles 339
immersed in a 0.1 mol⋅L-1 NaCl background electrolyte. “No”, “Al” and “Mg” substitutions refer 340
to simulations carried out with (CDEF�GH�EF = 0; CDIJ�IJ�EF = 0), (CDEF�GH�EF = 0; CDIJ�IJ�EF =341
0.1) and (CDEF�GH�EF = 0.2; CDIJ�IJ�EF = 0) respectively. Bottom: Influence of NaCl 342
concentration (0.001, 0.01, and 0.1 mol⋅L-1) on the predictions obtained if x>Si-Al-Si = 1. 343
3.4. Comparison with potentiometric titration data 344
Model predictions were compared with the potentiometric titration results of Duc et al. 27 for the 345
SWy-2 and MX80 reference montmorillonites (the dataset for SWy-2 was made available in 346
Delhorme et al. 50). The structural formulae of SWy-2 and MX80 montmorillonites were reported 347
as (Si3.87Al0.13)(Al1.52Mg0.25FeIII0.224FeII
0.006)Na0.39O10(OH)2 and 348
Page 20 of 37
ACS Paragon Plus Environment
Environmental Science & Technology

21
(Si4)(Al1.57Mg0.25FeIII0.09FeII
0.09)Na0.34O10(OH)2, respectively 27. Reported montmorillonite 349
structural formulae can vary as a function of sample preparation and calculation method 65. This 350
variability adds a minor source of uncertainty to our model predictions according to Figure 4. The 351
CDEF�GH�EF, CDEF�KLMM�EF, CDEF�KLMMM�EF and CDIJ�IJ�EF values were set, respectively, to 0.125, 352
0.045, 0.045 and 0 for MX80 montmorillonite and to 0.125, 0.003, 0.112 and 0.13 for SWy-2 353
montmorillonite. 354
A good agreement was found between experimental and predicted potentiometric titration data 355
for SWy-2 montmorillonite if the specific edge surface area was set to 14 m2⋅g-1 and the relative 356
abundance of [010] and [110] edges was set to 1:1 (Figure 5). The modeled edge specific surface 357
area is in agreement with the value of 19.2 m2⋅g-1 measured on the sample used for the titration 358
experiment (Table S-1), because the DIS method tends to overestimate the surface area 74. A 359
lesser agreement was found for the lowest ionic strength (I=0.001) at pH values greater than 8, 360
but the significance of this discrepancy is tempered by the increased experimental uncertainty at 361
pH > 9 20. For MX80 montmorillonite, the agreement between experimental and predicted 362
potentiometric titration curves was acceptable if the specific edge surface area was set to 12 m2⋅g-363
1 and the relative abundance of [010] and [110] edges was set to 1:1 (Figure 5) (the effect of 364
varying the relative abundance of [010] and [110] edges can be seen on Figure 4, and it can be 365
quantified by using the PHREEQC script files provided in the supporting information). The 366
modeled edge specific surface area was larger than the measured value (Table S-1, from 6 to 9 367
m2⋅g-1, depending on the considered study). However, the values reported in Table S-1 were not 368
measured for the same samples used in the titration experiments. For both titration datasets, the 369
pH values corresponding to �H = 0 were correctly predicted at all investigated ionic strengths. 370
A better agreement with the experimental data likely could have been achieved by adjusting the 371
Page 21 of 37
ACS Paragon Plus Environment
Environmental Science & Technology

22
pKa values of edge surface sites in the limit of the uncertainty reported in Liu et al. 51–55 (from 372
± 0.6 to ± 1.6 depending on the site under consideration), but such a refinement was not deemed 373
justified in light of the uncertainties in the experimental data. Such exercise can be done using the 374
files made available in the supporting information. 375
376
Figure 5. Comparison of model predictions (lines) and potentiometric titration data (symbols27,50) 377
for MX80 montmorillonite (bottom) and SWy-2 montmorillonite (top). The specific edge surface 378
area was set to 12 m2⋅g-1 and 14 m2⋅g-1 for MX80 and Swy-2 montmorillonite respectively, and 379
the relative abundance of [010] and [110] edges was set at 0.5/0.5. Error bands were estimated as 380
in Bourg et al. 20. 381
Page 22 of 37
ACS Paragon Plus Environment
Environmental Science & Technology

23
The present study relies on several simplifying assumptions or conditions that inherently limit the 382
range of applicability of the proposed model. First and foremost, the model was derived for the 383
case of simple indifferent 1:1 electrolytes such as NaCl at relatively dilute concentrations (≤ 0.1 384
M) where clay layer stacking is minimal and where the mean field approximation inherent in the 385
PBE is valid. Extension of the model to a broader set of conditions would require a new model of 386
ψedge derived for the appropriate aggregation structure of montmorillonite layers and for 387
deviations from the mean-field approximation. A significant challenge to such an extension is 388
that the best-quality experimental titration data are limited to the conditions modeled in the 389
present study. 390
Another important condition for the applicability of our proposed model is that the model’s 391
description of edge surface sites must be accurate. At the most fundamental level, this condition 392
can be challenged on the grounds that most, if not all, theoretical calculations of montmorillonite 393
edge site properties were carried out based on a pyrophillite-like model structure, which is trans-394
vacant, whereas available data suggest that most montmorillonites have a cis-vacant structure 395
110,111. Structural OH groups have different positions in cis- and trans-vacant structures. 396
Additionally, cis-vacant structures are not centrosymmetric 111, and the types of edge surface 397
configurations are thus more diverse than for trans-vacant structures. In particular, edge surface 398
site configurations are different for the edges perpendicular to the �010� and T010U 399
crystallographic directions in a cis-vacant structure, whereas they are the same in a trans-vacant 400
structure (see Figure S-1 in supporting information). 401
Page 23 of 37
ACS Paragon Plus Environment
Environmental Science & Technology

24
4. Acknowledgement 402
This work was supported by the French Radioactive Waste Management Agency (Andra) in the 403
framework of the Andra-BRGM scientific partnership (CTEC project). J.A.D. acknowledges 404
funding from L’Institut Carnot for his visit to the BRGM and from the U.S. Department of 405
Energy under Contract DE-AC02-05CH11231 under the auspices of the Office of Nuclear 406
Energy, Used Fuel Disposition program. I.C.B. was supported by the U.S. Department of Energy 407
under Contract DE-AC02-05CH11231 through the Office of Science, Office of Basic Energy 408
Sciences, Geosciences program. 409
5. TOC 410
411
412
6. References 413
(1) Bourg, I. C. Sealing shales versus brittle shales: A sharp threshold in the material 414 properties and energy technology uses of fine-grained sedimentary rocks. Env. Sci. Tech. 415 Lett. 2015, 2, 255–259. 416
(2) Tournassat, C.; Bourg, I. C.; Steefel, C. I.; Bergaya, F. Introduction; In Natural and 417 Engineered Clay Barriers; Tournassat, C.; Steefel, C. I.; Bourg, I. C.; Bergaya, F., Eds.; 418 Developments in Clay Science; Elsevier, 2015; Vol. 6, pp. 1–4. 419
(3) Borisover, M.; Davis, J. A. Chapter 2 - Adsorption of inorganic and organic solutes by 420 clay minerals; In Natural and Engineered Clay Barriers; Tournassat, C.; Steefel, C. I.; 421 Bourg, I. C.; Bergaya, F., Eds.; Developments in Clay Science; Elsevier, 2015; Vol. 6, 422 pp. 33–70. 423
Page 24 of 37
ACS Paragon Plus Environment
Environmental Science & Technology

25
(4) Bourg, I. C.; Tournassat, C. Chapter 6 - Self-diffusion of water and ions in clay barriers; 424 In Natural and Engineered Clay Barriers; Tournassat, C.; Steefel, C. I.; Bourg, I. C.; 425 Bergaya, F., Eds.; Developments in Clay Science; Elsevier, 2015; Vol. 6, pp. 71–100. 426
(5) Bourg, I. C.; Sposito, G. Ion exchange phenomena; In Handbook of Soil Science, second 427 edition; Huang, P. M.; Li, Y.; Sumner, M. E., Eds.; CRC Press: Boca Raton, 2011. 428
(6) Manning, B. A.; Goldberg, S. Adsorption and stability of arsenic(III) at the clay mineral-429 water interface. Env. Sci. Tech. 1997, 31, 2005–2011. 430
(7) Schlegel, M. L.; Manceau, A. Evidence for the nucleation and epitaxial growth of Zn 431 phyllosilicate on montmorillonite. Geochim. Cosmochim. Acta 2006, 70, 901–917. 432
(8) Strawn, D. G.; Sparks, D. L. The use of XAFS to distinguish between inner-and outer-433 sphere lead adsorption complexes on montmorillonite. J. Colloid Interface Sci. 1999, 434 216, 257–269. 435
(9) Tournassat, C.; Grangeon, S.; Leroy, P.; Giffaut, E. Modeling specific pH dependent 436 sorption of divalent metals on montmorillonite surfaces. A review of pitfalls, recent 437 achievements and current challenges. Am. J. Sci. 2013, 313, 395–451. 438
(10) Marty, N. C. M.; Cama, J.; Sato, T.; Chino, D.; Villiéras, F.; Razafitianamaharavo, A.; 439 Brendlé, J.; Giffaut, E.; Soler, J. M.; Gaucher, E. C.; Tournassat, C. Dissolution kinetics 440 of synthetic Na-smectite. An integrated experimental approach. Geochim. Cosmochim. 441 Acta 2011, 75, 5849–5864. 442
(11) Yang, L.; Steefel, C. I. Kaolinite dissolution and precipitation kinetics at 22 °C and pH 4. 443 Geochim. Cosmochim. Acta 2008, 72, 99–116. 444
(12) Tombácz, E.; Szekeres, M. Surface charge heterogeneity of kaolinite in aqueous 445 suspension in comparison with montmorillonite. Appl. Clay Sci. 2006, 34, 105–124. 446
(13) Davis, J. A.; James, R. O.; Leckie, J. O. Surface ionization and complexation at the 447 oxide/water interface: I. Computation of electrical double layer properties in simple 448 electrolytes. J. Colloid Interface Sci. 1978, 63, 480–499. 449
(14) Solomon, T. The definition and unit of ionic strength. J. Chem. Educ. 2001, 78, 1691–450 1692. 451
(15) Bickmore, B. R.; Tadanier, C. J.; Rosso, K. M. New approach for predicting acidity 452 constants: Combining bond-valence and ab initio methods. Abstracts of Papers of the 453 American Chemical Society 2004, 227, U1203–U1203. 454
(16) Goldberg, S.; Criscenti, L. J. Modeling adsorption of metals and metalloids by soil 455 components; In Biophysico-chemical processes of heavy metals and metalloids in soil 456 environments; Violante, A.; Huang, P. M.; Gadd, G. M., Eds.; John Wiley & Sons, 457 Hoboken, N J, 2008; pp. 215–264. 458
(17) Machesky, M. L.; Predota, M.; Wesolowski, D. J.; Vlcek, L.; Cummings, P. T.; 459 Rosenqvist, J.; Ridley, M. K.; Kubicki, J. D.; Bandura, A. V.; Kumar, N.; Sofo, J. O. 460 Surface protonation at the rutile (110) interface: explicit incorporation of solvation 461 structure within the refined MUSIC model framework. Langmuir 2008, 24, 12331–462 12339. 463
(18) Sposito, G. Characterization of particle surface charge; In Environmental particles; 464 Buffle, J.; Van Leeuwen, H. P., Eds.; Lewis Publisher, Chelsea, Michigan, USA, 1992; 465 Vol. 1, pp. 291–314. 466
(19) Sverjensky, D. A.; Sahai, N. Theoretical prediction of single-site surface-protonation 467 equilibrium constants for oxides and silicates in water. Geochim. Cosmochim. Acta 1996, 468 60, 3773–3797. 469
Page 25 of 37
ACS Paragon Plus Environment
Environmental Science & Technology

26
(20) Bourg, I. C.; Sposito, G.; Bourg, A. C. M. Modeling the acid-base surface chemistry of 470 montmorillonite. J. Colloid Interface Sci. 2007, 312, 297–310. 471
(21) Bargar, J. R.; Fuller, C. C.; Marcus, M. A.; Brearley, A. J.; Rosa, M. P. De la; Webb, S. 472 M.; Caldwell, W. A. Structural characterization of terrestrial microbial Mn oxides from 473 Pinal Creek, AZ. Geochim. Cosmochim. Acta 2009, 73, 889–910. 474
(22) Manceau, A.; Kersten, M.; Marcus, M. A.; Geoffroy, N.; Granina, L. Ba and Ni 475 speciation in a nodule of binary Mn oxide phase composition from Lake Baikal. 476 Geochim. Cosmochim. Acta 2007, 71, 1967–1981. 477
(23) Trolard, F.; Bourrié, G.; Abdelmoula, M.; Refait, P.; Feder, F. Fougerite, a new mineral 478 of the pyroaurite-iowaite group: description and crystal structure. Clays Clay Miner. 479 2007, 55, 323–334. 480
(24) Wang, S.-L.; Liu, C. H.; Wang, M. K.; Chuang, Y. H.; Chiang, P. N. Arsenate adsorption 481 by Mg/Al–NO3 layered double hydroxides with varying the Mg/Al ratio. Appl. Clay Sci. 482 2009, 43, 79–85. 483
(25) Duc, M.; Carteret, C.; Thomas, F.; Gaboriaud, F. Temperature effect on the acid-base 484 behaviour of Na-montmorillonite. J. Colloid Interface Sci. 2008, 327, 472–476. 485
(26) Duc, M.; Gaboriaud, F.; Thomas, F. Sensitivity of the acid-base properties of clays to the 486 methods of preparation and measurement: 1. Literature review. J. Colloid Interface Sci. 487 2005, 289, 139–147. 488
(27) Duc, M.; Gaboriaud, F.; Thomas, F. Sensitivity of the acid-base properties of clays to the 489 methods of preparation and measurement: 2. Evidence from continuous potentiometric 490 titrations. J. Colloid Interface Sci. 2005, 289, 148–156. 491
(28) Duc, M.; Thomas, F.; Gaboriaud, F. Coupled chemical processes at clay/electrolyte 492 interface: A batch titration study of Na-montmorillonites. J. Colloid Interface Sci. 2006, 493 300, 616–625. 494
(29) Tournassat, C.; Greneche, J.-M.; Tisserand, D.; Charlet, L. The titration of clay minerals. 495 Part I. Discontinuous backtitration technique combined to CEC measurements. J. Colloid 496 Interface Sci. 2004, 273, 224–233. 497
(30) Sposito, G. On points of zero charge. Environ. Sci. Technol. 1998, 32, 2815–2819. 498 (31) Davis, J. A.; Kent, D. Surface complexation modeling in aqueous geochemistry. Rev. 499
Mineral. Geochem. 1990, 23, 177–260. 500 (32) Sondi, I.; Biscan, J.; Pravdic, V. Electrokinetics of pure clay minerals revisited. J. 501
Colloid Interface Sci. 1996, 178, 514–522. 502 (33) Tertre, E.; Castet, S.; Berger, G.; Loubet, M.; Giffaut, E. Surface chemistry of kaolinite 503
and Na-montmorillonite in aqueous electrolyte solutions at 25 and 60ẹgreC: 504 Experimental and modeling study. Geochim. Cosmochim. Acta 2006, 70, 4579–4599. 505
(34) Tombácz, E.; Szekeres, M. Colloidal behavior of aqueous montmorillonite suspensions: 506 the specific role of pH in the presence of indifferent electrolytes. Appl. Clay Sci. 2004, 507 27, 75–94. 508
(35) Avena, M. J.; De Pauli, C. Proton adsorption and electrokinetics of an argentinean 509 montmorillonite. J. Colloid Interface Sci. 1998, 202, 195–204. 510
(36) Ẑalac, S.; Kallay, N. Application of mass titration to the point of zero charge 511 determination. J. Colloid Interface Sci. 1992, 149, 233–240. 512
(37) Sposito, G. The surface chemistry of natural particles; Oxford University Press: New 513 York, 2004; p. 242. 514
(38) Kraepiel, A. M. L.; Keller, K.; Morel, F. M. M. On the acid-base chemistry of 515 permanently charged minerals. Env. Sci. Tech. 1998, 32, 2829–2838. 516
Page 26 of 37
ACS Paragon Plus Environment
Environmental Science & Technology

27
(39) Baeyens, B.; Bradbury, M. H. A mechanistic description of Ni and Zn sorption on Na-517 montmorillonite. Part I: Titration and sorption measurements. J. Contam. Hydrol. 1997, 518 27, 199–222. 519
(40) Bickmore, B. R.; Rosso, K. M.; Nagy, K. L.; Cygan, R. T.; Tadanier, C. J. Ab initio 520 determination of edge surface structures for dioctahedral 2:1 phyllosilicates: Implications 521 for acid-base reactivity. Clays Clay Miner. 2003, 51, 359–371. 522
(41) Tournassat, C.; Ferrage, E.; Poinsignon, C.; Charlet, L. The titration of clay minerals II. 523 Structure-based model and implications for clay reactivity. J. Colloid Interface Sci. 2004, 524 273, 234–246. 525
(42) Bogolepov, A. A. Simulation of U(VI) and Co(II) sorption on montmorillonite. 526 Radiochemistry (Moscow, Russian Federation)(Translation of Radiokhimiya) 2009, 51, 527 96–103. 528
(43) Gu, X. Y.; Evans, L. J.; Barabash, S. J. Modeling the adsorption of Cd(II), Cu(II), Ni(II), 529 Pb(II) and Zn(II) onto montmorillonite. Geochim. Cosmochim. Acta 2010, 74, 5718–530 5728. 531
(44) Korichi, S.; Bensmaili, A. Sorption of uranium (VI) on homoionic sodium smectite 532 experimental study and surface complexation modeling. J. Hazard. Mater. 2009, 169, 533 780–793. 534
(45) Kriaa, A.; Hamdi, N.; Srasra, E. Acid-base chemistry of montmorillonitic and beidellitic-535 montmorillonitic smectite. Russ. J. Electrochem. 2007, 43, 167–177. 536
(46) Rozalén, M.; Brady, P. V.; Huertas, F. J. Surface chemistry of K-montmorillonite: Ionic 537 strength, temperature dependence and dissolution kinetics. J. Colloid Interface Sci. 2009, 538 333, 474–484. 539
(47) Tan, X. L.; Hu, J.; Zhou, X.; Yu, S. M.; Wang, X. K. Characterization of Lin’an 540 montmorillonite and its application in the removal of Ni2+ from aqueous solutions. 541 Radiochim. Acta 2008, 96, 487–495. 542
(48) Pecini, E. M.; Avena, M. J. Measuring the isoelectric point of the edges of clay mineral 543 particles: The case of montmorillonite. Langmuir 2013, 29, 14926–14934. 544
(49) Le Forestier, L.; Muller, F.; Villiéras, F.; Pelletier, M. Textural and hydration properties 545 of a synthetic montmorillonite compared with a natural Na-exchanged clay analogue. 546 Appl. Clay Sci. 2010, 48, 18–25. 547
(50) Delhorme, M.; Labbez, C.; Caillet, C.; Thomas, F. Acid-base properties of 2:1 clays. I. 548 Modeling the role of electrostatics. Langmuir 2010, 26, 9240–9249. 549
(51) Liu, X.; Cheng, J.; Sprik, M.; Lu, X.; Wang, R. Interfacial structures and acidity of edge 550 surfaces of ferruginous smectites. Geochim. Cosmochim. Acta 2015, 168, 293–301. 551
(52) Liu, X.; Cheng, J.; Sprik, M.; Lu, X.; Wang, R. Surface acidity of 2:1-type dioctahedral 552 clay minerals from first principles molecular dynamics simulations. Geochim. 553 Cosmochim. Acta 2014, 140, 410–417. 554
(53) Liu, X.; Lu, X.; Cheng, J.; Sprik, M.; Wang, R. Temperature dependence of interfacial 555 structures and acidity of clay edge surfaces. Geochimica et Cosmochimica Acta 2015, 556 160, 91–99. 557
(54) Liu, X.; Lu, X.; Sprik, M.; Cheng, J.; Meijer, E. J.; Wang, R. Acidity of edge surface 558 sites of montmorillonite and kaolinite. Geochim. Cosmochim. Acta 2013, 117, 180–190. 559
(55) Liu, X. D.; Lu, X. C.; Meijer, E. J.; Wang, R. C.; Zhou, H. Q. Atomic-scale structures of 560 interfaces between phyllosilicate edges and water. Geochim. Cosmochim. Acta 2012, 81, 561 56–68. 562
Page 27 of 37
ACS Paragon Plus Environment
Environmental Science & Technology

28
(56) Liu, X. D.; Lu, X. C.; Wang, R. C.; Meijer, E. J.; Zhou, H. Q.; He, H. P. Atomic scale 563 structures of interfaces between kaolinite edges and water. Geochim. Cosmochim. Acta 564 2012, 92, 233–242. 565
(57) Tazi, S.; Rotenberg, B.; Salanne, M.; Sprik, M.; Sulpizi, M. Absolute acidity of clay edge 566 sites from ab-initio simulations. Geochim. Cosmochim. Acta 2012, 94, 1–11. 567
(58) Bickmore, B. R.; Bosbach, D.; Hochella, M. F. J.; Charlet, L.; Rufe, E. In situ atomic 568 force microscopy study of hectorite and nontronite dissolution: implications for 569 phyllosilicate edge surface structures and dissolution mechanisms. Am. Mineral. 2001, 570 86, 411–423. 571
(59) Bleam, W. F.; Welhouse, G. J.; Janowiak, M. A. The surface Coulomb energy and proton 572 Coulomb potentials of pyrophyllite {010},{110},{100}, and {130} edges. Clays Clay 573 Miner. 1993, 41, 305–316. 574
(60) Churakov, S. V. Ab initio study of sorption on pyrophyllite: Structure and acidity of the 575 edge sites. J. Phys. Chem. B 2006, 110, 4135–4146. 576
(61) Newton, A. G.; Kwon, K. D.; Cheong, D.-K. Edge structure of montmorillonite from 577 atomistic simulations. Minerals 2016, 6, 25. 578
(62) Newton, A. G.; Sposito, G. Molecular dynamics simulations of pyrophyllite edge 579 surfaces: structure, surface energies, and solvent accessibility. Clays Clay Miner. 2015, 580 63, 277–289. 581
(63) White, G. N.; Zelazny, L. W. Analysis and implications of the edge structure of 582 dioctahedral phyllosilicates. Clays Clay Miner. 1988, 36, 141–146. 583
(64) Kwon, K. D.; Newton, A. G. Structure and stability of pyrophyllite edge surfaces: Effect 584 of temperature and water chemical potential. Geochim. Cosmochim. Acta 2016, 190, 585 100–114. 586
(65) Hadi, J.; Tournassat, C.; Ignatiadis, I.; Greneche, J.-M.; Charlet, L. Modelling CEC 587 variations versus structural iron reduction levels in dioctahedral smectites. Existing 588 approaches, new data and model refinements. J. Colloid Interface Sci. 2013, 407, 397–589 409. 590
(66) Lammers, L. N.; Bourg, I. C.; Okumurad, M.; Kolluria, K.; Sposito, G.; Machidad, M. 591 Molecular dynamics simulations of cesium adsorption on illite nanoparticles. J. Colloid 592 Interface Sci. 2016, submitted,. 593
(67) Viani, A.; Gualtieri, A. F.; Artioli, G. The nature of disorder in montmorillonite by 594 simulation of X-ray powder patterns. Am. Mineral. 2002, 87, 966–975. 595
(68) Michot, L. J.; Villiéras, F. Chapter 2.10 - Surface Area and Porosity; In Handbook of 596 Clay Science; Bergaya, F.; Lagaly, G., Eds.; Developments in Clay Science; Elsevier, 597 2013; Vol. 5, pp. 319–332. 598
(69) Srodon, J.; McCarty, D. K. Surface area and layer charge of smectite from CEC and 599 EGME/H2O-retention measurements. Clays Clay Miner. 2008, 56, 155–174. 600
(70) Tournassat, C.; Appelo, C. A. J. Modelling approaches for anion-exclusion in compacted 601 Na-bentonite. Geochim. Cosmochim. Acta 2011, 75, 3698–3710. 602
(71) Cadene, A.; Durand-Vidal, S.; Turq, P.; Brendle, J. Study of individual Na-603 montmorillonite particles size, morphology, and apparent charge. J. Colloid Interface 604 Sci. 2005, 285, 719–730. 605
(72) Nadeau, P. H. The physical dimensions of fundamental clay particles. Clay Miner. 1985, 606 20, 499–514. 607
Page 28 of 37
ACS Paragon Plus Environment
Environmental Science & Technology

29
(73) Tournassat, C.; Neaman, A.; Villiéras, F.; Bosbach, D.; Charlet, L. Nanomorphology of 608 montmorillonite particles: Estimation of the clay edge sorption site density by low-609 pressure gas adsorption and AFM observations. Am. Mineral. 2003, 88, 1989–1995. 610
(74) Reinholdt, M. X.; Hubert, F.; Faurel, M.; Tertre, E.; Razafitianamaharavo, A.; Francius, 611 G.; Prêt, D.; Petit, S.; Béré, E.; Pelletier, M.; Ferrage, E. Morphological properties of 612 vermiculite particles in size-selected fractions obtained by sonication. Appl. Clay Sci. 613 2013, 77, 18–32. 614
(75) Bradbury, M. H.; Baeyens, B. A mechanistic description of Ni and Zn sorption on Na-615 montmorillonite. Part II: modeling. J. Contam. Hydrol. 1997, 27, 223–248. 616
(76) Grambow, B.; Fattahi, M.; Montavon, G.; Moisan, C.; Giffaut, E. Sorption of Cs, Ni, Pb, 617 Eu(III), Am(III), Cm, Ac(III), Tc(IV), Th, Zr, and U(VI) on MX80 bentonite: an 618 experimental approach to assess model uncertainty. Radiochim. Acta 2006, 94, 627–636. 619
(77) Montavon, G.; Alhajji, E.; Grambow, B. Study of the interaction of Ni2+ and Cs+ on MX-620 80 bentonite; Effect of compaction using the “capillary method. Environ. Sci. Technol. 621 2006, 40, 4672–4679. 622
(78) Tertre, E.; Beaucaire, C.; Coreau, N.; Juery, A. Modelling Zn(II) sorption onto clayey 623 sediments using a multi-site ion-exchange model. Appl. Geochem. 2009, 24, 1852–1861. 624
(79) Wolthers, M.; Charlet, L.; Tournassat, C. Reactivity of bentonite. An additive model 625 applied to uranyl sorption; In Surface complexation modelling; Lützenkirchen, J., Ed.; 626 Elsevier, 2006. 627
(80) Avena, M. J. Acid-base behavior of clay surfaces in aqueous media. Encyclopedia of 628 surface and colloid science 2002, 37–63. 629
(81) Avena, M. J.; Mariscal, M. M.; De Pauli, C. P. Proton binding at clay surfaces in water. 630 Appl. Clay Sci. 2003, 24, 3–9. 631
(82) Barbier, F.; Duc, G.; Petit-Ramel, M. Adsorption of lead and cadmium ions from 632 aqueous solution to the montmorillonite/water interface. Colloid. Surface. A. 2000, 166, 633 153–159. 634
(83) Charlet, L.; Schindler, P. W.; Spadini, L.; Furrer, G.; Zysset, M. Cation adsorption on 635 oxides and clays: the aluminum case. Aquatic Science 1993, 55, 1015–1621. 636
(84) Ikhsan, J.; Wells, J. D.; Johnson, B. B.; Angove, M. J. Surface complexation modeling of 637 the sorption of Zn(II) by montmorillonite. Colloid. Surface. A. 2005, 252, 33–41. 638
(85) Kowal-Fouchard, A.; Drot, R.; Simoni, E.; Ehrhardt, J. J. Use of spectroscopic 639 techniques for uranium(VI)/montmorillonite interaction modeling. Env. Sci. Tech. 2004, 640 38, 1399–1407. 641
(86) Madrid, L.; Diaz-Barrentios, E. Description of titration curves of mixed materials with 642 variable and permanent surface charge by amathematical model. 1. Theory. 2. 643 Application to mixtures of lepidocrocite and montmorillonite. Journal of Soil Science 644 1988, 39, 215–225. 645
(87) Marcussen, H.; Holm, P. E.; Strobel, B. W.; Hansen, H. C. B. Nickel sorption to goethite 646 and montmorillonite in presence of citrate. Env. Sci. Tech. 2009, 43, 1122–1127. 647
(88) Stadler, M.; Schindler, P. W. Modeling of H+ and Cu2+ adsorption on calcium-648 montmorillonite. Clays Clay Miner. 1993, 41, 288–296. 649
(89) Tombácz, E.; Nyilas, T.; Libor, Z.; Csanaki, C. Surface charge heterogeneity and 650 aggregation of clay lamellae in aqueous suspensions; In Progress in Colloid and Polymer 651 Science: From Colloids to Nanotechnology; Kremer, F.; Lagaly, G., Eds.; Springer, 652 2004; Vol. 125, pp. 206–215. 653
Page 29 of 37
ACS Paragon Plus Environment
Environmental Science & Technology

30
(90) Wanner, H.; Albinson, Y.; Karnland, O.; Wieland, E.; Wersin, P.; Charlet, L. The 654 acid/base chemistry of montmorillonite. Radiochim. Acta 1994, 66/67, 157–162. 655
(91) Zachara, J. M.; Smith, S. C. Edge complexation reactions of cadmium on specimen and 656 soil-derived smectite. Soil Sci. Soc. Am. J. 1994, 58, 762–769. 657
(92) Chang, F. R. C.; Sposito, G. The electrical double layer of a disked-shaped clay mineral 658 particle: effect of electrolyte properties and surface charge density. J. Colloid Interface 659 Sci. 1996, 178, 555–564. 660
(93) Chang, F. R. C.; Sposito, G. The electrical double layer of a disked-shaped clay mineral 661 particle: effect of particle size. J. Colloid Interface Sci. 1994, 163, 19–27. 662
(94) Secor, R. B.; Radke, C. J. Spillover of the diffuse double layer on montmorillonite 663 particles. J. Colloid Interface Sci. 1985, 103, 237–244. 664
(95) Henderson, D.; Boda, D. Insights from theory and simulation on the electrical double 665 layer. Phys. Chem. Chem. Phys. 2009, 11, 3822–3830. 666
(96) Tinnacher, R. M.; Holmboe, M.; Tournassat, C.; Bourg, I. C.; Davis, J. A. Ion adsorption 667 and diffusion in smectite: molecular, pore, and continuum scale views. Geochim. 668 Cosmochim. Acta 2016, 177, 130–149. 669
(97) Parkhurst, D. L.; Appelo, C. A. J. Description of input and examples for PHREEQC 670 Version 3– a computer program for speciation,batch-reaction, one-dimensional 671 transport, and inverse geochemical calculations; U.S. Geological Survey Techniques 672 and Methods, book 6, chap. A43, 497 p., available at http://pubs.usgs.gov/tm/06/a43/, 673 2013. 674
(98) Méring, J. On the hydration of montmorillonite. Transaction of Faraday Society 1946, 675 42, B205–B219. 676
(99) Norrish, K. The swelling of montmorillonite. Faraday Discuss. Chem. Soc. 1954, 18, 677 120–134. 678
(100) Segad, M.; Hanski, S.; Olsson, U.; Ruokolainen, J.; Åkesson, T.; Jönsson, B. 679 Microstructural and swelling properties of Ca and Na montmorillonite:(in situ) 680 observations with cryo-TEM and SAXS. J. Phys. Chem. C. 2012, 116, 7596–7601. 681
(101) Sposito, G. The diffuse-ion swarm near smectite particles suspended in 1:1 electrolyte 682 solutions: modified Gouy-Chapman theory and quasicrystal formation; In Clay water 683 interface and its rheological implications; Güven, N.; Pollastro, R. M., Eds.; Clay 684 minerals society, 1992; Vol. 4, pp. 127–156. 685
(102) Leung, K.; Criscenti, L. J. Predicting the acidity constant of a goethite hydroxyl group 686 from first principles. J. Phys.: Condens. Matter 2012, 24, 124105. 687
(103) Leung, K.; Nielsen, I. M.; Criscenti, L. J. Elucidating the bimodal acid-base behavior of 688 the water-silica interface from first principles. J. Am. Chem. Soc. 2009, 131, 18358–689 18365. 690
(104) Sulpizi, M.; Gaigeot, M.-P.; Sprik, M. The silica–water interface: how the silanols 691 determine the surface acidity and modulate the water properties. J. Chem. Theory 692 Comput. 2012, 8, 1037–1047. 693
(105) Helmy, A.; Ferreiro, E.; De Bussetti, S. Cation exchange capacity and condition of zero 694 charge of hydroxy-A1 montmorillonite. Clays Clay Miner. 1994, 42, 444–450. 695
(106) Thomas, F.; Michot, L. J.; Vantelon, D.; Montarges, E.; Prelot, B.; Cruchaudet, M.; 696 Delon, J. F. Layer charge and electrophoretic mobility of smectites. Colloid. Surface. A. 697 1999, 159, 351–358. 698
Page 30 of 37
ACS Paragon Plus Environment
Environmental Science & Technology
31
(107) Hiemstra, T.; Van Riemsdijk, W. H. On the relationship between charge distribution, 699 surface hydration, and the structure of the interface of metal hydroxides. J. Colloid 700 Interface Sci. 2006, 301, 1–18. 701
(108) Kulik, D. A. Thermodynamic concepts in modeling sorption at the mineral-water 702 interface. Rev. Mineral. Geochem. 2009, 70, 125–180. 703
(109) Fletcher, P.; Sposito, G. The chemical modeling of clay/electrolyte interactions for 704 montmorillonite. Clay Miner. 1989, 24, 375–391. 705
(110) Drits, V. A.; Zviagina, B. B. Trans-vacant and cis-vacant 2:1 layer silicates: structural 706 features, identification, and occurrence. Clays Clay Miner. 2009, 57, 405–415. 707
(111) Tsipursky, S. I.; Drits, V. A. The distribution of octahedral cations in the 2:1 layers of 708 dioctahedral smectites studied by oblique-texture electron diffraction. Clay Miner. 1984, 709 19, 177–193. 710
711
Page 31 of 37
ACS Paragon Plus Environment
Environmental Science & Technology

Figure 1
297x420mm (300 x 300 DPI)
Page 32 of 37
ACS Paragon Plus Environment
Environmental Science & Technology

Figure 2
117x161mm (300 x 300 DPI)
Page 33 of 37
ACS Paragon Plus Environment
Environmental Science & Technology

Figure 3
166x163mm (300 x 300 DPI)
Page 34 of 37
ACS Paragon Plus Environment
Environmental Science & Technology

Figure 4
297x420mm (300 x 300 DPI)
Page 35 of 37
ACS Paragon Plus Environment
Environmental Science & Technology

Figure 5
297x420mm (300 x 300 DPI)
Page 36 of 37
ACS Paragon Plus Environment
Environmental Science & Technology

TOC
297x420mm (300 x 300 DPI)
Page 37 of 37
ACS Paragon Plus Environment
Environmental Science & Technology