Embed Size (px)
Citation preview

State-of-the-Art Reactor Consequence Analyses: Using decades of research and experience to model accident progression, mitigation, emergency response, and health effects
MODELING POTENTIAL REACTOR ACCIDENT CONSEQUENCES


MODELING POTENTIAL REACTOR ACCIDENT CONSEQUENCES | i
PERSONAL STATEMENT FROM BRIAN SHERON
Director
Office of Nuclear Regulatory Research
U.S. Nuclear Regulatory Commission
The U.S. Nuclear Regulatory Commission’s (NRC’s) Office of Nuclear Regulatory Research is a congressionally mandated office that plans, recommends, and implements a program of nuclear regulatory research, standards development, and resolution of generic issues for nuclear power plants and other NRC-regulated facilities. We partner with other NRC offices, Federal agencies, industry
research organizations, and international organizations to conduct these activities.
We started the State-of-the-Art Reactor Consequence Analyses (SOARCA) research project to estimate the potential health effects from the unlikely event of a commercial nuclear power plant accident releasing significant quantities of radioactive material into the environment. This project modeled a set of important accident scenarios for two plants, Peach Bottom and Surry, which represent two of the most common types of plants licensed in the United States. SOARCA considers plant design and operational changes not reflected in earlier assessments. The project also takes into account NRC’s development of rigorous oversight processes and use of operating experience along with improvements in operator training and emergency preparedness. We’ve also incorporated decades of national and international research into the tools that NRC used to perform this study.
One of SOARCA’s objectives is explaining severe-accident-related aspects of nuclear safety to NRC stakeholders. Stakeholders include members of the public along with Federal, State, and local authorities and the companies that hold NRC licenses to operate nuclear power plants. SOARCA meets this communication objective by documenting its results in reports: NUREG-1935, “State-of-the-Art Reactor Consequence Analyses Main Report,” and NUREG/CR-7110, Volume 1, “Peach Bottom Integrated Analyses,” and Volume 2, “Surry Integrated Analyses.” Because the NUREG reports rely on highly technical explanations, this brochure was developed as a plain-language summary of SOARCA’s methods, results, and conclusions. We invite you to read this brochure to understand how we used state-of-the-art methods to model these unlikely nuclear power plant accidents to understand their potential impact on public health and safety.

ii | U.S. Nuclear Regulatory Commission
ACKNOWLEDGEMENTS:
This brochure was the result of the efforts of many NRC staff and the staff of its contractors, Sandia National Laboratories, and dycoda, LLC. The contributions of Dorothy Andreas (née Collins) and Scott Burnell are especially appreciated. The SOARCA team also wishes to thank Eric Knowles and Woody Machalek for their help with the graphics and layout.
The SOARCA project team consisted of the following individuals. This group also benefited greatly from the contributions of other selected NRC staff members, including senior risk analysts from NRC’s headquarters and regional offices, in specific areas of the project.
Dorothy Andreas (née Collins) Jonathan Barr Terry Brock Scott Burnell Richard Chang Donald Chung Donald Dube
Tina Ghosh Chris Hunter Jocelyn Mitchell AJ Nosek José Pires Robert Prato Jason Schaperow
Martin Stutzke Randolph Sullivan Charles Tinkler James Vail Thomas Weaver
Kathy Halvey Gibson Brian Holian
Patricia Santiago Brian W. Sheron
Jennifer Uhle Jimi Yerokun
Management oversight was provided by the following individuals:

MODELING POTENTIAL REACTOR ACCIDENT CONSEQUENCES | iii
KEY RESULTS: � When operators are successful in using available onsite equipment during the accidents analyzed in SOARCA, they can prevent the reactor from melting, or delay or reduce releases of radioactive material to the environment.
� SOARCA analyses indicate that all modeled accident scenarios, even if operators are unsuccessful in stopping the accident, progress more slowly and release much smaller amounts of radioactive material than calculated in earlier studies.
� As a result, public health consequences from severe nuclear power plant accidents modeled in SOARCA are smaller than previously calculated.
� The delayed releases calculated provide more time for emergency response actions such as evacuating or sheltering for affected populations. For the scenarios analyzed, SOARCA shows that emergency response programs, if implemented as planned and practiced, reduce the risk of public health consequences.
� Both mitigated (operator actions are successful) and unmitigated (operator actions are unsuccessful) cases of all modeled severe accident scenarios in SOARCA cause essentially no risk of death during or shortly after the accident.
� SOARCA’s calculated longer term cancer fatality risks for the accident scenarios analyzed are millions of times lower than the general U.S. cancer fatality risk.

iv | U.S. Nuclear Regulatory Commission
MODELING POTENTIAL REACTOR ACCIDENT CONSEQUENCES | v
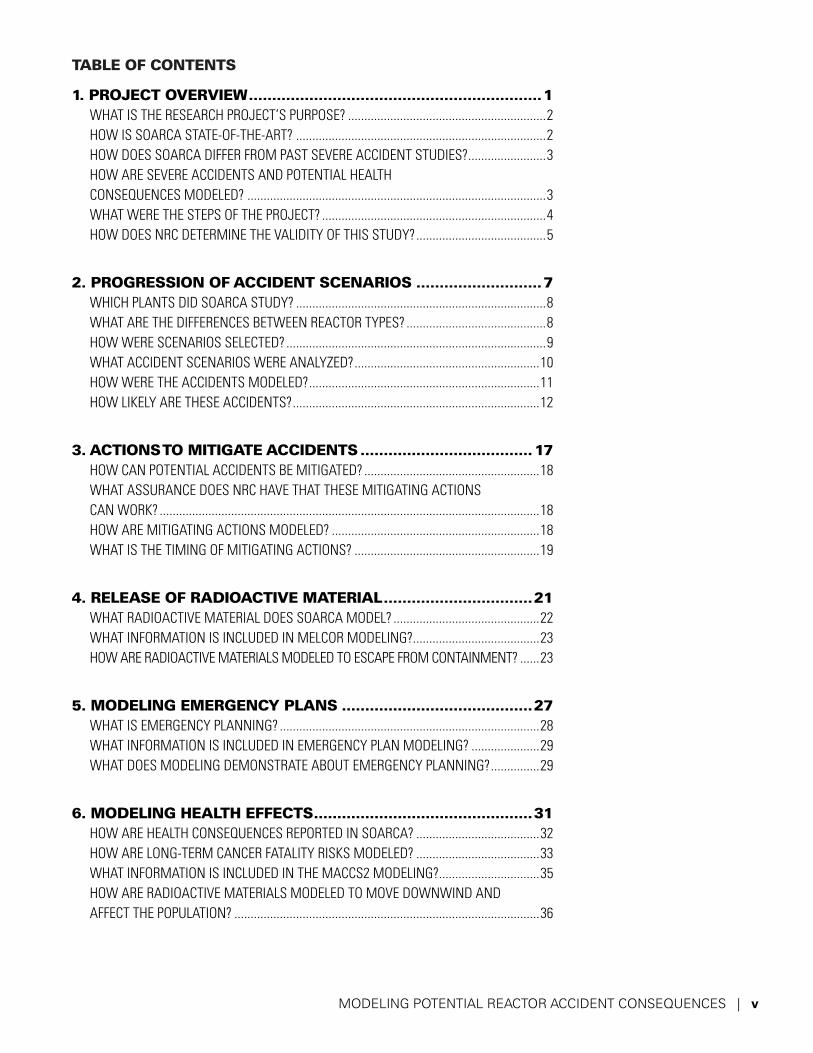
TABLE OF CONTENTS
1. PROJECT OVERVIEW ...............................................................1WHAT IS THE RESEARCH PROJECT’S PURPOSE? .............................................................2HOW IS SOARCA STATE-OF-THE-ART? .............................................................................2HOW DOES SOARCA DIFFER FROM PAST SEVERE ACCIDENT STUDIES? ........................3HOW ARE SEVERE ACCIDENTS AND POTENTIAL HEALTHCONSEQUENCES MODELED? ............................................................................................3WHAT WERE THE STEPS OF THE PROJECT? .....................................................................4HOW DOES NRC DETERMINE THE VALIDITY OF THIS STUDY? ........................................5
2. PROGRESSION OF ACCIDENT SCENARIOS ...........................7WHICH PLANTS DID SOARCA STUDY? .............................................................................8WHAT ARE THE DIFFERENCES BETWEEN REACTOR TYPES? ...........................................8HOW WERE SCENARIOS SELECTED? ................................................................................9WHAT ACCIDENT SCENARIOS WERE ANALYZED? .........................................................10HOW WERE THE ACCIDENTS MODELED? .......................................................................11HOW LIKELY ARE THESE ACCIDENTS? ............................................................................12
3. ACTIONS TO MITIGATE ACCIDENTS .....................................17HOW CAN POTENTIAL ACCIDENTS BE MITIGATED? ......................................................18WHAT ASSURANCE DOES NRC HAVE THAT THESE MITIGATING ACTIONSCAN WORK? .....................................................................................................................18HOW ARE MITIGATING ACTIONS MODELED? ................................................................18WHAT IS THE TIMING OF MITIGATING ACTIONS? .........................................................19
4. RELEASE OF RADIOACTIVE MATERIAL ................................21WHAT RADIOACTIVE MATERIAL DOES SOARCA MODEL? .............................................22WHAT INFORMATION IS INCLUDED IN MELCOR MODELING?.......................................23HOW ARE RADIOACTIVE MATERIALS MODELED TO ESCAPE FROM CONTAINMENT? ......23
5. MODELING EMERGENCY PLANS .........................................27WHAT IS EMERGENCY PLANNING? ................................................................................28WHAT INFORMATION IS INCLUDED IN EMERGENCY PLAN MODELING? .....................29WHAT DOES MODELING DEMONSTRATE ABOUT EMERGENCY PLANNING? ...............29
6. MODELING HEALTH EFFECTS ...............................................31HOW ARE HEALTH CONSEQUENCES REPORTED IN SOARCA? ......................................32HOW ARE LONG-TERM CANCER FATALITY RISKS MODELED? ......................................33WHAT INFORMATION IS INCLUDED IN THE MACCS2 MODELING?...............................35HOW ARE RADIOACTIVE MATERIALS MODELED TO MOVE DOWNWIND AND AFFECT THE POPULATION? ..............................................................................................36

vi | U.S. Nuclear Regulatory Commission
7. RESULTS AND CONCLUSIONS ..............................................37WHAT ARE THE RESULTS OF THE MITIGATED SCENARIOS? ..........................................38HOW WOULD OPERATOR ACTIONS MITIGATE ACCIDENTS? .........................................38WHAT ARE THE RESULTS OF UNMITIGATED SCENARIOS? ............................................38WHAT DO SOARCA RESULTS INDICATE ABOUT CONSEQUENCES OF SEVERE ACCIDENTS? .......................................................................................................39HOW DO SOARCA RESULTS COMPARE TO PAST STUDIES? ..........................................41HOW DO SOARCA RESULTS COMPARE TO THE NRC SAFETY GOAL ANDOVERALL U.S. CANCER RISKS? .......................................................................................41WHAT ARE THE LIMITATIONS OF COMPARING SOARCA RESULTS TO THENRC SAFETY GOAL AND OVERALL U.S. CANCER RISKS? ..............................................41
GLOSSARY AND REFERENCES .................................................43
LIST OF FIGURES1.1 Locations of All Operating Reactors in the United States ..........................................41.2 Flow Chart of the SOARCA Process ............................................................................62.1 Peach Bottom Atomic Power Station and Surry Power Station ..................................82.2 Typical U.S. Boiling-Water Reactor .............................................................................92.3 Typical U.S. Pressurized-Water Reactor ....................................................................103.1 Comparison of SOARCA Accident Progression Timing for Mitigated and Unmitigated Cases of Peach Bottom Long Term Station Blackout ...........................204.1 Percentages of Iodine and Cesium Released to the Environment During the First 48 Hours of the Accident for SOARCA Unmitigated Scenarios, 1982 Siting Study (SST1), and Historical Accidents .....................................................................245.1 Evacuation Timing for Peach Bottom Unmitigated Long-Term Station Blackout (hours) .........................................................................................................306.1 Transport Pathways of Radioactive Materials ..........................................................346.2 Information Used to Model Health Effects in SOARCA ............................................357.1 Scenario-specific Risk of Dying from Long-Term Cancer for an Individual within 10 Miles of the Plant (per reactor-year) .........................................................40
LIST OF TABLES2.1 Likelihoods of SOARCA Accident Scenarios .............................................................124.1 Timing and Quantity of Radioactive Material Released for SOARCA Mitigated and Unmitigated Scenarios.......................................................................................255.1 Evacuation Groups .....................................................................................................287.1 SOARCA Results: Mitigated and Unmitigated Cases ...............................................39

MODELING POTENTIAL REACTOR ACCIDENT CONSEQUENCES | vii
ACRONYMS
ac alternating current BWR boiling-water reactor CDF core damage frequency CFR Code of Federal Regulations CRAC Calculation of Reactor Accident Consequences dc direct current EPA U.S. Environmental Protection Agency EPZ emergency planning zone ETE evacuation time estimate HPS Health Physics Society ISLOCA interfacing systems loss-of-coolant accident LCF long-term cancer fatality LNT linear no-threshold LOCA loss-of-cooling accident LTSBO long-term station blackout LWR light-water reactor MACCS2 MELCOR Accident Consequence Code System, Version 2 NRC U.S. Nuclear Regulatory Commission PRA probabilistic risk assessment psi pounds per square inch (pressure) PWR pressurized-water reactor SBO station blackout SGTR steam generator tube rupture SOARCA State-of-the-Art Reactor Consequence Analyses SST siting source term STSBO short-term station blackout TISGTR thermally induced steam generator tube rupture

MODELING POTENTIAL REACTOR ACCIDENT CONSEQUENCES | 1
This chapter explains the purpose of the project and the overall process for determining the results.

2 | U.S. Nuclear Regulatory Commission
WHAT IS THE RESEARCH PROJECT’S PURPOSE?
The U.S. Nuclear Regulatory Commission’s (NRC’s) State-of-the-Art Reactor Consequence Analyses (SOARCA) research project calculated the realistic outcomes of severe nuclear power plant accidents that could release radioactive material into the environment. The computer models that produced these calculations incorporated decades of research into reactor accidents as well as the current design and operation of nuclear power plants. To provide perspective between SOARCA results and the more conservative estimates of severe reactor accident outcomes found in earlier NRC publications, SOARCA results are compared to the results of one of these previous publications: NUREG/CR-2239, “Technical Guidance for Siting Criteria Development,” commonly referred to as the 1982 Siting Study. The SOARCA report and this brochure help NRC to communicate severe-accident-related aspects of nuclear safety to you, the public; Federal, State, and local authorities; and nuclear power plant licensees.
HOW IS SOARCA STATE-OF-THE-ART?
NRC considers SOARCA a state-of-the-art project because (1) it models accidents with the latest plant-specific and site-specific information, (2) it uses an improved understanding of how radioactive material behaves during an accident, (3) it examines emergency response comprehensively, and (4) it combines modern computer-modeling capabilities and very detailed computerized plant models.
NRC, the nuclear power industry, and international nuclear safety organizations have extensively researched plant response to potential accidents that could damage the reactor fuel and the containment building, which is designed to keep radioactive material from reaching the environment. This research has significantly improved NRC’s ability to develop computer models of how nuclear plant systems and operators would respond to severe accidents. When NRC developed the SOARCA plant models, the staff interviewed plant personnel and examined current plant equipment configurations to incorporate each facility’s most current design and operational information. This updated information includes:
� Plant owners improved plant safety through enhanced plant designs, emergency procedures, inspection programs, and operator training
� Plant owners have also increased power production (referred to as “power uprates”) and lengthened operating times between replacing used fuel in the reactor – these actions changed the types and amounts of radioactive material in used reactor fuel.
� Plant owners improved severe accident mitigation strategies, including NRC-required enhancements made after the terrorist attacks of September 11, 2001, to respond to fires and explosions. These “10 CFR 50.54(hh) mitigation” enhancements are named after the relevant section of the NRC’s regulations.
� Plant owners and local governments have refined and improved emergency preparedness programs and equipment to further protect the public in the unlikely event of a severe accident.
How to Use this BrochureThis brochure provides tools to help understand SOARCA’s processes, terminology, and results. Here are some features that you can use:
•Colored side boxes such as this one explain concepts, provide historical information, or explain relevant NRC regulations.
•Glossary in the appendix defines terms.
•References in the appendix provide a list of information documents.
If you are viewing this online:
•Gray, underlined phrases and URLs are linked to the NRC Web site.
MODELING POTENTIAL REACTOR ACCIDENT CONSEQUENCES | 3
All of these changes have been considered in SOARCA. The SOARCA team applied this accumulated research and incorporated plant changes to more realistically evaluate the potential health consequences from severe nuclear reactor accidents.
HOW DOES SOARCA DIFFER FROM PAST SEVERE ACCIDENT STUDIES?
NRC has previously researched the probabilities and potential health consequences of severe accidents and documented this research in reports such as WASH-1400, ”Reactor Safety Study. An Assessment of Accident Risks in U.S. Commercial Nuclear Power Plants”, NUREG-1150, “Severe Accident Risks: An Assessment for Five U.S. Nuclear Power Plants”, and NUREG/CR-2239. The SOARCA Report, NUREG-1935, contains details about some of these past studies. Since the publication of the earlier studies, NRC has participated in many severe accident research programs. This work has improved our understanding of how heat is transferred and radioactive material moves through reactor systems during severe accidents and how radioactive material might get out of the containment building and move through the surrounding environment. NRC incorporated these research results into SOARCA’s computer codes. In addition, the SOARCA study used a more complete and detailed computer model of the reactor, containment, and other buildings onsite. Because SOARCA is based on decades of research and uses improved modeling tools, the study generates more realistic results than past efforts such as the 1982 Siting Study. These past studies were based on then-existing plant descriptions and knowledge of how severe accidents would occur. However, we now know that the predictions from these past studies are out of date for realistically understanding severe accident consequences.
HOW ARE SEVERE ACCIDENTS AND POTENTIAL HEALTH CONSEQUENCES MODELED?
The SOARCA project used sophisticated computer programs to calculate the effect a severe accident could have on an operating nuclear reactor and the possible impact on the public. These programs integrate information about reactor systems, components, operating history, and the impacts of emergency procedures, weather conditions, emergency planning, evacuation time estimates, and population.
What Is a Severe Accident?A severe accident is a type of accident that may challenge safety systems at a level much higher than expected.
A reactor accident occurs when the plant cooling water systems are no longer removing heat from the reactor fuel (the “core” of the reactor). Extensive core damage could melt reactor fuel, which would settle at the bottom of the reactor vessel that is designed to hold the fuel. The reactor vessel is surrounded by the containment building. If cooling water is not restored, however, and the accident progresses further, the melted fuel could rupture the bottom of the reactor vessel, with the melted fuel flowing onto the containment floor. Radioactive material would be released from the fuel into the containment atmosphere and could potentially escape containment if there were any available leakage paths.
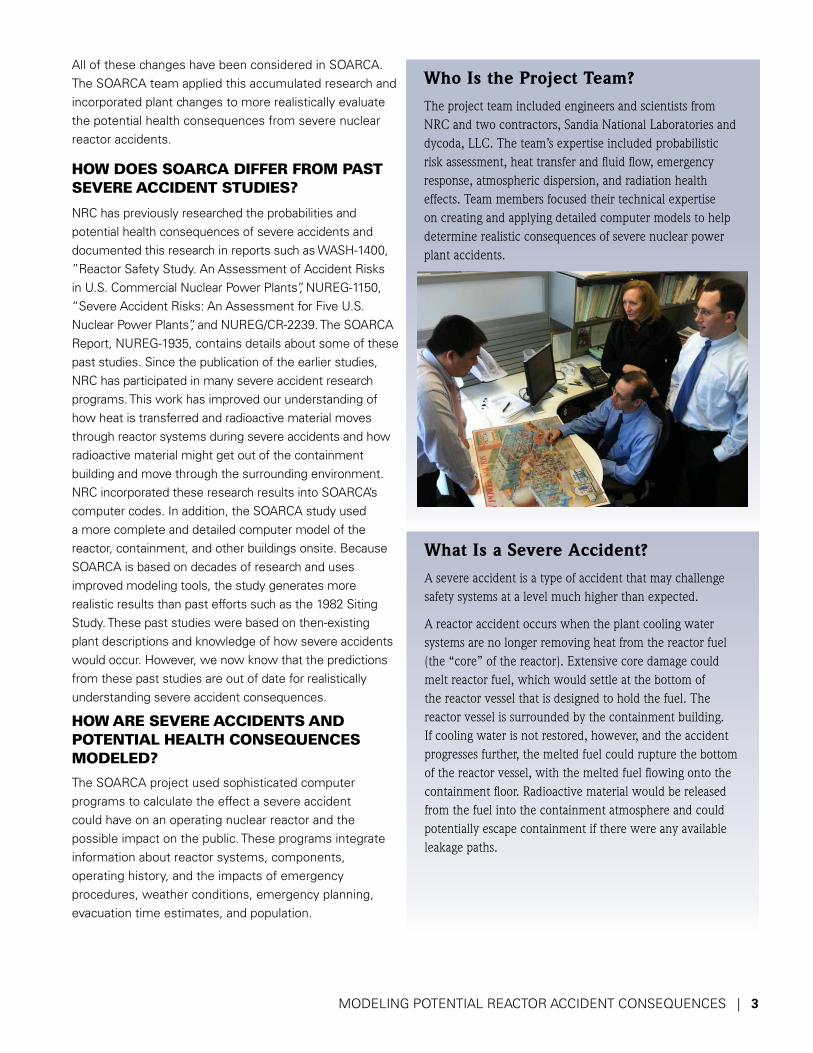
Who Is the Project Team?The project team included engineers and scientists from NRC and two contractors, Sandia National Laboratories and dycoda, LLC. The team’s expertise included probabilistic risk assessment, heat transfer and fluid flow, emergency response, atmospheric dispersion, and radiation health effects. Team members focused their technical expertise on creating and applying detailed computer models to help determine realistic consequences of severe nuclear power plant accidents.

4 | U.S. Nuclear Regulatory Commission
WHAT WERE THE STEPS OF THE PROJECT?
The SOARCA project took a step-by-step approach to calculate the potential consequences of the analyzed severe accidents. The project team first decided it could learn more by rigorously and realistically analyzing a relatively small number of important accident scenarios, rather than carrying out less-detailed modeling of many scenarios. Therefore, the team selected a threshold to help select scenarios to analyze (Chapter 2 of this brochure describes the selection process). SOARCA aimed to assess the benefits of 10 CFR 50.54(hh) mitigation measures (put in place after 9-11 for responding to fires and explosions) in other accident scenarios. We also wanted to provide a basis for comparison to past analyses of severe accident scenarios before these mitigation measures existed. The project therefore analyzed the selected scenarios twice: first assuming that the event proceeds without
the 10 CFR 50.54(hh) mitigation measures, called “unmitigated” and then assuming that the 10 CFR 50.54(hh) mitigation is successful, called “mitigated”. For scenarios leading to an offsite release of radioactive material, SOARCA then analyzed the material’s atmospheric dispersion, the surrounding area’s emergency response, and potential health consequences. Figure 1.2 illustrates this overall approach.
Figure 18. U.S. Operating Commercial Nuclear Power Reactors
PA
NY
ME
IN
WA
OR
CA
NV
MT
ID
UT
AZ NM
CO
WY
TX
OK
KS
NE
SD
NDMN
IA
MO
AR
LAMS AL GA
FL
SC
NCVA
TN
KYIL
OH
MIWI
WVMD
DENJ
CTRI
MA
NHVT
AKHI
Source: U.S. Nuclear Regulation Commission
Licensed to Operate (104)
REGION ICONNECTICUT Millstone 2 and 3
MARYLAND Calvert Cliffs 1 and 2
MASSACHUSETTS Pilgrim 1
NEW HAMPSHIRE Seabrook 1
NEW JERSEY Hope Creek 1 Oyster Creek Salem 1 and 2
NEW YORK James A. FitzPatrick Ginna Indian Point 2 and 3 Nine Mile Point 1 and 2
PENNSYLVANIA Beaver Valley 1 and 2 Limerick 1 and 2 Peach Bottom 2 and 3 Susquehanna 1 and 2 Three Mile Island 1
VERMONT Vermont Yankee
REGION IIALABAMA Browns Ferry 1, 2, and 3 Joseph M. Farley 1 and 2
FLORIDA Crystal River 3 St. Lucie 1 and 2 Turkey Point 3 and 4
GEORGIA Edwin I. Hatch 1 and 2 Vogtle 1 and 2
NORTH CAROLINA Brunswick 1 and 2 McGuire 1 and 2 Shearon Harris 1
SOUTH CAROLINA Catawba 1 and 2 Oconee 1, 2, and 3 H.B. Robinson 2 Summer
TENNESSEE Sequoyah 1 and 2 Watts Bar 1
VIRGINIA North Anna 1 and 2 Surry 1 and 2
REGION IIIILLINOIS Braidwood 1 and 2 Byron 1 and 2 Clinton Dresden 2 and 3 La Salle County 1 and 2 Quad Cities 1 and 2
IOWA Duane Arnold
MICHIGAN D.C. Cook 1 and 2 Fermi 2 Palisades
MINNESOTA Monticello Prairie Island 1 and 2
OHIO Davis-Besse Perry 1
WISCONSIN Kewaunee Point Beach 1 and 2
REGION IVARKANSAS Arkansas Nuclear 1 and 2
ARIZONA Palo Verde 1, 2, and 3
CALIFORNIA Diablo Canyon 1 and 2 San Onofre 2 and 3
KANSAS Wolf Creek 1
LOUISIANA River Bend 1 Waterford 3
MISSISSIPPI Grand Gulf
MISSOURI Callaway
NEBRASKA Cooper Fort Calhoun
TEXAS Comanche Peak 1 and 2 South Texas Project 1 and 2
WASHINGTON Columbia
PeachBottom
Surry
Figure 1.1 Locations of All Operating Reactors in the United States.
What Are NRC Regulations?NRC works diligently to ensure safe operation of nuclear power plants, supporting safety by developing rules for the proper operation of a nuclear power plant. These rules are detailed in Title 10 of the Code of Federal Regulations (10 CFR). Throughout this brochure, we will refer you to some of the relevant rules so you can better understand how NRC works to protect public health and the environment. An online version of 10 CFR is available at http://www.nrc.gov/reading-rm/doc-collections/cfr/.
MODELING POTENTIAL REACTOR ACCIDENT CONSEQUENCES | 5
HOW DOES NRC DETERMINE THE VALIDITY OF THIS STUDY?
Peer Review— A peer review is a review of a research project by experts not involved in the project. These experts examine the methods and results of the research and help improve the work by identifying the project’s strengths and weaknesses. The SOARCA team assembled a panel of independent, external experts in the fields of risk analysis, severe accident research, emergency preparedness, and radiation health effects. This group reviewed SOARCA’s methodology, underlying assumptions, results, and conclusions to ensure that they are technically sound and state-of-the-art. For the same reasons, NRC’s Advisory Committee on Reactor Safeguards (a standing group of nuclear safety experts) also reviewed the project and provided comments. The SOARCA team has incorporated the experts’ feedback into the reports.
Sensitivity and Uncertainty Analyses—Scientific research strives for valid results based on high-quality data and reasonable assumptions. Because data can be sparse and uncertain, however, researchers work systematically to identify any weaknesses in data and assumptions and to consider alternatives. This step is an important part of making research results transparent and understandable. NRC staff used sensitivity analyses to compare how varying individual input assumptions affect the outcomes. The results of these sensitivity analyses show that the SOARCA results are reasonable considering known uncertainties. In addition, NRC is taking a systematic look at potential sources of uncertainty and their impact on SOARCA results in a separate uncertainty analysis. The uncertainty analysis uses a statistical approach to assess the uncertainties in a more integrated fashion.
What Computer Codes Were Used for SOARCA?SOARCA uses two specialized computer codes to analyze severe accidents and offsite consequences. The first, MELCOR, calculates accident timing and event progression using plant design information and models for the accident phenomena. The second, MACCS2 (MELCOR Accident Consequence Code System, Version 2), calculates the offsite health consequences of an airborne release of radioactive material using site-specific information for the area and radiological release data from MELCOR.
The MELCOR code was peer reviewed in 1991 by experts from national laboratories, universities, and MELCOR code users. This peer review provided an independent assessment of the technical adequacy of the code. The peer reviewers’ recommendations were incorporated into NRC’s research and development plan for the code, which has also been checked, or “validated”, against numerous experimental results over the past several decades.
An expert panel review of the MACCS2 code and SOARCA’s MACCS2 modeling choices was conducted in August 2006, prior to the start of specific work as part of the Peach Bottom and Surry analyses. This expert panel review and the NRC staff recommendations influenced much of the development that has been undertaken specifically to support SOARCA.

6 | U.S. Nuclear Regulatory Commission
Select accident scenarios to
analyze
Model progression of
accident
Model emergency planning
Model dispersion of radioactive
material
Model health consequences
No health consequences to
model
If no core damage, no
release
If core damage, and containment does not prevent
release
If core damage, but containment prevents release
Model mitigative measures
Figure 1.2 Flow Chart of the SOARCA Process.

This chapter explains the basic information on reactor designs and how accident scenarios could lead to damage of the reactor core.
MODELING POTENTIAL REACTOR ACCIDENT CONSEQUENCES | 7

8 | U.S. Nuclear Regulatory Commission
WHICH PLANTS DID SOARCA STUDY?
SOARCA analyzed an example of each major type of operating U.S. nuclear reactor: a boiling-water reactor (BWR) and a pressurized-water reactor (PWR). The project team solicited volunteers from the nuclear industry to participate in the project. The Peach Bottom Atomic Power Station in Pennsylvania and the Surry Power Station in Virginia volunteered and are the focus of this report. Peach Bottom is a General Electric-designed BWR with a Mark I containment. Surry is a Westinghouse-designed PWR with a large dry containment. These two plants, depicted in Figure 2.1, also were part of earlier studies.
WHAT ARE THE DIFFERENCES BETWEEN REACTOR TYPES?
Figures 2.2 and 2.3 describe some of the major differences between BWRs and PWRs. Within these two general types of U.S. commercial nuclear reactors, many variations exist in the design of systems, components, and containments at different sites.
Figure 2.1 Peach Bottom Atomic Power Station (top) and Surry Power Station (bottom).

MODELING POTENTIAL REACTOR ACCIDENT CONSEQUENCES | 9
HOW WERE SCENARIOS SELECTED?
The project team sought to focus its attention and resources on the important severe accident scenarios for Peach Bottom and Surry found in past risk studies, such as NUREG-1150, “Severe Accident Risks: An Assessment for Five U.S. Nuclear Power Plants”. The project narrowed its approach by using an accident sequence’s possibility of damaging reactor fuel (also called the reactor “core”), or core damage frequency (CDF), as an indicator of risk.
The SOARCA scenarios were selected from the results of existing probabilistic risk assessments (PRAs). The scenario-selection process used updated and benchmarked standardized plant analysis risk (SPAR) models and available plant-specific external events information from 2005. Core damage scenarios from previous staff and licensee PRAs were identified and combined into common core damage groups that have similar timing and response for important severe accident phenomena and similar containment or safety systems. The groups were screened according to their approximate CDFs to identify the most risk-significant groups. SOARCA analyzed scenarios with a CDF equal to or greater than 1 in a million reactor-years. SOARCA also
Figure 2.2 Typical U.S. Boiling-Water Reactor.A BWR cools the reactor core and generates steam to turn a turbine using a single loop of water, as distinct from a PWR (see figure 2.3) that has separate loops for cooling the reactor and generating steam. Heat from nuclear fission in the reactor core converts the water to steam. The steam travels through the steam line to the turbine generator where it turns the generator to make electricity. The steam then enters the condenser where it is cooled back into liquid water and is pumped back into the reactor to repeat the process. The BWR’s water is pressurized to about 1,100 pounds per square inch (psi) pressure so it boils at about 550 °F. A typical BWR core contains between 400 and 800 fuel assemblies, and each fuel assembly holds 75 to 100 fuel rods. The BWR in this figure is shown with a Mark I style of containment. More information is available at http://www.nrc.gov/reactors/bwrs.html
ReactorCavity
Accumulator
Reactor Vessel
Reactor Building
SuppressionPool
SuppressionPool
Reactor Vessel
SteamGenerator
SafetyInjectionSystem
Reinforced Concrete ContainmentBuilding
Primary Containment
Inerted DrywellSteel Shell
Water Storage
Tank
ControlRods
Control Rods
ReactorCore
ReactorCore
ContainmentSpray
Steam to Turbine
Steam to Turbine
Water from Condenser
Water from Condenser
NOT TO SCALE NOT TO SCALE

10 | U.S. Nuclear Regulatory Commission
Figure 2.3 Typical U.S. Pressurized-Water Reactor.A PWR has separate coolant loops to cool the reactor and generate the steam. The PWR’s coolant loop (known as the primary loop) is under very high pressure (about 2,300 psi) to prevent water from boiling. The water is pumped through the reactor core where it is heated to about 600°F before being routed to the steam generators. The water travels through thousands of small tubes inside the steam generators where it heats secondary loop water at a lower pressure (about 900 psi) to produce saturated steam at about 530°F. This steam enters the main steam line that routes it to the turbine generator. From the turbine generator, the steam then enters the condenser that cools it back to water so it can be pumped back to the steam generator to repeat the cycle. A typical PWR core has 150 to 250 fuel assemblies, and each assembly contains 200 to 300 fuel rods in a 14x14 to 17x17 matrix. Each PWR reactor has 2, 3, or 4 steam generators connected to it. The PWR in this figure is shown with a large dry containment. More information is available at http://www.nrc.gov/reactors/pwrs.html.
ReactorCavity
Accumulator
Reactor Vessel
Reactor Building
SuppressionPool
SuppressionPool
Reactor Vessel
SteamGenerator
SafetyInjectionSystem
Reinforced Concrete ContainmentBuilding
Primary Containment
Inerted DrywellSteel Shell
Water Storage
Tank
ControlRods
Control Rods
ReactorCore
ReactorCore
ContainmentSpray
Steam to Turbine
Steam to Turbine
Water from Condenser
Water from Condenser
NOT TO SCALE NOT TO SCALE
sought to analyze scenarios leading to an early failure or bypass of the containment where the CDF is equal to or greater than 1 in 10 million reactor-years, since these scenarios have a potential for higher consequences and risk. This approach allowed a more detailed analysis of accident consequences for the more likely, although still remote, accident scenarios.
WHAT ACCIDENT SCENARIOS WERE ANALYZED?
For both Peach Bottom and Surry, the team modeled loss of all alternating current (ac) electrical power or “station blackout (SBO)” scenarios caused by earthquakes more severe than anticipated in the plant’s design. SBO frequencies from flood or fire scenarios were combined with the earthquake frequency for scenario selection; however, SOARCA modeled the earthquake scenario
What is a Probabilistic Risk Assessment?Probabilistic risk assessment (PRA) is an engineering approach to systematically identify potential nuclear power plant accident scenarios and estimate their likelihoods of occurrence and consequences. Each accident scenario begins with an initiating event (such as a loss of offsite power or earthquake) followed by a combination of equipment failures and operator actions that can lead to core damage and the release of radioactive materials from the containment. The information developed by a PRA is useful in identifying plant vulnerabilities. Pioneered by NRC in the 1970s, PRA has been adopted by nuclear power plant operators and regulators worldwide as a tool that complements other approaches to assess nuclear power plant safety.

MODELING POTENTIAL REACTOR ACCIDENT CONSEQUENCES | 11
because this presented the most severe challenge to the plant operators as well as offsite emergency responders, and had the highest probability of occurring.
Long-Term Station Blackout (LTSBO)—In this scenario, the plant loses all ac power sources, but battery backups operate safety systems for about 4-8 hours until the batteries are exhausted.
Short-Term Station Blackout (STSBO)—In this scenario, the site loses all power (even the batteries), all of the safety systems immediately become inoperable, and core damage occurs in the “short term.”1 The STSBO scenario starts with a more extreme earthquake than the one that starts the LTSBO.
In addition, the team analyzed two scenarios for Surry in which radioactive material could potentially reach the environment by bypassing containment features. These are discussed in more detail in Chapter 4.
Interfacing Systems Loss-of-Coolant Accident (ISLOCA)—In this scenario, a random failure of valves ruptures low-pressure system piping outside containment that connects with the high-pressure reactor system inside containment.
Thermally Induced Steam Generator Tube Rupture (TISGTR)—This scenario is a lower probability variation of the STSBO. While the core is overheating and boiling off the available water, extremely hot steam and hydrogen circulating through the steam generator rupture a steam generator tube resulting in a pathway for radioactive material to escape to the non-radioactive portion of the plant and potentially to the environment.
Peach Bottom and Surry both have two reactor units on the site. Multiunit accidents (events leading to reactor core damage at multiple units on the same site) could be caused by certain initiators such as an earthquake. Most PRAs and health consequence studies developed to date do not explicitly consider multiunit accidents because NRC policy is to apply the Commission’s “Safety Goals for the Operation of Nuclear Power Plants” (51 FR 28044) and subsidiary risk acceptance guidelines on a “per reactor” basis. Therefore only single-reactor accidents were evaluated in SOARCA.
HOW WERE THE ACCIDENTS MODELED?
The SOARCA team modeled the accident scenarios and their potential to damage the core as realistically as possible by gathering detailed information about each of the two plants studied. The team asked plant staff for specific information about the design and operation of each plant system. The models’ realism is enhanced by incorporating recent U.S. and international research about severe accidents and accounting for additional structures within containment (such as internal walls, piping, pumps, and heat exchangers) and buildings adjacent to the containment.
The state-of-the-art MELCOR computer code modeled how each scenario would unfold at each plant. The MELCOR results describe the following:
1 This terminology for long-term SBO and short-term SBO is consistent with that used in past NRC studies including NUREG-1150, “Severe Accident Risks: An Assessment for Five U.S. Nuclear Power Plants”.
What is a Station Blackout?Reactor cooling systems at nuclear power plants are powered by alternating current (ac) power. This ac power is normally supplied by offsite power sources via the electrical grid but can be supplied by onsite sources such as emergency diesel generators if needed. A station blackout (SBO) involves the total loss of ac power when both offsite and onsite ac power sources fail. During an SBO, reactor cooling is temporarily provided by systems that do not rely on ac power, such as turbine-driven pumps that are driven by steam from the reactor. Batteries also are used to provide direct current (dc) power to control the turbine-driven pumps and to power instrumentation. Historically, risk models have indicated that the station blackout is an important contributor to overall nuclear power plant risk.

12 | U.S. Nuclear Regulatory Commission
Table 2.1 Likelihoods of SOARCA Accident Scenarios
Reactor Site Accident Scenario Probability/Frequency
Surry Long-Term Station Blackout 1 event in ~ 50,000 years
Peach Bottom Long-Term Station Blackout 1 event in ~ 300,000 years
Surry Short-Term Station Blackout 1 event in ~ 500,000 years
Surry Short-Term Station Blackout with Thermally Induced Steam Generator Tube Rupture 1 event in ~ 3 million years
Peach Bottom Short-Term Station Blackout 1 event in ~ 3 million years
Surry Interfacing Systems Loss-of-Coolant Accident 1 event in ~ 30 million years
� How the plant and its emergency systems perform in response to an accident.
� How the reactor core behaves as it heats up beyond normal temperature limits.
� How the fuel itself, the reactor piping, and the containment building behave under extremely high temperatures.
� Whether radioactive material reaches the environment and, if so, how it occurs and how much material is released.
This information is based on the plant’s design and physical safety systems. In addition, nuclear plants have a series of redundant and diverse safety measures to back up the designed safety systems. Chapter 3 of this brochure discusses how the SOARCA project models the actions that can potentially prevent or mitigate the release of radioactive material and ultimately protect the public. If a scenario caused a release of radioactive material, the team used another computer code (MACCS2) to calculate the offsite health consequences of the release; Chapters 4, 5, and 6 provide more details about this step.
HOW LIKELY ARE THESE ACCIDENTS?
Overall, the SOARCA scenarios have core damage likelihoods that range from about 1 accident in 50,000 years to 1 accident in 30 million years. Table 2.1 shows the likelihoods for each scenario in order of more likely scenarios to less likely scenarios. Although the chances of these scenarios ever occurring are very small, probabilistic risk assessments have shown that these scenarios are very important core damage sequences.
SOARCA examines the effectiveness of actions to mitigate each accident (should one occur) and to prevent radioactive material from reaching the public and the environment. The likelihoods of the scenarios selected for SOARCA were based on: a review of NUREG-1150; the Individual Plant Examination of External Events (IPEEEs) conducted by licensees in the 1990s; NRC-developed SPAR models of external events; licensee-sponsored PRAs; and other NRC-sponsored studies. There was no attempt to match the stated likelihoods to any one particular study. Rather, they reflect the expert opinion of the NRC staff, based on all these sources of information available in 2005 when the scenarios were selected. Updated information could affect these estimates. For example, NRC staff expects to gain further insight into seismic and flooding event scenarios when U.S. nuclear power plants implement recommendations from the Fukushima Near-Term Task Force report (July 2011).

MODELING POTENTIAL REACTOR ACCIDENT CONSEQUENCES | 13
Historical Perspective: Fukushima Dai-ichi and NRC ResponseOn March 11, 2011, a 9.0-magnitude earthquake struck Japan about 231 miles northeast of Tokyo off the east coast of Honshu Island. The earthquake led to the automatic shutdown of 11 reactors at 4 sites (Onagawa, Fukushima Dai-ichi, Fukushima Dai-ni, and Tokai). At Fukushima Dai-ichi, which includes General Electric BWR Mark I reactors similar to the Peach Bottom plants, diesel generators provided electricity to plant systems until about 40 minutes later. At that point, a tsunami, estimated to have exceeded 45 feet (14 meters) in height, appeared to have caused the loss of all alternating current (ac) power and most emergency diesel generators to the six Fukushima Dai-ichi reactors. Three Fukushima Dai-ichi reactors (Units 1-3) were in operation at the time of the earthquake, and three (Units 4-6) were shut down for routine refueling and maintenance. Due to lack of ac power to pump water into Units 1 through 3 to cool the nuclear fuel, some of the fuel melted. The melted fuel cladding reacted with steam and generated hydrogen gas. The hydrogen reached critical levels and caused explosions. The reactor damage, along with hydrogen gas explosions inside the units, released radioactive material into the environment. The earthquake and tsunami devastation in the area significantly delayed offsite assistance. Additional systems were finally able to use seawater to cool the reactors, and Japan continues work on stabilizing these plants.
Since the events at Fukushima began to unfold, NRC has been working to understand the events in Japan and relay important information to U.S. nuclear power plants. Not long after the emergency began, NRC established a task force of senior NRC experts to determine lessons learned from the accident and to initiate a review of NRC regulations to determine if additional measures should be taken immediately to ensure the safety of U.S. nuclear power plants. The task force issued its report on July 12, 2011, concluding that continued U.S. plant operation and NRC licensing activities presented no imminent risk. The Task Force also concluded that enhancements to safety and emergency preparedness are warranted and made a dozen general recommendations for Commission consideration. The NRC is currently implementing many of those recommendations to enhance U.S. nuclear plant safety.
An appendix to the main SOARCA report briefly compares and contrasts what we currently know about Fukushima with insights from the Peach Bottom SOARCA analyses. The NRC Web site has additional information on the Fukushima accident and NRC’s response:
•http://www.nrc.gov/reading-rm/doc-collections/fact-sheets/fs-japan-events.html
•http://www.nrc.gov/japan/japan-info.html

14 | U.S. Nuclear Regulatory Commission
Comparison of Fukushima Accident to SOARCA AnalysesThe SOARCA study had nearly completed its peer review when the Fukushima Dai-ichi accident occurred on March 11, 2011. Following the accident, the U.S. Department of Energy (DOE) and the NRC began a cooperative effort to use the MELCOR code for a forensic analysis of event progression to develop a more detailed understanding of the accident. This cooperative effort is ongoing.
Based on limited information currently available, the Fukushima accident is in some ways similar to a few of the Peach Bottom scenarios analyzed in SOARCA. The SOARCA team compared and contrasted the Fukushima accident and the SOARCA study for the following topics: (1) operation of the reactor core isolation cooling (RCIC) system, (2) hydrogen release and combustion, (3) 48-hour truncation of releases in SOARCA, (4) multiunit risk, and (5) spent fuel pool risk. It must be emphasized that we need much more information to be certain about what actually occurred in the Fukushima reactors. Our current uncertainty prevents us from drawing firm conclusions regarding comparisons with SOARCA results.
As the NRC learned more about the damage to plant safety functions was gathered over the weeks and months following these events, many similarities became apparent between SOARCA’s calculated damage progression in the Peach Bottom SBO accident scenarios and the progression of events at Fukushima. These similarities include the following:
• the sequence and timing of events that followed the loss of core cooling, including the start of core damage and radioactive material release from the fuel,
•challenges to containment integrity from the loss of fuel heat removal and the accumulation of hydrogen generated during fuel damage within the reactor vessel, and
• the destructive effects of hydrogen combustion in the reactor building.
Some notable differences were also obvious between the events that unfolded at Fukushima and the Peach Bottom LTSBO scenario studied in the SOARCA project. These differences, for example the use and timing of certain safety systems, led the NRC staff to take a closer look at the models used and assumptions made in the LTSBO analyses. SOARCA analysis results were qualitatively compared to the preliminary events and information available in the evaluation of the Fukushima Dai-ichi accident. SOARCA’s conclusions remain valid in light of information currently available from the events that unfolded at Fukushima.

MODELING POTENTIAL REACTOR ACCIDENT CONSEQUENCES | 15
Historical Perspective: Three Mile Island and ChernobylMany people are familiar with the Three Mile Island (pictured left) and Chernobyl (pictured right) accidents. Although SOARCA did not examine these historical accidents, this brochure provides information about them so readers can compare the results of this research study to real events.
On March 28, 1979, the Three Mile Island accident occurred in Pennsylvania as a result of equipment malfunctions, design-related problems, and worker errors. The accident melted almost half the reactor core of Unit 2 and released contaminated water and radioactive material into the containment building. A very small amount of radioactive material reached the environment. It remains the most serious accident in U.S. commercial nuclear power plant operating history although no plant workers or members of the nearby community were injured or killed. A long-term follow-up study by the University of Pittsburgh that evaluated local, county, and State population data from 1979 through 1998 concluded that there is not an increase in overall cancer deaths among the people living within a 5-mile radius of Three Mile Island at the time of the accident. This accident brought about sweeping changes for nuclear power plants and heightened oversight by NRC.
On April 26, 1986, an accident destroyed Unit 4 of the nuclear power station at Chernobyl, Ukraine, in the former USSR. The series of events that led to this accident could not occur at U.S. commercial power reactors because U.S. reactors have different plant designs, robust containment structures, and operational controls to protect them against the combination of lapses that led to the accident at Chernobyl. Its operators ran an experiment that led to a sudden surge of power, destroying the reactor core and releasing massive amounts of radioactive material into the environment. About 30 emergency responders died in the first 4 months after the accident. The health of the evacuated population and populations in contaminated areas of Belarus, the Russian Federation, and Ukraine has been monitored since 1986. Monitoring efforts to date indicate that a lack of prompt countermeasures resulted in increased risk of thyroid cancer to members of the public, most notably among people who were children or young adults at the time of the accident. No other health effects are attributed to the radiological exposure in the general population. Chernobyl’s design, which differed significantly from reactors operating in the United States, made it vulnerable to such a severe accident.
NRC Fact Sheets about Three Mile Island and Chernobyl Accidents are available at:
•http://www.nrc.gov/reading-rm/doc-collections/fact-sheets/3mile-isle.html
•http://www.nrc.gov/reading-rm/doc-collections/fact-sheets/chernobyl-bg.html.

Modeling Potential Reactor Accident Consequences | 17MODELING POTENTIAL REACTOR ACCIDENT CONSEQUENCES | 17
This chapter explains the basic information on operator actions that mitigate the effect of accidents by preventing core damage or preventing, delaying, or reducing release of radioactive materials.

18 | U.S. Nuclear Regulatory Commission
Defense-in-Depth Philosophy “Defense in depth” is NRC’s approach to designing and operating nuclear facilities to prevent and mitigate accidents that could release radioactive materials. The key is creating multiple independent and redundant layers of defense to compensate for potential human and mechanical failures so that no single layer, no matter how robust, is exclusively relied upon. Defense-in-depth includes the use of redundant and diverse key safety functions and emergency response measures. For further information, see Speech No. S-04-009, “The Very Best-Laid Plans (the NRC’s Defense-in Depth Philosophy).”
HOW CAN POTENTIAL ACCIDENTS BE MITIGATED?
In addition to the redundant and diverse physical systems designed to prevent accidents, NRC and plant owners understand the importance of having preplanned emergency measures in the unlikely event an accident occurs. NRC expects these emergency measures will mitigate accident consequences by preventing core damage or preventing, delaying, or reducing the release of radioactive material. NRC requires plant operators to maintain detailed emergency procedure plans for the entire range of possible accidents. These plans include the following:
Emergency operating procedures—These procedures list operator actions to mitigate possible nuclear power plant emergencies.
Severe accident management guidelines—These are operator guidelines to mitigate accidents that are more severe than what the facility was designed to handle.
Security-related (10 CFR 50.54(hh)) mitigation measures—These measures include plans and resources that nuclear plants put in place to meet additional NRC requirements following the terrorist attacks on September 11, 2001 to mitigate scenarios involving the loss of large areas of the plant due to fire or explosions.
WHAT ASSURANCE DOES NRC HAVE THAT THESE MITIGATING ACTIONS CAN WORK?
NRC requires its licensees to train and practice emergency operating procedures in simulators that replicate the plant control rooms at each site. NRC also requires that plant owners have developed severe accident management guidelines and implemented the security-related mitigation measures to ensure that they have proper equipment, procedures, and training. NRC inspectors observe these activities to ensure NRC regulations are met at each plant.
HOW ARE MITIGATING ACTIONS MODELED?
SOARCA is the first detailed analysis that quantifies the value of the security-related 10 CFR 50.54(hh) mitigating actions in responding to potential accident conditions. This equipment and procedures were intended to be used to maintain or restore safety functions under circumstances associated with loss of large areas of the plant due to explosions or fire. The NRC anticipates, however, that plant operators could use this equipment for other types of accidents.
Therefore, for each plant, two cases of each scenario are modeled.
Mitigated Case—In the first case, the SOARCA team modeled what would happen if the operators are fully successful in carrying out the mitigating actions. The project team accomplished this by holding tabletop exercises with senior reactor operators and emergency response personnel at Peach Bottom and Surry to determine what actions would be taken to mitigate each scenario analyzed including the time required to implement each action. Many of these actions are designed to help in the case of large fires and explosions but could potentially be used for the scenarios analyzed in SOARCA.

MODELING POTENTIAL REACTOR ACCIDENT CONSEQUENCES | 19
Unmitigated Case—To understand the value of 10 CFR 50.54(hh) mitigating actions and to provide a basis for comparing SOARCA results to past studies, the team also analyzed an “unmitigated case” for each scenario. These unmitigated cases assumed that the plant failed to implement 10 CFR 50.54(hh) measures and certain other actions that would prevent core damage. Although the earthquakes considered in the SOARCA scenarios exceed the plants’ designs, the more rugged engineered safety features are assumed to survive in both the unmitigated and mitigated cases. These actions respond to design-basis events too, for which operators have more specific procedures and frequent training. The unmitigated cases modeled the sequence of events that lead to fuel damage, release of radioactive materials, and offsite health consequences.
WHAT IS THE TIMING OF MITIGATING ACTIONS?
Detailed MELCOR modeling demonstrated that plant operators can have time during accident scenarios to perform the necessary emergency actions. Figure 3.1 compares the mitigated and unmitigated timelines for the Peach Bottom long-term station blackout scenario from the blackout until the release starts (for the unmitigated case).
Historical Perspective: How Have Mitigation Capabilities Improved Since 9/11?
In response to the terrorist attacks of September 11, 2001, NRC and operating reactor licensees worked together to develop improved mitigation methods for events that could disable large areas of a nuclear power plant. As a result, operating reactor licensees purchased equipment and developed procedures for each site to better mitigate such events. NRC codified the requirements for this additional mitigation in Title 10 CFR 50.54 (hh). These mitigation measures include the following for the two plants analyzed in SOARCA:
•Portable diesel-fuel powered pumps (pictured).
•Portable generators to provide electricity to power critical instrumentation and to open or close valves.
•Prestaged air bottles to open or close air-operated valves.
•Procedures for operating steam-turbine-driven pumps without power.
•Designated make-up water sources.
PRAs commonly include a human reliability analysis to represent the likelihood of operator actions. SOARCA evaluated human actions through tabletop exercises, walkdowns, simulator runs, and other inputs from licensee staff.

20 | U.S. Nuclear Regulatory Commission
0
4
5
13
20
Station blackout
Operators position, connect and start alternate electricity
Operators manually control the cooling water flow (by the 4th hour)
Operators align and start portable pumps
(from the 4th to the 10th hour)
Accident Mitigated - No Release
Station blackout
Backup batteries deplete
Reactor coolant flow stops
Lower head of reactor dries out
Lower head of reactor and containment failRelease of radioactive material starts
Mitigated Case Hours Unmitigated Case
Figure 3.1 Comparison of SOARCA Accident Progression Timing for Mitigated and Unmitigated Cases of Peach Bottom Long-Term Station Blackout.

Modeling Potential Reactor Accident Consequences | 21
Modeling Hypothetical Accidents at Nuclear Power Plants | 21
This chapter explains how the project modeled the release of radioactive material and what information is used in the calculations.
MODELING POTENTIAL REACTOR ACCIDENT CONSEQUENCES | 21

22 | U.S. Nuclear Regulatory Commission
The SOARCA models showed that mitigating actions can prevent core damage or reduce or delay a release of radioactive material. For the scenarios examined, the SOARCA team also modeled unmitigated cases that lead ultimately to a release to the environment. The MELCOR computer code models the behavior of radioactive materials to the point that they escape from containment.
WHAT RADIOACTIVE MATERIAL DOES SOARCA MODEL?
SOARCA took a detailed approach to considering radioactive substances, or radionuclides. In SOARCA, MELCOR calculations of reactor accident response are based on realistic estimates of decay heat generated by the radionuclides in the reactor core. MELCOR organizes the radionuclides by chemical similarity to track them as they are released from the reactor core and move through piping, the containment building, and other buildings on their way to the environment. The offsite consequences computer code (MACCS2) tracks radionuclides based on how long they remain radioactive, their biological importance, and how much is expected to be released from the core.
How Does Containment Work? As part of the defense-in-depth philosophy, NRC requires all currently operating reactors to have three physical barriers that protect the public and environment from potential releases of radioactive material:
Containment Building—enclosure around a nuclear reactor to confine radioactive material that otherwise might be released to the atmosphere in the event of an accident.
Reactor Vessel— metal enclosure that holds the reactor core and the cooling water.
Fuel Rods—long, slender tubes that hold uranium fuel for nuclear reactor use. Fuel rods are assembled into bundles that are loaded individually into the reactor core (see image below).
Note: Typical large dry containment shown. Surry has a large dry, containment where the interior pressure is kept lower than atmospheric pressure. Surry’s containment is expected to perform similarly during a severe reactor accident.
Diagram of components of a reactor fuel assembly

MODELING POTENTIAL REACTOR ACCIDENT CONSEQUENCES | 23
Cesium and Iodine—These two radionuclide groups affect offsite consequence analysis because they are released as part of an accident, and the human body can get significant radiation doses from them.
Other radionuclides—MELCOR and MACCS2 also consider other radiological inventory in the analysis, and consequence results in NUREG-1935 include health effects from the radionuclides released in the accident.
WHAT INFORMATION IS INCLUDED IN MELCOR MODELING?
How physical and chemical processes influence the behavior of radioactive material while the core heats up.
How the accident’s extremely high temperatures influence particles’ behavior at the molecular level and their physical states (e.g., turning them into gas or small particles that can settle or move through the air).
How the radioactive material moves within the containment and reactor coolant system (before exiting containment).
How engineered safety systems (such as water sprays and air fan coolers) impact the behavior of radioactive material to prevent their release.
If and at what rate the accident releases radioactive material into the environment.
HOW ARE RADIOACTIVE MATERIALS MODELED TO ESCAPE FROM CONTAINMENT?
The following sections describe the timing of radioactive material movement while onsite and its release to the environment. Figure 4.1 shows how much of the reactor core’s available radioactive iodine (I-131) and cesium (Cs-137) is released to the environment during the first 48 hours of the accident.
Peach Bottom Scenarios (Unmitigated Cases)
Long-Term Station Blackout— 20 hours after the scenario begins, molten core material penetrates the bottom head of the reactor vessel, pours onto the containment floor, spreads across the floor, and contacts the steel containment shell, melting a hole through it.
Short-Term Station Blackout— About 8 hours after the scenario begins, molten core material penetrates the bottom head of the reactor vessel, pours onto the containment floor, spreads across the floor, and contacts the steel containment shell, melting a hole through it.
For the two analyzed Peach Bottom station blackout events, while the core is in the reactor vessel, radioactive material moves from the core into the bottom of the suppression pool as relief valves send steam into the suppression pool. Some material deposits on reactor vessel and pipe surfaces on its way to the suppression pool; the rest is retained in the suppression pool as the steam is condensed in the pool.
Surry Scenarios (Unmitigated Cases)
Long-Term Station Blackout— About 45 hours after the scenario begins, the pressure in the containment building exceeds the building’s limits, tearing the containment liner and cracking the reinforced concrete.

24 | U.S. Nuclear Regulatory Commission
Short-Term Station Blackout— About 25 hours after the scenario begins, the pressure in the containment building exceeds the building’s limits, tearing the containment liner and cracking the reinforced concrete.
For the two analyzed Surry station blackout events, while the fuel is overheating, radioactive material enters the containment building through ruptured reactor coolant system piping. Some material deposits on the inside surfaces of the reactor coolant system as it moves to the containment building. The remaining contained material deposits in the containment building.
Figure 4.1 Percentages of Iodine and Cesium Released to the Environment During the First 48 Hours of the Accident for SOARCA Unmitigated Scenarios, 1982 Siting Study (SST1), and Historical Accidents.
This figure compares how much iodine-131 and cesium-137 that are normally in the reactor core gets released in each accident scenario. The SOARCA unmitigated releases are much smaller than estimated in the earlier 1982 Siting Study Siting Source Term 1 (SST1) case. Also note that these releases can begin as early as 3.5 hours (for Surry ISLOCA) to as late as 45 hours (for Surry LTSBO), and some of these releases develop over a period of time. For comparison, releases from the Chernobyl and Three Mile Island accidents are included.
* Chernobyl release data is estimated at 20-40 percent for cesium-137 and 50-60 percent for iodine-131. Three Mile Island released an extremely small quantity of iodine-131 (~ 15 curies) and zero cesium-137.
100%
90%
80%
70%
60%
50%
40%
30%
20%
10%
Cesium Iodine
Peach BottomSTSBO
(Unmitigated)
Chernobyl* Three Mile
Island*
Peach Bottom LTSBO
(Unmitigated)
SurryLTSBO
(Unmitigated)
SurrySTSBO
(Unmitigated)
Surry TISGTR (Unmitigated)
SurryISLOCA
(Unmitigated)
1982 Siting Study (SST1)
MODELING POTENTIAL REACTOR ACCIDENT CONSEQUENCES | 25
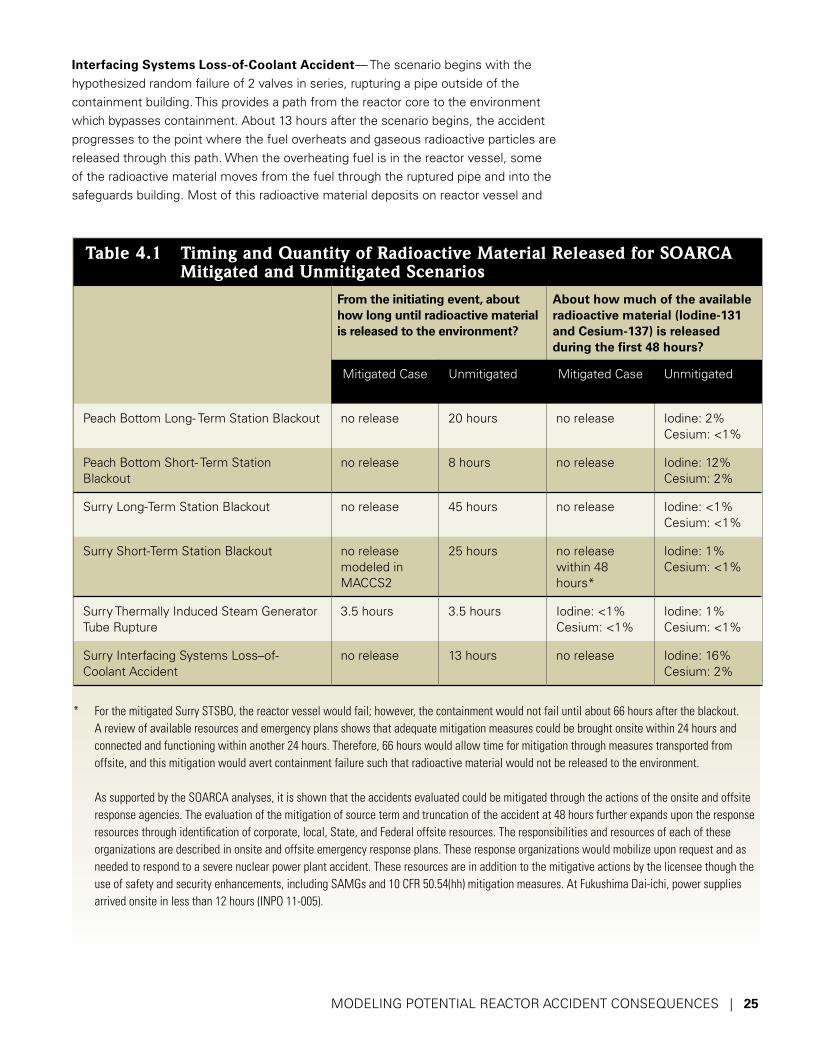
Interfacing Systems Loss-of-Coolant Accident— The scenario begins with the hypothesized random failure of 2 valves in series, rupturing a pipe outside of the containment building. This provides a path from the reactor core to the environment which bypasses containment. About 13 hours after the scenario begins, the accident progresses to the point where the fuel overheats and gaseous radioactive particles are released through this path. When the overheating fuel is in the reactor vessel, some of the radioactive material moves from the fuel through the ruptured pipe and into the safeguards building. Most of this radioactive material deposits on reactor vessel and
Table 4.1 Timing and Quantity of Radioactive Material Released for SOARCA Mitigated and Unmitigated Scenarios
From the initiating event, about how long until radioactive material is released to the environment?
About how much of the available radioactive material (Iodine-131 and Cesium-137) is released during the first 48 hours?
Mitigated Case Unmitigated Case
Mitigated Case Unmitigated Case
Peach Bottom Long- Term Station Blackout no release 20 hours no release Iodine: 2% Cesium: <1%
Peach Bottom Short- Term Station Blackout
no release 8 hours no release Iodine: 12% Cesium: 2%
Surry Long-Term Station Blackout no release 45 hours no release Iodine: <1% Cesium: <1%
Surry Short-Term Station Blackout no release modeled in MACCS2
25 hours no release within 48 hours*
Iodine: 1% Cesium: <1%
Surry Thermally Induced Steam Generator Tube Rupture
3.5 hours 3.5 hours Iodine: <1% Cesium: <1%
Iodine: 1% Cesium: <1%
Surry Interfacing Systems Loss–of- Coolant Accident
no release 13 hours no release Iodine: 16% Cesium: 2%
* For the mitigated Surry STSBO, the reactor vessel would fail; however, the containment would not fail until about 66 hours after the blackout. A review of available resources and emergency plans shows that adequate mitigation measures could be brought onsite within 24 hours and connected and functioning within another 24 hours. Therefore, 66 hours would allow time for mitigation through measures transported from offsite, and this mitigation would avert containment failure such that radioactive material would not be released to the environment. As supported by the SOARCA analyses, it is shown that the accidents evaluated could be mitigated through the actions of the onsite and offsite response agencies. The evaluation of the mitigation of source term and truncation of the accident at 48 hours further expands upon the response resources through identification of corporate, local, State, and Federal offsite resources. The responsibilities and resources of each of these organizations are described in onsite and offsite emergency response plans. These response organizations would mobilize upon request and as needed to respond to a severe nuclear power plant accident. These resources are in addition to the mitigative actions by the licensee though the use of safety and security enhancements, including SAMGs and 10 CFR 50.54(hh) mitigation measures. At Fukushima Dai-ichi, power supplies arrived onsite in less than 12 hours (INPO 11-005).
26 | U.S. Nuclear Regulatory Commission
pipe surfaces and safeguards building (next to containment) filters, with a fraction of it entering the environment.
Short-Term Station Blackout with Thermally Induced Steam Generator Tube Rupture— About 3.5 hours after the scenario begins, high-pressure, high-temperature gas circulating through the reactor coolant system ruptures a steam generator tube, a steam generator safety relief valve is opened, allowing gaseous radioactive particles to flow out of the broken tube bypassing the containment building. This rupture creates about a 1-inch diameter hole. Minutes later, a reactor coolant system pipe also ruptures—creating about a 2-foot diameter hole. In the period of time between the two ruptures, much of the radioactive material deposits in the failed steam generator, and this settling helps prevent much of it from flowing out into the environment. After the pipe rupture, the radioactive material primarily flows into and deposits in the containment.

Modeling Hypothetical Accidents at Nuclear Power Plants | 27
This chapter explains emergency planning and how emergency response was modeled.
MODELING POTENTIAL REACTOR ACCIDENT CONSEQUENCES | 27

28 | U.S. Nuclear Regulatory Commission
Table 5.1 Evacuation Groups
Schools School populations within 10 miles of the site
General Public People within 10 miles of the site who evacuate in response to the evacuation order
Special Facilities
Special-needs population, including residents of hospitals, nursing homes, assisted living communities, and prisons within 10 miles of the site
Nonevacuating Public
A portion of the public within 10 miles of the site who refuse to evacuate (assumed to be 0.5 percent of the population)
Shadow Shadow evacuation occurs when members of the public evacuate from areas that are not under official evacuation orders, typically beginning when a large- scale evacuation is ordered
Tail The last 10 percent of the public to evacuate from the 10-mile EPZ
For scenarios leading to core damage and subsequent release of radioactive materials to the environment, the local public may be evacuated and/or sheltered. SOARCA models tracked the dispersion of radioactive material and analyzed the effect of carrying out emergency response for these scenarios. This chapter provides more information about how the SOARCA project modeled emergency plans during a severe accident. In all scenarios except one, the releases’ delayed timing (even without mitigative actions) allowed time to evacuate the local population. In that one scenario, evacuation began at the time of radiation release. However, the calculated individual long-term cancer fatality risk within 10 miles of the plant is similar to the other scenarios analyzed because of the lower probability of core damage due to this scenario.
WHAT IS EMERGENCY PLANNING?
NRC requires nuclear power plants to have onsite and offsite emergency plans as a defense-in-depth measure. NRC evaluates the plants’ emergency planning to ensure they can execute their plans and coordinate State and Federal responses. Emergency plans focus on protecting public health and safety with the following objectives:
Onsite Objective—Stop the accident. NRC requires the utilities to have onsite response that includes technical, maintenance, and management staff that can respond within an hour of the accident’s start. Each year, the licensees train and drill this capability, and NRC inspects it.
Offsite Objective—Protect the local population through implementation of protective actions that include evacuating and sheltering. NRC requires utilities to have offsite response support from local and State agencies. The Federal Emergency Management Agency inspects this capability every 2 years. Emergency planning zones (EPZs) help define where detailed protective strategies would be used during an emergency. Every plant must have NRC-approved emergency action levels that dictate declaring an emergency well before a severe accident could cause a core melt or radiation release. This timing is designed to ensure that emergency plans are implemented before the plant is in a serious state and that members of the public are well on their way to evacuation before any release begins.

MODELING POTENTIAL REACTOR ACCIDENT CONSEQUENCES | 29
What Are Emergency Planning Zones (EPZs)?Two EPZs around each nuclear power plant help define what protective action strategies will be used during an emergency. Predetermined protective action plans are in place for the EPZs to avoid or reduce dose from potential exposure of radioactive materials. Utilities base the size and shape of their EPZs on site-specific conditions, unique geographical features of the area, and demographic information. The detailed planning for the EPZs enables emergency responders to extend actions beyond the EPZ if conditions warrant.
Plume Exposure Pathway EPZ—The plume exposure pathway EPZ has a radius of about 10 miles from the reactor site. The actions for this EPZ can include sheltering, evacuating, and taking potassium iodide pills to protect people who inhale or ingest airborne radioactive iodine.
Ingestion Exposure Pathway EPZ—The ingestion exposure pathway EPZ has a radius of about 50 miles from the reactor site. The actions for this EPZ can include a ban of contaminated food and water to protect people from radioactive material in the food chain. Ingestion of contaminated food and water is not treated in the SOARCA
analyses because adequate supplies of food and water are available in the United States and can be distributed to areas affected by a reactor accident.
What Are NRC Regulations?Emergency Plans
The planning standards of 10 CFR 50.47, “Emergency Plans,” require nuclear plant licensees to develop comprehensive emergency response plans that include the support of State and local response organizations. Licensees must establish procedures to immediately notify offsite authorities of an emergency and establish warning systems to provide early notification and clear instruction to the public. Licensees must demonstrate to NRC that protective measures can and will be implemented in the event of a radiological emergency. For details, see http://www.nrc.gov/reading-rm/doc-collections/cfr/part050/part050-0047.html.
18
19
20
2118 9
10
11
12
13
14
23
18
24
16
17
18
6
4
3
2
18
7
WHAT INFORMATION IS INCLUDED IN EMERGENCY PLAN MODELING?
The SOARCA team modeled the specific emergency plans for each site using detailed information that included the following:
� Population based on data from the 2000 U.S. Census and projected to 20052.
� Evacuation time estimates from emergency plans.
� Plans to relocate populations from contaminated areas.
Using each site’s emergency plan information, the SOARCA team organized the population into several groups and modeled each group’s evacuation timing along with the timing of the accident. Table 5.1 provides a description of some of the groups. Other population groups modeled include people who leave on their own initiative prior to the evacuation order as well as people who do not evacuate.
WHAT DOES MODELING DEMONSTRATE ABOUT EMERGENCY PLANNING?
The MACCS2 computer code calculates the radiation dose to the public based on evacuating, sheltering, and returning to the area after the event. Figure 5.1 illustrates the modeled timing of the unmitigated Peach Bottom LTSBO scenario and the timing of emergency response. Because the analyzed accident scenarios take several hours to start releasing radioactive material to the environment, this provides time for the population to evacuate before potential radiation exposure. The analysis considered seismic impacts on emergency response (e.g., loss of bridges, traffic signals, and delayed notification).
2 2010 U.S. Census data was not used because most calculations were already completed by the time it was released. Changes in population over the last decade are not expected to have a significant impact on any of the reported individual cancer fatality risks.

30 | U.S. Nuclear Regulatory Commission
NRC Staff during an emergency preparedness drill
However, the MACCS2 modeling showed that seismic impacts for these two sites did not impact risk calculations because seismic impacts only affect the immediate phase of the accident when people are sheltering or evacuating. SOARCA’s risk calculations are dominated instead by long-term exposure of the population after they return home when told it is safe to do so.
Figure 5.1 shows that groups are sheltered and evacuated before radioactive release begins. The timeline notes key accident progression and emergency response events. In each analyzed scenario, the plants follow their stated emergency response plans and promptly notify offsite authorities who activate their emergency notification systems (sirens) and direct the public to evacuate.
Station Blackout (0:00)
Release of radioactive materials to the environment
starts (assuming accident proceeds unmitigated)
(20:00)
Plant declares site area
emergency (0:15)
Sirens sounded for general emergency (1:30)
Plant declares general emergency (0:45)
Sirens sounded for site area emergency (1:00)
Evacuation complete for EPZ population (including schools, general public, special facilities, and tail and excluding those who choose not to evacuate) (7:00)
0 2 4 6 8 10 12 14 16 18 20
Figure 5.1 Evacuation Timing for Peach Bottom Unmitigated Long-Term Station Blackout (hours).
Modeling Hypothetical Accidents at Nuclear Power Plants | 31
This chapter describes the models to calculate health consequences for SOARCA scenarios that release radioactive materials to the environment.
MODELING POTENTIAL REACTOR ACCIDENT CONSEQUENCES | 31

32 | U.S. Nuclear Regulatory Commission
The team modeled the unmitigated scenarios’ calculated releases and subsequent health consequences. Even in the unmitigated scenarios, modeling indicated that essentially no one would die from acute radiation exposure (due to the length of time for the accident to progress and the relatively small releases) and that there would be a very small possibility of long-term cancer fatalities. This chapter provides an explanation and background information about how SOARCA modeled the health consequences.
HOW ARE HEALTH CONSEQUENCES REPORTED IN SOARCA?
Exposure to radiation can have a variety of different health effects depending on the specific type and intensity of exposure. In addition, radiation affects different people in different ways. Large, high-intensity exposures can cause acute health effects that range from nausea and skin reddening to death. In addition to acute health effects, radiation exposures are related to the occurrence of cancer later in life. The two types of health consequences reported in SOARCA are early fatalities from very large and intense exposures and fatalities that result from radiation-induced cancers.
Early Fatality Risk—Individual deaths that occur shortly (usually within a few weeks or months) after exposure to large doses of radiation. The report provides this number as the average individual risk of an early fatality. For scenarios analyzed, the early fatality risk is essentially zero.
Long-Term Cancer Fatality Risk—Cancer fatalities that occur years after exposure to radiation. This number
represents the average individual risk of dying from cancer due to radiation exposure following the specific hypothesized severe accident scenario. For the scenarios analyzed, long-term cancer fatality risk is very small.
How Is Radiation Measured?Units that measure how much radioactive material decays over a period of time:
•Curie (Ci)
•Becquerel (Bq): 1 Bq = 2.7 x 10⁻¹¹ Ci
Units that measure the effects of ionizing radiation on humans:
• rem
• Sievert (Sv): 1 Sv = 100 rem
More information about radiation and its health effects is at http://www.nrc.gov/about-nrc/radiation/rad-health-effects.html.
A Geiger counter is a tool that measures radiation in the environment.

MODELING POTENTIAL REACTOR ACCIDENT CONSEQUENCES | 33
HOW ARE LONG-TERM CANCER FATALITY RISKS MODELED?
Modeling long-term cancer fatality risk is controversial because medical researchers disagree on the evidence that describes the adverse effects of low radiation doses. The SOARCA project used two long-term cancer fatality risk models to provide additional information on the effects of different modeling approaches on the potential range of health consequences:
Linear-no-threshold dose response model—This model is based on the conclusion that any amount of radiation dose (no matter how small) can incrementally increase cancer risk. It is a basic assumption used in many regulatory limits, including NRC’s regulations and past assessments.*
Truncation dose response model—To provide additional information on the potential range of health consequences, the SOARCA project calculated long-term cancer fatality risk assuming the linear-no-threshold model and a range of truncation or cutoff doses below which the cancer risk is not quantified. When comparing offsite consequence results for the linear-no-threshold model and truncation model, these truncation values make the already small long-term cancer fatality risk values even smaller (by orders of magnitude in some cases).
SOARCA uses two dose truncation values:
620 mrem per year—This represents the U.S. average individual background dose including medical exposures.
5 rem (5,000 mrem) per year with a 10 rem lifetime cap—This value was chosen based on the Health Physics Society position statement in “Radiation Risk in Perspective” (July 2010).
* Use of the linear no-threshold model for low radiation exposures (below 0.1 sievert or 10 rem) to project future long-term cancer fatality risk to individuals receiving such exposures is currently being debated within the scientific community. Many radiation protection organizations, such as the U.S. National Council on Radiation Protection and Measurements, the International Commission on Radiological Protection, the United Nations Scientific Committee on Exposure to Atomic Radiation, and the U.S. Health Physics Society, caution that there is considerable uncertainty when computing cancer deaths resulting from small additional exposures to large populations over many years and should only be done under explicit conditions such as in the SOARCA project or not at all.
As a resident of the United States, how am I exposed to radiation?SOARCA studies health effects in situations where a severe accident releases radiation to the public. To provide some perspective, people generally receive an average total dose of ionizing radiation of about 620 millirem per year. Of this total, the chart shows that natural sources of radiation account for about 50 percent and manmade sources account for the other 50 percent.
Sources of Radiation Exposure in the United States
Natural Sources - 50%~310 millirem (0.31 rem)
Source: NCRP Report No.160(2009) Full report is available on the NCRP Web site at www.NCRPpublications.org.
Industrial andOccupational - .1%
Consumer Products - 2%
Nuclear Medicine - 12%
Internal - 5%
Terrestrial (Soil) - 3%Cosmic (Space) - 5%
Manmade Sources - 50%~310 millirem (0.31 rem)
Radon andThoron - 37%
MedicalProcedures -36%

34 | U.S. Nuclear Regulatory Commission
The MACCS2 code looks at atmospheric transport of radioactive material using a cloud, or plume, that travels in a straight line following the wind direction. This model of short-term and long-term dose accumulation includes several pathways: radiation from the plume (cloudshine), radiation from material that reaches the ground (groundshine); inhalation, deposition onto the skin, and food and water ingestion. The ingestion pathway was not used in the analyses reported here because uncontaminated food and water supplies are abundant within the United States, and it is unlikely that the public would eat radioactively contaminated food. The following dose pathways are included in the reported risk metrics:
� Cloudshine during plume passage
� Groundshine during the emergency and long-term phases from deposited aerosols.
� Inhalation during plume passage and following plume passage from radioactive dust kicked up by weather or human and vehicle traffic. This dust factor covers both the emergency and long-term phases.
Figure 6.1 Transport Pathways of Radioactive Materials.

MODELING POTENTIAL REACTOR ACCIDENT CONSEQUENCES | 35
WHAT INFORMATION IS INCLUDED IN THE MACCS2 MODELING? � When and at what rate the accident releases radioactive material into the environment (from MELCOR analysis described in Chapter 4).
� Protective measures (such as evacuation) taken by the offsite population (from the modeling of emergency plans described in Chapter 5).
� Site-specific weather data.
� Downwind transport of the radioactive material released into the environment.
� How each type of radionuclide will impact the body.
� Radiation exposure of the offsite population and the health effects caused by this exposure.
Figure 6.2 Information Used to Model Health Effects in SOARCA
Model Airborne and Deposited Concentrations
Report Health Effects• Long-term cancer fatalities
Health Effects From Chronic Exposure
Model Habitability CriteriaInformation that includes:• Cost-based decision to
decontaminate, interdict, condemn
Model Late DosesInformation that includes:• Radionuclide type• Exposure pathway• Target organs
Report Health Effects• Early fatalities • Long-term cancer fatalities
Health Effects From Early Exposure
Model People BehaviorInformation that includes:• Population • Emergency Response
Model Early DosesInformation that includes:• Type of radionuclide• Exposure pathway• Target organs
Release of Radioactive Material into Environment
Atmospheric Transport and Dispersion
Information that includes:• Type of radioactive material released• Amount of radioactive material released• Timing of the release
Information that includes:• Site-specific weather data

36 | U.S. Nuclear Regulatory Commission
HOW ARE RADIOACTIVE MATERIALS MODELED TO MOVE DOWNWIND AND AFFECT THE POPULATION?
Radioactive materials are released from plant buildings as aerosol particles in a plume of steam and other gases. MACCS2 uses site-specific weather data to calculate the downwind concentration of radioactive material in the plume and the resulting population exposures and health effects. MACCS2 then applies a statistical model to calculate the average individual fatality risk as a result of the variability in the weather.
SOARCA modeled individual radiation exposure from inhaling the aerosol particles and by direct radiation from aerosol particles in the air and on the ground. A small portion of this exposure occurs during the early phase of the accident when the aerosol particles are being released from the plant buildings and while people are evacuating. Most of this is long-term exposure after land is decontaminated and people are allowed to return home. SOARCA modeled evacuees returning home based on guidance that outlines when it would be safe to do so. For the Surry model, SOARCA uses the U.S. Environmental Protection Agency’s “Manual of Protective Action Guides for Nuclear Incidents” to determine when the population can return to an area. For the Peach Bottom model, SOARCA uses Pennsylvania-specific criteria. This calculation also includes doses to the population in lightly contaminated areas where they were neither evacuated nor relocated. SOARCA did not model people who were exposed by eating food contaminated by aerosol particles because emergency plans will prevent distribution of contaminated food and because of the expected availability of uncontaminated food from other areas.
Modeling Hypothetical Accidents at Nuclear Power Plants | 37
This chapter summarizes the results and conclusions from the SOARCA research project.
MODELING POTENTIAL REACTOR ACCIDENT CONSEQUENCES | 37

38 | U.S. Nuclear Regulatory Commission
The SOARCA results demonstrate the potential benefits of the mitigation measures analyzed in this project. SOARCA shows that successful mitigation either prevents core damage or prevents, delays, or reduces offsite health consequences. In addition, the SOARCA team ran scenarios that demonstrate the consequences if certain mitigation measures are not successful. The unmitigated scenario results presented in this chapter demonstrate that, even in these cases, the public health consequences are very low.
WHAT ARE THE RESULTS OF THE MITIGATED SCENARIOS?
All mitigated cases of SOARCA scenarios, except for one, result in prevention of core damage and/or no offsite release of radioactive material. The only mitigated case still leading to an offsite release was the Surry thermally induced steam generator tube rupture. In this case, mitigation is still beneficial in that it keeps most radioactive material inside containment and delays the onset of containment failure by about 2 days.
Early Fatality Risk—As a result, the mitigated scenarios show zero risk of early fatalities from radiation exposure.
Long-Term Cancer Fatality Risk—As a result, the mitigated scenarios result in either zero risk or very small risk of long-term cancer fatalities, depending on the specific scenario.
HOW WOULD OPERATOR ACTIONS MITIGATE ACCIDENTS?
The operators mitigate the station blackout and thermally induced steam generator tube rupture (TISGTR) accidents by manually controlling pumps to inject water to keep the reactor core covered and cooled. The reactor’s steam-turbine-driven safety injection pumps would be used in conjunction with portable diesel generators (stored onsite) to provide instrument readings. The operators mitigate the interfacing systems loss-of-coolant accident (ISLOCA) scenario by using normal plant equipment and procedures to ensure sufficient flow of water through the reactor coolant system to keep the core cooled.
WHAT ARE THE RESULTS OF UNMITIGATED SCENARIOS?
Early Fatality Risk—The unmitigated scenarios result in essentially zero risk of early fatalities. Although these unmitigated scenarios result in core damage and release of radioactive material to the environment, the release is delayed, which allows the population to take protective actions (including evacuation and sheltering). Therefore, the public would not be exposed to dangerous amounts of radioactive material.
Long-Term Cancer Fatality Risk—For the unmitigated scenarios, the individual risk of a long-term cancer fatality is calculated to be very small—regardless of which distance interval (e.g., 0-10 miles, 0-20 miles, ... 0-50 miles) or low-dose calculation model is used. Table 7.1 summarizes the results based on the linear-no-threshold dose response model for estimating the risk for individuals located within 10 miles of each plant.

MODELING POTENTIAL REACTOR ACCIDENT CONSEQUENCES | 39
WHAT DO SOARCA RESULTS INDICATE ABOUT CONSEQUENCES OF SEVERE ACCIDENTS?
The SOARCA results for the two plants analyzed are as follows. These results, while specific to Peach Bottom and Surry, may be generally applicable to plants with similar designs. Additional work would be needed to confirm this, however, since differences exist in plant-specific designs, procedures, and emergency response characteristics.
� When operators are successful in using available on-site equipment during the accidents analyzed in SOARCA, they can prevent reactor fuel from melting, or delay or reduce releases of radioactive material to the environment.
� SOARCA analyses indicate that all modeled accident scenarios, even if operators are unsuccessful in stopping the accident, progress more slowly and release much smaller amounts of radioactive material than calculated in earlier studies.
� As a result, public health consequences from severe nuclear power plant accidents modeled in SOARCA are smaller than previously calculated.
� The delayed releases calculated provide more time for emergency response actions such as evacuating and sheltering for affected populations. For the scenarios analyzed, SOARCA shows that emergency response programs, if implemented as planned and practiced, reduce the risk of public health consequences.
Table 7.1 SOARCA Results: Mitigated and Unmitigated Cases
About how likely is the accident to occur?
About what is the annual average risk* of a long-term cancer fatality for this scenario for an individual located within 10 miles of the plant?
Mitigated Case Unmitigated Case
Peach Bottom LTSBO 1 event in 300,000 reactor years
zero 1 in 3 billion
Peach Bottom STSBO 1 event in 3 million reactor years
zero 1 in 20 billion
Surry LTSBO 1 event in 50,000 reactor years
zero 1 in 1 billion
Surry STSBO 1 event in 500,000 reactor years
zero** 1 in 10 billion
Surry TISGTR 1 event in 3 million reactor years
1 in 10 billion 1 in 10 billion
Surry ISLOCA 1 event in 30 million reactor years
zero 1 in 100 billion
* Estimated risks below 1 in 10 million reactor years should be viewed with caution because of the potential impact of events not studied in the analyses and the inherent uncertainty in very small calculated numbers. ** For the mitigated Surry STSBO, the reactor vessel would fail; however, the containment would not fail until about 66 hours after the blackout. A review of available resources and emergency plans shows that adequate mitigation measures could be brought onsite within 24 hours and connected and functioning within 48 hours. Therefore, 66 hours would allow time for mitigation via equipment brought to the site from offsite, and this mitigation would avert containment failure such that radioactive material would not be released to the environment.

40 | U.S. Nuclear Regulatory Commission
Figure 7.1 Scenario-specific Risk of Dying From Long-Term Cancer for an Individual within 10 Miles of the Plant (per reactor-year).
� Both mitigated (operator actions are successful) and unmitigated (operator actions are unsuccessful) cases of all modeled severe accident scenarios in SOARCA cause essentially no risk of death during or shortly after the accident.
� SOARCA’s calculated longer term cancer fatality risks for the accident scenarios analyzed are millions of times lower than the general U.S. cancer fatality risk.
Figure 7.1 compares SOARCA’s scenario-specific latent cancer fatality risks for an individual within 10 miles of the plant to the NRC Safety Goal and to an extrapolation of the 1982 Siting Study SST1 results.
* The 1982 Siting Study did not calculate risk of long-term cancer deaths. Therefore, to compare the 1982 Siting Study (SST1) results to SOARCA’s results for risk of long-term cancer death, the SST1 release was put into the MACCS2 code files for Peach Bottom and Surry unmitigated STSBO calculations.
Figure 7.1 Scenario-specific Risk of Dying From Long-Term Cancer for anIndividual within 10 Miles of the Plant (Per Reactor-Year).
PEACH BOTTOM SURRY
SOARCA unmitigated scenario
SOARCA mitigated scenario
1982 Siting Study (SST1)*
Peach BottomSTSBO
Peach Bottom LTSBO
SurryLTSBO
SurrySTSBO
Surry TISGTR
SurryISLOCA
1982 Siting Study (SST1)
1982 Siting Study (SST1)
LTSBO
1 in 100 thousand
1 in 1 million
1 in 10 million
1 in 100 million
1 in 1 billion
1 in 10 billion
1 in 100 billion
1 in 1 trillion
NRC SAFETY GOAL FOR LONG-TERM CANCER FATALITIES = 2 in 1 million
SOARCA unmitigated scenario
SOARCA mitigated scenario
1982 Siting Study (SST1)*

MODELING POTENTIAL REACTOR ACCIDENT CONSEQUENCES | 41
HOW DO SOARCA RESULTS COMPARE TO PAST STUDIES?
The SOARCA offsite consequence calculations are generally smaller than reported in earlier studies. To provide perspective between SOARCA results and the more conservative estimates of severe reactor accident outcomes found in earlier NRC publications, SOARCA results are compared to the results of one of these previous publications: NUREG/CR-2239, “Technical Guidance for Siting Criteria Development,” commonly referred to as the 1982 Siting Study. For example, the 1982 Siting Study calculated 92 early fatalities for Peach Bottom and 45 early fatalities for Surry for the siting source term 1(SST1) release of radioactive material. In contrast, SOARCA calculated essentially zero early fatalities for both sites. The exact basis for long-term cancer fatality results in the 1982 Siting Study could not be recovered. The 1982 Siting Study’s computer code (CRAC2) is no longer available and some of the models and modeling choices used in that study could not be reconstructed. Therefore, the SOARCA team compared SOARCA results with the 1982 Siting Study results by replacing the SOARCA source term with the larger source term (SST1) assumed in the 1982 Siting Study. Figure 7.1 shows this comparison for individuals within 10 miles of the plant. The long-term cancer fatality calculations based on the 1982 Siting Study SST1 source term are higher than the long-term cancer fatality calculations for SOARCA scenarios, however the difference diminishes when considering larger areas out to a distance of 50 miles from the plant because in both studies, large populations are assumed to be exposed to small annual doses from returning home after the accident.
HOW DO SOARCA RESULTS COMPARE TO THE NRC SAFETY GOAL AND OVERALL U.S. CANCER RISKS?
To gain perspective, it can be helpful to compare the SOARCA results with the NRC Safety Goal and the average annual risk of a cancer fatality in the United States. The NRC’s Safety Goal states that cancer fatality risk to the population near an operating nuclear power plant should not exceed one-tenth of one percent (0.1 percent) of the sum of cancer fatality risks resulting from all causes. According to the American Cancer Society, 1 in 553 people died of cancer in the United States in 2006. One-tenth of one percent of this number equals about 1 death per 553,000 people. The NRC Safety Goal for long-term cancer fatality risk from nuclear power plant operation (i.e., 2 in 1 million) is set at 1,000 times lower than the sum of cancer fatality risks resulting from all other causes (i.e., ~ 2 in 1,000) per year. As shown in Table 7.1, SOARCA’s calculated cancer fatality risks for the postulated events in this study range from about 1 in 1 billion per year to 1 in 100 billion per year.
The calculated cancer fatality risks from the scenarios analyzed in SOARCA are thousands of times lower than the NRC Safety Goal and millions of times lower than the general U.S. cancer fatality risk.
WHAT ARE THE LIMITATIONS OF COMPARING SOARCA RESULTS TO THE NRC SAFETY GOAL AND OVERALL U.S. CANCER RISKS?
Comparisons of SOARCA’s calculated long-term cancer fatality risks to the NRC Safety Goal and the average annual U.S. cancer fatality risk from all causes are provided to give context that may help the reader to understand the contribution to cancer risks from these nuclear power plant accident scenarios. However, such comparisons have limitations for which the readers should be aware. Relative to the safety goal

42 | U.S. Nuclear Regulatory Commission
comparison, the safety goal is intended to encompass all accident scenarios. SOARCA does not examine all scenarios typically considered in PRA, even though it includes the important scenarios. In fact, any analytical technique, including PRA, will have inherent limitations of scope and method. As a result, comparison of SOARCA’s scenario-specific calculated long-term cancer fatality risks to the NRC Safety Goal is necessarily incomplete. However, it is intended to show that adding multiple scenarios’ low risk results in the 1 in 1 billion to 1 in 100 billion range to approximate a summary risk from all scenarios, would yield a summary result that is also below the NRC Safety Goal of 2 in 1 million.
Relative to the U.S. average annual individual risk of a cancer fatality comparison, the sources of an individual’s cancer risk include a complex combination of age, genetics, lifestyle choices, and other environmental factors whereas the consequences from a severe accident at a nuclear plant are involuntary and unlikely to be experienced by most individuals.
Modeling Hypothetical Accidents at Nuclear Power Plants | 43
MODELING POTENTIAL REACTOR ACCIDENT CONSEQUENCES | 43

44 | U.S. Nuclear Regulatory Commission
GLOSSARY
Acute health effects—Health effects which occur within two months of exposure
Advisory Committee on Reactor Safeguards (ACRS)—The ACRS is an independent review committee that advises the Commission, independent of the NRC technical staff, regarding the licensing and operation of reactor facilities and related safety issues, the adequacy of proposed reactor safety standards, technical and policy issues related to the licensing of new reactor designs, and other matters referred to it by the Commission.
Boiling-Water Reactor—In a commercial boiling-water reactor, the reactor core creates heat and a single loop both delivers steam to the turbine generator and returns water to the reactor core to cool it. The cooling water is force-circulated by electrically powered pumps. Emergency cooling water is supplied by other pumps that can be powered by onsite diesel generators. Other safety systems, such as the containment building air coolers, also need electric power.
Containment Structure—An enclosure around a nuclear reactor to confine radioactive material that otherwise might be released to the atmosphere in the event of an accident. Pressurized-water reactor containments are usually cylindrical with a dome-shaped top and made of steel-reinforced concrete and a steel liner.
Coolant—A substance circulated through a nuclear reactor to remove or transfer heat. All commercial nuclear reactors in the United States use water.
Core Damage—Events that heat up the reactor core to the point at which fuel damage is anticipated or the drying out and heatup of the reactor core to the point at which prolonged oxidation and severe fuel damage lead to release of radioactive material from the fuel.
Core Damage Frequency—An expression of the likelihood that, given the way a reactor is designed and operated, an accident could cause the fuel in the reactor to heat up to the point at which it would be damaged and potentially melt.
Early Fatalities—Human deaths that occur shortly after exposure to radiation, usually within a few weeks or months.
Emergency Operating Procedures (EOPs)—Plant-specific procedures containing instructions for operating staff to implement preventive measures for managing accidents.
Emergency Planning Zones (EPZ)—The EPZs around each nuclear power plant help define what protective action strategies will be used during an emergency. Predetermined protective action plans are in place for each site and are designed to avoid or reduce dose from potential exposure of radioactive materials. Utilities base the size and shape of their EPZs on site-specific conditions, unique geographical features of the area, and demographic information. The plume exposure EPZ extends about 10 miles from the plant, and the ingestion EPZ extends about 50 miles from the plant.
Evacuation Time Estimate (ETE)—The estimated time to mobilize and evacuate the public from a defined area. The ETE considers residents of the EPZ, transients, people visiting but not living within the EPZ, and special facilities including schools.

MODELING POTENTIAL REACTOR ACCIDENT CONSEQUENCES | 45
Feedwater—Water supplied to the reactor pressure vessel (in a boiling-water reactor) or the steam generator (in a pressurized-water reactor) that removes heat from the reactor fuel rods by boiling and becoming steam. The steam becomes the driving force for the plant turbine generator.
Ingestion Pathway—The potential routes for radionuclides from various sources to enter water, the food chain, or get into a person’s mouth in day-to-day activities.
Long-Term Cancer Fatalities—Cancer fatalities that occur years after exposure to radiation.
MACCS2—A general-purpose computer code for estimating offsite impacts following release of radioactive material. MACCS2 is applicable to diverse reactor and nonreactor situations. It considers atmospheric transport and dispersion under time-variable weather conditions, short- and long-term mitigation actions, and exposure pathways to determine health effects and economic costs.
MELCOR—An integrated, engineering-level computer code used to model the progression of postulated accidents in light-water reactors as well as nonreactor systems (e.g., spent fuel pool and dry cask). MELCOR is a modular code consisting of three general types of packages: (1) basic physical phenomena, (2) reactor-specific phenomena, and (3) support functions. These packages model the major systems of a nuclear power plant and their associated interactions.
Mitigating Actions—Actions performed by plant operators to prevent core damage and/or the release of radioactive material.
Pressurized-Water Reactor—In a commercial pressurized light-water reactor, (1) the reactor core creates heat, (2) pressurized water in the primary coolant loop carries the heat to the steam generator, and (3) the steam generator converts the water into steam in a secondary loop to drive the turbine generator to produce electricity.
Probabilistic Risk Assessment—A method to calculate risk by assessing both the probability of an event and its consequences. This procedure involves asking a series of three questions called the “risk triplet:” (1) What can go wrong? (2) How likely is it? (3) What would be the consequences?
Radiation—Energy that travels in the form of waves or high-speed particles. Alpha particles, beta particles, gamma rays, x-rays, neutrons, high-speed electrons, high-speed protons, and other particles capable of producing ions. Radiation, as used in 10 CFR Part 20 “Standards for Protection Against Radiation,” does not include nonionizing radiation such as radio waves or microwaves, or visible, infrared, or ultraviolet light (see also 10 CFR 20.1003, “Definitions”).
Reactor Core—The central portion of a nuclear reactor which contains the fuel assemblies, moderator, neutron poisons, control rods, and support structures. The reactor core is where fission takes place.
Reactor Fuel—Boiling-water reactors and pressurized-water reactors use ceramic pellets containing enriched uranium dioxide (UO2). These pellets are stacked and sealed inside long, slender, zirconium metal-based alloy (Zircaloy) tubes to form fuel rods. Fuel rods are assembled into bundles called fuel assemblies that are loaded into the reactor core.

46 | U.S. Nuclear Regulatory Commission
Reactor-Year—The operation of one nuclear reactor for 1 year.
Severe Accident— A severe accident may challenge safety systems beyond a nuclear power plant’s design limits, potentially damaging or degrading the reactor core and its containment buildings.
Severe Accident Management Guidelines (SAMGs)—Guidelines that plants voluntarily put in place in the late 1990s to contain or reduce the impact of accidents that damage a reactor core.
More term definitions are available online at the NRC Glossary at www.nrc.gov/reading-rm/basic-ref/glossary.html.
SELECTED REFERENCES
NUREG-1935: State-of-the-Art Reactor Consequence Analyses - Main Report.
NUREG/CR-7110, Volumes 1 and 2: State-of-the-Art Reactor Consequence Analyses – Peach Bottom Integrated Analyses and Surry Integrated Analyses.
NRC REFERENCES:
NRC Fact Sheets and Brochures http://www.nrc.gov/reading-rm/doc-collections/fact-sheets/
Backgrounder on Chernobyl Nuclear Power Plant Accident http://www.nrc.gov/reading-rm/doc-collections/fact-sheets/chernobyl-bg.html
Backgrounder on Three Mile Island Accident http://www.nrc.gov/reading-rm/doc-collections/fact-sheets/3mile-isle.html
NUREG/BR-0164, Rev. 5: NRC—Regulator of Nuclear Safety http://www.nrc.gov/reading-rm/doc-collections/nuregs/brochures/br0164/r5/
NUREG/BR-0175, Rev. 1: A Short History of Nuclear Regulation 1946-1999 http://www.nrc.gov/reading-rm/doc-collections/nuregs/brochures/br0175/
NUREG-1350, Vol. 23: Information Digest, 2011–2012. http://www.nrc.gov/reading-rm/doc-collections/nuregs/staff/sr1350/
REFERENCES FOR HISTORICAL ACCIDENTS:
Nuclear Emergency Response Headquarters – Government of Japan, “Report of the Japanese Government to the IAEA Ministerial Conference on Nuclear Safety – The Accident at TEPCO’s Fukushima Nuclear Power Stations,” IAEA Ministerial Conference on Nuclear Safety, Vienna, Austria, June 7, 2011.
Institute of Nuclear Power Operations, “Special Report on the Nuclear Accident at the Fukushima Dai-ichi Nuclear Power Station, “ INPO-11-005, Institute of Nuclear Power Operations, Atlanta, GA, November 2011.
Report of The President’s Commission on The Accident at Three Mile Island. October, 1979.
Rogovin, M. & Frampton, G. T. NUREG/CR-1250, Vols. III: Three Mile Island: A Report to the Commissioners and to the Public. 1980.
Walker, J. S. Three Mile Island: A Nuclear Crisis in Historical Perspective. University of

MODELING POTENTIAL REACTOR ACCIDENT CONSEQUENCES | 47
California Press: Berkeley, CA. 2004.
The Chernobyl Forum. Chernobyl’s Legacy: Health, Environmental and Socio-Economic Impacts and Recommendations to the Governments of Belarus, the Russian Federation and Ukraine. September 2005. http://www.iaea.org/http://www.iaea.org/
Organization for Economic Cooperation and Development (OECD) Nuclear Energy Agency, “Chernobyl: Assessment of Radiological and Health Impacts, 2002 Update of Chernobyl: 10 Years On.” http://www.oecd-nea.org/rp/chernobyl/
REFERENCES FOR HISTORICAL RISK AND CONSEQUENCE STUDIES:
WASH-1400 (NUREG-75/014): Reactor Safety Study. An Assessment of Accident Risks in U.S. Commercial Nuclear Power Plants. 1975.
NUREG/CR-2239, Technical Guidance for Siting Criteria Development. November 1982.
NUREG-1150, Severe Accident Risks: An Assessment for Five U.S. Nuclear Power Plants. 1991.
REFERENCES FOR ACCIDENT PROGRESSION:
NUREG/CR-6119, Vol. 1, Rev. 3, MELCOR Computer Code Manuals, Vol. 1: Primer and User’s Guide, Version 1.8.6. 2005.
NUREG/CR-6042, Rev. 2: Perspectives on Reactor Safety. 2002.
NUREG/CR-6613, SAND97-0594: Code Manual for MACCS2 User’s Guide. 1997.
REFERENCES FOR EMERGENCY PREPAREDNESS:
NUREG/CR-6864: Identification and Analysis of Factors Affecting Emergency Evacuations. 2005.
NUREG/CR-6953, Vol. I-II: Review of NUREG-0654, Supplement 3, Criteria for Protective Action Recommendations for Severe Accidents. 2007.
NUREG/CR-6863: Development of Evacuation Time Estimate Studies for Nuclear Power Plants. 2008.
NUREG/CR-6981: Assessment of Emergency Response Planning and Implementation for Large Scale Evacuations. 2008.
REFERENCES FOR HEALTH EFFECTS:
Fact Sheet on Biological Effects of Radiation http://www.nrc.gov/reading-rm/doc-collections/fact-sheets/bio-effects-radiation.html.
NRC Radiation Protection Web site http://www.nrc.gov/about-nrc/radiation.html.
Health Physics Society, “Radiation Risk in Perspective” (July 2010).


U.S. Nuclear Regulatory Commission
NUREG/BR-0359
January 2012


![Thirtieth anniversary of reactor accident in A-1 Nuclear Power … · 2008. 7. 17. · Regulatory Authority of the Slovak Republic, 1996) [3]. The fact that the second accident on](https://img.dokumen.tips/doc/110x75/60cbee74895cd724f90c0274/thirtieth-anniversary-of-reactor-accident-in-a-1-nuclear-power-2008-7-17-regulatory.jpg)