Embed Size (px)
Citation preview

Modeling physical environmental impacts on
survival:the SHIRAZ model
Ecosystem based managementFISH 507
SHIRAZ publicationsScheuerell, M. D., Hilborn, R., Ruckelshaus, M. H., Bartz, K. K., Lagueux, K. M., Haas, A. D., and Rawson, K. 2006. The Shiraz model: a tool for incorporating anthropogenic effects and fish-habitat relationships in conservation planning. Can. J. Fish. Aquat. Sci. 63: 1596-1607.
Battin, J., Wiley, M. W., Ruckelshaus, M. H., Palmer, R. N., Korb, E., Bartz, K. K., and Imaki, H. 2007. Projected impacts of climate change on salmon habitat restoration. Proceedings of the National Academy of Sciences of the United States of America. 104: 6720-6725.
Honea, J. M., Jorgensen, J. C., McClure, M. M., Cooney, T. D., Engie, K., Holzer, D., and Hilborn, R. 2009. Evaluating habitat effects on population status: influence of habitat restoration on spring-run Chinook salmon. Freshwater Biology. doi:10.1111/j.1365-2427.2009.02208.x.
Motivation for habitat modelling
• One element of fisheries management is habitat protection and restoration
• In Pacific Northwest hundreds of millions of dollars are being spent on these items
• How do we evalute the priority or cost benefit ratio of the different kinds of activities

Fish live life one day at a time
• The probability of survival depends upon feeding, and surviving
• The key factors are protection from predators, availability of food, influence of competitors, the right habitat and physical conditions

It is convenient to break the life history into stages
Numberstage+1= Numberstage * survivalstage
Survival depends on food, competitors, predators, and habitat
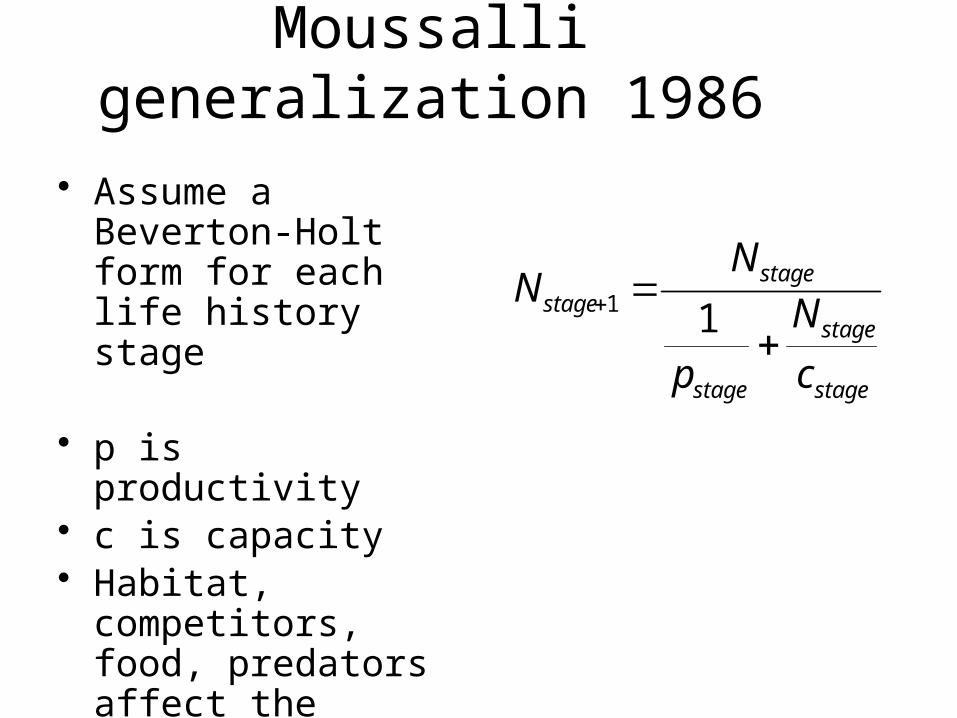
Moussalli generalization 1986
• Assume a Beverton-Holt form for each life history stage
• p is productivity• c is capacity• Habitat, competitors,
food, predators affect the productivity and capacity
stage
stage
stage
stagestage
c
N
p
NN
11

Over a series of life history stages
ns
s s
s
totaltotal
ns
ssn
cP
Pc
pP
1
1
The productivity and capacity over the entire life history are simple functions of the individual p’s and c’s at the stages
Note the capital P in denominator
The series of life history stages is a Beverton-Holt model

For MSY
15.0 totaltotal
totalMSY P
P
cS

Life history and habitat
• The Moussalli form provides the basis for life history models SHIRAZ and EDT– Both of these are now used to evaluate
impacts of habitat change on Pacific salmon

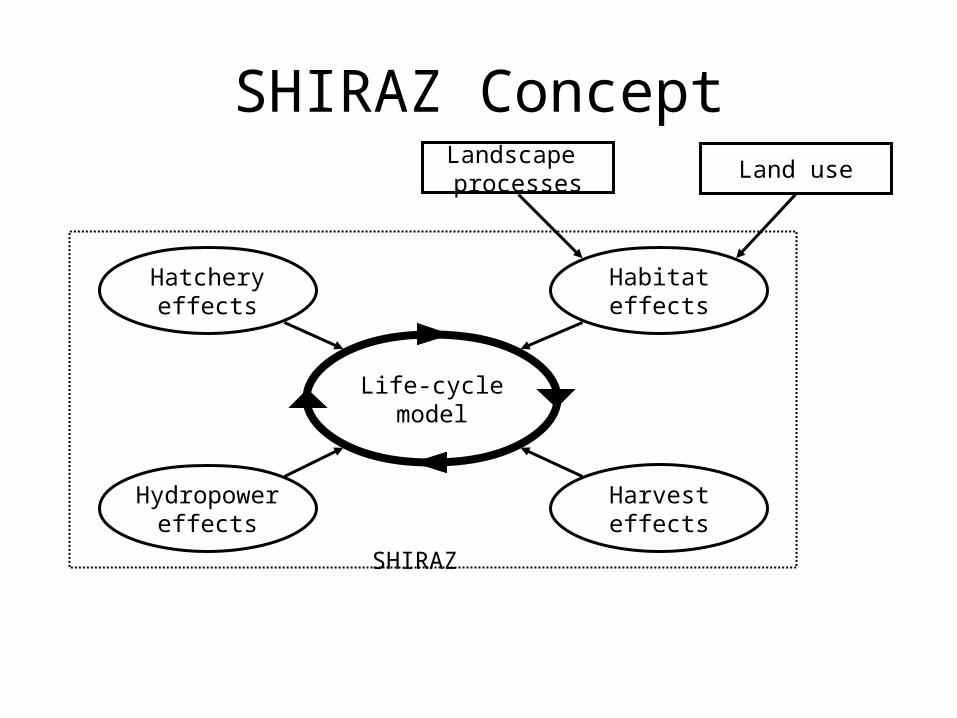
Basic concepts of SHIRAZ
• Life history stages• Divide watersheds into segments• In each segment describe a range of habitat
characteristics• Functional relationships between habitat
characteristics and productivity and capacity at each stage
• Stocks, that have different life history stages, spring vs fall chinook, hatchery vs wild
Hatcheryeffects
Habitateffects
Harvesteffects
Land useLandscape processes
Hydropowereffects
Life-cyclemodel
SHIRAZ
SHIRAZ Concept
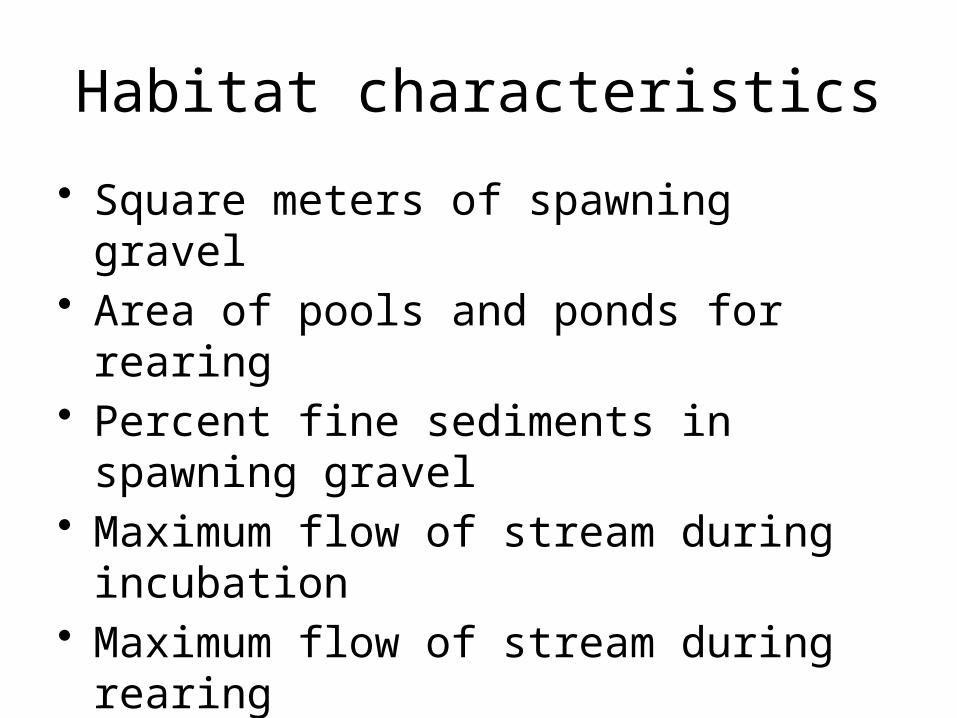
Habitat characteristics
• Square meters of spawning gravel• Area of pools and ponds for rearing• Percent fine sediments in spawning gravel• Maximum flow of stream during incubation• Maximum flow of stream during rearing• Minimum flow of stream …

Functional relationships
• For each life history stage in each area there are two parameters, productivity and capacity
• Each of these is defined as a function of habitat characteristics

Sharma coho carrying capacity
0
1200
2400
3600
4800
0 2000 4000 6000 8000 10000 12000 14000
Pool density (m2/km)
Sm
olt
de
ns
ity

Snoqualamie Snohomish River basin
SHIRAZ Model


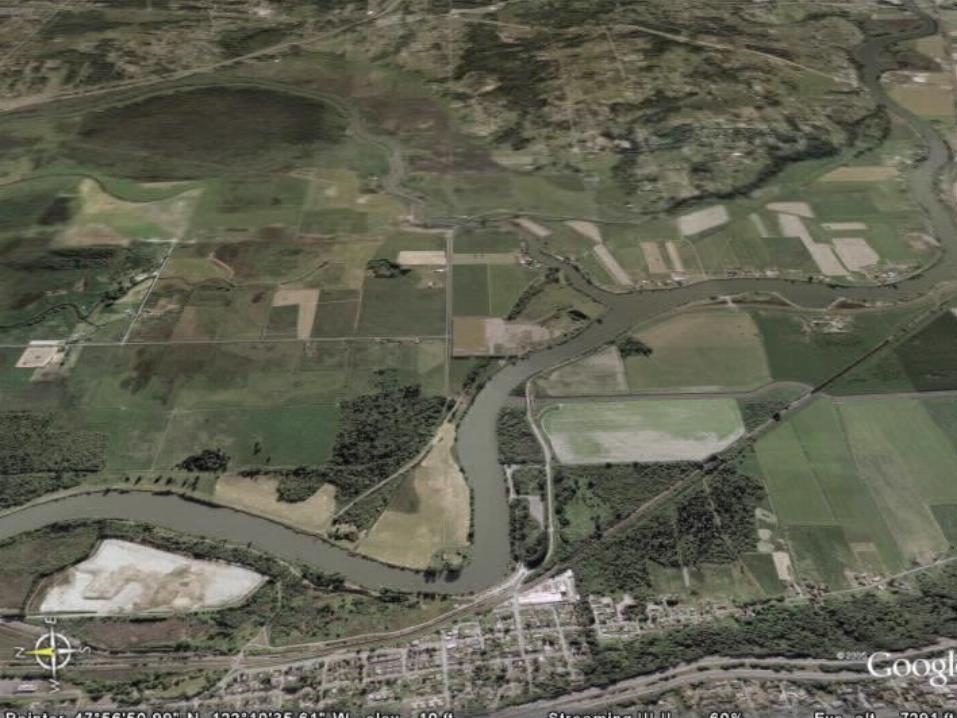


Major habitat changes
• Dyking and farming lower watershed – loss of rearing area
• Road construction and logging in upper watershed – Increased sediment in spawning areas– Increased flow variability

Uses of SHIRAZ
• Evaluate rebuilding plans for Endangered Species Act mandates
• Evaluate impacts of alternative expected habitat changes
• Identify cost-effectiveness of alternative habitat improvements
• Evaluate impacts of hatcheries• Evaluate impacts of climate change

HistoricalN = 40930
Current pathN = 6590
Test caseN = 18257
0
1 - 99
100 - 499
500 - 999
=1000
Wild spawners
HistoricalN = 40930
Current pathN = 6590
Test caseN = 18257
0
1 - 99
100 - 499
500 - 999
=1000
Wild spawners

0
10
20
30
40
0 10 20 30 40 50
Spawners (1000s)
Re
cru
its (
10
00
s)

Impacts of climate changefrom Battin et al 2007

Escapement goals
• There are generally three approaches to setting escapement goals– Historical averages– Spawner-recruit analysis– Habitat based assessments
• Mixing different types of data• Considering nutrient impacts

Habitat based approaches
• Limiting factors evaluation– Spawning area (many species)– Lake rearing capacity (sockeye)– Freshwater rearing (coho)
Essential fish habitat
• Required to be protected under Magnusson Stevens act
• SHIRAZ provides a quantitative framework for evaluating the importance of different habitat elements
• In a SHIRAZ model some habitat will be more limiting than others
• We can calculate the derivative of the population abundance with respect to each habitat

Models of habitat impacts for marine fishes
• In general we don’t understand the relationship between ocean physical habitat and marine fish survival
• OR there is nothing we can do about it• As a result almost all marine fish
ecosystem models are trophic

EBM exercises
• No spatial resolution• Only a single stock• No hatcheries


Hatchery impacts
• Hatchery fish can potentially compete with wild salmon
• Hatchery fish may also effect wild fish through genetic impacts
• Hatchery fish may potentially supplement and help rebuild wild fish

Impact of supplementationfrom Sharma Cooper and Hilborn

Optimal harvesting if we know pre-spawning mortality and ocean
conditions
SurvivalOcean 1
1
) 1(
x
capacityspawners
typroductivi
spawnersreturn
mortality
spawning
pre
escapementspawners
rateharvestreturnescapement

The best escapement :giving up one fish in the catch produces one additional fish
in subsequent recruitment
0
200
400
600
800
1000
1200
1400
0 500 1000 1500
Spawners
Re
cru
its
Best Escapement

What to do with 50% reduction in ocean survival or 50% prespawning
mortality
0
200
400
600
800
0 100 200 300 400 500
Escapement
Re
cru
its
poor ocean
.5 prespawn
normal
best esc