Embed Size (px)
Citation preview

Modeling perceptual variations by neural
decodingQasim Zaidi
Elias H. Cohen
NEI grants EY07556 and EY13312

Shape Constancy
•Shape is the geometrical property of an object that is invariant to location, rotation and scale.
•The ability to perceive the shape of a rigid object as constant across viewpoints has been considered essential to perceiving objects accurately.
•The visual system does not discount all perspective distortions, so the shapes of many 3-D objects change with viewpoint.
•Can shape constancy be expected for rotations of the image plane?
North view South view
The Future Building, Manhattan
(Griffiths & Zaidi, 2000)

Vertical
Oblique
Convex Concave
Does rotating from vertical to oblique preserve perceived depth?
3-D Shape Constancy across image rotations?

Vertical
Oblique
Convex Concave
Stimuli
Perspective projection of convex and concave wedges (in circular window).
Experiment 1 compared 5 vertical shapes to 5 oblique shapes in depth (concave to concave & convex to convex).
Shapes
Sine-wave gratings• 3 spatial frequencies, 1,3,6 cpd.• Oriented at 90, ± 67.5, ± 45, & ± 22.5 degrees ( wrt 3D axis).• Added in randomized phases to make 10 different textures per shape.
Texture
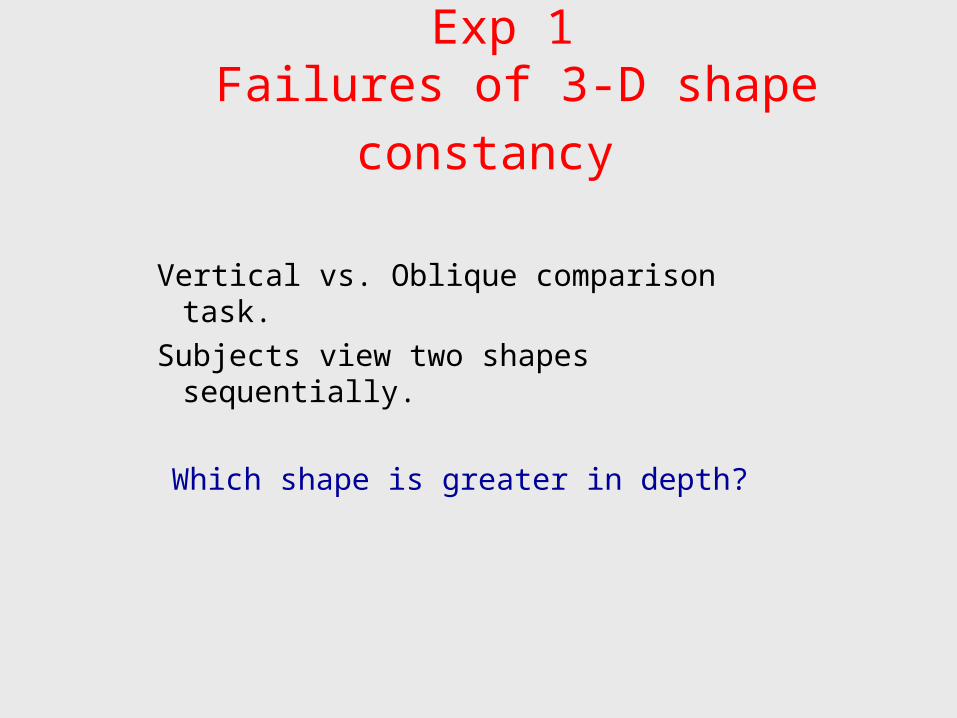
Exp 1 Failures of 3-D shape
constancy
Vertical vs. Oblique comparison task.
Subjects view two shapes sequentially.
Which shape is greater in depth?

500 msec

500 msec

500 msec

500 msec

500 msec


Exp 1: Shape Comparison Results
The same shape was perceived to be deeper when it was oriented vertically than when it was oriented obliquely.
Oblique shapes were matched to vertical shapes of 0.77 times depth of the oblique shape (S.E. = .007).

3D Shape From Texture Perception of shape from texture depends on patterns of orientation flows (Li & Zaidi, 2001; 2004)
Textured shape with no orientation component orthogonal to axis of curvature.

Is there a corresponding OB for single 2D angles?
Origins of oblique bias for 3D
shape Is the 3D OB explained by an OB for 2D oriented components?

Exp 2 Failures of 2-D angle
constancy
Vertical vs. Oblique comparison task.Subjects view two shapes sequentially.
Which angle is sharper?

500 msec

500 msec

500 msec

500 msec

500 msec

Exp 2: Angle Comparison Results
The same angle was perceived to be sharper when it was oriented vertically than when it was oriented obliquely.
Oblique angles were matched to vertical angles 4.5 ° shallower on average.

Predicting the 3-D depth bias from the 2-D angle bias
oblqvertoblqvert aass //
The average ratio of perceptually equivalent 2-D slopes = 0.862 (SE = .001)
Ratio of perceptually equivalent 3-D depths = 0.771 (SE = .007)
3-D depth inconstancy can be explained by anisotropy in perception of 2-D features.
irrespective of h.

Orientation anisotropies in cat V1 cells (Li et al 2003)
Ferret area 17 anisotropy (Coppolla et al, 1998)
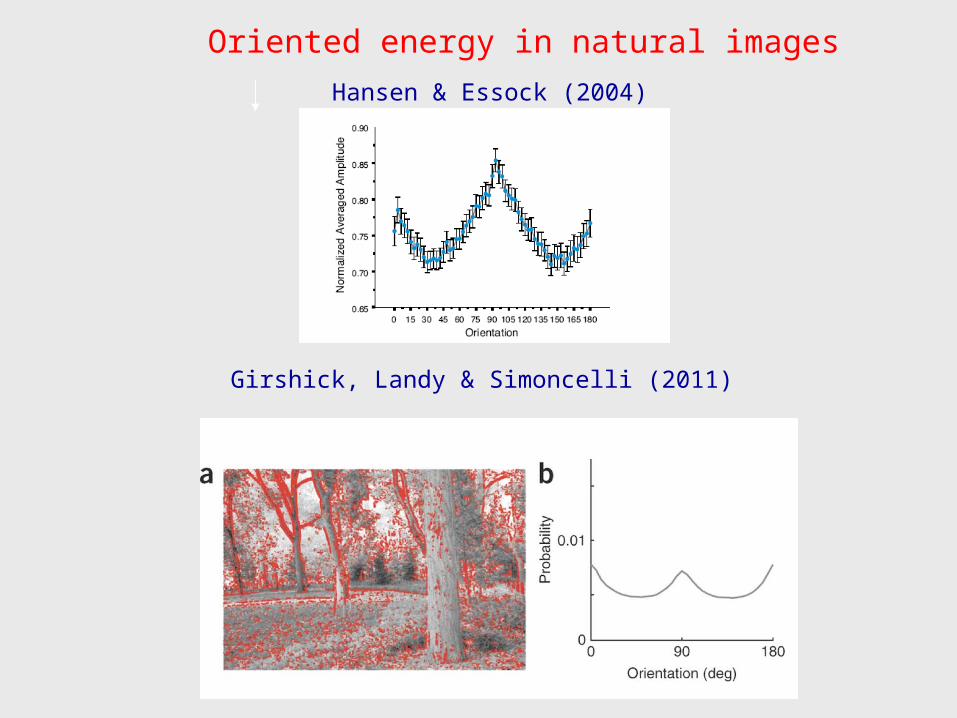
Oriented energy in natural images
Hansen & Essock (2004)
Girshick, Landy & Simoncelli (2011)

Distribution of oriented contours in indoor (A), outdoor (B), and entirely natural (piedmont forest) (C) environments.
Coppola D M et al. PNAS 1998;95:4002-4006
©1998 by National Academy of Sciences

)()|( ifspikeP
!
)()/(
)(
i
fni
i n
efnP
ii
k
ii
k
i
fni
k
n
efnnnP
ii
1
1
)(
21
)()/,...,(
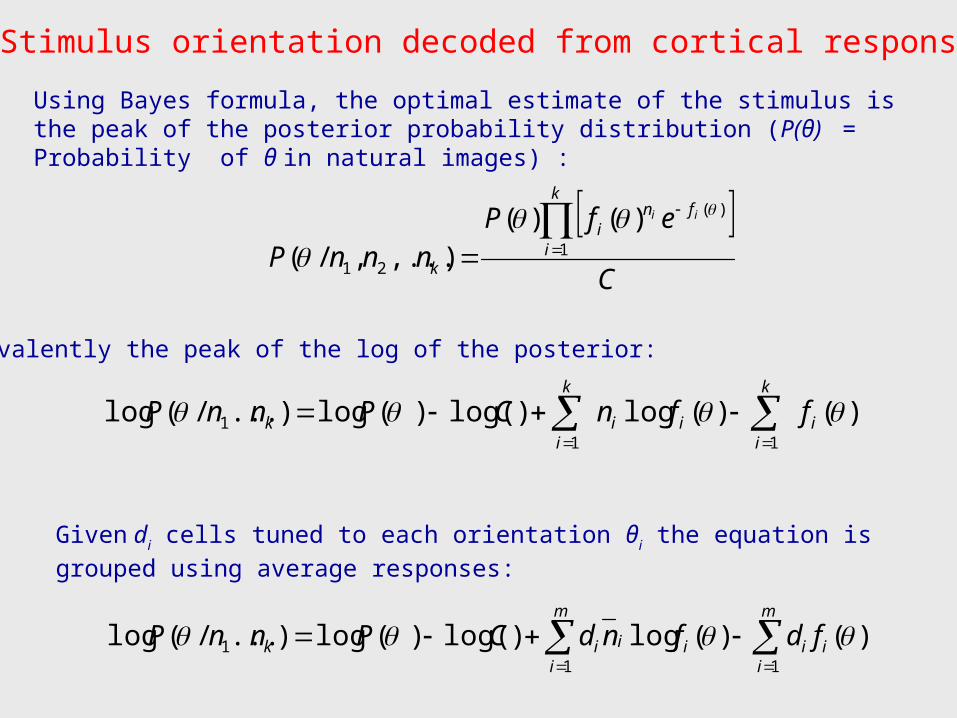
Stimulus orientation decoded from cortical responses
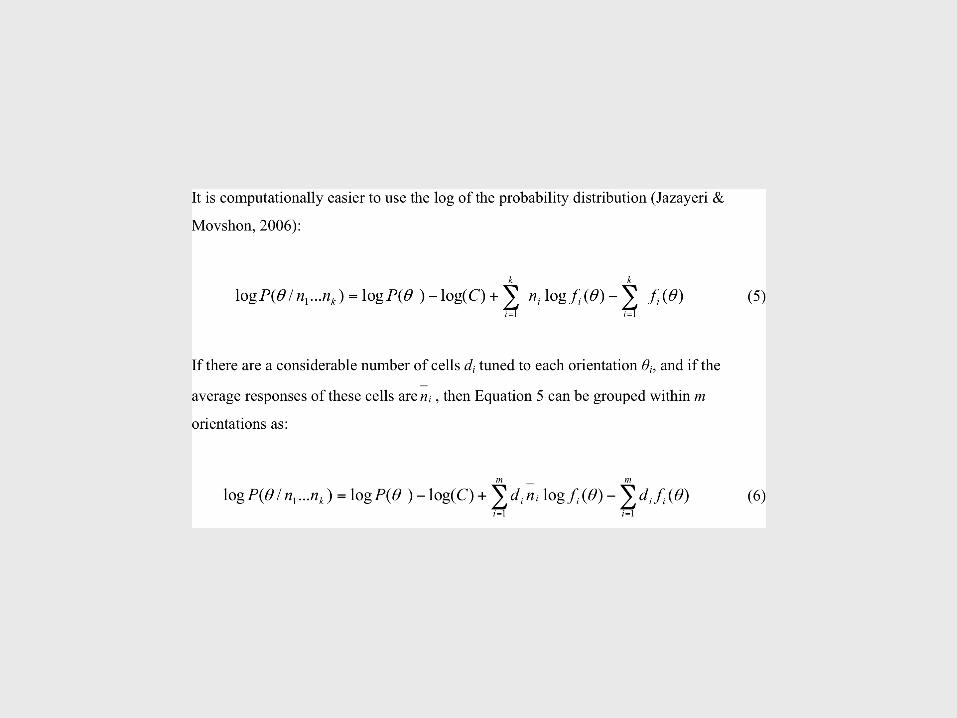
The probability that an orientation-tuned cell will give a spike in response to an orientation θ is determined by its tuning curve f(θ) (Sanger, 1996):
The probability of the cell giving ni spikes is given by a Poisson distribution:
For independently responding neurons, the probability of ni spikes each from k cells is given by the product of the probabilities:
C
efPnnnP
k
i
fni
k
ii
1
)(
21
)()(),...,/(
)()(log)log()(log).../(log11
1 i
k
iii
k
ik ffnCPnnP
)()(log)log()(log).../(log11
1 i
m
iiii
m
iik fdfndCPnnP
Stimulus orientation decoded from cortical responses
Using Bayes formula, the optimal estimate of the stimulus is the peak of the posterior probability distribution (P(θ) = Probability of θ in natural images) :
Equivalently the peak of the log of the posterior:
Given di cells tuned to each orientation θi the equation is grouped using average responses:

((log)log()(log).../(log i1
i1
1 FdFndCPnnPm
iii
m
iik
)),()()()(max((i qipiqipi hhggF
)(*)()( qp PPP
Stimulus angle decoded from cortical responses
Using orientation tuned cells in V1, plus cross-orientation inhibition, we derived a matrix valued tuning function for (V4?) cells selective for angles W composed of two lines θp
and θq :
For the prior P(W) we made the rough approximation:
Finally, stimulus angles were decoded from the population responses of orientation tuned cells using an equation similar to that for orientations:

ASSUMPTION: Observer perceives an angle equal to the optimally decoded angle, i.e. the peak of the posterior
probability distribution
Stimulus angle 140º
Decoded oblique angle 142º Decoded vertical angle 138º

From cortical anisotropy to shape inconstancy
1.We show an oblique bias for 3-D appearance.
2.The 3-D effect can be explained by an oblique bias for 2-D angles.
3.Simulations show that the anisotropy in orientation tuning of cortical neurons plus cross-orientation inhibition explains the 2-D oblique bias.
4.Anisotropy in numbers of cells predicts the opposite bias.
5.The predictions were insensitive to the prior distribution.

Consequences of the oblique bias for angle perception
Zucker et al
Fleming et al
Cohen & Singh
Tse

Conclusions
1. If the perception of 3D shape depends on the extraction of simple image features, then bias in the appearance of the image features will lead to bias in the appearance of 3D shape.
2. Variations in properties within neural populations can have direct effects on visual percepts, and need to be included in neural decoding models.
Cohen EH and Zaidi Q Fundamental failures of shape constancy due to cortical anisotropy. Journal of Neuroscience (2007).

Perceived angles decoded from cortical responses
Having traced 3-D perceptual anisotropy to an oblique bias for 2-D angles, we used a
probabilistic stimulus decoding model (Sanger, 1996) to test whether this 2-D bias could be explained by anisotropies in numbers or tuning widths of cortical cells tuned to
different orientations (Li, et al., 2003), or the anisotropic distribution of oriented energy in images of natural scenes (Hansen & Essock, 2004). We
first derived the probabilities of numbers of spikes from
individual orientation tuned cells in response to an angle
stimulus. Using Bayes’ formula, we then decoded the most probable angle given the
population response. To compare the model’s predictions with the experimental measurements, we assumed that the observer
perceives an angle equal to the optimally decoded angle.


Justifications, alternatives, and implications of the model
To obtain the decoding solution, a number of assumptions were made: (i) Shapes of orientation tuning curves are not constrained but are assumed to be invariant to
signal-strength, based on orientation tuning curves in V1 being contrast-invariant (Sclar & Freeman, 1982). (ii) The variation in firing rates of cortical neurons is described by Poisson statistics, but more general
Poisson-like exponential distributions would suffice (Ma et al., 2006). (iii) The assumption that responses of
cells tuned to different angles at different orientations are independent leads to a simple Bayes-optimal solution, but noise in the cortex is correlated across cells. However, a decoding model incorporating the structure of neural correlations (Ma et al., 2006) requires empirical estimates that do not yet exist, and the relatively constant variability observed across
cortical stages suggests that noise correlations may be propagated by down-stream neurons (Shadlen & Newsome,
1998). In addition, a neural-correlation function based on similarities between preferred stimuli changes the variance of the likelihood function but not measures of
central tendency (Jazayeri & Movshon, 2006).

Equation 7 provides a way to simulate cells sensitive to specific angles at specific orientations, and could be used to predict tuning curves for such cells in V2 and V4 (Pasupathy & Connor, 1999; Ito & Komatsu, 2004). This equation takes into account cross-orientation inhibition between V1 cells, so responses of V1 cells are not
assumed to be independent in the model. V1 cells also have anatomical links to cells with co-oriented and co-axially aligned receptive fields (Bosking et al., 1997). Such long-range excitatory connections
could facilitate the extraction of curved contours (Ben-Shahar & Zucker, 2003).
Replacing cross-orientation inhibition in the model with such excitatory V1
connections, leads to predictions that overestimate the vertical angle and underestimate the oblique angle, i.e. distortions opposite to the observed
perceptual bias. A similarly incorrect prediction was obtained if cross-
orientation inhibition was replaced by a stronger divisive gain for horizontally
tuned cells than for obliquely tuned cells (Hansen & Essock, 2004).

This model can be viewed as a formal embodiment of Mach’s (1897) idea of “contrast in directions” which he proposed as an explanation for why obtuse angles tend to appear contracted and acute angles tend to appear expanded (Wundt, 1862). In the simulations, we found that
contraction of obtuse angles is not a general result of orientation contrast, as presupposed by Blakemore et al.
(1970), but occurs only for certain relative widths of excitation and inhibition. Mach’s second explanation for angle distortions, invoked the projective tendency of acute angles in the image to originate from 3-D angles that are greater than their projections and obtuse
projections to arise from smaller 3-D angles (quantified by Nundy et al, 2000). To explain our results, this
hypothesis requires that the 3-D angles in the world that project to oblique obtuse angles be wider on average than the 3-D angles that project to vertical obtuse angles. We used Equation 8 as an approximation to the frequency of image angles in natural scenes. The model was insensitive to P(W). It is likely that tuning-width anisotropies will also explain Bouma & Andriessen’s (1970) result that the
magnitude of the induced effect on the perceived orientation of a line segment depends on the orientations
of the inducing and test lines.