Embed Size (px)
Citation preview
Modeling of tumor growth and treatment withoncolytic viruses
Dr. Hana DobrovolnyAssistant Professor of Biophysics
Texas Christian University
YITP International WorkshopNovember 5, 2015

Cancer
• About 14 million new cases of cancer are diagnosed everyyear worldwide.
• Cancer is responsible for ∼8 million deaths every yearworldwide.
• The estimated cost of cancer is $1.16 trillion worldwide.
• Research is needed to help understand how cancerdevelops and how to best treat different types of cancers.
Cancer Primer
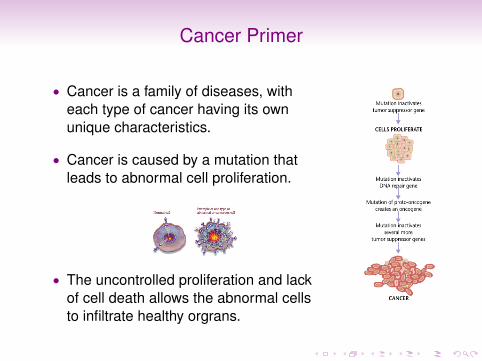
• Cancer is a family of diseases, witheach type of cancer having its ownunique characteristics.
• Cancer is caused by a mutation thatleads to abnormal cell proliferation.
• The uncontrolled proliferation and lackof cell death allows the abnormal cellsto infiltrate healthy orgrans.

Cancer Treatment
• Current standard treatments includesurgery, radiation, and chemotherapy.
• These treatments have serious andsometimes debilitating side effects.
• New treatment modalities aim to reduceside effects and include immunotherapy,oncolytic viruses, and gene therapy.

Physics and Biology?
• Physicists build mathematical models to understand andpredict the behaviour of a system.
• Physicists find connections between vastly differentsystems.
• Mathematical modeling of non-biological systems has ledto the modern, technology-based society.
• Application of these physics techniques can help usunderstand biological systems.
Mathematical Modeling of Cancer
• Mathematical models can help us understand theprocesses underlying cancer growth and treatment.
• Models can be used to help determine optimal doses andtreatment regimens.
• Models can be used to study and optimize combinationtherapy.
• This talk will focus on ODE models and their use inmodeling tumor growth and treatment with oncolyticviruses.

Modeling Tumor Growth
Several ODE models of tumor growth have been proposed andare used to model tumor growth.
Exponential: V̇ = λV
Mendelsohn: V̇ = λV a
Logistic: V̇ = λV (1 − bV )
Linear: V̇ = aVV+b
Surface: V̇ = aV
(V+b)13
Gompertz: V̇ = aV ln(
bV+c
)Von Bertalanffy: V̇ = aV
23 − bV

Choosing the Right Model
• There is little guidance on how to choose the best growthmodel.
• Is there a model that best describes most types of cancer?
• Should growth models be different for in vivo vs. in vitrostudies?
• Do different types of cancer need different models?

Why Model Choice Matters
0 50 100 150 200Time (d)
0
1000
2000
3000
4000
5000
6000
7000Tu
mor
siz
e (m
m3
)
ExponentialMendelsohnLogisticLinearSurfaceGompertzBertalanffyData
Data from Worschech et al, BMC Genomics (2009)
We need to accurately predict growth in order to accuratelyassess treatment efficacy.

Methods
• Search literature for experimental data of tumor growth.
• Fit models to data using least-square fitting.
• Use Akaike’s information criterion (AICC) to determinewhich model best explains the data
AICC = n ln(
SSRn
)+
2(K + 1)nn − K − 2
,
n — number of data pointsK — number of parametersSSR — sum of squared residuals

Results
To date 204 data sets have been analyzed
Exp. Gen. Exp.
Logistic Linear Surface Bert. Gomp.0
10
20
30
40
50
60
70
Num
ber
of
tim
es m
odel
was
bes
t fi
t
The exponential and generalized exponential are the mostfrequent best fits.
Are the Data Sets Too Short?
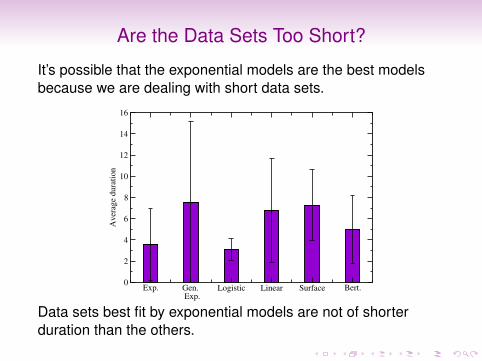
It’s possible that the exponential models are the best modelsbecause we are dealing with short data sets.
Exp. Gen. Exp.
Logistic Linear Surface Bert.0
2
4
6
8
10
12
14
16A
ver
age
du
rati
on
Data sets best fit by exponential models are not of shorterduration than the others.

Results by Strain
Exp. Gen. Exp.
Logistic Linear Surface Bert. Gomp.0
2
4
6
8
10
12
14
Nu
mb
er o
f ti
mes
mo
del
was
bes
t fi
t
Breast Cancer
Exp. Gen. Exp.
Logistic Linear Surface Bert. Gomp.0
2
4
6
8
10
12
14
Nu
mb
er o
f ti
mes
mo
del
was
bes
t fi
t
Hepatoma
Exp. Gen. Exp.
Logistic Linear Surface Bert. Gomp.0
2
4
6
8
10
12
14
Nu
mb
er o
f ti
mes
mo
del
was
bes
t fi
t
Lung Canacer
Exp. Gen. Exp.
Logistic Linear Surface Bert. Gomp.0
2
4
6
8
10
12
14
Nu
mb
er o
f ti
mes
mo
del
was
bes
t fi
t
Renal Cancer

Summary
• Exponential and generalized exponential models are mostfrequent best fits.
• This does not appear to be because the data is notcollected over a long enough time span.
• There is not yet enough data to determine whether choiceof model should depend on type of cancer.

Oncolytic Virus Treatment
• Ability of certain viruses to destroy tumor cells and effectcancer remission is well known, with reports dating backmore than 100 years
• Focus of significant research in 1950s, but by late 1960sinterest declined
• By the 1990s, improved biotechnology and the potential forgene therapy led to renewed interest in oncolytic viruses
• A number of clinical trials are currently underway• Oncolytic virus therapy currently approved and in use in
China and Latvia• China - Oncorine (modified H101 adenovirus) for head and
neck cancer• Latvia - RIGVIR (ECHO-7 enterovirus) for several types of
cancer
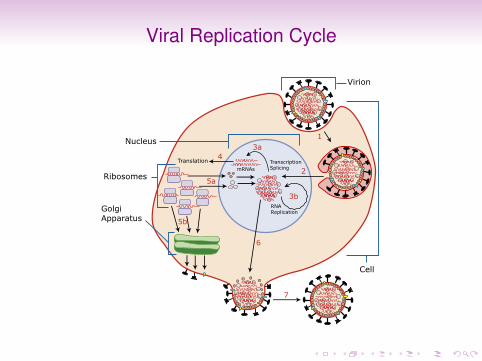
Viral Replication Cycle
Oncolytic Viruses
• Many viruses can kill tumor cells, but we would also likethem to NOT kill healthy cells.
• Many viruses have a natural preference for cancer cells,although the mechanism varies:
• Viruses can more easily bind to receptors on cancer cellsthan receptors on healthy cells.
• Viruses can replicate more efficiently in cancer cells than inhealthy cells.
• Viruses can kill cancer cells more effectively than healthycells.
• Viruses can stimulate the immune response to attackcancer cells due to a lack of IFN response in tumors.

Replication Selective Virotherapy
Assumes no virus replication in normal cells
Reproduced from Kirn D et al. (Nat. Med., 2001)

Reality
Modified from Aguilar-Cordova, E. (Nat. Biotech., 2003)
In reality, we cannot completely prevent viruses from replicatingin normal cells.

Two Cell Model
Uninfected cancer
Uninfected normal
Infected cancer
Logistic growth
Logistic growth
Infected normal
• Previous OV models have typically focused on effects uponcancer cells and tumor size reduction.
• Do not address potential infection of surrounding normalcells and resulting changes in virus population.
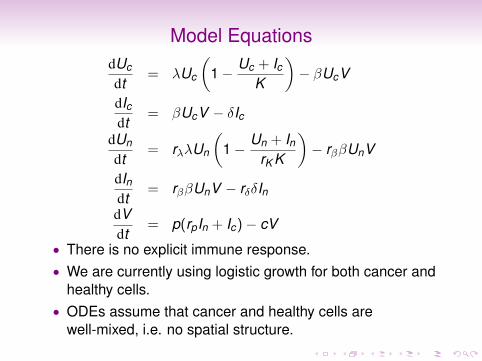
Model EquationsdUc
dt= λUc
(1 − Uc + Ic
K
)− βUcV
dIcdt
= βUcV − δIc
dUn
dt= rλλUn
(1 − Un + In
rK K
)− rββUnV
dIndt
= rββUnV − rδδIn
dVdt
= p(rpIn + Ic)− cV
• There is no explicit immune response.• We are currently using logistic growth for both cancer and
healthy cells.• ODEs assume that cancer and healthy cells are
well-mixed, i.e. no spatial structure.
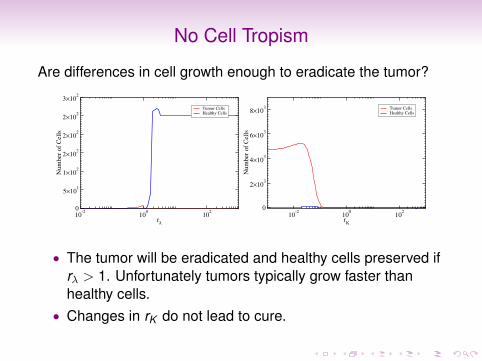
No Cell Tropism
Are differences in cell growth enough to eradicate the tumor?
10-2
100
102
rλ
0
5×101
1×10²
2×10²
2×10²
2×10²
3×10²
Nu
mb
er o
f C
ells
Tumor CellsHealthy Cells
10-2
100
102
rK
0
2×10³
4×10³
6×10³
8×10³
Num
ber
of
Cel
ls
Tumor CellsHealthy Cells
• The tumor will be eradicated and healthy cells preserved ifrλ > 1. Unfortunately tumors typically grow faster thanhealthy cells.
• Changes in rK do not lead to cure.
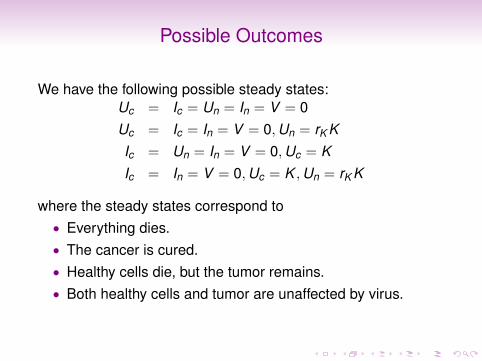
Possible Outcomes
We have the following possible steady states:Uc = Ic = Un = In = V = 0Uc = Ic = In = V = 0,Un = rK KIc = Un = In = V = 0,Uc = KIc = In = V = 0,Uc = K ,Un = rK K
where the steady states correspond to• Everything dies.• The cancer is cured.• Healthy cells die, but the tumor remains.• Both healthy cells and tumor are unaffected by virus.

Goals
• We want to find parameter ranges corresponding to thesecond steady state (cancer is cured).
• We examine the different mechanisms of viral preferenceto see if a particular mechanism is preferable.
• We varied rp, rδ, rβ along with rλ to find which parametervalues eradicate cancer cells but still preserve normal cells.

Difference in Viral Production
10-2
100
rp
0
2×10³
4×10³
6×10³
8×10³
1×10⁴
Nu
mb
er o
f ce
lls
Tumor CellsHealthy Cells
• Differences in viral production will not lead to a cure.• Either both cell populations remain or both cell populations
die.

Difference in Viral Kill Rate
10-2
100
102
rλ
0
1×10³
2×10³
3×10³
4×10³
5×10³
6×10³
7×10³
Num
ber
of
Cel
ls
Tumor CellsHealthy Cells
• Differences in viral kill rate do not lead to a cure.• Again either both cell populations survive or both die.

Difference in Viral Infection Rate
10-6
10-4
10-2
100
rβ
0
2×10³
4×10³
6×10³
8×10³
1×10⁴
Nu
mb
er o
f C
ells
Tumor CellsHealthy Cells
• At low values of rβ, we see a small controlled tumor with nohealthy cell damage.
• For a range of values near 10−2, the tumor disappears, buthealthy cells remain.

Conclusions
• Our model suggests that only viruses that preferentiallyinfect cancer cells will be able to cure the cancer.
• Differences in production rate or kill rate alone will not beable to eradicate the tumor.
• There is a small range of infection rates that will lead toeradication of the tumor.
• Large differences in infection rate lead to a controlledtumor.
Future Work
• Determine guidelines for choosing ODE tumor growthmodels.
• Investigate how growth model choice affects oncolytic virustreatment predictions.
• Develop a model that includes spatial effects to see iftumor structure can help limit spread of virus toneighboring cells.
• Incorporate immune response to study the last mechanismof cell preference.
Acknowledgements
Computational biophysics:• Dr. Gilberto Gonzalez-Parra• Lubna Pinky• Thalia Rodriguez• Binaya Tuladhar• Hana Jaafari
• Anh Nguyen• Carson Huey-You• Dylan Barth• Lucas Deecke• Parker Haggerty
Support:
NSF, TCU INFOR
![Modeling the Spatiotemporal Dynamics of Oncolytic Viruses ...downloads.hindawi.com/journals/cmmm/2020/3642654.pdffrom resisting treatment [2]. Recently, oncolytic viruses have been](https://img.dokumen.tips/doc/110x75/5ffb2900e1d0a00f403f2996/modeling-the-spatiotemporal-dynamics-of-oncolytic-viruses-from-resisting-treatment.jpg)