Embed Size (px)
Citation preview

Abstract— A novel approach is proposed for generating data
driven models of the lung nodules appearing in low dose CT
(LDCT) scans of the human chest. Four types of common lung
nodules are analyzed using Active Appearance Model methods
to create descriptive lung nodule models. The proposed
approach is also applicable for automatic classification of
nodules into pathologies given a descriptive database. This
approach is a major step forward for early diagnosis of lung
cancer. We show the performance of the new nodule models on
clinical datasets which illustrates significant improvements in
both sensitivity and specificity.
Keywords: Nodule modeling, Data-driven nodule models, Active
Appearance, Sensitivity and Specificity of CAD systems
I. INTRODUCTION
HIS paper deals with modeling the lung nodules that are
visible in low dose computed tomography (LDCT) of
the human chest. The new models are major enhancements
to ongoing efforts for early detection and classification of
nodules in lung cancer screening studies that are based on
LDCT. Globally lung cancer remains the most common
malignancy with an estimated 1.5 million newly diagnosed
cases in 2007 and 1.35 million deaths occurring that same
year. Of the 1.35 million deaths 975,000 cases were men and
376,000 cases were female. The highest recorded 5-year
patient survival rates of 14% are observed in the United
States while the 5 year survival rate is 8% in Europe. The
survival of lung cancer is strongly dependent on early
diagnosis [1][2]. Research studies to reach an optimal
detection rate for early detection of lung cancer are the hope
for improved survival rate [3]-[5].
An image analysis approach for automatic detection and
classification of lung nodules involves image acquisition and
filtering of scan noise; segmentation of the lung tissue from
the rest of the chest cavity; detection of nodules and
reduction of false positives; and classification into
pathologies. The literature is rich in approaches to segment
the lung from the rest of the chest tissues; but the majority of
the nodule modeling methods are based on parametric
descriptions of the nodules (e.g., in 2D circular or
semicircular models are used, while in 3D volumes spherical
Manuscript received April 23, 2010. This work was supported in part by
the National Science Foundation and the Kentucky Lung Cancer Program.
Contact Author: Amal A. Farag, [email protected]
Amal Farag, S. Elhabian, J. Graham, A. Farag, S. Elshazly are with the
Department of Electrical & Computer Eng., University of Louisville, USA.
R.Falk, MD, is with the Medical Imaging Division, Jewish Hospital,
Louisville, KY, USA
H. Mahdi, H. Abdelmunim and S. Al-Gaafary, MD are with Ain Shams
University, Ain Shams, Egypt.
or hemispherical models are used). Nodule detection is
performed using various machine learning methods which
execute template matching by one approach or another (e.g.,
[5][7][8]). Extensive surveys on automatic lung nodule
detection may be found in [9][10].
Yet, the sensitivity and specificity of the automatic
detection methods is very hard to quantify. Part of the
problem is that, unlike common problems in computer vision
(e.g., face recognition or stereo-based reconstruction); no
“standard” databases are available for lung nodules. Nodule
centroid region locations are identified in the ELCAP study
in which the nodules are identified by a pixel inside the
nodule (i.e., the spatial support is not identified by the
human experts) [11]. The National Lung Screening Trial
(NLST) in the US is to report LDCT scans of over 30,000
subjects; to date this data is not available [1]. To the best of
our knowledge none of the studies worldwide have resulted
in identifiable databases of nodules listing their types and
pathologies. Therefore, the need is persistent for reliable
nodule models based on the actual scans. In fact, part of our
ongoing research is to construct such databases which will
be made available to the research community. Our efforts
seek to identify 10,000 nodules by end of 2010.
Kostis et al. [6] provides a description of four major types
of lung nodules based on identifiable features (size, shape
and location in the lung tissue). These “anatomical”
descriptions of nodules are used in our work. Lee et al. [5]
noted that the intensity (or Hounsfield Units) of the nodules
decays with radial distance off the centroid; this is beneficial
for texture/intensity estimation of the inside of a nodule
shape. Farag et al. [7][8] established a parametric form for
the relationship between the radial distance and the
Hounsfield units in Lee’s work; this is very useful for
estimating the intensity of a nodule model given an
ensemble. Yet, the nodule models used in Lee and Farag as
well as all similar works are based on parametric nodule
models. In this paper we will use the data to determine the
size, shape and intensity distribution of the nodule models
(templates). Our approach is non-parametric and is defined
by the actual nodules in the lung CT slices, and thus we call
it “data-driven”.
The contribution of the paper is confined to nodule
modeling based on the known information in LDCT scans,
as described in an ensemble of nodules identified by
radiologists. The developed approach is systematic and
applicable to any LDCT imaging protocol. Shape and
texture models have shown great promise in a number of
computer vision and biomedical imaging analysis (e.g.,
[12][13]); to the best of our knowledge, this is the first
attempt to use the methodologies for shape and texture
Modeling of the Lung Nodules for Detection in LDCT Scans
Amal Farag, Student Member, IEEE, Shireen Elhabian, Student Member, IEEE, James Graham, Senior
Member, IEEE, Aly Farag, Senior Member, IEEE, Salwa Elshazly, Robert Falk, Hani Mahdi, Member,
IEEE, Hossam Abdelmunim, Member, IEEE, Sahar Al-Ghaafary
T
32nd Annual International Conference of the IEEE EMBSBuenos Aires, Argentina, August 31 - September 4, 2010
978-1-4244-4124-2/10/$25.00 ©2010 IEEE 3618
modeling in the study of lung nodules. The paper is
organized as follows: section 2 discusses the new nodule
modeling approach; section 3 evaluates the improvements in
sensitivity and specificity that result from the new nodule
models algorithmic; and section 4 has conclusions and
planned extensions.
II. NODULE MODELING
This section will examine the process of nodule modeling
using an ensemble of nodules identified by radiologists.
A. Pulmonary Nodule definitions
In radiology, a pulmonary nodule is a mass in the lung
usually spherical in shape; however it can be distorted by
surrounding anatomical structures such as the pleural surface
and anatomical structures. The nodules may be located in
any part of the lung tissue and may be camouflaged or
occluded by the anatomical structure of the lung tissue. This
paper uses the classification of Kostis et al. [6] which
focuses on grouping nodules into four categories: 1) well-
circumscribed where the nodule is located centrally in the
lung without being connected to vasculature; 2) vascularized
where the nodule has significant connection(s) to the
neighboring vessels while located centrally in the lung; 3)
juxta-pleural where a significant portion of the nodule is
connected to the pleural surface; and 4) pleural tail where
the nodule is near the pleural surface, connected by a thin
structure; In all of these types there is no limitations on size
or distribution in the lung tissue. These definitions will be
adopted in this paper and the image analysis methods are
developed and tested based on these nodule types. Of course,
we can add a fifth “none of the above” class that describes
nodules of uncommon shapes or locations; we chose to limit
ourselves to the four classes of Kostis. The goal of the
modeling process is to generate a model or “template” for
each nodule type that possesses its main features.
B. Statistical Nodule Modeling
The main reason for the limited performance of
parametric nodules is the fact that real world nodules do not
have uniform shape or fixed size, and are not isotropic. The
active appearance modeling approach (AAM) which is used
synonymously as active appearance, active shapes,
morphable models, etc. in the computer vision literature may
hold real promise in the analysis (and even synthesis) of
lung nodules. The literature in AAM (and its variants) is rich
(see [12][13] for examples). We shall follow the notations
and developments of Mathews and Baker (e.g., [13]). There
are two forms of AAM, one independent where the shape
and appearance are separate parameters thus the shape and
appearance are modeled separately, and the other form
which is a combined AAM model consists of a single set of
parameters. In the case of independent AAM: Given the
parameters , , we
can use the following equations to generate the shape, ,
which can be defined as the coordinates of the vertices
model ,
(1)
Thus the mean shape can be expressed as:
(2)
where is a base shape plus a linear combination of n shape
vectors . The apperance of the shape is defined within .
Allowing to denote also as a set of pixels
that lies inside the base shape allowing the expression of
appearance as a base appearance plus a linear
combination of images .
(3)
In the combined AAM case, a single set of parameters
parameterize the shape and appearance:
(4)
(5)
For either form of the AAM, the quantities in Eq. 3 or 4
and 5 needs to be estimated from an ensemble of pre-labeled
entities (e.g., nodules). Various methods can be used to
perform this task. Commonly, manually annotated entities
are manipulated to extract the most discriminatory features
(entities or symbols) for the shape and appearance A
very efficient approach to carry out this step is Principle
Component Analysis (PCA). Indeed, carrying out this
process will result in a systematic approach for nodule
synthesis; the coefficients in Eq. (3) or (4) and (5) will be the
basis of a discrimination (or recognition) step. This approach
will lend great benefit for “identification of nodule”; i.e.,
from a collection of nodules in a database, we will be able to
classify a given nodule to the group closest to its features in
that database. For this to be carried out with confidence, a
huge database need to exist which carries out the statistical
variations in the nodules appearing in LDCT scans. Such a
database does not exist at the moment, and our group intends
to create 10,000 labeled nodules by 3 radiologists (crossly
validated) by end of 2010 which will be made public.
The empirical evaluation in this paper is entirely based on
the ELCAP public database [11], which contains 50 sets of
low-dose CT lung scans taken at a single breath-hold with
slice thickness 1.25 mm. The locations (radiologists mark
point inside the nodule) of the 397 nodules are provided by
the radiologists, where 39.12% are juxta-pleural nodules,
13.95% are vascularized nodules, 31.29% are well-
circumscribed nodules and 15.65% are pleural-tail nodules.
The official reports indicate the mean nodule diameter to be
8.5 mm with standard deviation 3.6. The ELCAP database is
of resolution 0.5x0.5mm. The methodologies developed here
will be applicable for any standard LDCT chest scanning
protocol, and the nodule models can be performed in 2D or
3D.
Specifically, developments in this paper use pre-identified
nodules by experts to automatically crop and manually
annotate the nodules centered in a bounding box of size
21x21 pixels (this region was selected based on the radial
distance distribution of the ensemble reported in [8]). The
ensemble of nodules contains variations in intensity
distribution, shape/structural information and directional
3619

variability which the cropped regions within the determined
bounding-box maintain. For testing the algorithms,
ensembles of 24 nodules per type, i.e. 96 total nodules,
where used. Manual annotation of the 96 nodules was
conducted using 10 landmark points (radiologists defined the
positioning and suitable number of landmarks). The cropped
nodules were annotated to highlight the basic geometric and
structural features of the nodules. The nodules were co-
registered with known classification from the ELCAP
screening study.
Fig. 1 shows a sample of co-registered nodules. We
implemented two approaches for registration: the Procrsutes
based AAM method (e.g., [14]) and a variational shape
registration method using vector level sets (e.g., [15]). The
mean nodule with shape and texture/appearance is
generated per nodule type from the co-registered nodules.
Fig. 1. Six cropped nodules from the four nodule types. Well-
circumscribed (1st raw) vascular (2nd raw), juxta-pleural (3rd raw) and
pleural-tail (4th raw) nodule types.
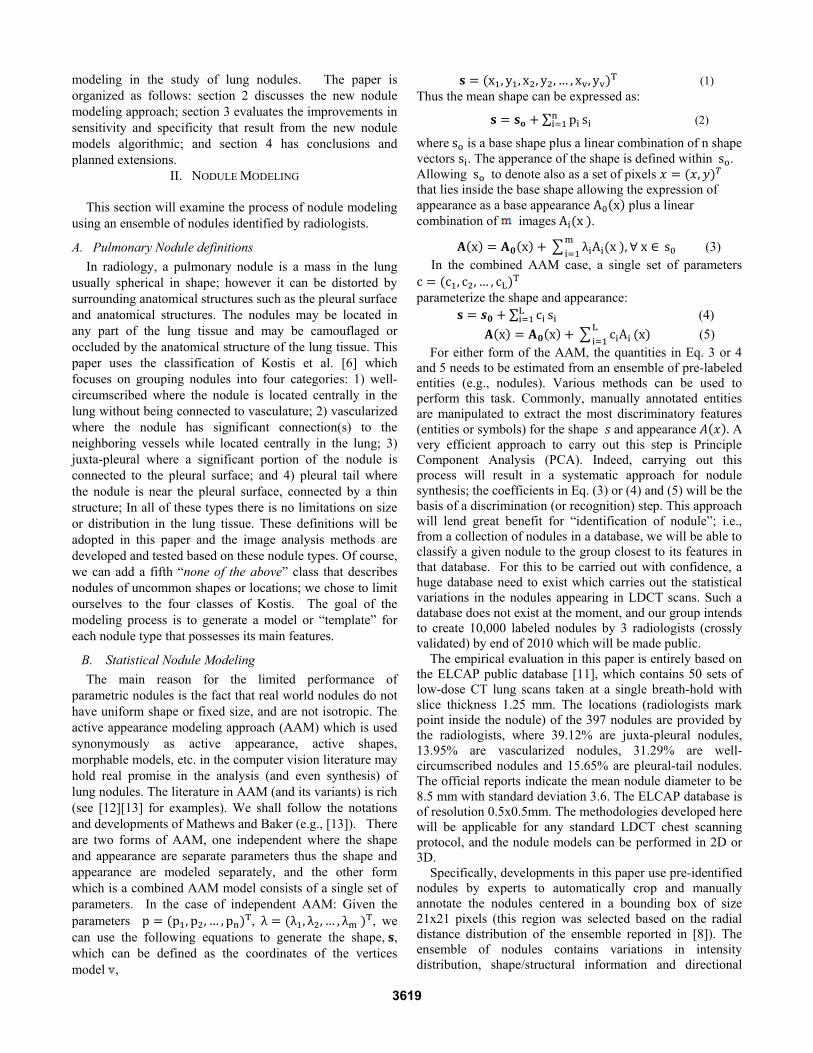
Fig. 2 shows the resultant nodule models based on the
average of shape and texture from the Procrustes approach
and average shape from the vector level sets approach. Note
that these templates possess the major shape and intensity
characteristics of the nodules of each category. Indeed,
these characteristics are behind the significant improvement
in the sensitivity and specificity when these templates were
used for nodule detection. The shapes (Fig. 2 lower part)
may be filled using the equations in [7][8] that relates the
intensity as function of the radial density. In this paper, we
show only results based on the combined shape and texture
models.
Fig. 2. Nodule models using the mean shape and texture of co-registered
nodules in an ensembles of size 24 per nodule type. First row is resultant
nodule models based on the average of shape and texture from the
Procrustes approach, and second row is the average shape from the vector
level sets approach.
III. NODULE DETECTION AND PERFORMANCE EVALUATION
The nodule detection step may be carried out by a variety
of methods including matched filtering, correlation filtering
and template matching. The focus of this paper is not on the
detection mechanism per se; the focus is on creating the
nodule templates that may be applicable to any detection
approach. The results in this paper are for the template
matching using the normalized cross correlation (NCC) as
the similarity measure. Template matching is performed
using the four mean shapes developed in the modeling stage
as the templates for detection. The behavior of the
Normalized Cross-Correlation (NCC) for the new templates
was studied by obtaining the NCC over all slices in the
ELCAP study with known ground truth for each nodule.
The sensitivity is measured in terms of detection rate, and
the specificity is measured in terms of correct classification
of detected nodules. Fig. 3 shows the performance of nodule
models when applied to nodule detection using the NCC as
similarity criterion. Of particular focus in this paper is the
specificity: is the detected nodule the right nodule type? The
new models in Fig. 2 outperform any parametric models in
terms of sensitivity (detection rate) and most importantly in
specificity. Figure 4 shows histogram of the NCC for the
new models. Various methods can be used for an optimal
thresholding. A threshold of 0.5 was selected. Table 1 shows
the results with templates centered with respect to the x-axis
(i.e., zero orientation). The performance of the model-based
approach is much more robust than the parametric templates.
Most important is the specificity, especially with the well-
circumscribed nodule types which are nearly isotropic,
hence would favor the circular (spherical in 3D) nodule in
terms of detection. The improvement in the template
matching using the new templates is very significant. It takes
into account the specifics of the data in terms of nodule
shape and intensity distribution. The results are expected to
be further enhanced using larger ensemble sizes. Likewise,
involvement of several radiologists to create the ensemble
may also lead to further improvements.
Fig. 3. Performance of nodule models when applied to detection using the
NCC as similarity criterion. The results reflect the specificity gains using
the new models (dot is centroid).
3620

Fig. 4. Histogram of the NCC values as the templates are swept across
the image in a raster fashion). The NCC decays much faster with the
templates of the new models vs. parametric templates.
Table 1. Sensitivity and Specificity of new the nodule models vs.
parametric templates. Detection was performed as average of simultaneous
application of four templates (Fig. 2 upper row). Parametric templates used
were circular and semi-circular in the four quadrants.
Nodule Type
Results of the data-driven
nodules of size 21x21 pixels
with main medial axis of
templates parallel to the x-axis
(orientation = 0 o)
Parametric Templates
with Radius = 10 and
single orientation (0 o) for
semi-circular models.
Sensitivity Specificity Sensitivity Specificity
Average of all nodule
types
85.22% 86.28% 72.16% 80.95%
Well-Circumscribed 69.66 % 87.10 % 49.44% 81.72%
Vascularized 80.4 % 87.0 % 70.73% 84.17%
Juxta-Pleural 94.78 % 86.54 % 83.48% 79.59%
Pleural-Tail 95.65 % 83.33 % 89.13% 79.33%
ASM can be used for segmentation of the detected
nodules; i.e., outlining the spatial support of the detected
nodules. We would like also to point out that a fifth category
of nodules “none of the above” may be added to the four we
studied in this paper. The database that our group is
currently generating allows for additional nodule types,
which will further improve the specificity of the nodule
detection process. We also have both 2D (for small size
nodules) as well as 3D for larger size and advanced stage
tumors.
IV. CONCLUSION
In this paper, a data-driven approach was devised to
model and simulate typical lung nodules. Based on extensive
experimentation we found that the new data-driven models
yield an overall higher sensitivity and specificity rate than
parametric templates. The well-circumscribed nodule was
the least sensitive nodule, yet it yielded the greatest
improvement using the new nodule models. The pleural tail
in both the parametric and data-driven templates yielded the
greatest sensitivity. Current efforts are directed towards
constructing and testing the new data-driven modeling
approach on a large clinical data base and extend this work
into the 3D space. Extensions include using the new models
for recognition using shape context matching (e.g., [16]),
and study of the shape and texture for simultaneous
detection and segmentation of cancerous nodules.
V. REFERENCES
1. United States National Institute of Health www.nih.gov
2. Zaho, B, Gamsu, G., Ginsberg, M., Jiang, L and. Schwartz, L
―Automatic Detection of small lung nodules on CT utilizing a local
density maximum algorithm,‖ J. of Applied Clinical Medical Physics 4
(2003).
3. Armato, S. G. 3rd, Giger, M. L., Moran C. J., Blackburn, J. T., Doi, K.,
MacMahon H.: Computerized detection of pulmonary nodules on CT
scans. Radio Graphics 19 pp.1303--1311 (1999).
4. Hu, S., Hoffman, E.A. and Reinhardt, J.M., ―Automatic lu1ng
segmentation for accurate quantitation of volumetric X-ray CT images,‖
IEEE Transactions on Medical Imaging, Vol. 20, pp. 490–498, 2001.
5. Lee, Y., Hara, T., Fujita, H., Itoh, S., and Ishigaki, T. ―Automated
Detection of Pulmonary Nodules in Helical CT Images Based on an
Improved Template-Matching Technique,‖ IEEE Transactions on
Medical Imaging, Vol. 20, 2001.
6. Kostis, W.J., Reeves, A.P., Yankelevitz, D.F., and Henschke, C.I., ―Three
dimensional segmentation and growth-rate estimation of small
pulmonary nodules in helical CT images,‖ Medical Imaging IEEE
Transactions Vol. 22, pp. 1259—1274, 2003.
7. Farag, A.A., El-Baz, A., Gimel'farb, G.L., Falk, R., Abou El-Ghar, M,
Eldiasty, T. and Elshazly, S., ―Appearance Models for Robust
Segmentation of Pulmonary Nodules in 3D LDCT Chest Images,‖ Proc.
of Int. Conf. on Medical Image Comp. and Computer-Assisted
Intervention (MICCAI'06), Copenhagen, Denmark, October 1-6, 2006,
pp. 662-670.
8. Farag, A.A., Elhabian, S.Y., Elshazly, S.A., and. Farag, A.A.
―Quantification of Nodule Detection in Chest CT: A Clinical
Investigation Based on the ELCAP Study,‖ Proc. of Second
International Workshop on Pulmonary Image Processing in conjunction
with MICCAI-09, September 2009, pp. 149-160.
9. van Ginneken, B., Romeny, B., and Viergever, M. ―Computer-Aided
Diagnosis in Chest Radiography: A Survey,‖ IEEE Transactions on
Medical Imaging, Vol. 20, 2001.
10. Sluimer, I., Schilham, A., Prokop, M., and van Ginneken, B. ―Computer
Analysis of Computed Tomography Scans of the Lung: A Survey,‖
IEEE Transactions on Medical Imaging, vol. 25, No. 4, pp. 385–405,
April, 2006.
11. ELCAP public lung image databse
12. Cootes, T.F. and Taylor, C.J.,. ―Active Shape Models and the Shape
Approximation Problem‖ Computer Vision, 2000.
13. Matthews, I. and Baker, S. ―Active Appearance Models Revisited‖.
International Journal of Computer Vision, pp. 135-164, 2004
14. Stegmann, M.B. and Gomez.,D.D. A Brief Introduction to Statistical
Shape Analysis, Technical University of Denmark, Lyngby, 2002.
15. Huang, X., Paragios, N. and Metaxas, D.N. ―Shape registration in
implicit spaces using information theory and free form deformations,‖
IEEE Transactions on Pattern Analysis and Machine Intelligence,
28(8):1303–1318, 2006.
16. S. Belongie, S, Malik, J., and Puzicha, J., ― Shape matching and object
recognition using Shape contexts,‖ IEEE Transactions on Pattern
Analysis and Machine Intelligence, 24(24):509–522, 2002.
3621