Embed Size (px)
Citation preview
2005 ABAQUS Users’ Conference 1
Modeling of Soil-Structure Interaction between Railway Bridge and Soil
Mauri Koskinen, VR-Track Ltd., Finland Abstract: With tendence to obtain further information of soil structure interaction between railway bridge and surrounding soil, a particular study on the support of Finnish Railway Administration was raised on January 2004. This presentation gives information about the numerical analysis of the issue, although literature survey as well as full scale on-site field tests were carried out also in this context. The main loading type in the tests and analyses was the braking load, although jacking tests were conducted as well. Particular interest was pointed to the section at the end of a bridge. The system consisting of end plate, backfill, transition slab and concerning track-sleeper-ballast section was particularly researched. The created FEM-model with DOF = 46077 consisting mainly of standard solid elements was used to find out the complex phenomena that take place in the sections presented above. Longitudinal stiffness of the bridge, earth pressures and deviation of partial stiffnesses on the bridge system were studied. Sensitivity analyses on the variation of soil and ballast properties were conducted as well. Abaqus-software was applied in these analyses.
Keywords: Geomechanics, FEM-modeling, Railway Bridge, Soil-Structure Interaction
1. Introduction
The behavior of a railway bridge under loads due to locomotives and it’s cars is a complex phenomenon. The structural parts of a bridge are generally rigidly connected to each other and basically supported by constructed soil layers around the system. The bridge system consists of following parts:
• Rails (generally continuously welded)
• Sleepers

2 2005 ABAQUS Users’ Conference
• Track ballast
• Bridge deck, columns and end plates
• Backfill and soil embankment behind the end plate
The train load causes londitudinal, transversal and vertical loads while running over a bridge structure. These loads are transferred according to stiffnesses of the structural parts of a bridge. So far no covering software or method is created except numerical finite element method to simultaneously analyze the effects of these parts.
2. The tested bridge and ground conditions
The bridge (Figure 1) is located in the half way between the new line Kerava – Lahti in Southern Finland. It is a three span (8 + 12 + 8 m) continuos concrete slab bridge with all columns supported by concrete footings. The total length is 34 m with effective width equal to 11.9 m. There are two tracks on the bridge. Both ends consist long transition slabs of 5 m in length. Particular hydraulic jacks were assembled in order to control the connection between transition slabs and the end plates. The vertical distance between rails and footings is approximately 9 m.
Figure 1. The tested and analyzed bridge.
2005 ABAQUS Users’ Conference 3
The ground conditions were analyzed on the basis of weight soundings, dynamic probings, drillings and a number of test samples analyzed in geotechnical laboratory. The conditions affecting the behavior of the bridge system were, however, constructed friction soil layers providing thus proper basis to construct on (see Table 1).
3. Finite element modeling of the bridge system
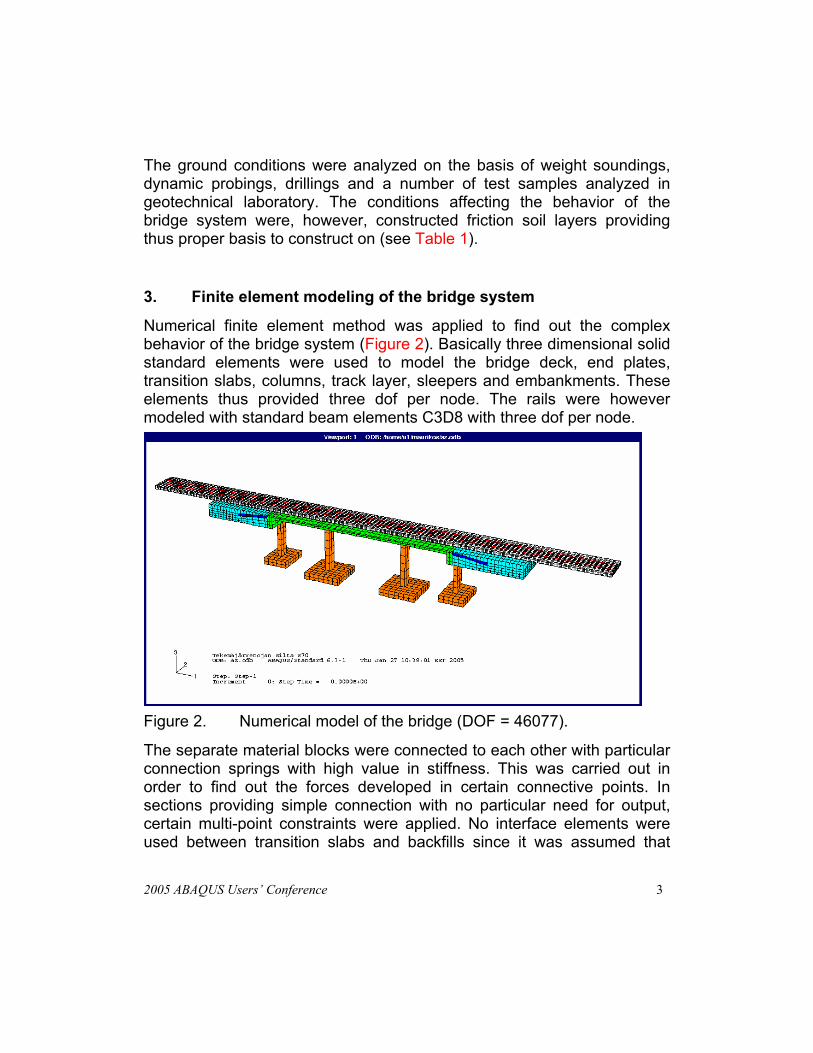
Numerical finite element method was applied to find out the complex behavior of the bridge system (Figure 2). Basically three dimensional solid standard elements were used to model the bridge deck, end plates, transition slabs, columns, track layer, sleepers and embankments. These elements thus provided three dof per node. The rails were however modeled with standard beam elements C3D8 with three dof per node.
Figure 2. Numerical model of the bridge (DOF = 46077).
The separate material blocks were connected to each other with particular connection springs with high value in stiffness. This was carried out in order to find out the forces developed in certain connective points. In sections providing simple connection with no particular need for output, certain multi-point constraints were applied. No interface elements were used between transition slabs and backfills since it was assumed that

4 2005 ABAQUS Users’ Conference
actual sliding would take place in the surface elements of the “weaker” element block. Details of modeling are shown in Figure 3.
Figure 3. Details of the bridge model.
The backfill (Figure 4) in width is large enough to represent sufficient dimensions to function properly even in non-linear analysis. Wing walls are not physically modeled, but their functional effects are taken into account with boundary conditions.
Figure 4. Details of the backfill block (inclined transition slab in blue).

2005 ABAQUS Users’ Conference 5
The backfill material was linear in break load test simulations, while in jacking test simulations they were non-linear due to relatively large strain levels. In order to model the contact between the lower surface of the backfill and the soil layer underneath, particular frictional and vertical contact springs were assembled in the “interface” surface.
In order to simulate continuity along the boundaries of blocks, elastic foundation elements were applied to the sides of these blocks. Elastic elements with stiffness values representing infinite behavior were also assembled to the ends of the rails.
The effects of soil around columns were modeled with elastic lateral soil springs, that affect on their corresponding nodes.
The total number of degrees of freedom was dof = 46077. The model was 71 m in length. Single symmetry line was applied to the center of the bridge, since the actual load acted on both tracks.
4. Initial data for the analysis
Initial data for the analysis were defined on the basis of general knowledge concerning the behavior of soil materials in stress state. Table 1 shows the applied basic data.
Table 1. Initial data for the analysis. *) stabilized Elastic modulus E (MPa) Poisson’s ratio ν ( ) Friction angle φ ( o ) Concrete 30000 *) 0.22 - - - - - Rails UIC 60 210000 0.3 - - - - - Backfill 100 **) 0.30 42 Ballast 100 … 180 ***) 0.3 - - - - -
*) average **) crushed rock, covering layer against earth pressure transducers on end plate → crushed
gravel 0 … 64 ***) upper limit: stabilized ballast

6 2005 ABAQUS Users’ Conference
5. Results of analysis
5.1 Break load tests
For these analyses the loads were applied to the nodes of rails that represent the location of fully loaded cargo cars on the track. The longitudinal total load was equal to Ftot = 275 kN. Vertical load equal to 750 kN was present as well.
Estimation of longitudinal displacements of the rails and deck are given in Figure 5. The displacement of the rails were 0.16 mm … 0.18 mm. The displacements of the deck was approximately 85 % of that in the rails.
Figure 5. Estimated longitudinal displacements in rails, horizontal axes: displacement in rails, vertical axes: longitudinal load in rails, lines in Figure: dark blue and green → rails, light blue and red → deck.
Figure 6 shows stresses in the rails giving values equal to 3.8 MPa (compressive stress), which corresponds to an axial force F = 29.2 kN. It can also be stated, that at the distance 18 m from the support T4 almost one third of stresses are still remaining (not shown here). Thus approximately 2 % of these stresses are vanished by every sleeper. The analysis also shows, that at the end of the track stresses are still remaining thus leading to a conclusion, that elements simulating “infinite” effects are needed at these ends. Depending on the location of the single wheel, output of stresses may provide positive and negative values.

2005 ABAQUS Users’ Conference 7
Figure 6. Estimated stresses in rails, horizontal axes: stresses in rails, vertical axes: longitudinal load in rails, lines in Figure: dark blue → towards center of bridge from support T4, light blue and red → outwards from bridge from support T4.
To provide an estimation for the inclination of the end plate, Figure 7 shows values of longitudinal displacements in nodes of end plate elevation. It may be seen, that the difference in longitudinal displacements is approximately 0.032 mm thus giving an estimation of inclination equal to 1.6E-5 rad. The longitudinal displacement at the lower edge is ~ 80 % of that at the upper edge.
Figure 7. Longitudinal displacements of end plate nodes, horizontal axes: longitudinal displacements of end plate, vertical axes: longitudinal load in rails, lines in Figure: light blue → bottom edge, orange → deck level.
8 2005 ABAQUS Users’ Conference
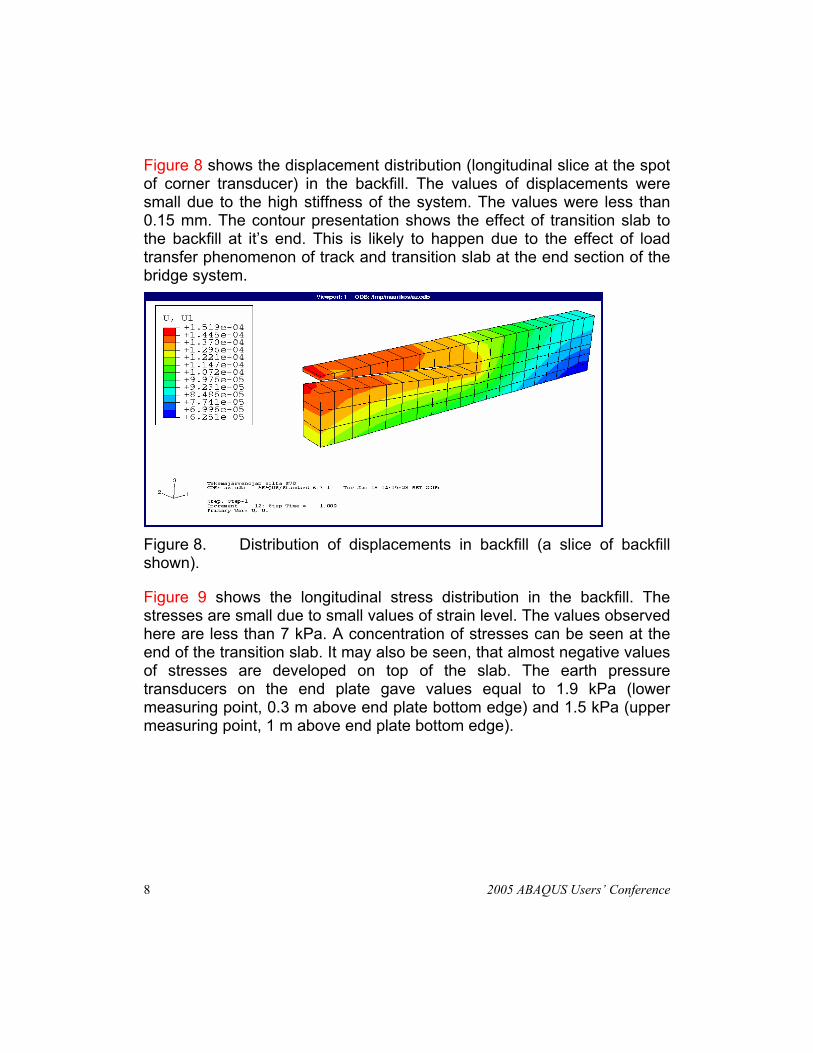
Figure 8 shows the displacement distribution (longitudinal slice at the spot of corner transducer) in the backfill. The values of displacements were small due to the high stiffness of the system. The values were less than 0.15 mm. The contour presentation shows the effect of transition slab to the backfill at it’s end. This is likely to happen due to the effect of load transfer phenomenon of track and transition slab at the end section of the bridge system.
Figure 8. Distribution of displacements in backfill (a slice of backfill shown).
Figure 9 shows the longitudinal stress distribution in the backfill. The stresses are small due to small values of strain level. The values observed here are less than 7 kPa. A concentration of stresses can be seen at the end of the transition slab. It may also be seen, that almost negative values of stresses are developed on top of the slab. The earth pressure transducers on the end plate gave values equal to 1.9 kPa (lower measuring point, 0.3 m above end plate bottom edge) and 1.5 kPa (upper measuring point, 1 m above end plate bottom edge).

2005 ABAQUS Users’ Conference 9
Figure 9. Distribution of estimated longitudinal stresses in backfill (a slice of backfill shown).
The values of the two soil spring (- 0.9 m and - 1.8 m from bottom edge of end plate) forces simulating the earth pressure against the columns are presented in Figure 10.
Figure 10. Spring forces against columns, horizontal axes: column soil spring forces at support T4, vertical axes: longitudinal load in rails, lines in Figure: light blue → -0.9 m from bottom edge of end plate, red → -1.8 m from bottom edge of end plate.

10 2005 ABAQUS Users’ Conference
Figure 11 in turn gives an estimation of the connection force between end plate and transition slab. This connection force presents the reaction force of the three hydraulic jacks assembled between the end plate and the transition slab. Particular truss elements T3D2 were used to model this behavior. The estimated force was found equal to 4.2 kN (compressive), while the one in the test was 8.3 kN.
Figure 11. Connection forces in hydraulic jacks, horizontal axes: force in hydraulic jack, vertical axes: longitudinal load in rails.
5.2 Variation of stiffness in the bridge-soil -system
One major goal in the analysis was to find out the deviation of stiffnesses between structural parts and soil in the bridge system. This was conducted by removing the stiffness of each part of the system at the time and calculating the remaining stiffness. According to this observation following shears were defined:
• Backfill 7.3 %
• Rails 25.2 %
• Transition slabs 32.7 %

2005 ABAQUS Users’ Conference 11
• Columns with soil reactions 34.8 %
The analyses also involved information about longitudinal stiffness of the system for break loads. It was observed that values up to 1700 MN/m would occur in such a system. However, a separate analysis carried out by a single sleeper-ballast -system (Figure 12) gave stiffness equal to 160 MN/m in similar type of analysis. It was also found out that displacements and forces in the rails would vanish at distance ~ 0.25 x length of bridge measured from support T4.
Figure 12. Particular FEM-simulation of single sleeper-ballast -system.
5.3 Sensitivity analysis of geotechnical initial data
Since geotechnical data is not clear to be defined accurately, a need for sensitivity analysis is essential. This is also affected by the fact, that vertical loads and structural stabilization of track ballast clearly improve the modules. Similar effects would occur in backfill blocks as well. Figure 13 shows the results of these observations. The effects are presented as a function of longitudinal displacements.

12 2005 ABAQUS Users’ Conference
Figure 13. Results of sensitivity analysis, upper line → Ebackfill = 100 MPa, lower line → Ebackfill = 200 MPa.
5.4 Internal jacking load test
In this test a force equal to F = 100 kN was applied to all of the three hydraulic jacks assembled between end plates and transition slabs at both ends. The finite element simulation was conducted by truss elements T3D2, that were loaded by corresponding amount of temperature. Yielding of soil was allowed due to large strain (displacement) levels. This caused a separation of 1.76 mm at jack end nodes in the analysis, when the end plate and transition slab moved away from each other. This is presented in Figure 14.
Effect E -modulus(ballast and backfill)
0,1500,1550,1600,1650,1700,1750,1800,1850,190
50 100 150 200
E -modulus of ballast (MPa)
Long
itudi
nal
disp
lace
men
t at s
uppo
rt
T4 (m
m)

2005 ABAQUS Users’ Conference 13
Figure 14. Displacements of hydraulic jack ends in the internal test, horizontal axes: displacements of jack end nodes, vertical axes: force in hydraulic jack, lines in Figure: light blue → end node of end plate, red → end node of transition slab.
6. Observations of the analyses and conclusions
These numerical analyses are verified by a series of corresponding on-site full scale tests. Matters, like displacements, stresses in rails and backfill were compared to each other. Generally it may be stated, that no major differences between tests and simulations were observed.
This analysis model (Figure 2) is developed for simulations of tests for this particular bridge. Symmetry was utilized in this context, since the load in the tests were applied on both tracks.
It may be stated, that most likely the applied element types were suitable to function properly. The multi-point constraints were applied to connect separate element block to each other. This was applied to blocks containing different type of dof nodes also. The Abaqus-software proved a proper tool for such analyses.

14 2005 ABAQUS Users’ Conference
7. References
1. Koskinen, M., “Horizontal capacity of steel pipe pile”, II YGEC, Oxford, 1998. 2. Koskinen, M., “Soil-structure Interaction of jointless bridges on piles”, Proc. of the
Fourteenth Int. Conf. on Soil Mechanics and Foundation Engn., Hamburg 6-12 Sept. 1997. Vol. 2. Rotterdam, A.A. Balkema. p. 1091-1096.
3. Koskinen. M., “Soil-structure Interaction of Jointless Bridges on Piles”, Vortragsreihe an der Technischen Universitat Graz im Wintersemester 1997/8.
4. Koskinen. M., “Soil-structure Interaction of Jointless Bridges on Piles”, Ph.D thesis, Tampere University of Technology, Geotechnical laboratory, 1997. 184 p.
5. Koskinen, M., Day, R., “Modelling of Cyclic Soil-structure Interaction of Piles for the Elementary Soil-spring-model”, Visiting academic research report, University of Queensland, Brisbane, Australia. 17 pp. 11/2002.