Embed Size (px)
Citation preview

This document is downloaded from DR‑NTU (https://dr.ntu.edu.sg)Nanyang Technological University, Singapore.
Modeling of reinforced concrete sub‑frame undercyclic load reversals
Khoo, Jyh Hao; Li, Bing
2007
Khoo, J. H., & Li, B. (2007). Modeling of reinforced concrete sub‑frame under cyclic loadreversals. Journal of Earthquake Engineering, 11(2), 215‑230.
https://hdl.handle.net/10356/95998
https://doi.org/10.1080/13632460701221553
© 2007 A.S. Elnashai & N.N. Ambraseys. This is the author created version of a work that hasbeen peer reviewed and accepted for publication by Journal of earthquake engineering,Taylor & Francis. It incorporates referee’s comments but changes resulting from thepublishing process, such as copyediting, structural formatting, may not be reflected in thisdocument. The published version is available at:http://dx.doi.org/10.1080/13632460701221553.
Downloaded on 10 Oct 2021 14:19:54 SGT

Journal of Earthquake Engineering, 11:215–230, 2007Copyright © A.S. Elnashai & N.N. AmbraseysISSN: 1363-2469 print / 1559-808X onlineDOI: 10.1080/13632460701221553
215
UEQE1363-24691559-808XJournal of Earthquake Engineering, Vol. 11, No. 2, February 2007: pp. 1–25Journal of Earthquake Engineering
Modeling of Reinforced Concrete Sub-frame Under Cyclic Load Reversals
Modeling of Reinforced Concrete Sub-frameJ. H. Khoo and B. Li JYH HAO KHOO
Utraco Structural Systems Pte Ltd, Singapore
BING LI
School of Civil and Environmental Engineering, Nanyang Technological University, Singapore
A study of the strength and deformation characteristics of reinforced concrete structure under cyclicload reversals by means of a computational model is presented in this article. A beam-column sub-frame tested under reversed cyclic loading at NTU, Singapore was modeled and analyzed usingstrut-and-tie method to capture its cyclic hysteretic responses and to explore the possible force flowsfrom beam and column to the joint core. The model was developed based on crack patterns observedon the tested concrete specimen, and was analyzed using DRAIN-2DX. The modeling procedure fordifferent truss elements of the model is described herein. The analytical study reveals that the strut-and-tie method is capable of modeling to a satisfactory accuracy the cyclic hysteretic response of areinforced concrete structure observed in the full-scale test.
Keywords Strut-and-tie; Modeling; Cyclic; Computer Analysis
1. Introduction
The strut-and-tie approach is a physical method that involves modeling the reinforcedconcrete member as a truss structure. The complex stress fields inside the structural mem-bers when subjected to external forces are simplified into discrete compressive and tensileforce paths, which are represented, respectively, by compression struts and tension ties.The longitudinal reinforcement in a member represents the chords of a truss while thetransverse reinforcement serves as transverse ties. Concrete in the flexural compressionzone can also be considered as part of the longitudinal compression chord member. Thediagonal concrete compression struts, which discretely simulate the concrete compressivestress field, are placed to complete the static equilibrium of the truss. These struts and tiesare connected at rigid nodal points. With the aid of such a behavioral model, a better visu-alization and understanding of the internal force distribution and force transfer mecha-nisms are thus feasible.
The strut-and-tie modeling approach is not only capable of predicting the strength of alocalized region in a structure, but also equally applicable to predicting the strength of theentire structure. This method is also appropriate and effective in the analysis and detailingof complex structural regions. However, the utilization of this method to capture the non-linear inelastic and cyclic hysteretic responses of a concrete structure is rather limited. To
Received 27 April 2005; accepted 10 January 2006.Address correspondence to Bing Li, School of Civil and Environmental Engineering, Nanyang
Technological University, Singapore 639798; E-mail: [email protected]
Dow
nloa
ded
by [
Nan
yang
Tec
hnol
ogic
al U
nive
rsity
] at
01:
33 1
3 A
ugus
t 201
2

216 J. H. Khoo and B. Li
date, only limited literature on the cyclic strut-and-tie modeling procedures is available.Furthermore, there has been comparatively little experimental verification on its applica-tion. This article presents the continuation in the exploration of the cyclic strut-and-tiemodel, by integrating relevant modeling procedures from literature, and the experimentalevidences obtained from the test of a beam-column sub-frame at NTU by Khoo [2002].
The investigation reported herein comprises two parts. The first part presents the model-ing procedures for different regions in the tested sub-frame and several model formulationprocedures recommended by other researchers. The second part examines the developedmodel through a comparative study involving results from the experimental program. Themajor focus of this article is to demonstrate the capability of a strut-and-tie model in captur-ing the cyclic hysteretic response of a reinforced concrete structure tested under earthquake-type loading. The reversed cyclic load test on a beam-column sub-frame has produced ampledata, which is useful in providing experimental verification on the postulated cyclic strut-and-tie models. This investigation is also significant in assessing the effectiveness of thestrut-and-tie model in simulating the force paths and in computing the internal forces of amember subjected to reversed cyclic loading. The successful correlation achieved betweenthe analytical and experimental results reveals great potential in implementing the strut-and-tie modeling approach in seismic analysis and design of reinforced concrete structures.
2. The Prototype Structure and Experimental Program
The tested specimen was a beam-column subassembly typical of a perimeter moment-resist-ing frame of a multi-storey building. It was an H-shaped full-scale prototype incorporatingexterior beam-column joints. Figure 1 illustrates the details of the specimen and the experi-ment set-up. The sub-frame was tested under quasi-static load simulating the seismic action.Equal lateral displacements were applied simultaneously to both columns, so as to induce inthe beam a bending moment similar to that generated under earthquake condition. The direc-tion of the lateral displacement was inter-reversed to generate a load reversal. Such a loadingcondition imposed a combined flexure and shear forces into the structure. The loading cycleswere evaluated in terms of displacement ductility factors, μD, which is defined as D /Dy,where D is the imposed lateral displacement. When the lateral load measured at the peak of aparticular load run dropped to less than 80% of the maximum load recorded in the precedingruns, failure was deemed to have occurred and this ended the reversed cyclic load test. Thevisible crack patterns at each displacement ductility level are depicted in Fig. 2. A detailedreview of this experimental study was presented elsewhere by Khoo et al. [2002].
3. General Model Development of the Tested Sub-frame
For a given loading system, there are several possible truss models. The most ideal modelis the one where the load is transferred from the loading point to the support through apossible force flow that closely matches the stress fields in a real structure. The beam-col-umn sub-frame is idealized as a series of concrete struts and steel ties interconnected atnodes to form a strut-and-tie model.
3.1 Model of Beam
A monolithic beam that is subjected to reversed cyclic loading should be divided into B- andD-regions. The critical regions of a beam under external forces are located at the beam-ends,where plastic hinging is likely to occur. These regions should be treated as D-region. Theportion spanning in between the both plastic hinge regions, in which cracking is scarce and
Dow
nloa
ded
by [
Nan
yang
Tec
hnol
ogic
al U
nive
rsity
] at
01:
33 1
3 A
ugus
t 201
2

Modeling of Reinforced Concrete Sub-frame 217
less inclined, is dictated as B-region. In this study, the postulation of struts and ties in thebeam plastic hinge regions was determined in correlation with the visible fan-shaped crackpatterns on the tested specimen, as pictured in Fig. 3a. In the D-region, the shear forces arecarried to the boundaries of the beam-column joint by a series of diagonal struts of variableangles. In the B-region, however, the contribution of concrete in carrying the beam shear
FIGURE 1 Beam-column sub-frame details and test set-up.
4T25
2T10
A
A
B B
SECTION A-A
SECTION B-B
5001,
070
1,07
0
300
50040
0
T10
-140
3T25
3T25
T10-120
2,500
500
300
400 T10
2T254T25
3T25
3T25
Dow
nloa
ded
by [
Nan
yang
Tec
hnol
ogic
al U
nive
rsity
] at
01:
33 1
3 A
ugus
t 201
2

218 J. H. Khoo and B. Li
force is significantly increased; the resulting concrete struts in this region become lessinclined. Figure 3b illustrates the strut-and-tie models of a beam under load reversal. Sincethe stirrup spacing is considerably smaller than the beam depth, there is a criss-cross forma-tion of the transverse ties and diagonal struts. Such a model is appropriate in representing theconditions of an extensively cracked member with closely spaced transverse reinforcement.
3.2 Model of External Beam-column Joint
The strut-and-tie model representing the stress fields within an external beam-columnjoint was developed based on the visible crack pattern and upon the understanding ofshear transfer mechanisms within a joint when subjected to earthquake-type loading. Thewell-known concrete strut and panel truss mechanisms proposed by Park and Paulay[1975] were referred as the basis for the positioning of compression struts in the joint. Asshown in Fig. 4a, main struts connecting the diagonally opposite corners of the joint panelform under load reversal. This is represented by corner-to-corner diagonal struts asdepicted in Fig. 4b. Besides that, an additional truss mechanism, acting with a compressive
FIGURE 2 Observed crack patterns at each displacement ductility level.
(b)
(c)
(d)
(a) At DF of 0.75
At DF of 1.0
At DF of 2.0
At DF of 3.0
Dow
nloa
ded
by [
Nan
yang
Tec
hnol
ogic
al U
nive
rsity
] at
01:
33 1
3 A
ugus
t 201
2

Modeling of Reinforced Concrete Sub-frame 219
stress field parallel to the major strut, transfers the remaining shear forces. This mecha-nism also involves the vertical and horizontal reinforcement. For simplicity, the transversereinforcement in the joint and the intermediate longitudinal bars of the column are lumped
FIGURE 3 Truss idealization of a beam.
(a) Crack pattern and reinforcement detail
(b) Corresponding model
B-region D-region D-region
FIGURE 4 Truss idealization of an exterior beam-column joint.
(a) Crack pattern and reinforcement detail
(b) Corresponding model
Dow
nloa
ded
by [
Nan
yang
Tec
hnol
ogic
al U
nive
rsity
] at
01:
33 1
3 A
ugus
t 201
2

220 J. H. Khoo and B. Li
into single horizontal and vertical ties, respectively. Short diagonal struts simulating thecompressive stress field were placed in parallel to the main strut and were interconnectedto the former horizontal and vertical ties to achieve a state of equilibrium.
3.3 Model of Column
In columns, besides the two chords that represent the outer longitudinal reinforcement, anadditional vertical chord is placed at the centre of the column to simulate the contributionof intermediate bars. This is important to achieve a more idealized simulation and to createforces equilibrium in the beam-column joint region. Figure 5 shows a combination of allthe individual strut-and-tie models under cyclic load reversal.
4. Detailed Modelling and Material Properties
4.1 Longitudinal Tension and Compression Chords
The longitudinal chords of a strut-and-tie model can be subjected to tensile or compressivestresses under load reversal. To et al. [2000] developed a unified model which is able tosimulate the combined axial characteristic of concrete and steel under tension andcompression. Such an idealized uniaxial fibre model consists of two uniaxial elements,namely the link element and the truss element, which can be modeled using DRAIN-2DX[1993]. By developing a gap, the link element is employed to perform as a concrete mem-ber that carries no tension force while the truss element acts as a typical steel bar capableof sustaining both tensile and compressive forces. The stress-strain characteristics of bothelements are represented with bilinear approximations. An illustration of To's model isgiven in Fig. 6.
This unified model was employed as the top and bottom chords of the strut-and-tiemodel in this study. Accordingly, full closure of previously generated flexural cracks isnot possible due to wedging effect by the dislocated aggregate and the development oftruss mechanism after cracking. This makes the concrete not effective in carrying com-pression. The compression reinforcement will then carry most of the compressive forceand thus, the internal lever arm in a beam section will be adjusted to the distance betweenthe force centroids of the top and bottom steel bars. As such, the chord members are
FIGURE 5 Truss idealization of the entire sub-frame under cyclic load reversal.
Dow
nloa
ded
by [
Nan
yang
Tec
hnol
ogic
al U
nive
rsity
] at
01:
33 1
3 A
ugus
t 201
2

Modeling of Reinforced Concrete Sub-frame 221
suggested to be placed in the corresponding steel centroids. Readers are referred to relevantpublications, e.g., To et al. [2000, 2001] for the formulation of equivalent cross-sectionalarea for tension and compression chords adopting the idealized uniaxial fibre model.
Various researches has revealed that an overestimation of the strength and stiffness iscommon in any truss modeling analogy if the failure stress of the concrete is assumed tobe the uniaxial compressive strength of standard concrete cylinders, f'c. The compressivestrength of concrete is affected by the presence of transverse stresses. Experimental resultsfrom Schlaich et al. [1987] showed that a 15% reduction of concrete compressive strengthis conceivable for reinforced concrete prisms in which the steel was previously subjectedto high inelastic strain. Therefore, such a reduction is required for chord members in thebeam to consider the adverse effect due to reversed cyclic loading. In this study, additional15% strength reduction is specified to represent the average compressive stress in the con-crete of an actual beam section. As a result, the effective concrete compressive strength ofthe uniaxial compression chords was taken as 0.72 f'c.
For the uniaxial tension chords, only longitudinal reinforcement was defined to carrythe tensile force. The common bilinear stress-strain relationship for steel was assigned, byconsidering the commonly assumed value for steel elastic modulus, Es=200,000 MPa, anda strain hardening ratio of 0.5%. The actual yielding stress, fy and strain, εy were measuredthrough tensile test.
4.2 Transverse Ties
For simplicity, several stirrups were lumped and represented by a single tension tie ofequivalent cross-sectional area of the representing stirrups. The experimentally measuredyield strength, fvy, of the stirrups was adopted for the ties. The values of elastic modulusand strain hardening ratio as assumed for the longitudinal tension chords were alsoemployed for transverse ties. The concrete contribution in carrying shear force wasignored.
4.3 Diagonal Struts
The cross-sectional area of struts in D-region was determined based on the geometry ofthe truss model, as shown in Fig. 7. The perpendicular distance, lp, between the diagonalstruts, taken at the mid-depth of the beam, was multiplied by the sectional width, bw, of thebeam, to calculate the idealized effective cross-sectional area of struts in D-region. InB-region, where struts inclined at a constant angle, lp was determined by multiplying thedistance between two transverse ties and the sine value of the strut inclination angle, q.
The concrete compressive strength, f'c, was taken as the available strength for diago-nal struts with a softening factor. For diagonal struts located in the plastic hinge region,
FIGURE 6 The idealized uniaxial fibre model by To et al. (2000).
Steel bar (truss element)
Concrete (link element)
(a) Idealized uniaxial fibre (b) Model subjected to axial compression
(c) Model subjected to axial tension
Dow
nloa
ded
by [
Nan
yang
Tec
hnol
ogic
al U
nive
rsity
] at
01:
33 1
3 A
ugus
t 201
2

222 J. H. Khoo and B. Li
Schlaich et al. [1987] recommended a softening factor of 0.34 to recognize the potentialdevelopment of significant inelastic strain in the transverse reinforcement. For strutslocated in regions where minor cracking is expected, such as in the B-region, a compres-sive strength of 0.68f'c had been assumed by To et al. [2000].
5. Nonlinear Element Analysis
The inelastic truss bar element from the DRAIN-2DX library was adopted to represent thesteel reinforcement. This type of element can only transmit axial load. The force-deforma-tion relationship defined for the truss bar element is illustrated in Fig. 8a. On the otherhand, link element was used to simulate the concrete members. It is also a simple inelasticbar element that resists only axial force, but can be specified to act either in tension orcompression. The link element was defined as a compression element to represent the con-crete behavior; it has finite stiffness in compression and prescribes ‘gap opening’ in ten-sion. Figure 8b describes the force-displacement relationship of a link element. Theunloading path for link elements in this model was specified to be in an inelastic manner.To simulate an identical cyclic loading sequence as applied to the beam-column sub-frame, a displacement-controlled approach predefined in DRAIN-2DX was adopted.
6. Analytical Results — Reversed Cyclic Hysteretic Response
The cyclic hysteretic response of the strut-and-tie model representing the beam-columnassembly is plotted in Fig. 9. Also encompassed in the figure is the responses measuredfrom the test. These responses are presented with respect to the displacement ductility fac-tors, mD. Critical events detected by DRAIN-2DX were highlighted on the hysteresisloops. The corresponding locations where these events took place and the sequence ofoccurrences are depicted in Fig. 10.
In the load cycles of mD=1, the truss model exhibited a perfect linear elastic load-dis-placement response, reflecting the actual behaviour of the tested sub-frame. In terms ofinitial elastic stiffness, the model yielded a reasonably good prediction, with an underesti-mation of only about 8% to that captured experimentally.
The analytical response of the model in the loading domain of mD=2 also showed aclose simulation to that recorded experimentally. A bilinear response was observed imme-diately after the onset of mD=1. The analytical output from DRAIN-2DX confirmed thatthis change was due to yielding of the longitudinal reinforcement chord denoted as 1; thisalso implied the formation of plastic hinges in the beam-end regions. In the reversed direc-tion, the longitudinal chords marked as 3 were found yielded in compression, causingsignificant stiffness degradation to the entire truss model. This was followed by yieldingof the longitudinal chords 4 and 5, corresponding to events 4 and 5 on the hysteresis loop.
FIGURE 7 Sizing of diagonal compressive struts.
D-region B-region
Mid-depth
θ
lp
Dow
nloa
ded
by [
Nan
yang
Tec
hnol
ogic
al U
nive
rsity
] at
01:
33 1
3 A
ugus
t 201
2

Modeling of Reinforced Concrete Sub-frame 223
It should be noted that the stiffness deterioration and strength degradation shown by sec-ond loop of the experimentally recorded response could also be attributed to the bond slip-page of the reinforcement and the formation of shear cracks; however, both of which wereunable to be considered in strut-and-tie modeling.
The hysteretic behavior of the analytical response in load cycles of mD=3 was typical ofthat described for mD=2. Critical events recorded in the analysis included the yielding of longi-tudinal chords in compression, as captured by events 6 and 9; and tension yielding, i.e., events7, 8, 10, and 11. In general, the analytical response indicated a somewhat satisfactory correla-tion to the experimental records except for minor overestimations in the strength capacity.
The last loop of load-displacement response generated by the truss model was notconsistent with the experimental result. The significant loss of strength and stiffness asobserved in the test could not be captured by the model. This is probably due to the com-plexity of the force transfer mechanism in the plastic hinge region upon the occurrence ofmajor failures, e.g., concrete crushing, bar slippage, and sliding shear deformations, all ofwhich were not included in the modelling procedure.
However, a sequential failure mechanism similar to that observed in the test could beaccurately detected by the model. Compressive yielding in the longitudinal chord (rein-forcement) developed first, i.e., event 12, followed by the yielding of the opposite chordsin tension, i.e., event 13. A noteworthy feature on this loop was event 14, which correctly
FIGURE 8 Force-displacement relationship for steel and concrete element (Prakashet al., 1993).
(b) concrete element
(a) steel element
Dow
nloa
ded
by [
Nan
yang
Tec
hnol
ogic
al U
nive
rsity
] at
01:
33 1
3 A
ugus
t 201
2

224 J. H. Khoo and B. Li
FIGURE 9 Comparison between experimental and analytical hysteretic responses at dif-ferent displacement ductility factors.
Experimental
–350
–250
–150
–50
50
150
250
350
Lateral Displacement (mm)
Ktest
= 10.53 kN/mm
Kanal
= 9.69 kN/mm
Analytical
Lateral Displacement (mm)
(a) At load cycles of μΔ = 1
(b) At load cycles of μΔ = 2
(c) At load cycles of μΔ = 3
Experimental
–350
–250
–150
–50
50
150
250
350
Lateral Displacement (mm)
Analytical
Lateral Displacement (mm)
12
4
3
5
Experimental
–350
–250
–150
–50
50
150
250
350
Lateral Displacement (mm)
Analytical
–350
–250
–150
–50
50
150
250
350
–350
–250
–150
–50
50
150
250
350
–350
–250
–150
–50
50
150
250
350
Lateral Displacement (mm)
6
7
10
9
8
11
Tota
l Lat
eral
Loa
d (k
N)
Tota
l Lat
eral
Loa
d (k
N)
Tota
l Lat
eral
Loa
d (k
N)
Tota
l Lat
eral
Loa
d (k
N)
Tota
l Lat
eral
Loa
d (k
N)
Tota
l Lat
eral
Loa
d (k
N)
–80 –40 0 40 80 –80 –40 0 40 80
–80 –40 0 40 80 –80 –40 0 40 80
–80 –40 0 40 80 –80 –40 0 40 80
Dow
nloa
ded
by [
Nan
yang
Tec
hnol
ogic
al U
nive
rsity
] at
01:
33 1
3 A
ugus
t 201
2

Modeling of Reinforced Concrete Sub-frame 225
reflected the yielding of transverse reinforcement in the plastic hinge region at the finalstage of the simulated seismic load test. A direct implication of yielding in the transversereinforcement is the occurrence of large shear deformation, as observed in the plastic
FIGURE 9 (Continued).
Experimental
–350
–250
–150
–50
50
150
250
350
–350
–250
–150
–50
50
150
250
350
–80 –40 0 40 80 –80 –40 0 40 80
Lateral Displacement (mm)
Tot
al L
ater
al L
oad
(kN
)
Tot
al L
ater
al L
oad
(kN
)
Analytical
Lateral Displacement (mm)
15
1413
12
16
(d) At load cycles of μΔ = 4
FIGURE 10 Critical events recorded for steel members in the model.
3
45
9
1011
12
78
6
13
14
12
(c) At load cycles of μΔ = 4
(b) At load cycles of μΔ = 3
(b) At load cycles of μΔ = 2
Dow
nloa
ded
by [
Nan
yang
Tec
hnol
ogic
al U
nive
rsity
] at
01:
33 1
3 A
ugus
t 201
2

226 J. H. Khoo and B. Li
hinge regions of the sub-frame approaching the end of the test. In general, the strut-and-tiemodel has proven realistic not only in predicting the yielding of reinforcement in the criti-cal regions, but also the mode of failure of a beam-column sub-frame tested under simu-lated earthquake loading.
7. Analytical Results — Response of Individual Members
Further investigation was carried out to derive the analytical response of individualmembers in the strut-and-tie model under reversed cyclic loading. The analyticalresponses were compared to the corresponding experimental observations to validate therationality of the strut-and-tie model for cyclic behavior prediction. However, a perfectreplication to the experimental results in terms of strain prediction would not be antici-pated. The main reason is that the output from DRAIN-2DX was shown in element strainwhereas in a real test, only a single strain gauge was used to measure each localized strainin the reinforcement.
7.1 Response of Longitudinal Chord
Two longitudinal chords denoted as C1 and C2 were investigated, Fig. 11 illustrates theexperimental and analytical responses of these two members. The strains recorded in C1exceeded the yield limit after several cycles of load reversal. The yield strain as that
FIGURE 11 Response of the longitudinal chords under reversed cyclic loading.
Experimental
–350
–250
–150
–50
50
150
250
350
Local Strain
Tot
al L
ater
al L
oad
(kN
)T
otal
Lat
eral
Loa
d (k
N)
Tot
al L
ater
al L
oad
(kN
)T
otal
Lat
eral
Loa
d (k
N)
Analytical
–350
–250
–150
–50
50
150
250
350
Element Strain
yield point
Experimental–350
–250
–150
–50
50
150
250
350
–0.002 0 0.002 0.004 0.006 0.008 0.01
Local Strain
Analytical–350
–250
–150
–50
50
150
250
350
–0.004 0 0.004 0.008 0.012 0.016
Element Strain
yield point
C1 C2
C1
C2
–0.001 0.001 0.002 0.003 0.004 0.0050 –0.001 0.001 0.003 0.005 0.007
Dow
nloa
ded
by [
Nan
yang
Tec
hnol
ogic
al U
nive
rsity
] at
01:
33 1
3 A
ugus
t 201
2

Modeling of Reinforced Concrete Sub-frame 227
measured in the test was correctly predicted. The unloading path also followed a correcttrend in which a permanent strain of about 0.0045 was recorded upon removal of the totalload. C1 could no longer return to an unstrained state, implying the plastic behavior of asteel reinforcement. On the other hand, the chord located in the beam-end, C2, sustainedgreater inelastic strains, compared to C1. This reflected that the beam-end region alwayssuffers greater elongation after plastic hinging. In general, such an idealized response wastypical for a nonlinear material and it should be appreciated that the accumulated plasticdeformations in the member could also be captured.
7.2 Response of Transverse Tie
The load-strain response of the transverse tie designated as T1 is illustrated in Fig. 12.This tie represented the stirrups in the beam plastic hinge region. It is evident that thetransverse tie could properly capture the general behavior of a stirrup under load reversal.The stirrups were in tension and hence experienced elongation throughout the test; thetransverse tie behaved in a similar manner. The analytical responses confirmed that yield-ing occurred in the tie after several cycles of load reversal. It is also interesting to note thata nonlinear behaviour was accurately captured upon the yield strain at 0.002. Permanentstrains were found to remain in the tie after removal of the total load. The increase ininelastic tensile strain in the tie (stirrups) justified the widening of diagonal shear cracks inthe inelastic loading cycles of the test.
8. Analytical Results — Internal Forces of Individual Members
An effort to examine the distribution of the internal forces among the truss membersunder reversed cyclic loading was attempted. The forces were converted into stressesin a form proportional to the respective material strengths. Crack patterns capturedfrom the test were superimposed onto the truss model to better visualize the formationof trusses. To better differentiate among tension and compression members, the trussmembers were, respectively, represented by solid and dashed lines. It is noteworthythat the quantitative figures (forces and stresses) and qualitative features (line typesand crack patterns) were useful in explaining some of the behaviors observed duringthe test.
FIGURE 12 Response of the transverse ties under reversed cyclic loading.
Experimental
–350
–250
–150
–50
50
150
250
350
0 0.001 0.002 0.003
Local Strain
Analytical
–350
–250
–150
–50
50
150
250
350
0 0.002 0.004 0.006
Element Strain
yield point
T1
T1
Tot
al L
ater
al L
oad
(kN
)
Tot
al L
ater
al L
oad
(kN
)
Dow
nloa
ded
by [
Nan
yang
Tec
hnol
ogic
al U
nive
rsity
] at
01:
33 1
3 A
ugus
t 201
2
228 J. H. Khoo and B. Li
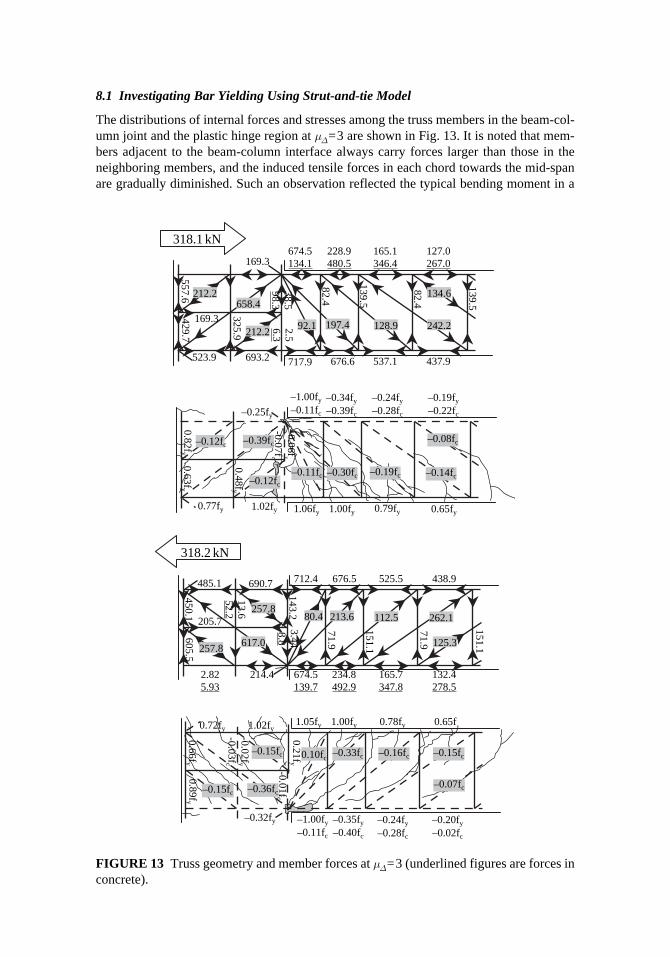
8.1 Investigating Bar Yielding Using Strut-and-tie Model
The distributions of internal forces and stresses among the truss members in the beam-col-umn joint and the plastic hinge region at mD=3 are shown in Fig. 13. It is noted that mem-bers adjacent to the beam-column interface always carry forces larger than those in theneighboring members, and the induced tensile forces in each chord towards the mid-spanare gradually diminished. Such an observation reflected the typical bending moment in a
FIGURE 13 Truss geometry and member forces at mD=3 (underlined figures are forces inconcrete).
–1.00fy
–0.11fc
–0.32fy –0.35fy
–0.40fc
–0.24fy
–0.28fc
–0.20fy
–0.02fc
1.05fy 1.00fy 0.78fy 0.65fy
fc10
.0-
fy12
.0
–0.15fc
–0.07fc
–0.16fc–0.33fc0.10fc–0.15fc
–0.15fc –0.36fcfy98
.0fy
6 6. 0
1.02fy 0.72fy
fy20
.0-
fc3 0
.0-
–0.11fc
0.77fy
–0.39fc
–0.25fy
–1.00fy
–0.11fc
–0.34fy
–0.39fc
–0.24fy
–0.28fc
–0.19fy
–0.22fc
f60.
0-y
f70.
0-c
–0.12fc
–0.12fc
fy84
.0
fy36
.0fy
28.0
1.02fy 1.06fy 1.00fy 0.79fy 0.65fy
–0.30fc –0.19fc –0.14fc
–0.08fc
318.1 kN
169.3
228.9480.5
165.1346.4
717.9 676.6 537.1
4.28
5.93
1
4.28
197.4 128.9
693.2523.9 437.9
242.2
134.65.
931
127.0267.0
212.2
212.2658.4
6.75
57.
924
9.52
3
169.3674.5134.1
5.83
3.89
5.2
3 .6 92.1
318.2 kN
234.8492.9
165.7347.8
132.4278.5
214.4 674.5139.7
712.4 676.5 525.5 438.9
205.7
9.17
1.15
1
9.17
1 .1 5
1
2 .3 4
1
1.05
45 .
5 06
617.0
257.8
257.8
80.4 213.6 112.5 262.1
125.3
485.1 690.7
44.38.8
2.825.93
6.31
2.25
Dow
nloa
ded
by [
Nan
yang
Tec
hnol
ogic
al U
nive
rsity
] at
01:
33 1
3 A
ugus
t 201
2

Modeling of Reinforced Concrete Sub-frame 229
beam of a frame subjected to lateral loads. The longitudinal tensile chords justifiablyyielded when the induced stress exceeded the nominal yield strength, fy. As indicated inthe stress distribution diagrams, steel tensile yielding only occurred in the two chords atthe beam-end, which spanned a distance almost equivalent to the effective beam depth, d.This was the region where plastic hinging took place.
On the other hand, the model could also satisfactorily capture the characteristics of thebeam compression chords. Figure 14 shows the distribution of stresses in the concrete andsteel along the beam compression chords at each ductility factor. One should be aware thatthe compression chords in the model were a combination of the steel and concrete compo-nents, as discussed earlier. It is interesting to note that the compressive forces could be dis-tributed between these two components. Up to the stage of mD=2, concrete contributedsignificantly in resisting the compression, which carried about 68% of the total inducedforce. However, at mD=3, compression carried by the steel increased tremendously until itreached the compressive yield limit. In contrast, only about 15% of the total compressiveforce was carried by the concrete. This implied that concrete has been stressed beyond itsultimate strain, causing the loss of its compressive strength and as a result, the longitudinalreinforcement received most of the induced compressive forces. In fact, concrete crushingwas observed at the beam-column interface when the sub-frame was loaded into mD=3.
9. Conclusions
The strut-and-tie model has been proven capable of capturing the general cyclic hystereticresponse of a reinforced concrete structure subjected to reversed cyclic lateral loading.Satisfactory correlation was observed in between the model-predicted hysteretic responseand that measured from the test, for the entire sub-frame as well as the individual truss ele-ments. The locations of reinforcement yielding, specifically of those in the plastic hingeregions, can be correctly captured by a strut-and-tie model. It is confirmed that the strut-and-tie method can be an effective tool for assessing the force and displacement demandson the various members of a structure under load reversal.
The strut-and-tie modeling procedures suggested by To et al. [2000] were proven tobe reliable in predicting the cyclic hysteretic response of a frame. The longitudinal tensionand compression chords of a reinforced concrete member can be represented by an ideal-ized uniaxial fibre model. The top and bottom chords of the strut-and-tie model for aseismic resistant structure are appropriate to be positioned in the corresponding steel cen-troid with recognition of the steel participation in resisting compression upon the loss ofconcrete strength after severe cracking.
FIGURE 14 Compressive stress ratio of steel and concrete in compression chords.
MODEL 1
–1.2
–1
–0.8
–0.6
–0.4
–0.2
0
Stre
ss R
atio
. f/f
y
+DF1(S)
+DF2(S)
+DF3(S)
+DF4(S)
+DF1(C)
+DF2(C)
+DF3(C)
+DF4(C)fc, fy
B-C Joint Region Plastic Hinge RegionC for Concrete
S for Steel
Dow
nloa
ded
by [
Nan
yang
Tec
hnol
ogic
al U
nive
rsity
] at
01:
33 1
3 A
ugus
t 201
2

230 J. H. Khoo and B. Li
There are still several limitations and deficiencies in the application of a rational strut-and-tie model in predicting the cyclic hysteretic response of a concrete structure, in partic-ular, the modeling of strength and stiffness degradation due to major failures such asbond-slippage of reinforcement, concrete crushing, and sliding shear deformations. One ofthe areas noteworthy for future research is the incorporation of bond-slip relationshipbetween the reinforcement and concrete into the tie element. It is also suggested that aforce-displacement relationship shall be defined for concrete tie in tension — the rapiddiminishing trend of tensile force in the concrete tie may have certain extent of implica-tion to the hysteretic response of the entire truss model. Besides, various softening factorsfor the reinforcement and concrete at different stages of loading, e.g., pre- and post-plastichinging, and at different ductility levels, deserve careful study in future.
References
Khoo, J. H. [2002]. Experimental and analytical studies on seismic behaviour of precast concretemoment-resisting frames with beam-to-beam connections, MEng Thesis, School of Civil andEnvironmental Engineering, Nanyang Technological University, Singapore.
Khoo, J. H., Li, B., and Yip, W. K. [2006] “Tests on precast concrete frames with connectionsconstructed away from column faces,” ACI Structural Journal, 103(1): 18–27.
Park, R. and Paulay, T. [1975]. Reinforced Concrete Structures. New York: John Wiley and Sons,Inc.
Prakash, V., Powell, G. H., and Campbell, S. [1993] “Drain-2DX – Base Programme Descriptionand User Guide (Version 1.10).” Report 93/17, Department of Civil Engineering, University ofCalifornia, Berkeley, CA.
Schlaich, J., Schäfer, K., and Jennewein, M. [1987] “Toward a consistent design of structural con-crete,” PCI J, 32(3): 74–150.
To, N. H. T., Ingham, J. M., and Sritharan, S. [2000], “Cyclic strut & tie modelling of simple rein-forced concrete structures,” Proc. of the 12th World Conference on Earthquake Engineering,Auckland, New Zealand, Paper no. 1249.
To, N. H. T., Ingham, J. M., and Sritharan, S. [2001], Monotonic non-linear analysis of reinforcedconcrete knee joints using strut-and-tie computer models. Bull. Soc. Earthquake Eng., 34(3):169–190.
Dow
nloa
ded
by [
Nan
yang
Tec
hnol
ogic
al U
nive
rsity
] at
01:
33 1
3 A
ugus
t 201
2