Embed Size (px)
Citation preview

Modeling Mine Tailing and Water Dam Failures in Armenia
Alexander Arakelyan, PhD GIS and Hydrology Expert
December 5, 2018

Outline Types of Studied Dams Historical Dam Failure Events Dam Failure Modes and Breach Characteristics Peak Flow Calculation Flood Modeling Basics Popular Dam Break Software Required Data for Dam Break Analysis/Flood Mapping Flood Hazard Index Calculation River Maximum Flow Calculation Dam Breach Maximum Outflow and Breach Hydrograph Calculation for Studied Dams Example of Dam Break Flood Map
Types of Studied Dams Water Reservoir Dams (Geghi)
A water reservoir is an enclosed area for the storage of water to be used at a later date. It can also serve to catch floods to protect valleys downstream of it, to establish an aquatic environment, or to change the properties of the water.
Tailing Storage Facility (TSF) Dams (Geghanoush)
A tailings storage facility (TSF) is a structure made up of one or more dams built for the purposes of storing the uneconomical ore (ground up rock, sand and silt) and water from the milling process.

Water Reservoirs in Armenia • About 80 Water Reservoirs
• Total Volume: ~988 Million m3
• Largest Reservoir: Akhuryan, 525 Million m3
• Purposes: Irrigation Energetics Flow regulation Fish-farming Recreational

Tailing Storage Facilities in Armenia
23 TSFs (15 operational, 8 closed)
9 TSFs in Syunik Province
Largest TSF: Artsvanik, 212 Million m3/288ha
Owner: Zangezur Copper-Molybdenum Combine
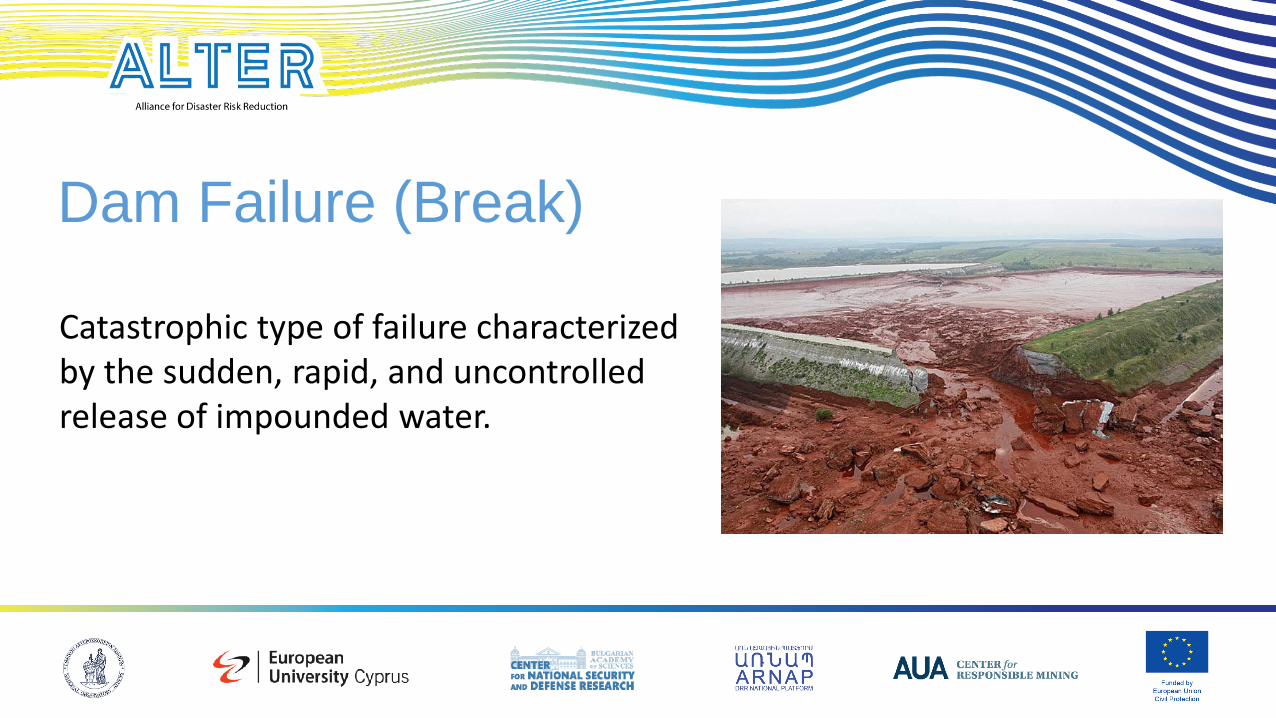
Dam Failure (Break)
Catastrophic type of failure characterized by the sudden, rapid, and uncontrolled release of impounded water.
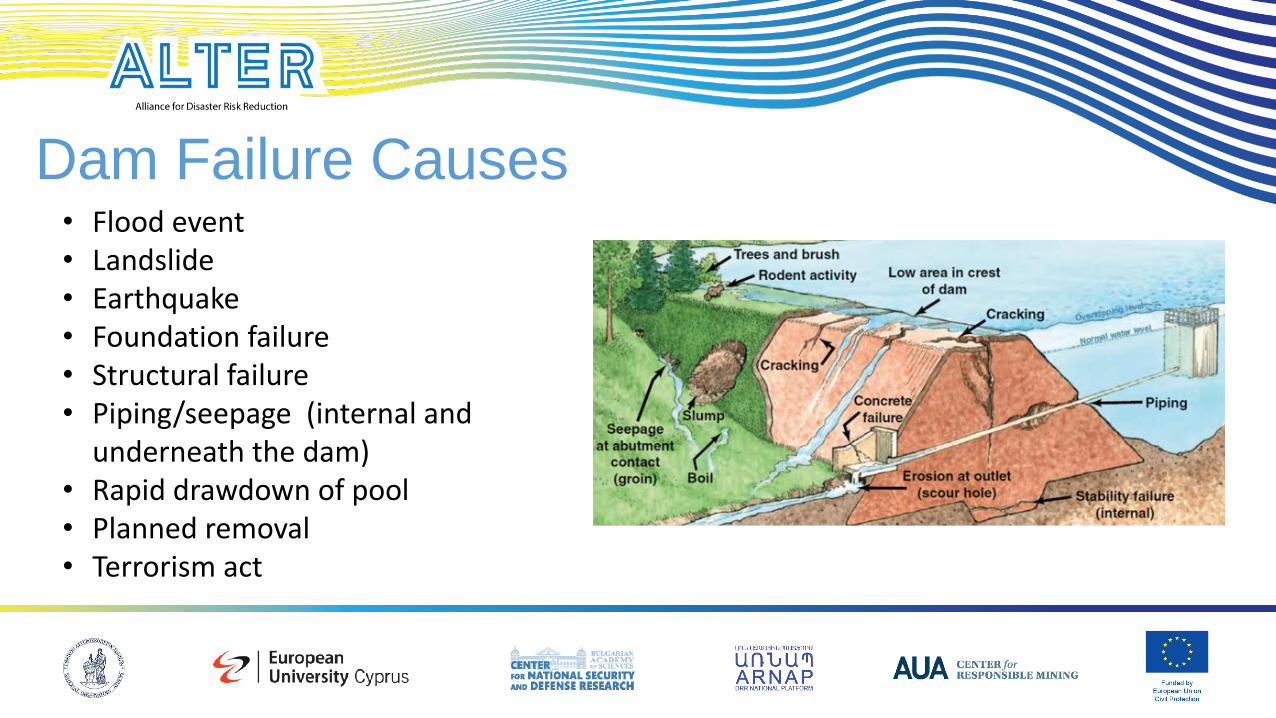
Dam Failure Causes • Flood event • Landslide • Earthquake • Foundation failure • Structural failure • Piping/seepage (internal and
underneath the dam) • Rapid drawdown of pool • Planned removal • Terrorism act
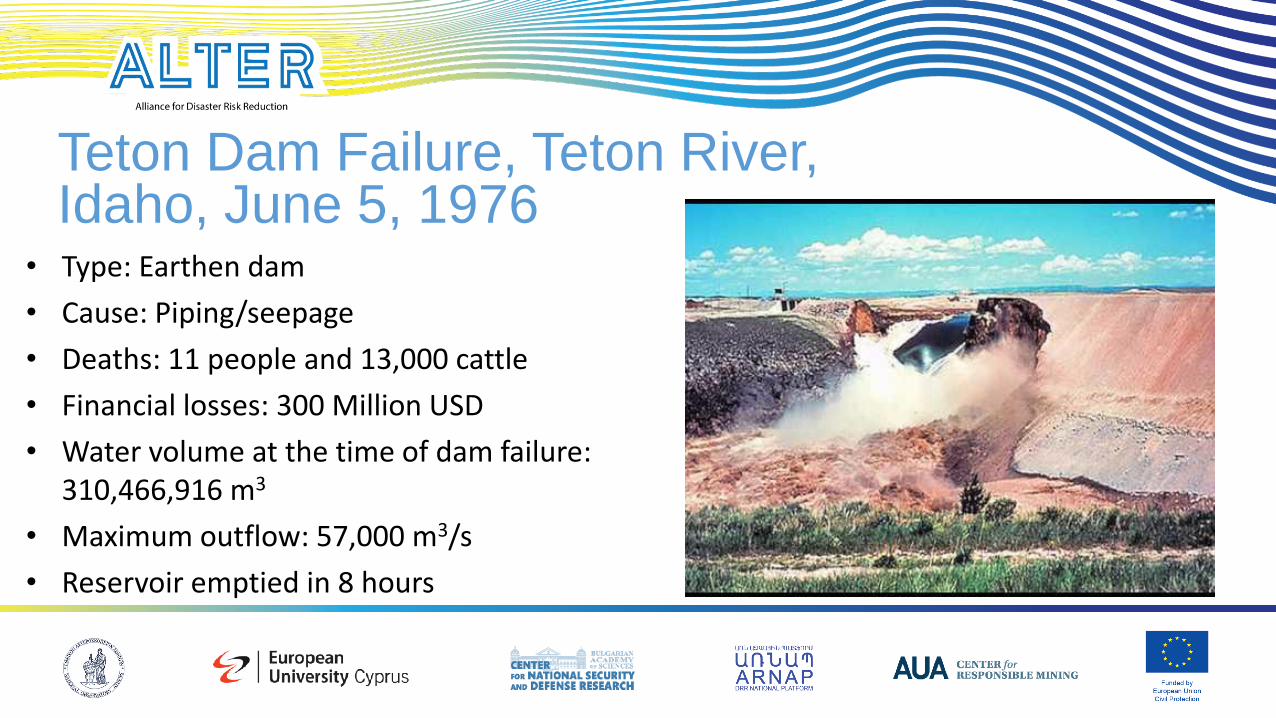
Teton Dam Failure, Teton River, Idaho, June 5, 1976
• Type: Earthen dam
• Cause: Piping/seepage
• Deaths: 11 people and 13,000 cattle
• Financial losses: 300 Million USD
• Water volume at the time of dam failure: 310,466,916 m3
• Maximum outflow: 57,000 m3/s
• Reservoir emptied in 8 hours
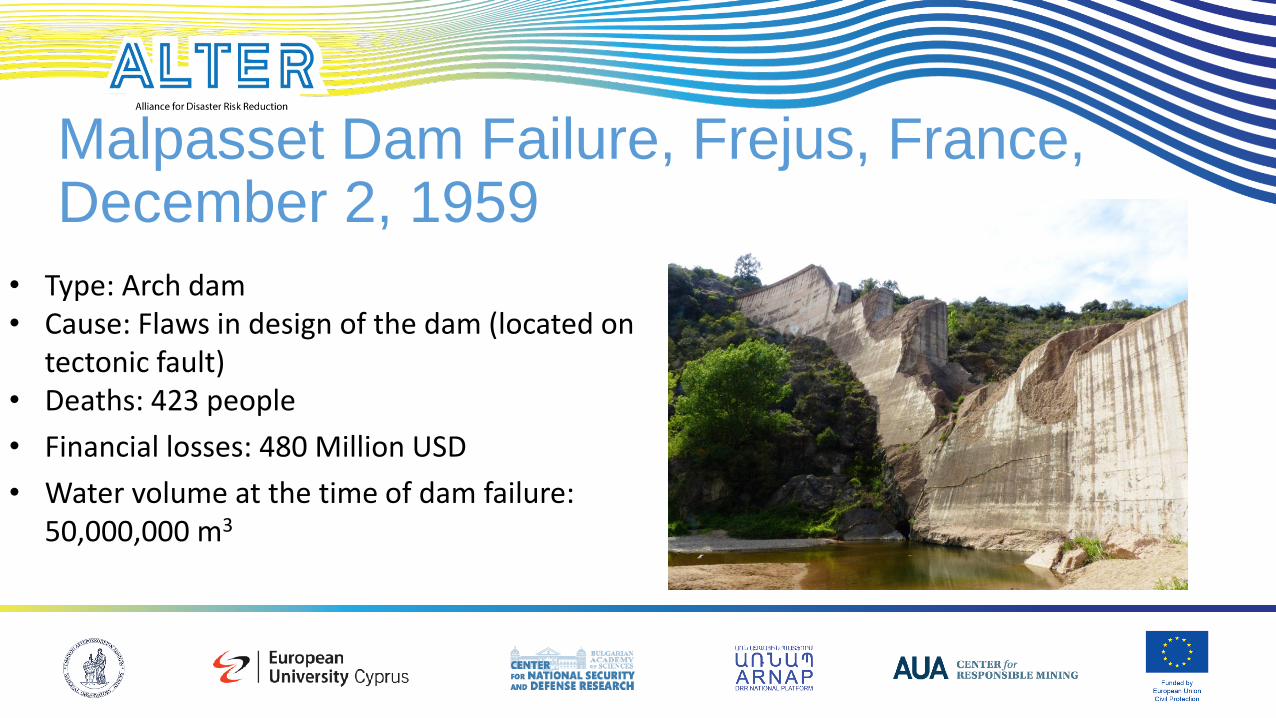
Malpasset Dam Failure, Frejus, France, December 2, 1959
• Type: Arch dam • Cause: Flaws in design of the dam (located on
tectonic fault) • Deaths: 423 people
• Financial losses: 480 Million USD
• Water volume at the time of dam failure: 50,000,000 m3

Fundão TSF Dam Failure, Mariana, Minas Gerais, Brazil, November 5, 2015
• Type: Upstream tailings dam • Cause: Flaws in design of the dam • Deaths: 19 people • Financial losses: 5.3 Billion USD
• Released volume of tailings: 43,000,000 m3
(80% of total contained volume)
• Irreversible environmental damage

Ajka TSF Dam Failure, Ajka, Veszprém County, Hungary, October 4, 2010
• Type: Earthen dam • Cause: Flaws in design of the dam • Deaths: 10 people • Financial losses: 642 Million USD
• Released volume of tailings: 700,000 m3
(70% of total contained volume)
• Irreversible environmental damage

Geghi Dam Failure, May 15, 2010
Geghi-Kavchut – 87.5m3/s, Voghji-Kapan – 133m3/s
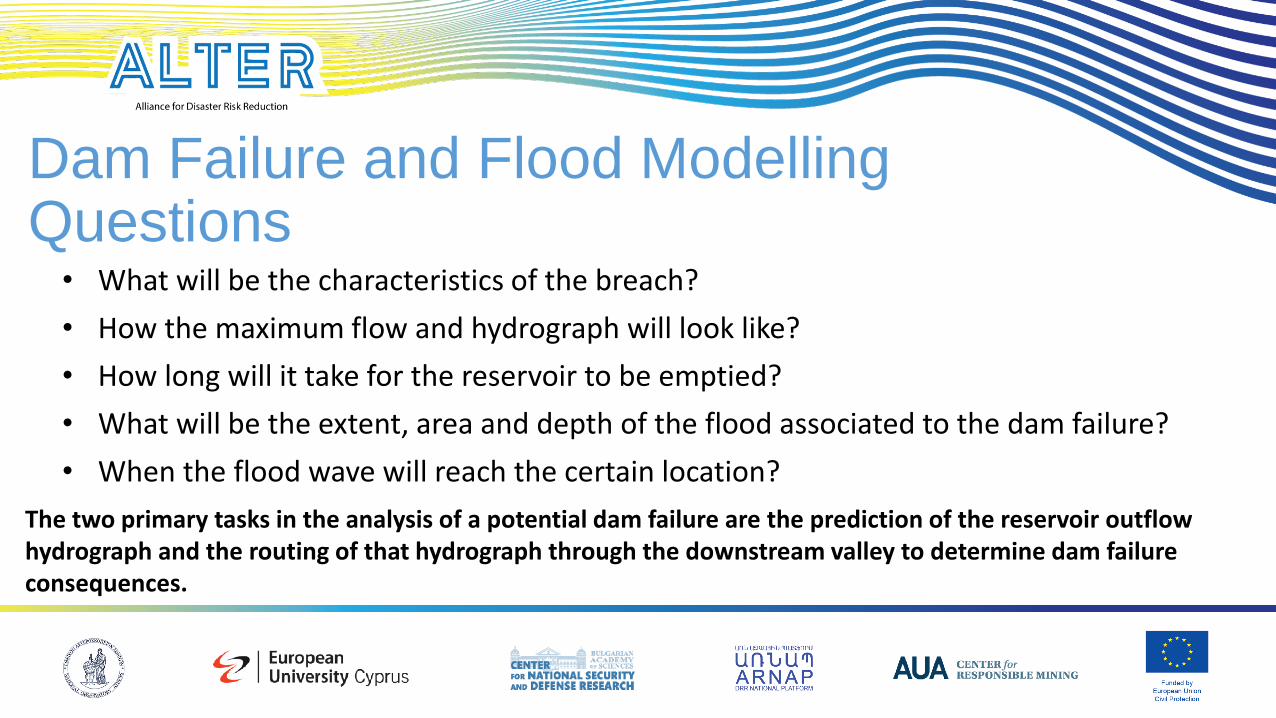
Dam Failure and Flood Modelling Questions • What will be the characteristics of the breach?
• How the maximum flow and hydrograph will look like?
• How long will it take for the reservoir to be emptied?
• What will be the extent, area and depth of the flood associated to the dam failure?
• When the flood wave will reach the certain location?
The two primary tasks in the analysis of a potential dam failure are the prediction of the reservoir outflow hydrograph and the routing of that hydrograph through the downstream valley to determine dam failure consequences.
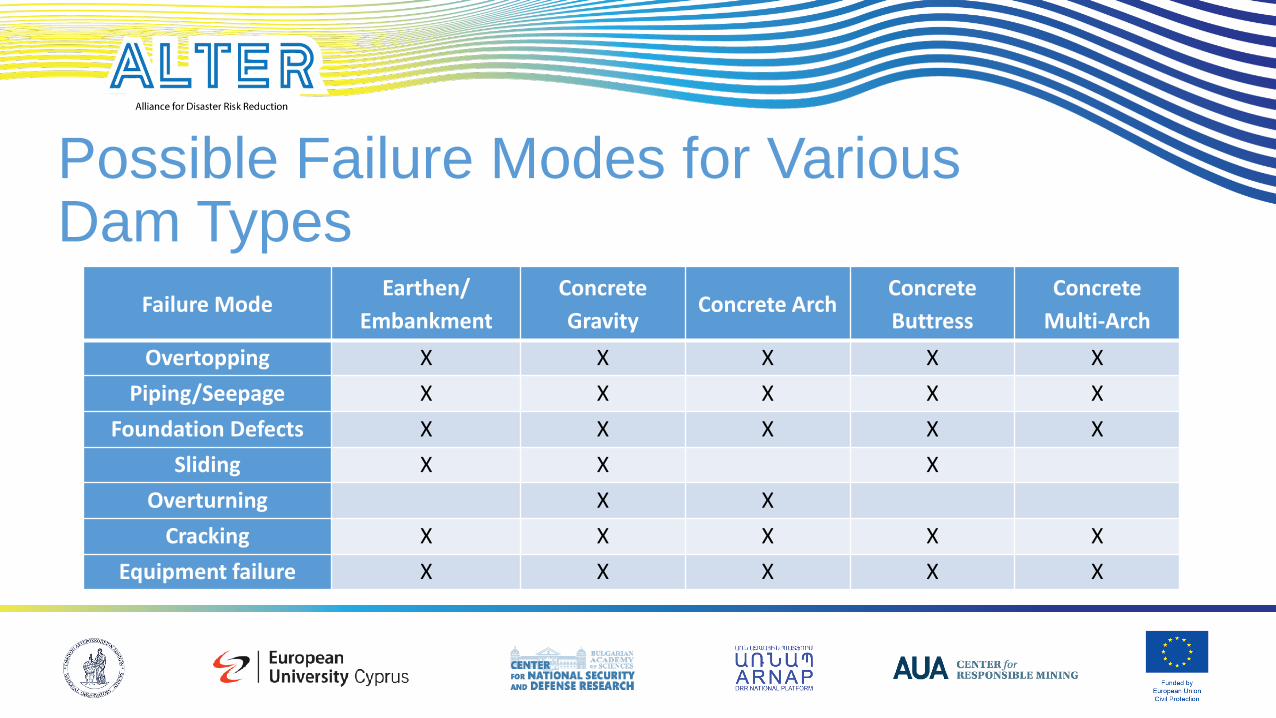
Possible Failure Modes for Various Dam Types
Failure Mode Earthen/
Embankment
Concrete
Gravity Concrete Arch
Concrete
Buttress
Concrete
Multi-Arch
Overtopping X X X X X
Piping/Seepage X X X X X
Foundation Defects X X X X X
Sliding X X X
Overturning X X
Cracking X X X X X
Equipment failure X X X X X
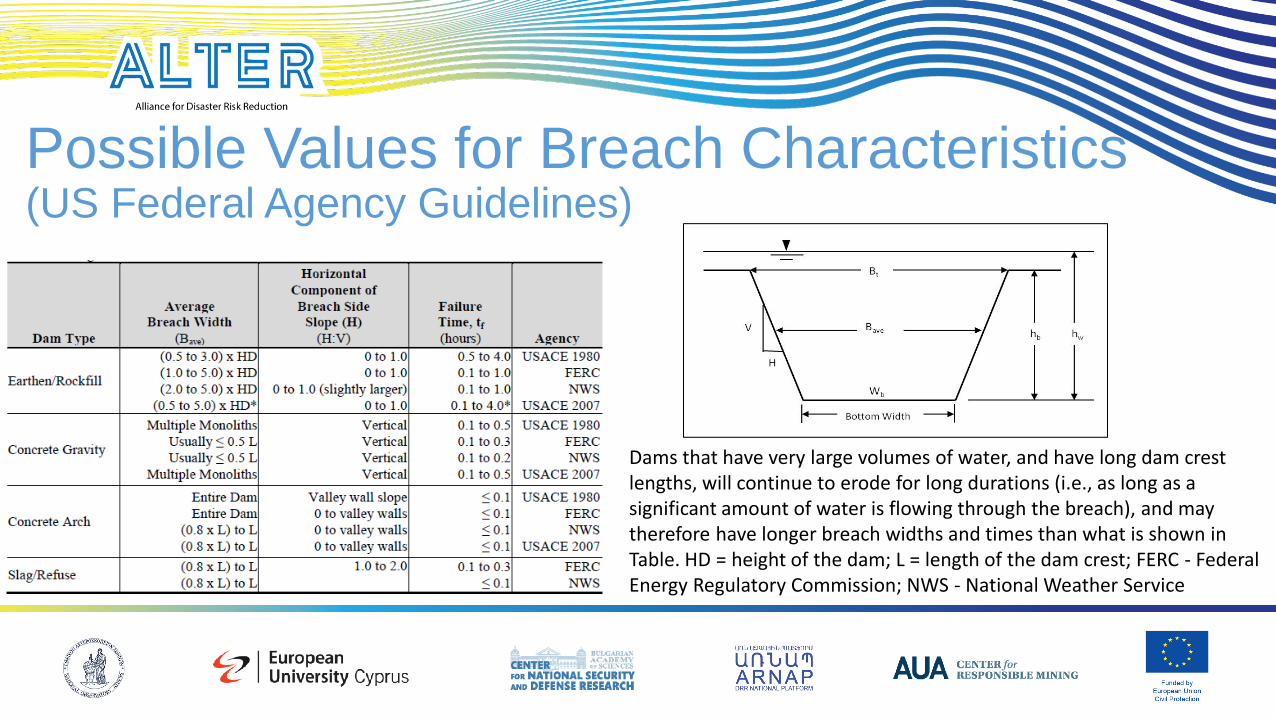
Possible Values for Breach Characteristics (US Federal Agency Guidelines)
Dams that have very large volumes of water, and have long dam crest lengths, will continue to erode for long durations (i.e., as long as a significant amount of water is flowing through the breach), and may therefore have longer breach widths and times than what is shown in Table. HD = height of the dam; L = length of the dam crest; FERC - Federal Energy Regulatory Commission; NWS - National Weather Service

Regression Equations for the Breach Characteristics
• Froehlich (1995a)
• Froehlich (2008)
• MacDonald and Langridge-Monopolis (1984)
• Von Thun and Gillette (1990)
• Xu and Zhang (2009)
𝐵𝑎𝑣𝑒 = 0.1803𝐾0𝑉𝑤0.32ℎ𝑏
0.19 𝑡𝑓 = 0.00254𝑉𝑤0.53ℎ𝑏
−0.90
𝐵𝑎𝑣𝑒 = 0.27𝐾0𝑉𝑤0.32ℎ𝑏
0.04 𝑡𝑓 = 63.2√𝑉𝑤
𝑔ℎ𝑏2
𝑉𝑒𝑟𝑜𝑑𝑒𝑑 = 0.0261 𝑉𝑜𝑢𝑡 × ℎ𝑤0.769 𝑡𝑓 = 0.0179 𝑉𝑒𝑟𝑜𝑑𝑒𝑑
0.364
𝐵𝑎𝑣𝑒 = 2.5ℎ𝑤 + 𝐶𝑏 𝑡𝑓 = 0.02ℎ𝑤 + 0.25
𝐵𝑎𝑣𝑒
ℎ𝑏= 0.787
ℎ𝑑
ℎ𝑟
0.133𝑉𝑤
1 3
ℎ𝑤
0.652
𝑒𝐵3
Bave = average breach width (meters)
tf = breach formation time
Vw = reservoir volume at time of failure (cubic meters) hb = height of the final breach (meters) hd = height of the Dam (meters) hr = fifteen meters, is considered to be a reference height for distinguishing
large dams from small dams
hw = height of the water above the breach bottom elevation at time of breach (meters)
Veroded = volume of material eroded from the dam embankment (cubic meters)
Vout = volume of water that passes through the breach (cubic meters)
Ko = constant (1.4 for overtopping failures, 1.0 for piping)
Cb = coefficient, which is a function of reservoir size
B3 = coefficient that is a function of dam properties
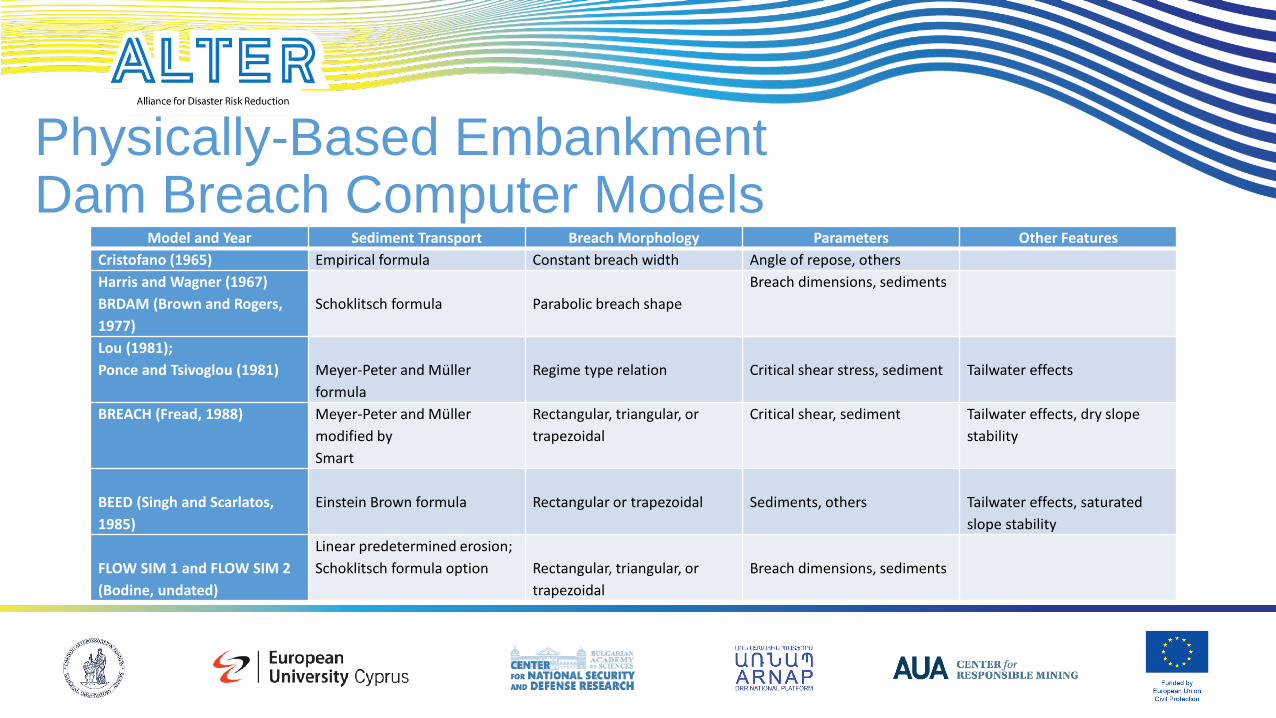
Physically-Based Embankment Dam Breach Computer Models
Model and Year Sediment Transport Breach Morphology Parameters Other Features
Cristofano (1965) Empirical formula Constant breach width Angle of repose, others
Harris and Wagner (1967)
BRDAM (Brown and Rogers,
1977)
Schoklitsch formula
Parabolic breach shape
Breach dimensions, sediments
Lou (1981);
Ponce and Tsivoglou (1981)
Meyer-Peter and Müller
formula
Regime type relation
Critical shear stress, sediment
Tailwater effects
BREACH (Fread, 1988) Meyer-Peter and Müller
modified by
Smart
Rectangular, triangular, or
trapezoidal
Critical shear, sediment Tailwater effects, dry slope
stability
BEED (Singh and Scarlatos,
1985)
Einstein Brown formula
Rectangular or trapezoidal
Sediments, others
Tailwater effects, saturated
slope stability
FLOW SIM 1 and FLOW SIM 2
(Bodine, undated)
Linear predetermined erosion;
Schoklitsch formula option
Rectangular, triangular, or
trapezoidal
Breach dimensions, sediments

Peak Flow Calculation • USBR (1982): 𝑄 = 19.1 ℎ𝑤
1.85 • MacDonald and Langridge-Monopolis (1984): 𝑄 = 3.85 𝑉𝑤ℎ𝑤
0.411
• Froehlich (1995b): 𝑄 = 0.607𝑉𝑤0.295ℎ𝑤
1.24
• Xu and Zhang (2009): 𝑄
𝑔𝑉𝑤5/3
= 0.175𝑑
𝑟
0.199 𝑉𝑤1/3
𝑤
−1.274
𝑒𝐵4
• Kirkpatrick (1977): 𝑄 = 1.268 ℎ𝑤 + 0.3 1.24 • Soil Conservation Service (SCS,1981): 𝑄 = 16.6 ℎ𝑤
1.85 • Hagen (1982): 𝑄 = 0.54 ℎ𝑑
0.5 • Singh & Snorrason (1984): 𝑄 = 13.4 ℎ𝑑
1.89; 𝑄 = 1.776 𝑆 0.47 • Costa (1985): 𝑄 = 2.634 𝑆 ℎ𝑑
0.44 • Evans (1986): 𝑄 = 0.72 𝑉𝑤
0.53
Q = peak breach outflow (cubic meters per second)
hw = depth of water above the breach invert at time of
breach (meters)
Vw = volume of water above breach invert at time of
failure (cubic meters)
S = reservoir storage for water
surface elevation at breach time
(cubic meters)
hd = height of dam (meters)
hr = fifteen meters, which is considered to be a
reference height for distinguishing large dams
from small dams
B4 = b3+b4+b5 coefficients that are a function of dam
properties
b3 = -0.503, -0.591, and -0.649 for dams
with corewalls, concrete faced dams,
and homogeneous/zoned-fill dams,
respectively
b4 = -0.705 and -1.039 for overtopping and
seepage/piping, respectively
b5 = -0.007, -0.375, and -1.362 for high, medium, and low
dam erodibility, respectively.
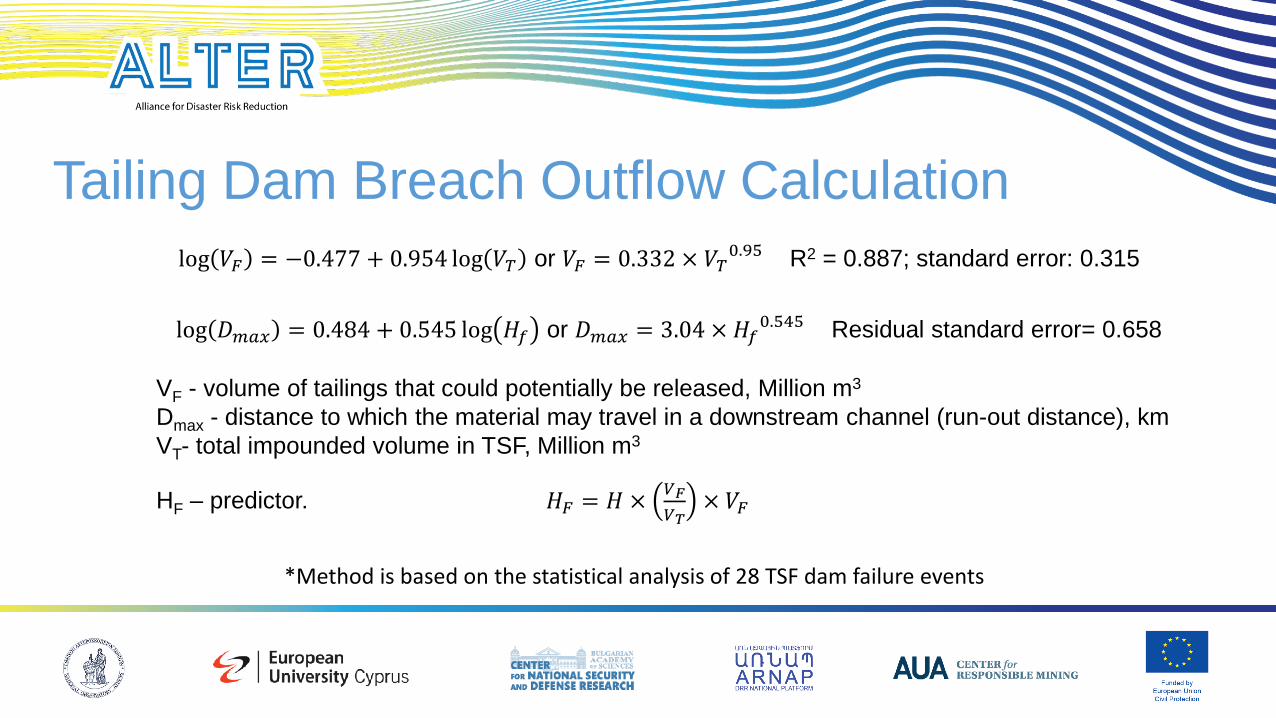
Tailing Dam Breach Outflow Calculation
log 𝑉𝐹 = −0.477 + 0.954 log 𝑉𝑇 or 𝑉𝐹 = 0.332 × 𝑉𝑇0.95 R2 = 0.887; standard error: 0.315
log 𝐷𝑚𝑎𝑥 = 0.484 + 0.545 log 𝐻𝑓 or 𝐷𝑚𝑎𝑥 = 3.04 × 𝐻𝑓0.545 Residual standard error= 0.658
VF - volume of tailings that could potentially be released, Million m3
Dmax - distance to which the material may travel in a downstream channel (run-out distance), km
VT- total impounded volume in TSF, Million m3
HF – predictor. 𝐻𝐹 = 𝐻 ×𝑉𝐹
𝑉𝑇× 𝑉𝐹
*Method is based on the statistical analysis of 28 TSF dam failure events

Fluid Dynamics: Steady and Unsteady Flow • Steady flow means the fluid
characteristics* at any point in the flow field does not change with respect to time.
• If the fluid characteristics at a point change over time, then the flow is unsteady.
𝜕𝑃
𝜕𝑇≠ 0,
𝜕𝑉
𝜕𝑇≠ 0,
𝜕𝜌
𝜕𝑇≠ 0
𝜕𝑃
𝜕𝑇= 0,
𝜕𝑉
𝜕𝑇= 0,
𝜕𝜌
𝜕𝑇= 0
*Fluid characteristics: pressure; velocity; density

1D and 2D Flood Modeling
One-dimensional Two-dimensional
Flow velocity perpendicular to the cross section considers
Speed in different directions are considered
Ability to model the flow is permanent and non-permanent
Ability to model the flow is turbulent
Only the channel cross sections are defined
Model in computational mesh is divided into small pieces
Average speed in cross-section considers
Flow rate can vary

Manning Equation and N Values • Roughness coefficients represent the resistance to flow in channels and floodplains.
• Roughness is usually presented in the form of a Manning's n value in dam break software.
• The actual selection of n values to be used for each dam assessment will require judgment by the engineer responsible for
hydraulic model development.
• Significant turbulence, sediment load and debris should be expected for the immediate reach downstream of a failed dam.
• Manning's roughness coefficient of the main channel (compiled by Dr. Jarret c using ross sectional shape,
flow rates, and water surface elevations at 21 locations for a total of 75 events:
n = 0.39 S0.38 R-0.16
where:
n = Manning's roughness coefficient of the main channel
S = energy slope (slope of the energy grade line, feet/feet)
R = hydraulic radius of the main channel (feet).

Comparison of Dam Break Software (1) Software Developer Dimension Fluid Dynamics Model Input Model Output Price, USD
BOSS-DAMBRK (FLDWAV) BOSS International
(now part of Autodesk) 1D Unsteady State
Typical breach parameters or
hydrograph;
Cross-section data;
Bridge/culvert geometry or rating
curves
High water profiles;
Flood arrival times;
Hydrographs at selected locations
1495
DSS-WISE = “The
Decision Support System
for
Water Infrastructural
Security”
Funded by DHS,
developed by the
NCCHE at Ole
Miss
2D Steady/unsteady
state
Typical breach parameters (for
partial breach
scenario);
Automatically utilizes NED, NBI,
NID, & NLCD
Inundation area;
Arrival time shapefile; Max Depth
shapefile;
Summary report
Freeware
HEC-RAS 1D
US
Army Corps of
Engineers
1D Steady/unsteady
state
Cross section geometry, reach
lengths,
Mannings n
Discharge: peak flow (steady-state),
hydrograph (unsteady-state)
Breach parameters or breach
hydrograph
Water surface elevation average velocity,
and
other variables for each cross section
Depth grids, velocity grids using
RASMAPPER
Freeware
HEC-RAS 1D
US
Army Corps of
Engineers
1D/2D Steady/unsteady
state
Typical HEC-RAS setup, plus
elevation
data to define 2D area
Typical HEC-RAS output (1D);
Gridded Depths; WSELs; Velocities at max
and at time-steps
Freeware
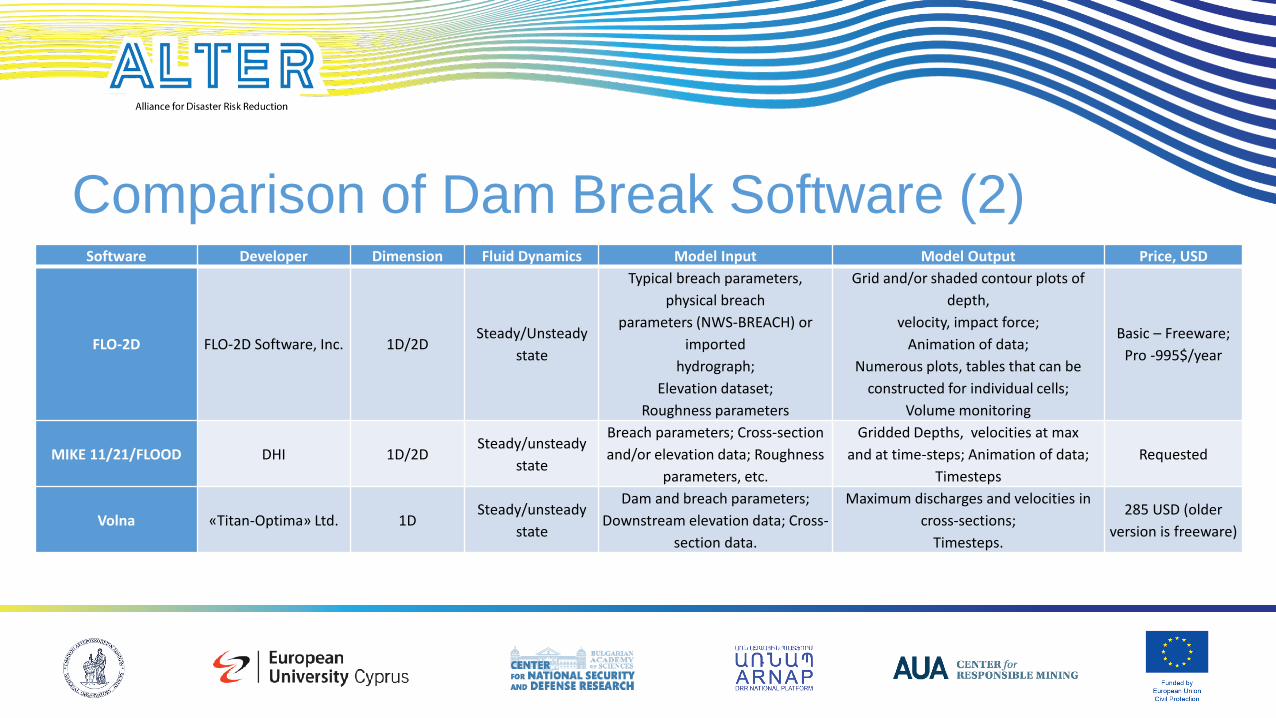
Software Developer Dimension Fluid Dynamics Model Input Model Output Price, USD
FLO-2D FLO-2D Software, Inc. 1D/2D Steady/Unsteady
state
Typical breach parameters,
physical breach
parameters (NWS-BREACH) or
imported
hydrograph;
Elevation dataset;
Roughness parameters
Grid and/or shaded contour plots of
depth,
velocity, impact force;
Animation of data;
Numerous plots, tables that can be
constructed for individual cells;
Volume monitoring
Basic – Freeware;
Pro -995$/year
MIKE 11/21/FLOOD DHI 1D/2D Steady/unsteady
state
Breach parameters; Cross-section
and/or elevation data; Roughness
parameters, etc.
Gridded Depths, velocities at max
and at time-steps; Animation of data;
Timesteps
Requested
Volna «Titan-Optima» Ltd. 1D Steady/unsteady
state
Dam and breach parameters;
Downstream elevation data; Cross-
section data.
Maximum discharges and velocities in
cross-sections;
Timesteps.
285 USD (older
version is freeware)
Comparison of Dam Break Software (2)

Required Data for Dam Break(ch) Analysis and Mapping
• Hydro-Meteorological Observation Data • Digital Elevation Model • Land Use/Land Cover Dataset • Other Spatial Datasets • Hydro-technical Survey Data
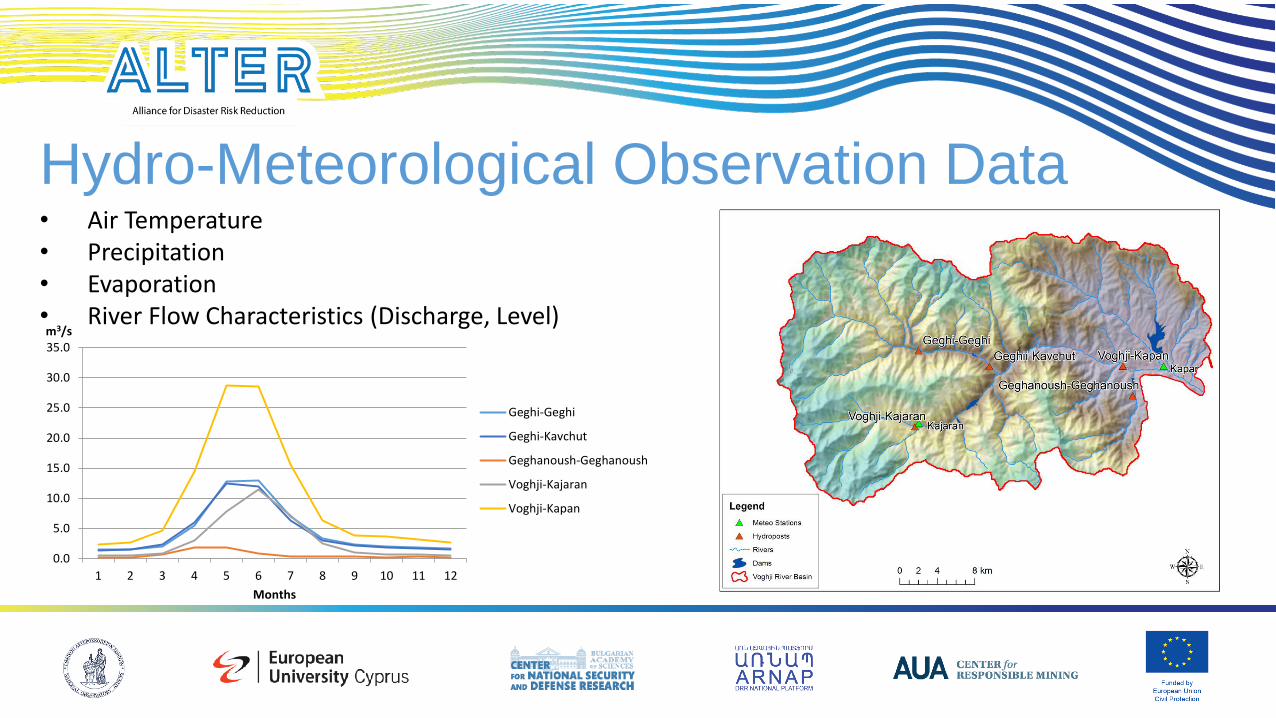
Hydro-Meteorological Observation Data • Air Temperature • Precipitation • Evaporation • River Flow Characteristics (Discharge, Level)
0.0
5.0
10.0
15.0
20.0
25.0
30.0
35.0
1 2 3 4 5 6 7 8 9 10 11 12
m3/s
Months
Geghi-Geghi
Geghi-Kavchut
Geghanoush-Geghanoush
Voghji-Kajaran
Voghji-Kapan
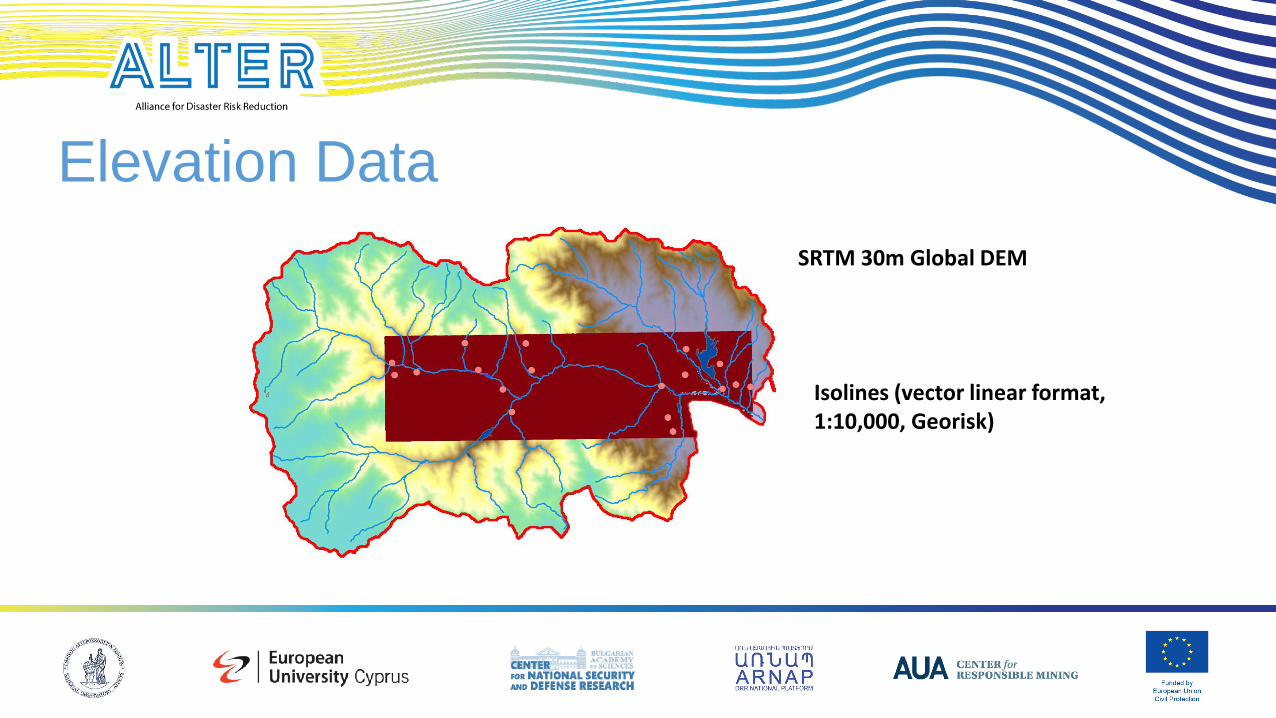
Elevation Data
SRTM 30m Global DEM
Isolines (vector linear format, 1:10,000, Georisk)
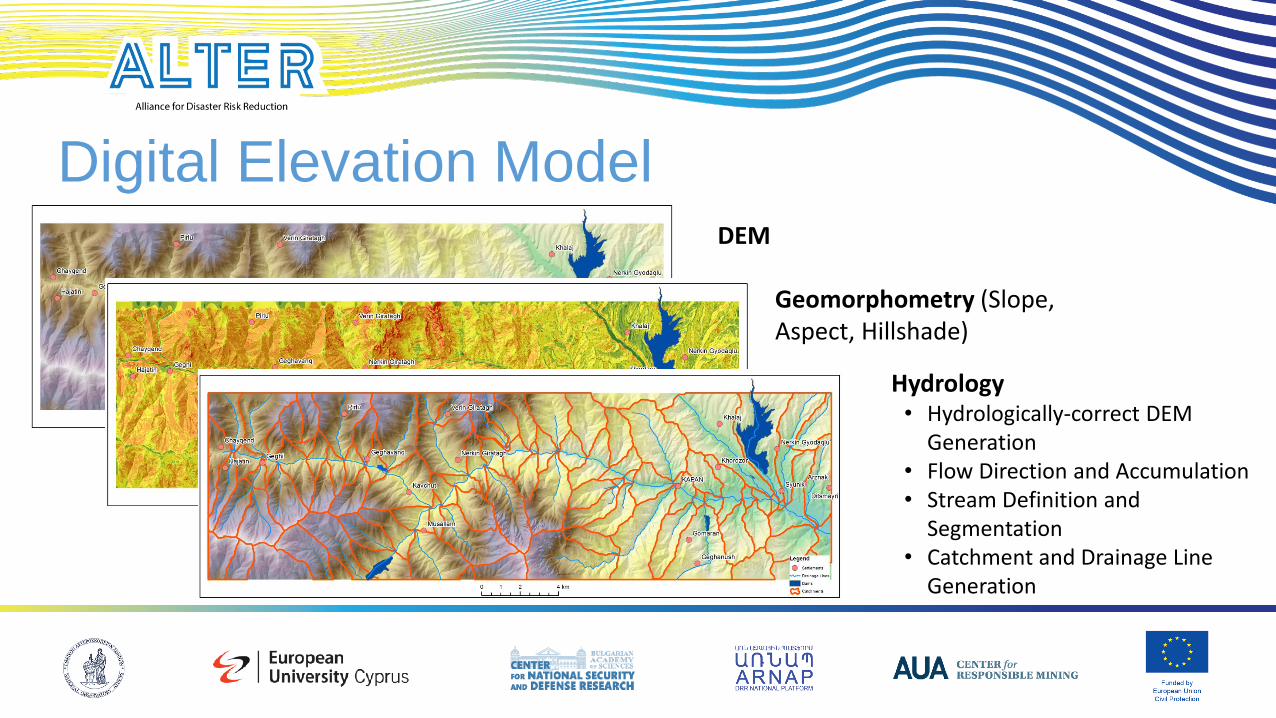
Digital Elevation Model DEM
Geomorphometry (Slope, Aspect, Hillshade)
Hydrology • Hydrologically-correct DEM
Generation • Flow Direction and Accumulation • Stream Definition and
Segmentation • Catchment and Drainage Line
Generation

Satellite Imagery
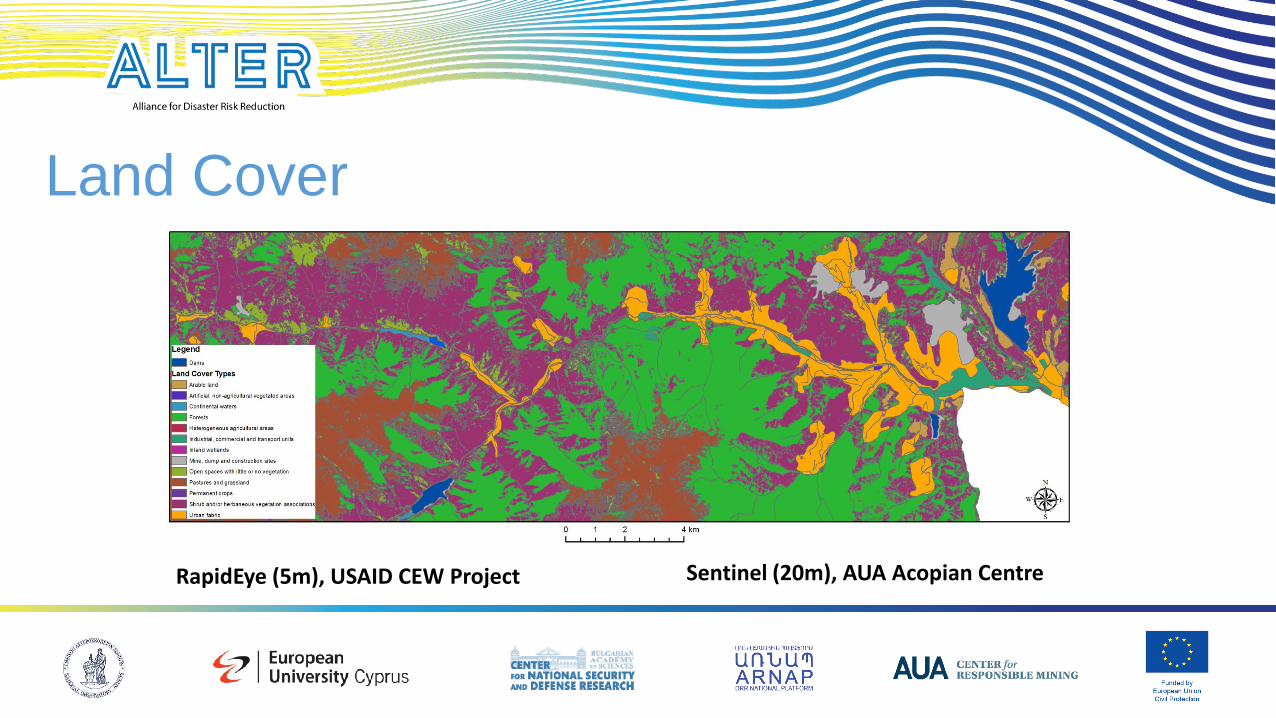
Land Cover
RapidEye (5m), USAID CEW Project Sentinel (20m), AUA Acopian Centre
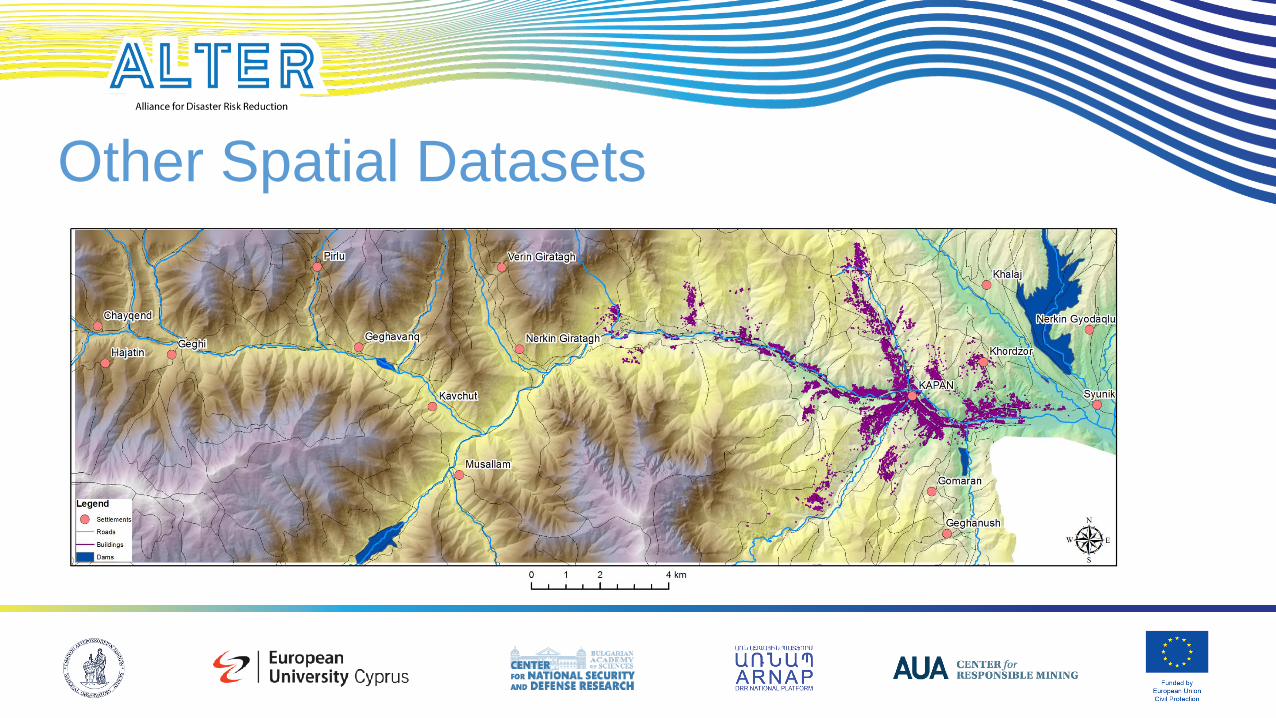
Other Spatial Datasets

Survey Data

Flood Hazard Index Calculation
Flowchart for FHI Assessment Method
(N. Kazakis et al. / Science of the Total
Environment 538 (2015) 555–563)

Classes, Rating and Weights of FHI Assessment Parameters Parameter Class Rating Weight
Flow Accumulation (cells)
0-5000 10
3
5000-20000 8
20000-100000 6
100000-1000000 4
1000000-11000000 2
Distance from Drainage
Network, m
0-25 10
2.1
25-50 8
50-75 6
75-100 4
>100 2
Elevation, m
<1000 10
2.1
1000-1500 8
1500-2000 6
2000-2500 4
>2500 2
Land Cover
Urban; industrial; water objects 10
1.2
Arable land 8
Pastures and grassland; permanent crops 6
Open Spaces with little or no vegetation 4
Forests and shrubs 2
Parameter Class Rating Weight
Rainfall Intensity (MFI)
63-68 6
1 59-63 4
<59 2
Slope (degree)
0-5 10
0.5
5-15 8
15-30 6
30-45 4
>45 2
Geology
Alluvial deposits 10
0.3
Slope deposits 8
Volcanogenic and
volcanogenic-sedimentary
rocks
6
Moraines 4
Eluvial, eluvial-deluvial
deposits in watershed zones 2
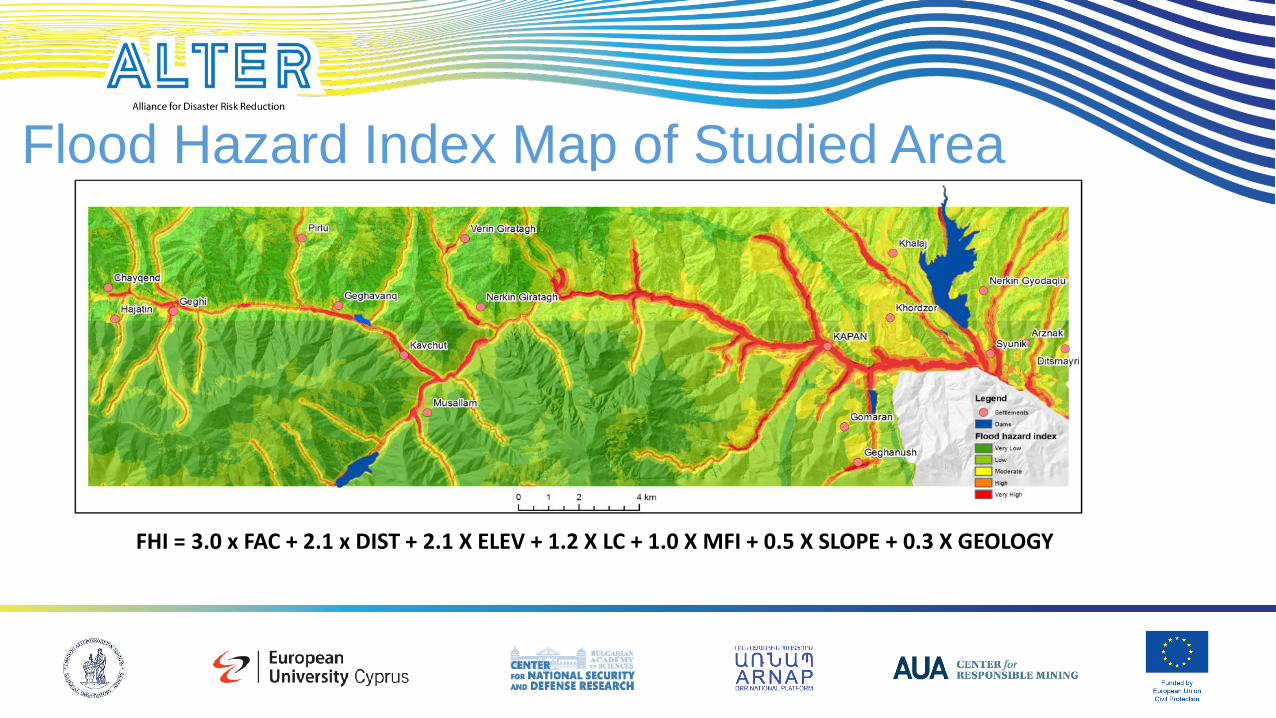
Flood Hazard Index Map of Studied Area
FHI = 3.0 x FAC + 2.1 x DIST + 2.1 X ELEV + 1.2 X LC + 1.0 X MFI + 0.5 X SLOPE + 0.3 X GEOLOGY

River Maximum Flow Calculation
Q0 (time-series average value) = 23.85;
Cv (variation coefficient) = 0.336;
Cs (asymmetry or skewness coefficient) = 0.159;
Cs/Cv = 0.47 P 0.01 0.1 1 2 5 10 25 50 95 99
Φ 4.05 3.31 2.44 2.13 1.68 1.3 0.66 -0.02 -1.6 -2.2
Φ*Cv 1.36 1.11 0.82 0.72 0.56 0.44 0.22 -0.01 -0.54
-
0.75
Kh=1+Φ*Cv 2.36 2.11 1.82 1.72 1.56 1.44 1.22 0.99 0.46 0.25
Qh=Kh*Q0 56.31 50.38 43.40 40.92 37.31 34.27 29.14 23.69 11.03 6.06
N Year Max. m3/s Observation Date Max. m3/s,
descending
Probability,
(m/(n+1))x100
1 1959 21.5 27/05 37.7 2.9
2 1960 33.4 29 - 31.05 37.3 5.7
3 1961 9.00 06,07.05 35.7 8.6
4 1962 13.5 22/05 35.1 11.4
5 1963 30.7 02.06 33.4 14.3
6 … …. … … …
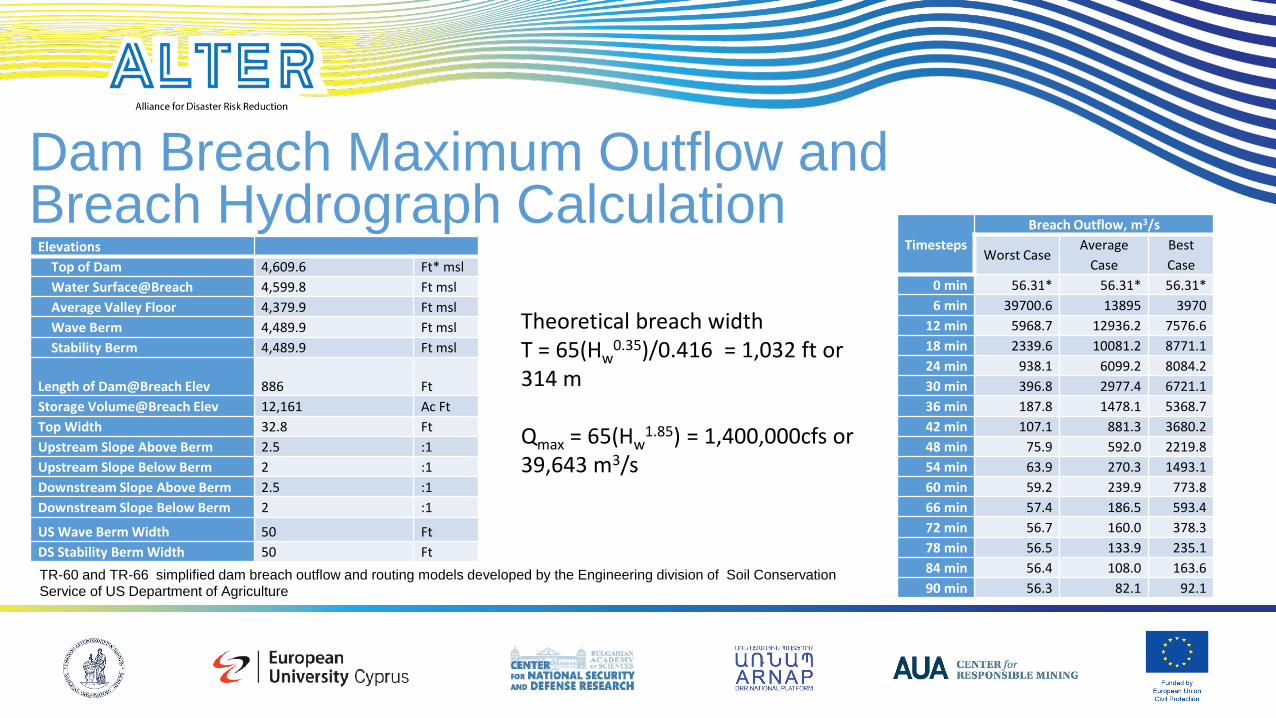
Dam Breach Maximum Outflow and Breach Hydrograph Calculation
Elevations
Top of Dam 4,609.6 Ft* msl
Water Surface@Breach 4,599.8 Ft msl
Average Valley Floor 4,379.9 Ft msl
Wave Berm 4,489.9 Ft msl
Stability Berm 4,489.9 Ft msl
Length of Dam@Breach Elev 886 Ft
Storage Volume@Breach Elev 12,161 Ac Ft
Top Width 32.8 Ft
Upstream Slope Above Berm 2.5 :1
Upstream Slope Below Berm 2 :1
Downstream Slope Above Berm 2.5 :1
Downstream Slope Below Berm 2 :1
US Wave Berm Width 50 Ft
DS Stability Berm Width 50 Ft
Timesteps
Breach Outflow, m3/s
Worst Case Average
Case
Best
Case
0 min 56.31* 56.31* 56.31*
6 min 39700.6 13895 3970
12 min 5968.7 12936.2 7576.6
18 min 2339.6 10081.2 8771.1
24 min 938.1 6099.2 8084.2
30 min 396.8 2977.4 6721.1
36 min 187.8 1478.1 5368.7
42 min 107.1 881.3 3680.2
48 min 75.9 592.0 2219.8
54 min 63.9 270.3 1493.1
60 min 59.2 239.9 773.8
66 min 57.4 186.5 593.4
72 min 56.7 160.0 378.3
78 min 56.5 133.9 235.1
84 min 56.4 108.0 163.6
90 min 56.3 82.1 92.1
Theoretical breach width T = 65(Hw
0.35)/0.416 = 1,032 ft or 314 m Qmax = 65(Hw
1.85) = 1,400,000cfs or 39,643 m3/s
TR-60 and TR-66 simplified dam breach outflow and routing models developed by the Engineering division of Soil Conservation
Service of US Department of Agriculture
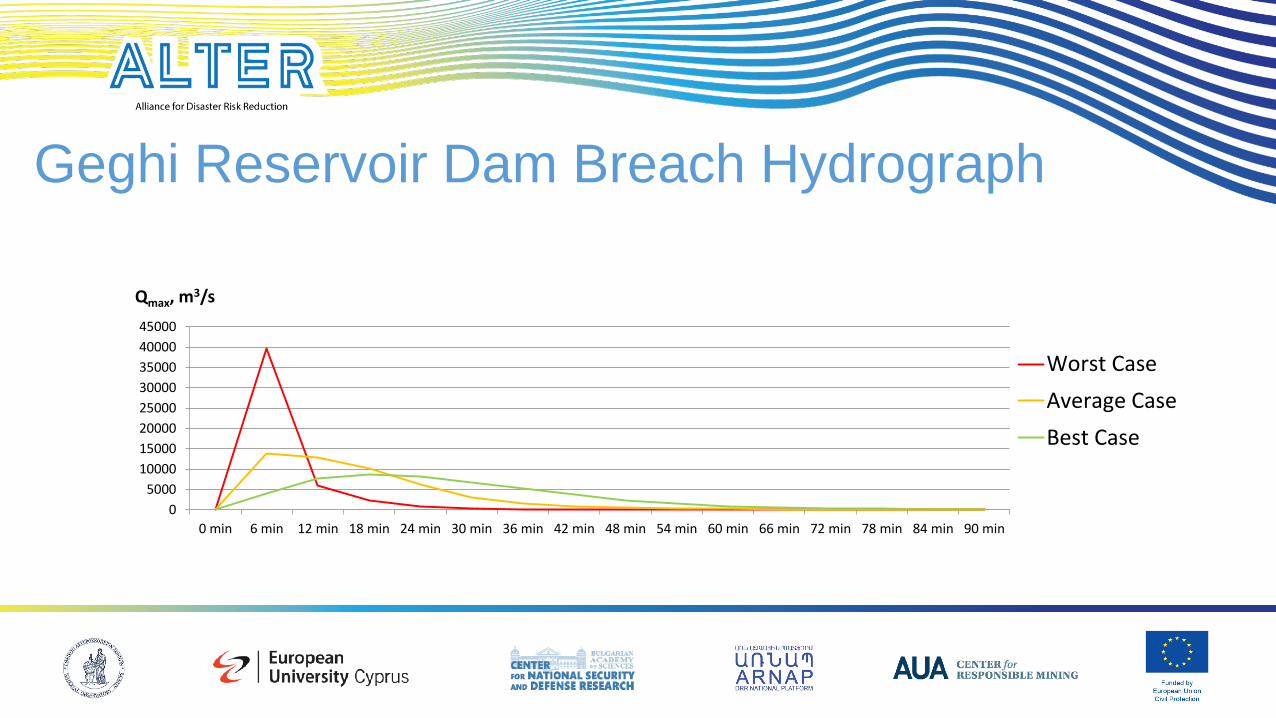
0
5000
10000
15000
20000
25000
30000
35000
40000
45000
0 min 6 min 12 min 18 min 24 min 30 min 36 min 42 min 48 min 54 min 60 min 66 min 72 min 78 min 84 min 90 min
Qmax, m3/s
Worst Case
Average Case
Best Case
Geghi Reservoir Dam Breach Hydrograph
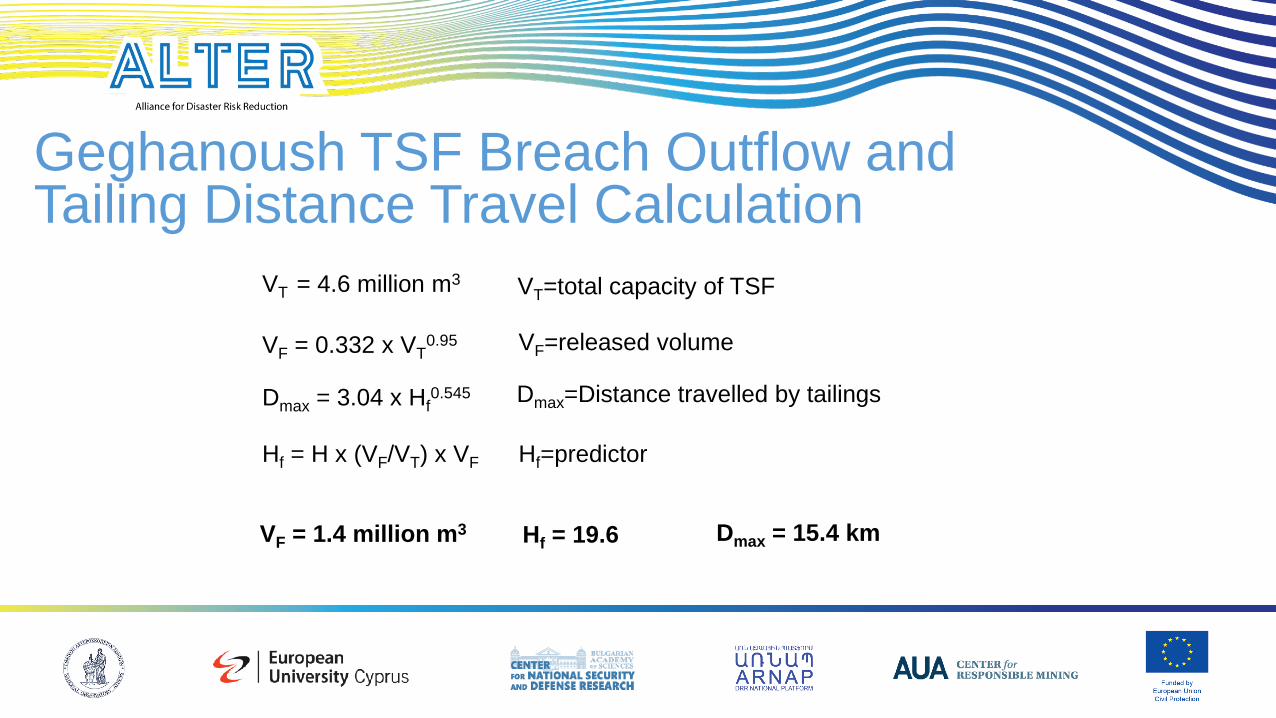
Geghanoush TSF Breach Outflow and Tailing Distance Travel Calculation
VF = 1.4 million m3 Hf = 19.6 Dmax = 15.4 km
VF = 0.332 x VT0.95 VF=released volume
Dmax = 3.04 x Hf0.545 Dmax=Distance travelled by tailings
Hf = H x (VF/VT) x VF Hf=predictor
VT = 4.6 million m3 VT=total capacity of TSF
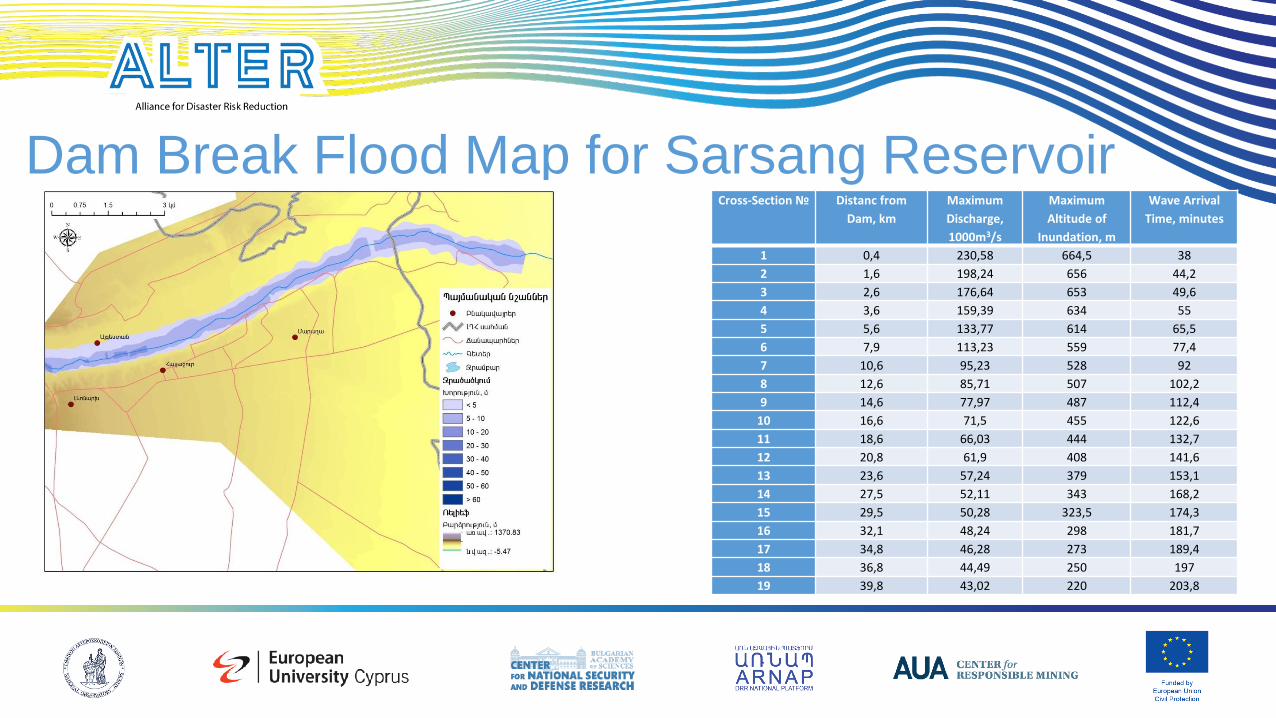
Dam Break Flood Map for Sarsang Reservoir Cross-Section № Distanc from
Dam, km
Maximum
Discharge,
1000m3/s
Maximum
Altitude of
Inundation, m
Wave Arrival
Time, minutes
1 0,4 230,58 664,5 38
2 1,6 198,24 656 44,2
3 2,6 176,64 653 49,6
4 3,6 159,39 634 55
5 5,6 133,77 614 65,5
6 7,9 113,23 559 77,4
7 10,6 95,23 528 92
8 12,6 85,71 507 102,2
9 14,6 77,97 487 112,4
10 16,6 71,5 455 122,6
11 18,6 66,03 444 132,7
12 20,8 61,9 408 141,6
13 23,6 57,24 379 153,1
14 27,5 52,11 343 168,2
15 29,5 50,28 323,5 174,3
16 32,1 48,24 298 181,7
17 34,8 46,28 273 189,4
18 36,8 44,49 250 197
19 39,8 43,02 220 203,8
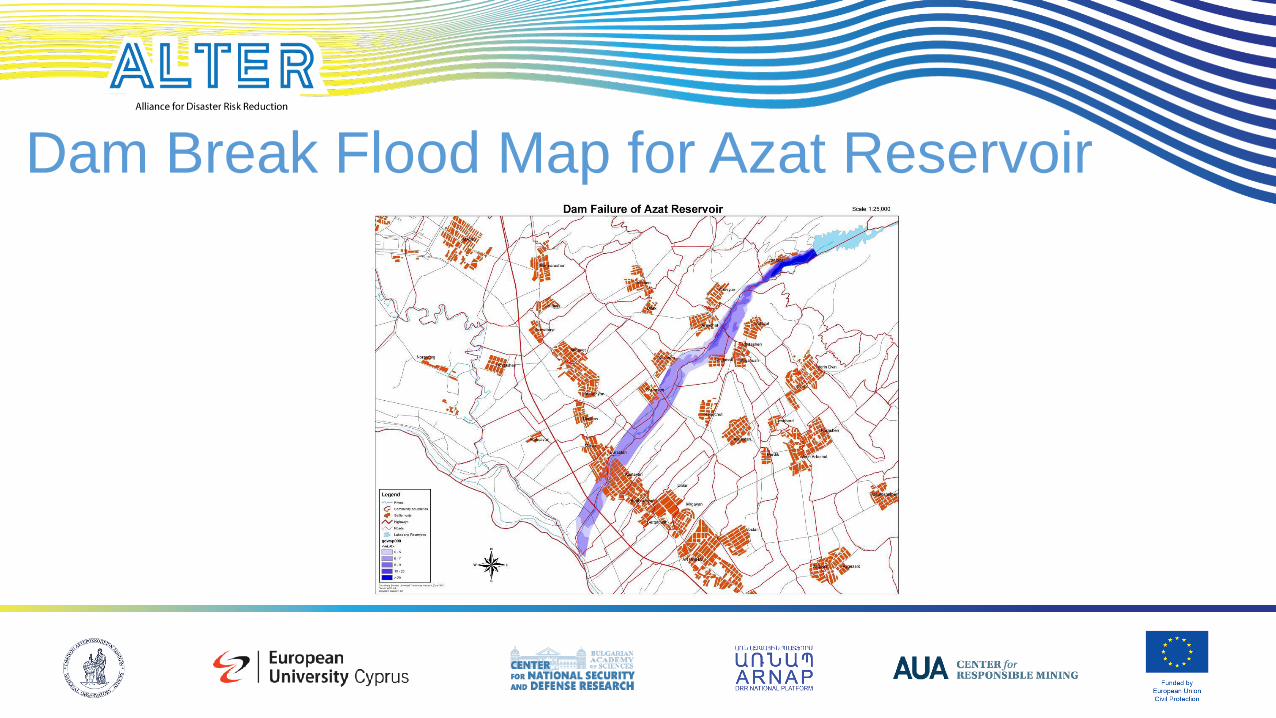
Dam Break Flood Map for Azat Reservoir